Page 1
1
Experimental study of a PEM Reversible Fuel Cell
S. RABIH, O. RALLIERES, C. TURPIN, S. ASTIER University of Toulouse – Laboratory LAPLACE
Site ENSEEIHT - 2, rue Charles CAMICHEL
BP 7122, 31071 Toulouse Cedex 7, France
Tel: 33561588359 Fax: 33561638875
[email protected]
Abstract: A Reversible (or Unitized) Fuel Cell is
an electrochemical component which is able to
operate by conception in two modes: in fuel cell
mode (= production of electricity and heat starting
from hydrogen and oxygen) as well as in
electrolyser mode (production of hydrogen and
oxygen starting from electricity and even from heat
in certain cases).
Firstly, we present the operation principle and
technological elements of a PEM RFC. Secondly,
we study the quasi-steady behaviour of a PEM RFC
through voltage-current curves. Thirdly, the
dynamical behaviour is analyzed.
Keywords: reversible fuel cell, fuel cell mode,
electrolyser mode, quasi static curve, dynamic
behaviour.
1- Introduction
Fuel cells are studied through the world as means of
generating electricity (and heat in certain cases)
because of their high efficiency, quiet operation and
environmental compatibility (if hydrogen is cleanly
produced).
A fuel cell can be combined with a hydrogen
generation device, commonly an electrolyser, to
constitute a system often called “Regenerative Fuel
Cell” (RFC). The confusion can exist with the
Reversible Fuel Cell (RFC), also known as Unitized
Regenerative Fuel Cell (URFC). We are using the
initials URFC to avoid any confusion.
The URFC, object of this paper, is an only device
capable of operating either in fuel cell mode or in
electrolyser mode. The “fuel cell mode” means
production of electricity (and heat) starting from
hydrogen and oxygen; and the “electrolyser mode”
means production of hydrogen and oxygen starting
from electricity even from heat. Let us underline
that the fluidic system around the URFC must
authorize that reversibility, what can lead to more
or less complex solutions. Nevertheless a URFC
should offer reduced weight, volume, cost and
complexity by combining the functions of fuel cell
and electrolyser in the same hardware compared to
a RFC system. A better dynamic response can be
waited too.
Let us recall that, as early as 1839, Sir William
Grove discovered that it might be possible to
generate electricity by reversing the electrolysis of
water [1].
Current developments are achieved for aerospace
and military applications. As an example, the
American company Proton Energy Systems has
been developing URFC technology since 1998. In
[2], the authors modified a, commercial water PEM
electrolyser, having an active area of 0.1ft2, to
operate as a URFC...
This paper presents an experimental work about a
PEM (Proton Exchange Membrane) reversible fuel
cell. The tested PEM URFC is a commercially
available low power cell which operates at
atmospheric pressure. The following steps are
presented in this paper:
- The operation principle of a PEM URFC
system and some technological elements.
- The behaviour of the URFC system in quasi-
steady state.
- The switching between the two modes (fuel
cell ↔ electrolyser) under several shapes of
currents.
2- Operation principle and technological elements of a PEM URFC
2-1 Operation principle In the fuel cell mode, an URFC produces electricity
from hydrogen and oxygen and generates heat and
water as by-products according to the following
reaction like any fuel cell:
heatpower 2
1222 ++→+ electricalOHOH
In the electrolyser mode, an URFC absorbs
electricity from a power source (solar, wind
turbine…), heat from the system environment
and/or from the losses of the system itself, to divide
water into oxygen and hydrogen fuel according the
follow reaction:
2222
1heatpower OHelectricalOH +→++
The total reaction of an URFC system is given
by:
Heatpower 2
1222
mode cell
++ →←+ →electricalOHOH
fuel
The URFC system is drawn schematically in Fig 1.
Let us underline that water here is an energy vector
as well as hydrogen and oxygen: a water tank is
required. The water tank is filled or emptied
according to the operating mode like both gas
https://doi.org/10.24084/repqj06.268 216 RE&PQJ, Vol. 1, No.6, March 2008
Page 2
2
tanks. The only exchanges with the environment of
the URFC system are electrical power and heat.
Such URFC system including the hydrogen, oxygen
and water tanks is equivalent to an electrochemical
battery: electricity can be stored or delivered at any
time.
Fuel Cell
mode
Electrolyser
mode
H2
H2
O2
tank
O2
O2
H2O
tankElecticale power
(Load/source)
Heat (evacuation/supply)
H2
tank
Fuel Cell
mode
Electrolyser
mode
H2
H2
O2
tank
O2
tank
O2
O2
H2O
tankElecticale power
(Load/source)
Heat (evacuation/supply)
H2
tank
H2
tank
Fig. 1: Schematic operation of a reversible fuel cell system
2-2 Technological elements
An elementary PEM URFC consists of two
electrodes (positive and negative) separated by a
solid electrolyte. This electrolyte, typically in
Nafion, is a membrane with a typical thickness of a
few hundreds of micrometers; it must be a good
electronic insulator and a good ionic conductor.
Moreover this electrolyte is able to keep the oxygen
and the hydrogen separated.
The electrode where hydrogen is consumed or
produced is the negative electrode. The other one,
where oxygen is consumed or produced, is the
positive electrode. Most of works [3] deals with the
positive electrode to make it possible the operating
in both modes. Indeed, for example, for a classical
PEM fuel cell, PTFE is added to facilitate the
evacuation of the produced water; this PTFE has a
negative effect in the electrolyser mode. A
compromise has to be found as often.
Platinum is known as the most active catalyst for
the electrochemical reaction at the negative
electrode (hydrogen side) and IrO2 can be used at
the positive electrode (oxygen side). [10]
2H+
H2O
Membrane
H2O
H2 O2
- +N
E
G
A
T
I
V
E
P
O
S
I
T
I
V
E
Electrical power In/Out
−+ ++↔ eHOOH 222
122
222 HeH ↔+ −+
2H+
H2O
Membrane
H2O
H2 O2
- +N
E
G
A
T
I
V
E
P
O
S
I
T
I
V
E
Electrical power In/Out
−+ ++↔ eHOOH 222
122
222 HeH ↔+ −+
Fig. 2: Structure of an elementary PEM URFC
2-3 Experimental set-up
The used experimental set-up (fig. 3) is composed
of the following elements:
• A commercially available elementary
reversible PEM URFC with an activate area
of 16cm2 and a power of 2W in electrolyser
mode and of 0.6W in fuel cell mode.
• A voltage generator which will supply the
required power in electrolyser mode.
Moreover, in both modes, this generator is
required to assure the voltage conditions
necessary for a good operating of the active
load.
• An active load with high dynamic
performances (large band-width) to impose
the current on the URFC. Let us underline
that the current is imposed in both modes,
not the voltage.
• A current shunt to measure the current used
for the regulation of the active load.
• A signal generator which gives the desired
current reference.
• An insulated current sensor (Hall’s effect) to
measure the current flowing through the
URFC.
• An oscilloscope to record the signals
(voltage and current) of the URFC.
• A switching device which enables to change
the direction of the current imposed to URFC
according to the desired mode. Three
positions are possible: stop, fuel cell mode
and electrolyser mode.
Thank to the switching device, we can change
instantaneously the operation mode with the same
imposed current and observe the voltage behaviour
of this elementary URFC.
Electrolyser
modeoff
Fuel Cell
mode
regulator
+ --
voltage generator
Shunt
URFC
+
oscilloscopeIg
VRFC
piloting by current
+
-
Current sensor
active load
Reference current
Electrolyser
modeoff
Fuel Cell
mode
regulator
+ --
voltage generator
Shunt
URFC
+
oscilloscopeIg
VRFC
piloting by current
+
-
Current sensor
active load
Reference current
Fig. 3: Experimental set-up
The fluidic management allowing switching
between both modes will be explained in the final
paper.
3- Behaviour of a PEM URFC in quasi-
steady state
We started by characterizing in quasi-steady state
the URFC in the electrolyser mode. Indeed the fuel
cell mode is not possible without gases. Then we
inverted the current sign to characterize in quasi-
steady state the fuel cell mode. Then we
https://doi.org/10.24084/repqj06.268 217 RE&PQJ, Vol. 1, No.6, March 2008
Page 3
3
characterized in quasi-steady state the URFC by an
up-and-down sweeping of both modes.
The measurement of the URFC voltage is achieved
directly at the terminals of the component, whereas
the current is measured by an isolated current
sensor.
3-1 Voltage-current curve in quasi- steady
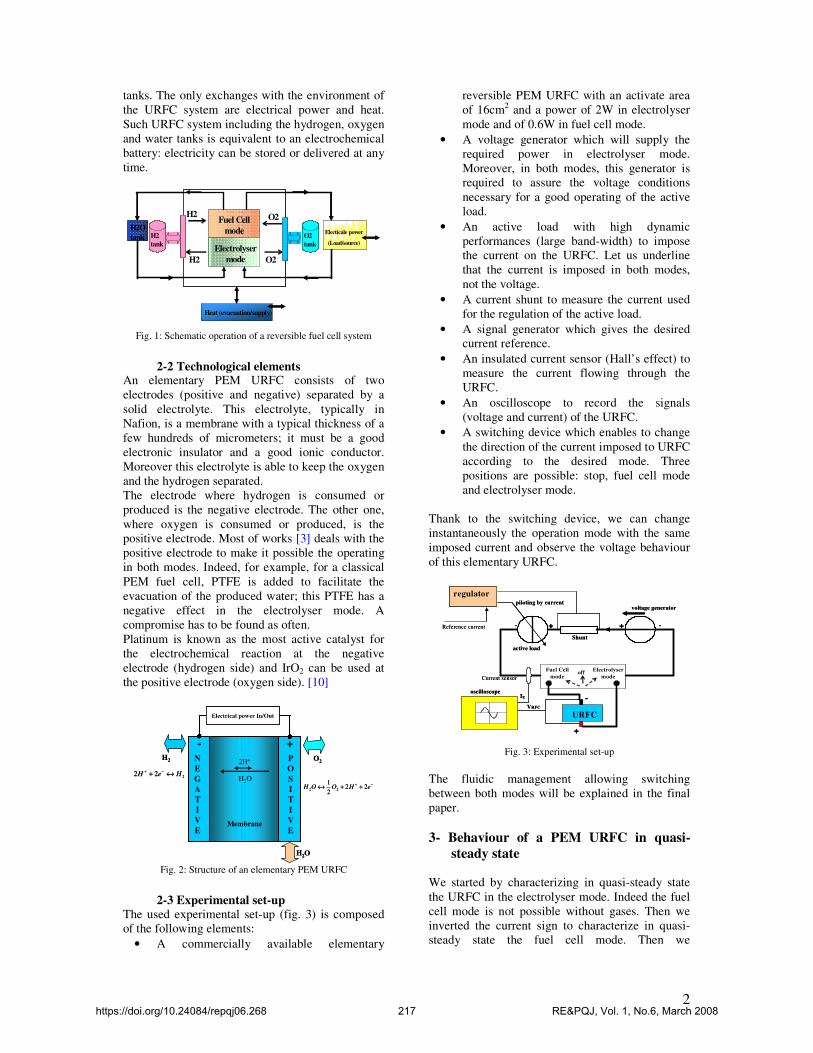
state in the electrolyser mode The measurements were achieved at ambient
temperature (around 20°C) and atmospheric
pressure. During the electrolyser operation, the two produced gases are stored in two separated tanks at
pressures slightly higher than the atmospheric
pressure.
Let us recall that the current was imposed and not
the voltage. For each desired point, a new
corresponding current reference was sent to the
active load. After a non variation of the current
during 30 seconds (stabilization of the current), we
waited 3 minutes (stabilisation of the voltage) and
took the operation point (measurements of voltage
and current). Figure 4 shows the obtained quasi-
static voltage-current curve of a PEM reversible cell
in electrolyser mode (2W).
1,4
1,45
1,5
1,55
1,6
1,65
1,7
1,75
0 200 400 600 800 1000
Current (mA)
cell v
olt
ag
e (
v)
Fig. 4: Voltage-current curve in quasi-steady state, electrolyser
mode
The shape of the obtained curve is typical. The
measured open–circuit voltage at the temperature
20°C and atmospheric pressure is VE ELOCV 42.1_ = .
This quasi-static curve results from the combination
of all the following physicochemical phenomena:
thermodynamic phenomena, activation phenomena,
diffusion phenomena and ohmic losses. The static
curve can be modelled by the following equation:
IRIREU ELdiffELELact
rev
ELcell ____ +++= Ωη
RΩ_EL models the ohmic losses (ionic conduction in
the electrolyte, electronic conduction, and contact
resistance).
=
0
_I
ILn
nF
RTELactη : models the
activation losses due to the kinetic phenomena.
Rdiff_EL models the linear behaviour of diffusion
losses in this current density range.
Erev
is the reversible potential and is theoretically
equal to 1.23V [5].
Let us recall that the electrolysis occurs only when
the cell receives energy equal to the reaction
enthalpy ∆H. Three cases can exist:
• 048.12
=∆⇒=∆
= envcell QVF
HU . There is
no heat exchange with the environment.
All the required energy is supplied by the
voltage generator.
• 02
<∆⇒∆
< envcell QF
HU . The URFC
absorbs heat from the environment (at
maximum T∆S).
• 02
>∆⇒∆
> envcell QF
HU . The system gives
heat to the environment because of the
URFC losses. But the voltage generator
must deliver the energy ∆H and the losses
of the URFC.
The measured open-circuit voltage EOCV is higher
than the theoretical voltage Erev. An explication
could be that we are in the case 2 thanks a parasitic
micro/nano-current. In our tests, the cases 2 and 3
were very probably encountered.
The different parameters of the electrolyser mode
are given in the table2.
αααα_EL Io_EL Rdiff_EL RΩΩΩΩ_EL
0.74 2.51
(mA)
93.4
(mΩ)
96.6
(mΩ)
Table 2: Parameters of the electrolyser mode
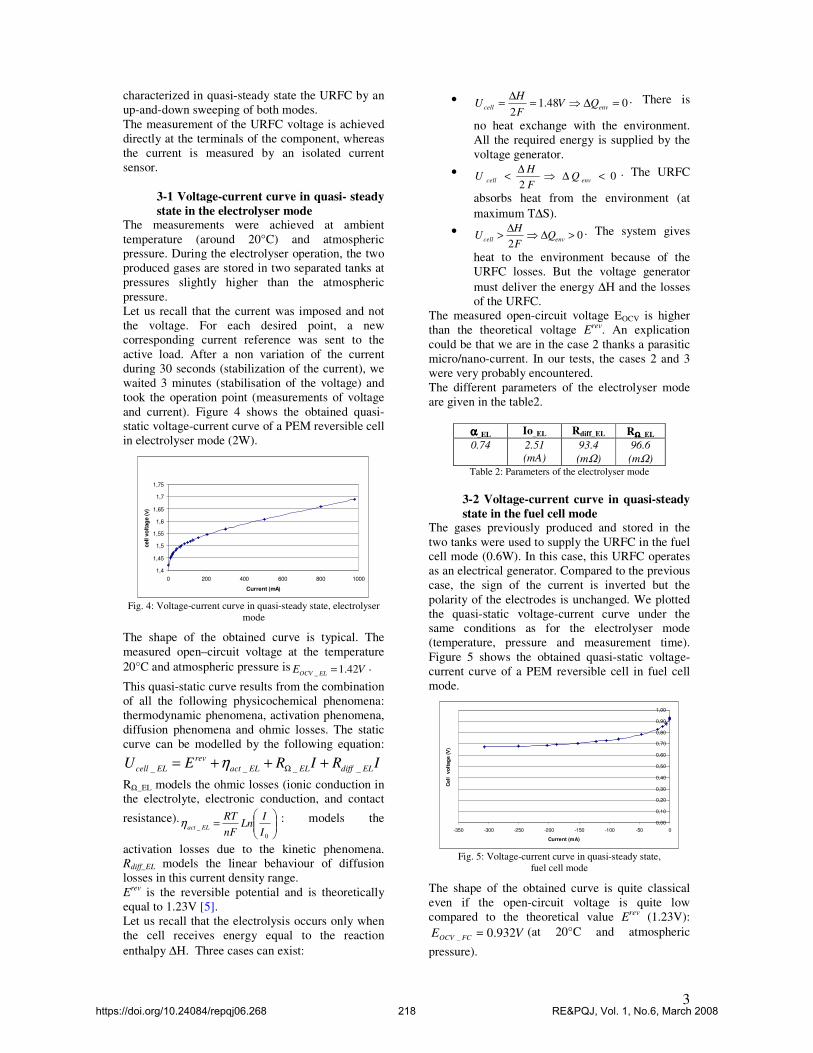
3-2 Voltage-current curve in quasi-steady
state in the fuel cell mode The gases previously produced and stored in the
two tanks were used to supply the URFC in the fuel
cell mode (0.6W). In this case, this URFC operates
as an electrical generator. Compared to the previous
case, the sign of the current is inverted but the
polarity of the electrodes is unchanged. We plotted
the quasi-static voltage-current curve under the
same conditions as for the electrolyser mode
(temperature, pressure and measurement time).
Figure 5 shows the obtained quasi-static voltage-
current curve of a PEM reversible cell in fuel cell
mode.
0,00
0,10
0,20
0,30
0,40
0,50
0,60
0,70
0,80
0,90
1,00
-350 -300 -250 -200 -150 -100 -50 0
Current (mA)
Cell
v
olt
ag
e (
V)
Fig. 5: Voltage-current curve in quasi-steady state,
fuel cell mode
The shape of the obtained curve is quite classical
even if the open-circuit voltage is quite low
compared to the theoretical value Erev
(1.23V):
VE FCOCV 932.0_ = (at 20°C and atmospheric
pressure).
https://doi.org/10.24084/repqj06.268 218 RE&PQJ, Vol. 1, No.6, March 2008
Page 4
4
The physicochemical phenomena are the “same” in
both modes: the “same” in terms of origins, but not
quantitatively particularly for activation and
diffusion losses. We can assume that they are
identical for the ohmic losses. The static curve can
then be modelled by the well-known following
equation:
IRIREU FCdiffFCFCact
rev
FCcell ____ −−−= ΩηThe different parameters of the fuel cell mode are
given in the table 1.
αααα_FC Io_FC Rdiff_FC RΩ_FC
0.702 4.17e-8
(mA)
237.6
(mΩ)
102.3
(mΩ) Table (1): Parameters of the fuel cell mode
3-3 Up-and-down voltage-current curve
in quasi-steady state in both modes In both previous parts 3-1 and 3-2, we plotted the
static curve independently for each operation mode
under the same operating conditions (pressure,
temperature and measurement time).
In this part, our aim is to plot the global static curve
for the URFC for its two operation modes. For that,
we began the measurements in the electrolyser
mode to produce gases. The current was increased
from 0 up to 950mA (“up-scanning”). Then the
current was decreased from 950mA up to -300mA
(“down-scanning”). Finally, the current was
increased from -300mA up to 0 (“up-scanning”).
The figure 6 gives the obtained up-and-down
voltage-current curve. Let us precise that we waited
only 1 minute for the stabilisation of the voltage
(instead of 3 minutes previously).
We can note that, during the electrolyser operation:
• A hysteresis appears between the up and down
points.
• The performances for the “up-scanning” are
better; that means that it requires less energy to
achieve the electrolysis. During the electrolyser
mode, we note an increase of the gas bubbles
with the increase of the imposed current. The
electrolyser needs more energy to evacuate the
gas bubbles (diffusion losses). When the
current density increases, the membrane will be
a priori less hydrated (water consumption); but
the temperature increasing because of the loss
increasing, the ionic conductivity increases
compensating perhaps the previous effect.
These two reasons could explain why the up-
scanning curve is better than the down-
scanning curve.
• The open-circuit voltage at the beginning of the
“up scanning” (1.40V) is lower than the one at
the end of the “down-scanning” (1.435V).
0
0,2
0,4
0,6
0,8
1
1,2
1,4
1,6
1,8
2
-350 -150 50 250 450 650 850
Current (mA)
Cell
vo
ltag
e (
V)
Electrolyser
Fig. 6: Up-and-down voltage-current curve in quasi-steady state
in both modes
On the other hand, during the fuel cell operation,
we can notice that:
• The performances are worse than the in
electrolyser mode. The operation is rather
difficult to stabilize. This is probably due to the
presence in excess of water due to the previous
mode. Indeed, some water accumulated in the
electrode pores and it results in electrode
flooding, which degrades the cell performance
by preventing the reactants from reaching the
catalyst sites [6].
• The fuel cell mode occurs whereas the cell
voltage is above Erev. It is never the case for a
classical fuel cell: the open-circuit voltage is
always below Erev
due to parasitical internal
reactions. An explanation is that the mode
switching instantaneously possible because the
gases are present close to the catalyst site (they
have been just produced!). The operation
conditions of a classical fuel cell are
progressively recovered as fluidic conditions
change. It is confirmed by the behaviour during
the up-scanning: the open-circuit voltage after
the up-scanning is below Erev. • As soon as the classical operation in fuel cell is
recovered, the up-scanning curve is better than
the down-scanning. More energy is produced.
This result is classical for a fuel cell.
4- Behaviour of a PEM URFC vis-à-vis
switchings of operation modes 4-1 Dynamic response in voltage for
switchings of operation modes Our aim was to observe the effect of quasi-
instantaneous switchings between both operation
modes on the URFC.
For that, we fixed the current at a certain value I0
for the two operation modes (electrolyser mode:
+I0, fuel cell mode: -I0). We inverted the
current sign manually thanks to our switching
device. The switching time from one mode to the
other one was here negligible. The switchings were
forced every 40 seconds.
In order to observe the time evolution of the
different quantities, we connected an oscilloscope
to observe the cell voltage according to the sign of
the forced cell current. Figure 7 shows the obtained
https://doi.org/10.24084/repqj06.268 219 RE&PQJ, Vol. 1, No.6, March 2008
Page 5
5
results for currents of ±200mA and currents of
±400mA. These values are naturally compatible
with the current capabilities for both modes; the
limitations being imposed by the fuel cell mode.
In Figure 7, it can be clearly observed that, each
time a switching occurs, an instantaneous voltage
drop (a few hundreds of mV) occurs. It is due to the
ohmic phenomena (mainly the electrolyte
resistance) which react instantaneously to a current
step.
After that instantaneous voltage variation, an
“elbow” appears and is followed more or less
rapidly by a linear variation of the cell voltage. If
we make a zoom on this “elbow”, it looks like a
first-order response (exponential). For the authors,
that corresponds to the charge (fuel cell mode ⇒
electrolyser mode) or the discharge (electrolyser
mode ⇒ fuel cell mode) of the equivalent capacitor
due to the double layer phenomena. This equivalent
double layer capacitor makes it possible the
instantaneous reversibility in current because of
their electrostatic origin.
The linear variation of the cell voltage following
the “elbow” has very probably a fluidic origin.
Indeed, the fluidic phenomena can have a
capacitive behaviour as demonstrated in [9] and
observed in [8]. The charge (fuel cell mode ⇒
electrolyser mode) and the discharge (electrolyser
mode ⇒ fuel cell mode) of this equivalent fluidic
capacitor are an image of the switching of the
fluidic behaviour due to the operation mode
switching. This charge and discharge lasts several
seconds to tens of seconds, leading to values of
equivalent capacitances reaching several farads
even more than ten farads. These values make it
possible to reject, for the authors, the possibility of
confusion between fluidic phenomena and double
layer phenomena with regard to the cell area of
16cm²; the equivalent double layer capacitance can
be to a maximum of a few hundreds of millifarads.
0,4
0,6
0,8
1
1,2
1,4
1,6
1,8
-50 -40 -30 -20 -10 0 10 20 30 40 50
Time (sec)
cell
vo
ltag
e (
V)
Cell voltage 400 (mA) Cell voltage200 (mA)
-400
-300
-200
-100
0
100
200
300
400
-50 -40 -30 -20 -10 0 10 20 30 40 50
Time (sec )
I (m
A)
I =400 (mA) I =200 (mA)
0,4
0,6
0,8
1
1,2
1,4
1,6
1,8
-50 -40 -30 -20 -10 0 10 20 30 40 50
Time (sec)
cell
vo
ltag
e (
V)
Cell voltage 400 (mA) Cell voltage200 (mA)
-400
-300
-200
-100
0
100
200
300
400
-50 -40 -30 -20 -10 0 10 20 30 40 50
Time (sec )
I (m
A)
I =400 (mA) I =200 (mA)
Fig. 7: Time evolution for switchings of operation mode every
40seconds for I=200mA and I=400mA
The following table shows the comparison of data
for the different operation switchings for two values
of current 200mA and 400mA.
Applied current (mA) 200 400 Duration of transient state
electrolyser mode ⇒ fuel cell mode
(seconds)
25.5 6.5
Duration of transient state
fuel cell mode ⇒ electrolyser mode
(seconds)
28 8.5
Duration of stabilized mode after the
switching electrolyser mode ⇒ fuel cell
mode (seconds)
14.5 33.5
Duration of stabilized mode after the
switching fuel cell mode ⇒ electrolyser
mode (seconds)
12 31.5
Instantaneous voltage drop after the
switching electrolyser mode ⇒ fuel cell mode (mV)
70 190
Instantaneous voltage drop after the
switching fuel cell mode ⇒ electrolyser mode (mV)
120 180
Table 1 Comparison of data for the different operation
switchings for two values of current 200mA and 400mA
From this table 1, we can notice that:
• The behaviour between the two operation
modes is dissymmetrical even if the shapes of
waves are similar.
• The duration of the transient state for the
switching of the electrolyser mode towards the
fuel cell mode is higher than for the switching
of the fuel cell mode towards the electrolyser
mode.
• The duration of the transient state is reduced
with the increase of the imposed current. It is
not proportional proving the existence of non-
linearities. The influence of the fluidic phenomena is very
important as already said. The switching of the
electrolyser mode towards the fuel cell mode is the
most constraining. Indeed some water accumulated
within the pores of the positive electrode and
constitutes a barrage to the flowing o the gases. But
the measured differences are finally not so high.
4-2 Introduction of pause times between
each switching of operation modes In this part, we analyze the impact of the operation
mode switchings on the open-circuit voltage. The
shape of the imposed current is drawn in figure 8-a.
Phases with a null current are introduced compared
to previously.
https://doi.org/10.24084/repqj06.268 220 RE&PQJ, Vol. 1, No.6, March 2008
Page 6
6
a) Shape of the imposed current
0
0,2
0,4
0,6
0,8
1
1,2
1,4
1,6
1,8
-50 -40 -30 -20 -10 0 10 20 30 40 50
Time (Sec)
Cell
vo
ltag
e (
V)
Electrolyser
Fuel Cell
Open circuit voltage
b) Electrolyser mode to fuel cell mode
0
0,2
0,4
0,6
0,8
1
1,2
1,4
1,6
1,8
-50 -40 -30 -20 -10 0 10 20 30 40 50
Time (Sec)
Cell
vo
tag
e (
v)
Fuel Cell
Open circuit voltage
Electrolyser
c) Fuel cell mode to electrolyser mode
Fig. 8: Time evolution with the introduction of pause
times between the operation mode switchings The figures 8-b and 8-c show the evolutions of the
open-circuit voltage for the imposed current. We
can divide the analysis into four steps:
1. A current step from 400mA to 0mA is applied
(fig. 8-b). We observe the drop voltage due to
the ohmic phenomena. Then an exponential
decreasing can be observed due to the
discharge of the equivalent double layer
capacitor. The discharge duration under a null
current confirms that its capacitance is limited
to a few hundreds of millifarads. The open-
circuit voltage tends towards 1.42V.
2. A current step from 0mA to -400 mA is applied
(fig. 8-b). The cell here operates in the fuel cell
mode. The evolution has the same shape as in
part 4-1: instantaneous voltage drop (ohmic
resistance), “elbow” corresponding to a first-
order evolution (discharge of the equivalent
double layer capacitor), and linear decreasing
(equivalent fluidic capacitor). The voltage
finally tends towards its steady state.
3. A current step from -400mA to 0mA is applied
(fig. 8-c). It can be again observed the drop
voltage due to the ohmic phenomena and the
exponential increasing due to the charge of the
equivalent double layer capacitor. The voltage
increases until to reach the open-circuit voltage
of 0.94V.
4. A current step from 0mA to 400mA is applied
(fig. 8-c). The cell here operates in the
electrolyser mode. The explanations are similar
to the ones of the point 3. The voltage finally
tends towards its steady state (1.6V).
This kind of tests demonstrates the existence of a
time limitation due to fluidic phenomena for an
operation mode switching, even if a pause time
(null current). It also confirms the role of the
double layer phenomena during transient states.
5- Conclusion An experimental work was presented to investigate
the behaviour of a commercially available
reversible PEM fuel cell.
The quasi-steady state current-voltage curves
plotted in each mode showed that the performances
are not at all symmetrical. The up-and-down
current-voltage curve plotted on the global
operation area revealed hysteresic phenomena and a
fluidic inertia at the operation mode switching.
The fluidic inertia was confirmed during all the
tests of mode switchings through a capacitive
behaviour of fluidic phenomena even if a pause
time is applied between each mode.
This experimental work is currently used to
establish an energy model of a reversible fuel cell.
[9].
6- References [1]- Mehrdad Ehsani, “Modern Electric, Hybrid Electric, and
Fuel Cell Vehicles Fundamentals, Theory, and Design” Boca
Raton London New York Washington, D.C. 2005 by CRC
Press LLC. Ch1, PP 18. [2]- Fred Mitlitsky, Blake Myers, Andrew H. Weisberg, Trent
M. Molter and William F. Smith, “Reversible (unitised) PEM
fuel cell devices”, Fuel Cells Bulletin, Volume 2, Issue 11, August 1999, Pages 6-11.
[3]- Shidong Song , Huamin Zhang, Xiaoping Ma, Zhi-Gang
Shao, Yining Zhang, Baolian Yi, “Bifunctional oxygen electrode with corrosion-resistive gas diffusion layer for
unitized regenerative fuel cell”, Electrochemistry
Communications 8 (2006) 399–405.
[4]- W. Smith, “The role of fuel cells in energy storage”, Journal
of Power Sources 86_2000.74–83.
[5]- E. Rasten, “Electro catalysis in water electrolysis with solid
polymer”, Norwegian PhD thesis, October 2001.
[6]- N. Sammes, “Fuel Cell Technology Reaching Towards
Commercialization”, Springer PP: 108. [7]- S. Busquet, C.E. Hubert, J. Labbé, D. Mayer, R.
Metkemeijer , “A new approach to empirical electrical
modelling of a fuel cell, an electrolyser or a regenerative fuel cell”, Journal of Power Sources 134 (2004) 41–48.
[8]- W. Friede, «Modélisation et caractérisation d’une pile à combustible du type PEM », PhD thesis, INPL 2003.
[9]- R. Saisset, G. Fontes, C. Turpin, S. Astier, “Bond Graph
Model of a PEM fuel cell”. Journal of Power Sources, 156(1), pp. 100-107, mai 2006.
[10]- Shidong Song, Huamin Zhang, Xiaoping Ma, Zhi-Gang
Shao, Yining Zhang, Baolian Yi, “Bifunctional oxygen electrode with corrosion-resistive gas diffusion layer for unitized regenerative fuel cell”. Electrochemistry
Communications 8 (2006) 399–405.
https://doi.org/10.24084/repqj06.268 221 RE&PQJ, Vol. 1, No.6, March 2008