425 International Journal for Traffic and Transport Engineering, 2014, 4(4): 425 - 436 EXPERIMENTAL STUDY OF NON-MOTORIZED VEHICLE CHARACTERISTICS AND ITS EFFECT ON MIXED TRAFFIC Siddharth Purohit 1 , Ujjal Chattaraj 2 , Mahabir Panda 3 1, 2, 3 Department of Civil Engineering, N.I.T. Rourkela, Odisha, India Received 28 August 2013; accepted 14 August 2014 Abstract: In countries like India we generally find a mixed traffic, i.e. a traffic flow constituting of all types of vehicles like cycle, rickshaw, car, bus, etc. In Indian cities the share of non- motorized transport (NMT) at peak hours is too high, almost more than 50%. Thus, non- motorized mode of traffic plays a very important role in meeting travel demand in countries like India. To design a traffic facility it is necessary to understand the behavior of traffic stream. But understanding the behavior of a traffic stream with mixed traffic is quite complex. In this paper an attempt is made to study the non-motorized vehicle characteristics and its effect on mixed traffic. An experimental study is done to observe the fundamental diagram from the data obtained from various roads of Rourkela city in Odisha. It is seen that with increase in NMV % the flow versus density graph is adversely affected. Density decreases at a particular flow rate when NMV % increases. Along with this a study on pattern of lateral occupancy of NMVs and MVs is done with respect to various percentages of NMV and total density. Also the variation of speed with respect to various parameters is studied and it was seen that all the parameters have a significant impact on the speed of a non-motorized vehicle in a mixed traffic. Keywords: NMT, NMV, MV, mixed traffic, lateral occupancy. 1 Corresponding author: [email protected]UDC: 656.1.07(540) DOI: http://dx.doi.org/10.7708/ijtte.2014.4(4).06 1. Introduction The flow of mixed or heterogeneous traffic is quite complicated. This mixed flow of vehicles leads to many problems, like conflicts at intersections, when number of non-motorized vehicle increases which adversely affects the speed and flow of other vehicles. It significantly lowers or reduces the capacity and also leads to various safety problems. In countries like India a separate track for flow of non-motorized traffic is not practically possible. Also as per World Bank surveys (2010) about 31% of poor people are there in South Asian countries. In India percentage of poverty is 32.7%. Hence they depend on non-motorized mode of traffic for entire trip. The importance of non-motorized transport in India can be found in an article by Sarana (1990). So a proper study of non-motorized vehicle characteristics should be done along with the study of how these NMV affects the mixed traffic. ‘Non-Motorized Vehicles’ (NMVs) is refereed to different types of pedal powered vehicles used in the Indian subcontinent. These include different shapes and sizes of bicycles and tricycles. Tricycles are used to carry goods and passengers; these are commonly called as cycle rickshaws. The various dimensions of NMVs are adopted from Bicycle Infrastructure Design Manual for Indian Subcontinent by Arora (2009). Motorized vehicles (MVs) include motor cycle or bike, auto rickshaw, car and bus/truck. All vehicles have their own
Transcript
425
International Journal for Traffic and Transport Engineering, 2014, 4(4): 425 - 436
EXPERIMENTAL STUDY OF NON-MOTORIZED VEHICLE CHARACTERISTICS AND ITS EFFECT ON MIXED TRAFFICSiddharth Purohit1, Ujjal Chattaraj2, Mahabir Panda3
1, 2, 3 Department of Civil Engineering, N.I.T. Rourkela, Odisha, India
Received 28 August 2013; accepted 14 August 2014
Abstract: In countries like India we generally find a mixed traffic, i.e. a traffic flow constituting of all types of vehicles like cycle, rickshaw, car, bus, etc. In Indian cities the share of non-motorized transport (NMT) at peak hours is too high, almost more than 50%. Thus, non-motorized mode of traffic plays a very important role in meeting travel demand in countries like India. To design a traffic facility it is necessary to understand the behavior of traffic stream. But understanding the behavior of a traffic stream with mixed traffic is quite complex. In this paper an attempt is made to study the non-motorized vehicle characteristics and its effect on mixed traffic. An experimental study is done to observe the fundamental diagram from the data obtained from various roads of Rourkela city in Odisha. It is seen that with increase in NMV % the flow versus density graph is adversely affected. Density decreases at a particular flow rate when NMV % increases. Along with this a study on pattern of lateral occupancy of NMVs and MVs is done with respect to various percentages of NMV and total density. Also the variation of speed with respect to various parameters is studied and it was seen that all the parameters have a significant impact on the speed of a non-motorized vehicle in a mixed traffic.
The flow of mixed or heterogeneous traffic is quite complicated. This mixed f low of vehicles leads to many problems, l ike conf licts at intersections, when number of non-motorized vehicle increases which adversely affects the speed and flow of other vehicles. It significantly lowers or reduces the capacity and also leads to various safety problems. In countries like India a separate track for f low of non-motorized traffic is not practically possible. Also as per World Bank surveys (2010) about 31% of poor people are there in South Asian countries. In India percentage of poverty is 32.7%. Hence they depend on non-motorized mode of traffic for entire trip. The importance of
non-motorized transport in India can be found in an article by Sarana (1990). So a proper study of non-motorized vehicle characteristics should be done along with the study of how these NMV affects the mixed traffic. ‘Non-Motorized Vehicles’ (NMVs) is refereed to different types of pedal powered vehicles used in the Indian subcontinent. These include different shapes and sizes of bicycles and tricycles. Tricycles are used to carry goods and passengers; these are commonly called as cycle rickshaws. The various dimensions of NM Vs are adopted from Bicycle Infrastructure Design Manual for Indian Subcontinent by Arora (2009). Motorized vehicles (MVs) include motor cycle or bike, auto rickshaw, car and bus/truck. All vehicles have their own
426
Purohit S. et al. Experimental Study of Non-Motorized Vehicle Characteristics and its Effect on Mixed Traffic
properties so it’s difficult for a mixed traffic as compare to a homogeneous traffic. Thus here comes the use of a term called passenger car equivalence factor used to convert all vehicles to a single unit called PCU. PCU is defined as measure of the relative space requirement of a vehicle class compared to that of passenger car under a specified set of roadway, traffic and other conditions. PCU of a passenger car is taken as 1. So PCU of other vehicles can be found out with relative to a passenger car. For PCU value the equivalency factor suggested by IRC: 86-1983 was followed. Also for further more details about PCU concept a book on Highway engineering by Khanna and Justo (2001) was referred.
Literature survey in the field of work done on non-motorized vehicles in a mixed traffic condition is studied. Oketch (2003) developed a special model to investigate the effects of various non-conventional vehicles on stream performance including lane capacity and saturation f lows. This paper says that for such heterogeneous streams had reduced link capacities and lane saturation f lows in comparison to homogenous f lows with private cars only, although the trends were not always consistent. Rahman et al. (2003) also made a study on the effect of non-motorized vehicles on urban road traf f ic characteristics from four mid-block sections of Dhaka, Bangladesh and concluded that non-motorized vehicles have adverse effect on fundamental traffic parameters. Rahman et al. (2004) developed an estimation method of passenger car equivalent of rickshaws and auto rickshaws at signalized intersections by a macroscopic approach. Rahman and Nakamura (2005) introduced a method for est imat ing passenger car equivalents (PCE) for non-motorized vehicle based on speed reduction
of passenger cars in the mixed f low due to the presence of non-motorized vehicles from the observed data collected from two mid-block sections of Dhaka, Bangladesh. Pan and Kerali (2007) conducted a research on the effects of non-motorized traffic f low on motorized vehicle speeds on the basis of field observations of vehicle speeds on Chinese roads and observed linear relationship between motorized vehicle speeds and non-motorized traffic flow under a range of motorized traffic f low volumes. Wang et al. (2007) made a study on bicycle conversion factor calibration at two-phase intersections in mixed traffic f lows from various cities in china. They proposed model to calculate the through bicycle traffic and left-turn bicycle traffic conversion factors in intersections where bicycles and motor vehicles share the same road. Liang et al. (2011) made a study for calculating straight lane capacity under mixed traffic conditions in China. The First Discharge Headway (FDH) was applied as a novel to improve Stop Line Method model, and the inf luencing factors of FDH were analysed. Sharma et al. (2012) have done a speed-flow analysis for interrupted oversaturated traffic f low with heterogeneous structure for urban roads. They proposed a model which is able to predict the speed, delay, average queue and maximum queue estimates for urban roads and quantify congestion for oversaturated condit ion. Hasan (2012) studied the effect of various traffic parameters on road hazard. They proposed a model which can identify the possible hazard and non-hazard situations on freeway. Praveen and Arasan (2013) studied the influence of traffic mix on PCU value of vehicles under mix traffic conditions. They found that with change in traffic volume and composition, the PCU values of a vehicle category significantly changes.
427
International Journal for Traffic and Transport Engineering, 2014, 4(4): 425 - 436
The motivation behind this study is that less study on non-motorized vehicles and mixed traffic has been done in Indian context and no study has been done for pattern of lateral occupancy of the vehicles on Indian roads although study of passing and over taking has been done which is related to lateral occupancy.
So the proposed work aims at analysing the characteristics of the non-motorised traffic f low and its effect on the motorised mode of traffic by experimental methods. The objectives are as follows:
1. To study the variation in speed of NMV with respect to number of PCUs in the same strip, number of PCUs in the adjacent strip, distance of the test vehicle from the road edge.
2. To study of fundamental diagram of the traffic flow from the data obtained from various locations.
3. To study the effect of density and fraction of NMV on lateral occupancy of non-motorized vehicles and motorized vehicles.
2. Experiment
2.1. Experimental Set–up and Data Collection
In this project, data collection refers to the collection of video coverage from various road locations of Rourkela city. All in all five locations were selected (say, roads A, B, C, D and E) each with different roadway conditions with roads. A, B, D having width of 7 m and roads C, E of 10.5 m width, and of different traffic compositions.
All the data were collected by a video camera for 30 minutes interval. A section on each
road was selected which had sufficient number of non-motorized traffic. A 5 m long section was selected and using some marking tools the four corners of the area was marked and the video of the section was taken. All the data were recorded by using the video camera and later decoded in the computer by playing the video with the help of KM player. The data was decoded at per second rate or per frame rate (25 frames = 1 sec) as per the requirement.
2.2. Data Decoding or Data Extraction
The collected video was played in KM player. A cellophane paper was pasted on the computer screen and the four corners were marked and joined with help of a white board marker. This was done because although the actual shape of the section is rectangular but when captured in a camera its shape gets deformed; somewhat trapezoidal depending on the position of camera. For every 1 min interval the flow (q) of vehicles, i.e. the number of vehicles of each category passing the line in both directions was noted. Also for every 10 sec interval the density (K) within the subjected region was determined for both motorized and non-motorized vehicles. Speed was calculated with relation u = q/K and finally various fundamental diagrams for various locations were plotted. If the data was obtained from a 2 way road, data decoding was done for both way separately, i.e. for upward flow or downward f low.
For study of lateral occupancy, the above procedure for determining the section was followed and then the area was divided into 7 equal strips (Fig. 1). Width of one strip depends on width of the road. At every 10 seconds interval for each strip, number of vehicles of each category of vehicles was
428
Purohit S. et al. Experimental Study of Non-Motorized Vehicle Characteristics and its Effect on Mixed Traffic
noted down. As per their PCU equivalent, vehicles were converted to NMV and MV. Relative of total NMV and MV in each strip was found out. Graph between relative lateral occupancy and strip number was plotted for NMV, MV, and total traffic. Also the effect of density and percentage of NMV on lateral occupancy was studied.
For the study of variation of speed with respect to various parameters as number of PCUs in same strip, number of PCUs in both adjacent strips and distance of test vehicle from road edge, the section area was divided
into equal number of strips (Fig. 1). Then with respect to test vehicle (NMV), number of vehicles of different class in same and the both adjoining strip of strip in which test vehicle is there was noted. This process starts when test vehicle enters the section and this ends when test vehicle leaves the section. All vehicle classes were converted to one unit i.e. PCU. Speed of the test vehicle was calculated by ratio between times spent by it in the section to the distance covered (i.e. length of section + length of the test vehicle). Then graph between speed of test vehicle and the three parameters were plotted.
Fig. 1.Road Section for the Study of Lateral Occupancy and Speed with Respect to Various Parameters
2.3. The Observed and Computed Parameters
The observed and computed parameters in this experimental study are as follows:
Speed: In traffic engineering language speed is defined as the distance travelled by a vehicle over a certain period of time. It’s not impossible to calculate the speed of every individual vehicle. So the average speed is
taken into consideration and can be calculated by 2 ways, i.e., time mean speed and space mean speed. Time mean speed is defined as the average of speed of vehicles crossing a particular section. Space mean speed is defined as the ratio of distance (length) of particular section and the average time of vehicles crossing that particular section.
Flow (vehicles/time): It is defined as the ratio of number of vehicles crossing a particular
429
International Journal for Traffic and Transport Engineering, 2014, 4(4): 425 - 436
section and the time taken by the vehicle to cross that particular section.
Density (veh icles/d istance): A f ter a particular time the number of vehicles which occupy the particular region is defined as density. The density is generally averaged over certain duration of time.
F u n d a m e n t a l d i a g r a m s o f t r a f f i c f low: Fundamental diagram means the d i ag ra m m at ic repre sent at ion of t he relationship between the various traffic parameters i.e. the relation between speed, flow and density. There are three curves which show the relation in between the density vs. speed, speed vs. f low and f low vs. density. The above mentioned f low parameters are related to a basic equation q=u*K.
Relative Lateral Occupancy: It is defined as the fraction of vehicles which occupied any strip, say‘s’, to the total number of vehicles which occupied the entire section for the total time period.
2.3.1. Observed Parameters
1. Time of any vehicle ‘n’ at entry section (EN) of the observed area = t(n)EN
2. Time of any vehicle ‘n’ at exit section (EX) of the observed area = t(n)EX
3. Number of vehicles leaving the observed area at a certain duration of time = n(T)EX
4. Number of vehicles present in the observed are at a time instance ‘i’ = n(i)
5. Nu mber of veh ic les present in a particular strip ‘s’ during the total time period = n(s)
2.3.2. Computed Parameters
1. The Space Mean Speed (SMS) of the vehicles is calculated by Eq. (1):
(1)
Where L is length of the observed area and N is the total number of vehicles crossing the observed area during the total time duration ‘T’.
2. The Flow (F) can be obtained by Eq. (2):
(2)
Where T is the total time duration of the experiment.
3. The Relative Density (RD) of the observed area can be obtained by Eq. (3):
(3)
W here A is the total area of the section and I is the total number of time instances for which the number of vehicles in the experiment area is observed.
4. The Relative Lateral Occupancy (RLOS) can be calculated by Eq. (4):
(4)
Where S is the total number of strips and OLSS is the overall lateral occupancy of any strip ‘s’ during the total time period ‘T ’ is given by Eq. (5):
(5)
This definition of relative lateral occupancy is adapted from Chattaraj et al. (2010).
430
Purohit S. et al. Experimental Study of Non-Motorized Vehicle Characteristics and its Effect on Mixed Traffic
A reference for def init ions of various fundamental of transportation/traffic f low was taken from Wikibooks contributors (2014).
3. Results and Discussions
This section gives the results obtained from the data extracted experimentally. There are three subsections separately for each kind of experimental work which are already defined above. So the results for the experiments are presented one by one as follows.
3.1. Fundamental Diagram
Fig. 2 and Fig. 3 show the flow versus density and speed versus density graphs for road E. In this location NMV percentage was found to be 13.11% and total density was 7.93 PCU/m. Here motorized percentage was high with heavy vehicles like bus, trucks etc.
So some points from the congested regions are also obtained. This is the reason for which the speed of the vehicles is of low range.
Fig. 2.Flow versus Density Graph
Fig. 3.Speed versus Density Graph
431
International Journal for Traffic and Transport Engineering, 2014, 4(4): 425 - 436
3.2. Lateral Occupancy
Fig. 4 shows lateral occupancy graph for road D. It can be seen that the NMVs trying to stay in left hand side of the road. As in India we follow left hand side drive the MVs try to overtake them and are found mostly in the
right hand side of the road. Also the first strip or 1 m from the left edge remains almost empty because vehicles normally try to avoid moving at the edge when there are either no shoulders or raised curves are there. Roads in which there are shoulders the vehicles are found in the first strip from left hand side as well.
Fig. 4.Lateral Occupancy Graph
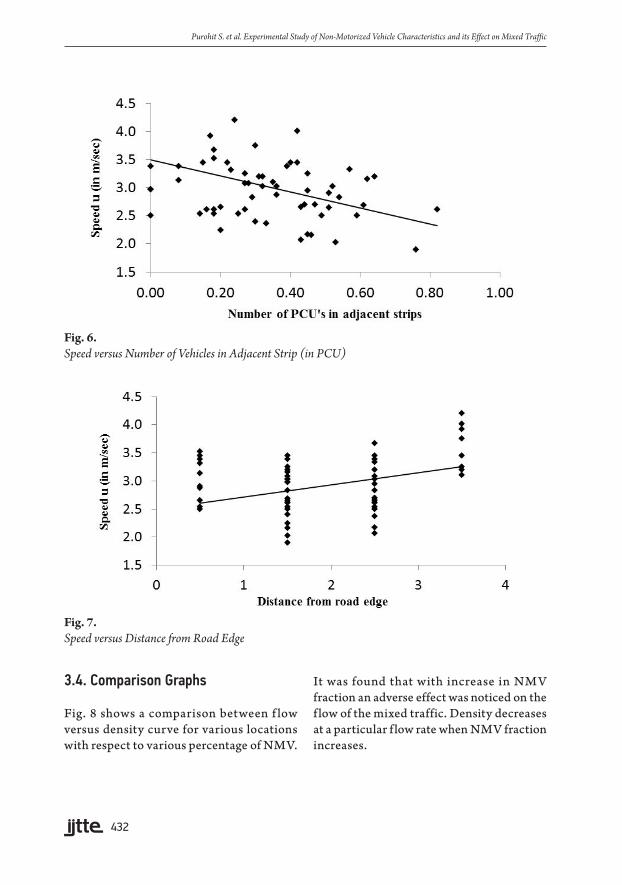
3.3. Speed versus Various Parameters
Figs. 5-7 show the graph for speed versus parameters for road D. From the graphs obtained experimentally it can
be concluded that speed of an NMV decreases when number of PCU in same and adjacent str ip increases. Speed increases when distance from the road edge increases.
Fig. 5.Speed versus Number of Vehicles in Same Strip (in PCU)
432
Purohit S. et al. Experimental Study of Non-Motorized Vehicle Characteristics and its Effect on Mixed Traffic
Fig. 6.Speed versus Number of Vehicles in Adjacent Strip (in PCU)
Fig. 7.Speed versus Distance from Road Edge
3.4. Comparison Graphs
Fig. 8 shows a comparison between f low versus density curve for various locations with respect to various percentage of NMV.
It was found that with increase in NMV fraction an adverse effect was noticed on the f low of the mixed traffic. Density decreases at a particular flow rate when NMV fraction increases.
433
International Journal for Traffic and Transport Engineering, 2014, 4(4): 425 - 436
Fig. 8.Flow versus Density for Various Percentage of NMV
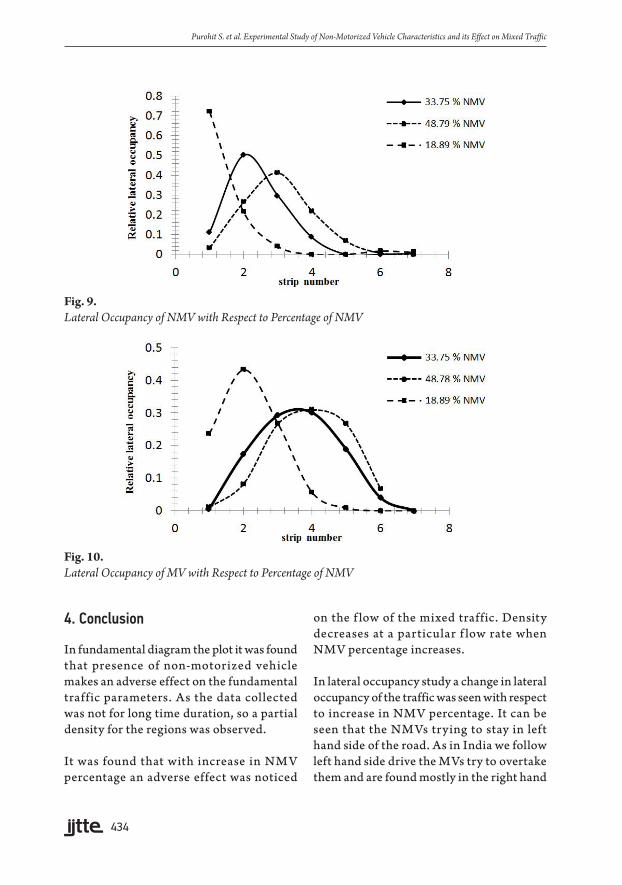
Fig. 9 and Fig. 10 show lateral occupancy of NMV and MV with respect to NMV percentage in that flow direction. Now with respect to percentage of NMV the predictions are like with less NMV percentage the non-motorised vehicles although found mostly in the left side i.e. strip 1 and 2 but are unevenly distributed.
With moderate NMV percentage the non-motorized vehicle follow a trend and are segregated not only in the left but also found maximum in the middle part of the road occupying strip 2 and 3.
With high NM V percentage the non-motorised vehicles are evenly distributed in the entire space and trying to occupy the
right hand side of the road blocking the way for f low from other direction.
With less NMV percentage the motorised vehicles don’t face any problem and are evenly distributed in the entire f low space in that direction. With moderate NMV percentage motorised vehicles are trying to overtake the NMVs but as there is a f low from other direction as well so they are mostly occupying the middle part of their f low space i.e. strip 3 and 4.
W hen NM V percentage is h igh then motorised vehicle try to overtake them and are found in right hand side of the road i.e. strip 4, 5 and 6 occupying the space for the f low from other direction as well.
434
Purohit S. et al. Experimental Study of Non-Motorized Vehicle Characteristics and its Effect on Mixed Traffic
Fig. 9.Lateral Occupancy of NMV with Respect to Percentage of NMV
Fig. 10.Lateral Occupancy of MV with Respect to Percentage of NMV
4. Conclusion
In fundamental diagram the plot it was found that presence of non-motorized vehicle makes an adverse effect on the fundamental traffic parameters. As the data collected was not for long time duration, so a partial density for the regions was observed.
It was found that with increase in NMV percentage an adverse effect was noticed
on the f low of the mixed traffic. Density decreases at a particular f low rate when NMV percentage increases.
In lateral occupancy study a change in lateral occupancy of the traffic was seen with respect to increase in NMV percentage. It can be seen that the NMVs trying to stay in left hand side of the road. As in India we follow left hand side drive the MVs try to overtake them and are found mostly in the right hand
435
International Journal for Traffic and Transport Engineering, 2014, 4(4): 425 - 436
side of the road. Also the first strip or 1 m from the left edge remains almost empty. This might be because vehicles normally try to avoid moving at the edge when there are either no shoulders or raised curves are there.
But with respect to varying percentage of NMV, the non-motorised vehicles although found mostly in the left side i.e. strip 1 and 2 but are unevenly distributed and with high NMV percentage the non-motorised vehicles are evenly distributed in the entire space and trying to occupy the right hand side of the road blocking the way for f low from other direction, which is adversely affecting the fundamental traffic parameters.
With higher NMV percentage in the roads having two way flow it was observed that MV which are overtaking the NMV from both the direction are forced to use the middle part of the road only. This observation is of a serious concern because the road has been designed for a particular load limit, but here maximum load i.e. heavier motorised vehicles are moving only in the middle part of the road. This might lead to damage of the particular part of the road (e.g. rutting of pavement).
From the speed versus various parameters study, it has been observed that speed of the non-motorised vehicles decreases when number of PCUs in same strip and in the adjacent strip increases. Speed increases when distance from the road edge increases.
In this study safety aspect was not considered. So, in future studies can be done on safety and accident analysis of mix traffic with respect to increase in NMV percentage. This study is based on the observation obtained from the
actual traffic f low. So finding and analysing an alternative solution (e.g. separate cycle track) for the mentioned problem will be a future scope for this study. Also, a model could be developed in order to validate the experimental results obtained from the speed versus various parameters study.
References
Arora, A. 2009. Bicycle Infrastructure Design Manual for Indian Subcontinent. Presented at the SUMA SUMMIT, New Delhi, India. 8-18.
Chattaraj, U.; Chakroborty, P.; Seyfried, A. 2010. Empirical Studies on Pedestrian Motion through Corridors of Different Geometries. In Proceedings of Transportation Research Board 89th Annual meeting, Washington D.C. (U.S.A.). 10-14.
Hasan, M.M. 2012. Investigation of the Effect of Traffic Parameters on Road Hazard Using Classification Tree Model, International Journal for Traffic and Transport Eng ineer ing. DOI: ht t p://d x .doi .org/10.7708/ijtte.2012.2(3).08, 2(3): 271-285.
Indian road congress, Geometric design standards for urban roads in plains, IRC: 86-1983.
Khanna, S.K.; Justo, C.E.G. 2001. Highway engineering. Nem Chand and Bros, Roorkee. 184-191.
Liang, X.; Liu, Z.; Qian, K. 2011. Capacity analysis of signalized intersections under mixed traffic conditions, Journal of Transportation Systems Engineering and Information Technology. DOI: http://dx.doi.org/10.1016/S1570-6672(10)60116-X, 11(2): 91-99.
Oketch, T. 2003. Modeled performance characteristics of heterogeneous traffic streams containing non-motorized vehicles. Presented at the Transportation Research Board 82nd Annual Meeting (CD-ROM).
436
Purohit S. et al. Experimental Study of Non-Motorized Vehicle Characteristics and its Effect on Mixed Traffic
Pan, Y.; Kerali, H.R. 2007. Effect of non-motorized transport on motorized vehicle speeds in China, Transportation Research Record: Journal of the Transportation Research Board. DOI: http://dx.doi.org/10.3141/1695-07, 1695: 34-41.
Praveen, P.S.; Arasan, V.T. 2013. Influence of Traffic Mix on PCU Value of Vehicles under Heterogeneous Traffic Conditions, International Journal for Traffic and Transport Engineering. DOI: http://dx.doi.org/10.7708/ijtte.2013.3(3).07, 3(3): 302-330.
Rahman, M.; Okura, I.; Nakamura, F. 2004. Effects of rickshaws and auto rickshaw on the capacity of urban signalized intersections, IATSS research, 28(1): 26-33.
Rahman, M.: Nakamura, F. 2005. Measuring passenger car equivalents for non-motorized vehicle (rickshaws) at mid-block sections, Journal of the Eastern Asia Society for Transportation Studies, 6(1): 119-126.
Rahman, M.; Okura, I.; Nakamura, F. 2003. Analysis of effects of non-motorized vehicles on urban road traffic characteristics. In Proceedings of the infrastructure planning (CD-ROM).
Sarana, A.C. 1990. Importance of Non-motorized Transport in India, Transportation Research Record, National Research Council, Washington, D.C. 1294: 9-15.
Sharma, K.H.; Swami, M.; Swami, L.B. 2012. Speed-flow analysis for interrupted oversaturated Traffic flow with heterogeneous structure for urban roads, International Journal for Traffic and Transport Engineering, 2(2): 142-152.
Wang, D.; Liang, C.; Jing, C.; Wang, G. 2007. Bicycle conversion factor calibration at two-phase intersections in mixed traffic f lows, Tsinghua Science & Technology, 12(3): 318-323.
Wikibooks contributors. 2014. Fundamentals of transportation/traffic f low. Available from Internet: http://en.wikibooks.org/wiki/Fundamentals_of_Transportation/Traffic_Flow.htm>.
World Bank. 2010. Poverty and equity data. Available from Internet: <http://povertydata.worldbank.org/poverty/country/IND.htm>.