1 Experimental study of particle deposition in the environmental 1 control systems of commercial airliners 2 3 Qing Cao a , Yudi Liu a , Wei Liu a,d , Chao-Hsin Lin b , Daniel Wei c , Steven Baughcum b , 4 Sharon Norris b , Xiong Shen a , Zhengwei Long a* , and Qingyan Chen a,d 5 a Tianjin Key Laboratory of Indoor Air Environmental Quality Control, School of Environmental Science 6 and Engineering, Tianjin University, Tianjin, China 7 b The Boeing Company, Seattle, USA 8 c Boeing Research & Technology, Beijing, China 9 d School of Mechanical Engineering, Purdue University, West Lafayette, IN, USA 10 11 HIGHLIGHTS 12 13 Study of the particle deposition for different sizes in the environmental control systems of the commercial airliners. Development of the correlation between the particle deposition rates and the air quality. Particle mass concentration and particle size distribution were measured on the real flights and compared to the outside particle level. ABSTRACT 14 Serious air pollution and low on-time performance of commercial flights in China could 15 result in more particles being deposited in the environmental control systems (ECS) of the 16 commercial airliners and ground air-conditioning carts (GAC). The particle deposited in the 17 ECS and GAC could cause performance issues of the airplanes and GAC. In addition, 18 particles penetrated to the aircraft cabin could cause adverse health impact on the passengers 19 and crew. This investigation measured the PM2.5 particle concentrations and the quantities of 20 particles of different sizes at the inlet and outlet of the GAC and ECS in an MD-82 airplane 21 parked next to Tianjin Airport under different air quality levels. The results showed that the 22 deposition rate of the PM2.5 mass in the GAC and ECS was 40-50%, with most (30-40%) of 23 the deposition occurring in the ECS. For particles with a diameter of 5 μm or larger, the 24 deposition rate was greater than 90%. For particles with a diameter of 0.5 μm or less, the 25 deposition rate was less than 25% so they entered into the aircraft cabin. In addition, particle 26 mass and number concentration was measured on commercial flights. The results indicated 27 that particle concentrations were high compared with that during the cruising when the 28 airplanes were on the ground at the Chinese airports where ambient particle concentrations 29 were also high. 30 31 * Address correspondence to Zhengwei Long, School of Environmental Science and Engineering, Tianjin University, 92 Weijin Road, Tianjin 300072, China. E-mail: [email protected]Cao, Q., Liu, Y., Liu, W., Lin, C.-H., Wei, D., Baughcum, S., Norris, S., Shen, X., Long, Z., and Chen, Q. 2016. “Experimental study of particle deposition in the environmental control systems of commercial airliners,” Building and Environment, 96: 62-71.
Transcript
1
Experimental study of particle deposition in the environmental 1
control systems of commercial airliners 2
3
Qing Caoa, Yudi Liua, Wei Liua,d, Chao-Hsin Linb, Daniel Weic, Steven Baughcumb, 4
Sharon Norrisb, Xiong Shena, Zhengwei Longa*, and Qingyan Chena,d 5 aTianjin Key Laboratory of Indoor Air Environmental Quality Control, School of Environmental Science 6
and Engineering, Tianjin University, Tianjin, China 7 bThe Boeing Company, Seattle, USA 8 cBoeing Research & Technology, Beijing, China 9 dSchool of Mechanical Engineering, Purdue University, West Lafayette, IN, USA 10
11
HIGHLIGHTS 12 13
Study of the particle deposition for different sizes in the environmental control systems of the commercial airliners.
Development of the correlation between the particle deposition rates and the air quality. Particle mass concentration and particle size distribution were measured on the real
flights and compared to the outside particle level.
ABSTRACT 14
Serious air pollution and low on-time performance of commercial flights in China could 15 result in more particles being deposited in the environmental control systems (ECS) of the 16 commercial airliners and ground air-conditioning carts (GAC). The particle deposited in the 17 ECS and GAC could cause performance issues of the airplanes and GAC. In addition, 18 particles penetrated to the aircraft cabin could cause adverse health impact on the passengers 19 and crew. This investigation measured the PM2.5 particle concentrations and the quantities of 20 particles of different sizes at the inlet and outlet of the GAC and ECS in an MD-82 airplane 21 parked next to Tianjin Airport under different air quality levels. The results showed that the 22 deposition rate of the PM2.5 mass in the GAC and ECS was 40-50%, with most (30-40%) of 23 the deposition occurring in the ECS. For particles with a diameter of 5 μm or larger, the 24 deposition rate was greater than 90%. For particles with a diameter of 0.5 μm or less, the 25 deposition rate was less than 25% so they entered into the aircraft cabin. In addition, particle 26 mass and number concentration was measured on commercial flights. The results indicated 27 that particle concentrations were high compared with that during the cruising when the 28 airplanes were on the ground at the Chinese airports where ambient particle concentrations 29 were also high. 30
31
* Address correspondence to Zhengwei Long, School of Environmental Science and Engineering, Tianjin University, 92Weijin Road, Tianjin 300072, China. E-mail: [email protected]
Cao, Q., Liu, Y., Liu, W., Lin, C.-H., Wei, D., Baughcum, S., Norris, S., Shen, X., Long,
Z., and Chen, Q. 2016. “Experimental study of particle deposition in the environmental
control systems of commercial airliners,” Building and Environment, 96: 62-71.
The environmental control system (ECS) in a commercial airliner is to maintain safety, 35 thermal comfort, and air quality for passengers and crew by supplying conditioned air into 36 the cabin. During a flight, the total air supply is a mixture of outside air and filtered re-37 circulated air. High efficiency particulate air (HEPA) filters are only used for recirculated air, 38 not for outside air entering the aircraft. 39
However, the particle concentration of the outside air on the ground could be high. The 40 mass concentration of particles with aerodynamic diameters less than 2.5 microns (PM2.5) in 41 major Chinese airports, as shown in Fig. 1, was 3 to 10 times higher than that in many major 42 metropolitan cities in developed countries, such as 16 μg/m3 in London, 10 μg/m3 in Tokyo, 43 and 14 μg/m3 in New York [1]. As the air pollution in cities and that near the city airports 44 was usually comparable [2], so we could assume the air pollution in London, Tokyo, and 45 New York airports was low. For example, Ellermann et al. [3] investigated the air pollution 46 on the apron of Copenhagen Airport and found the annual average concentration of PM2.5 47 was only 17 μg/m3. Thus, the particular matter pollution in major Chinese airports was very 48 serious. 49
50
51 Fig.1. Annual average PM2.5 and PM10 mass concentration at six major airports in China measured from 52 March 1, 2014 to February 28, 2015. [2] 53 54
In addition, the statistics from Flightstats [4] shows a very low on-time performance of 55 about 30% for three major Chinese airports, which were the lowest in the world. For 56 example, Shanghai CS Capital [5] estimated that passengers and crew spend extra 40 minutes 57 on average in aircraft cabins between door closing and taking-off. Accordingly, GAC or APU 58 has to be operated for a long time to supply air to an aircraft during the waiting period. 59 Therefore, in China, a significant amount of particles could be brought into the commercial 60 airliners before taking off. 61
The outside air from a ground air-conditioning cart or APU will go through the ECS, 62 which consists of heat exchangers, fans, turbines, and manifolds, before it is delivered into 63 the cabin. The particles in the outside air are likely to deposit on the surface of the ECS 64 components and ducts. The particle deposition on the ECS components would affect the 65 performance and shorten the service life. For example, the increased particle concentration in 66
the air will add mass loading to the HEPA filters when the air is circulated. Particle deposited 67 on heat exchangers, turbines, and fans will decrease their efficiencies [6]. Meanwhile, such 68 deposition can reduce the airflow rate through ducts, especially small diameter ducts, and 69 thus can degrade the performance of the ventilation system [7]. Furthermore, the particle 70 deposition on the duct systems would potentially increase the possibility of microbial 71 contamination [8]. The accumulated dust and microorganisms in the supply air duct could 72 turn into a pollution source [9], which will be brought into the aircraft cabin and be harmful 73 to the health of the passengers and crew [10-12]. Therefore, it is important to investigate how 74 much the particles were deposited in the ECS during ground operation. Our literature review 75 shows that the past investigations on particle deposition in aircraft cabins focused on the 76 particle transport inside the cabins during flights [13-16]. Few investigations were available 77 on the particle deposition in the ECS. 78
This study conducted simultaneous measurements of PM2.5 mass concentration, particle 79 number and size distribution at the inlet and outlet of the ECS of an MD-82 airplane for 80 simulating ground operations. In addition, the particle concentration was also measured on 81 commercial flights to confirm the findings. The measured data were further analysed to 82 understand the particle deposition in the ECS. 83
2. Experiments and methods 84
2.1. Site description 85
This investigation used a retired MD-82 airplane as the main experimental rig. The 86 airplane was parked adjacent to the runway of Tianjin Binhai International Airport, as shown 87 in Fig. 2(a). The airport had 10 million passengers in 2013 and was ranked 24th in China. 88 The air quality in Tianjin was the tenth worst in China, and the PM2.5 annual average 89 concentration was 83 μg/m3 in 2014 (China Environmental State Bulletin, 2014). Particular 90 matter measurements were conducted at the MD-82 parking position where was only 460 m 91 away from the runway. Three air quality monitoring stations around Tianjin airport as shown 92 in Fig. 2(b) could provide the ambient air pollution data for the airport. 93
94
(a) (b) Fig.2. (a) The MD-82 airplane parked at location P at Tianjin Binhai International Airport, where T is the 95 terminal and the green line is the runway, and (b) Tianjin-1, Tianjin-2, and Tianjin-3 are the three air 96
4
quality monitoring stations near the airport. 97
2.2. Sampling and instrumentation 98
In order to obtain the particle deposition rate in the ECS, simultaneous measurements of 99 particle concentration were conducted inside and outside the cabin under different air quality 100 conditions. The measurements in the MD-82 airplane were mainly conducted in the afternoon 101 from November 2014 to April 2015. Fig. 3(a) shows the MD-82 airplane was connected with 102 a GAC that supplied conditioned air to the airplane. The GAC maintained the supply-air 103 temperature at 20±1oC. The airflow rate was controlled at 9 L/s per passenger that is typical 104 for commercial airliners. Simultaneous measurements of PM10 and PM2.5 mass concentration 105 were conducted at the inlet of the GAC, at the outlet of the GAC (or inlet of the ECS), and at 106 the air supply diffusers (ECS outlets) in the first-class cabin, as showed in Fig. 3(b), (c), and 107 (d), respectively. Both the particle mass concentration and particle size distribution were 108 measured. Before each measurement, the ground air-conditioning cart had operated for two 109 or three hours to obtain a steady working condition. 110
111
112 (a) 113
114 (b) (c) (d ) 115 Fig.3. (a) The MD-82 aircraft with a GAC, and the measurement of particle concentration (b) at the GAC 116 inlet (P1), (c) at the GAC outlet or ECS inlet (P2), and (d) at a gasper outlet in the first-class cabin (P3). 117
5
118 This study also investigated the particle level on commercial aircraft to further understand 119
the particle deposition in ECS. The particle mass and number concentrations were measured 120 inside the cabin during the flights. Due to the airport security concerns, the particle 121 measurements outside the aircraft cabin were not permitted. The particle mass outside the 122 cabin used the data from the nearest air quality monitoring station. 123
Fig. 4 shows a schematic figure of the ECS which consists of the key components such as 124 an air-conditioning pack, a mix manifold, a main air distributor or manifold, air diffusers and 125 the pipe that connects the ECS to the GAC. Many auxiliary components, such as anti-ice pipe 126 lines and balance tubes, were neglected for the sake of simplicity. The outside air was 127 brought into the aircraft cabin through the GAC connecting pipe or APU inlet. 128
129
130 Fig.4. Schematic figure of the ECS 131 132 The particle mass concentrations were measured by DustTrak DRX aerosol monitors 133
(Model 8533, TSI Corporation, USA) and DustTrak II aerosol monitors (Model 8530, TSI 134 Corporation, USA). DustTrak DRX is a continuous, real-time, 90° light-scattering laser 135 photometer that provides simultaneously size-segregated mass-fraction concentrations for 136 PM1, PM2.5, PM10 and total PM size fractions. The instrument combines both particle cloud 137 (total area of scattered light) and single particle detection to achieve mass fraction 138 measurements. DustTrak II reports only one particle size at one time. The measurement 139 precision was 1 μg/m3. DustTrak DRX amd DustTrak II have the same accuracy as they were 140 based on the same measuring technique and design parameters. The particle size distributions 141 were measured by Fluke 983, an airborne particle counter (FLUKE Corporation, USA). It can 142 simultaneously measure and record six channels of particle sizes (0.3 to 0.5 μm, 0.5 to 143 1.0μm, 1.0 to 2.0 μm, 2.0 to 5.0 μm, 5.0 to 10.0 μm and >10.0 μm). The experimental 144 measurements obtained data with one-minute intervals. The measurements were made at 145 ambient conditions without drying or heating the PM samples to remove adsorbed water. 146 Since the primary purpose of the project was to evaluate PM loss through the ECS system, 147 this probably does not affect the loss fraction significantly but the absolute concentrations 148 will differ from those obtained with standard PM2.5 and PM10 which are heated to measure 149 dry samples in the three air quality monitoring stations around the airport. 150
6
2.3. Data analysis 151
In this investigation, the GAC supplied the MD-82 airplane with 100% outside air. The 152 overall deposition rate on the air-conditioning cart and the ECS can be calculated by: 153 154
Pdeposition=1-Cinside
Coutside (1) 155
156 where Pdeposition is the PM mass or number deposition rate in the GAC and the ECS, Cinside is 157 the PM mass or number concentration measured inside the first-class cabin and Coutside is the 158 PM mass or number concentration measured outside of the airplane (at the GAC inlet). The 159 data was averaged over an hour to reduce the fluctuations. 160 161 As pointed out by Wang et al. [17], particles could resuspension in ventilation duct and the 162 suspension rate depends on air velocity and other factors. However, this investigation was 163 unable to separate the deposition and resuspension, Eq. (1) represents the net deposition. 164 165
3. Results 166
3.1. Particle deposition in the ECS and GAC 167
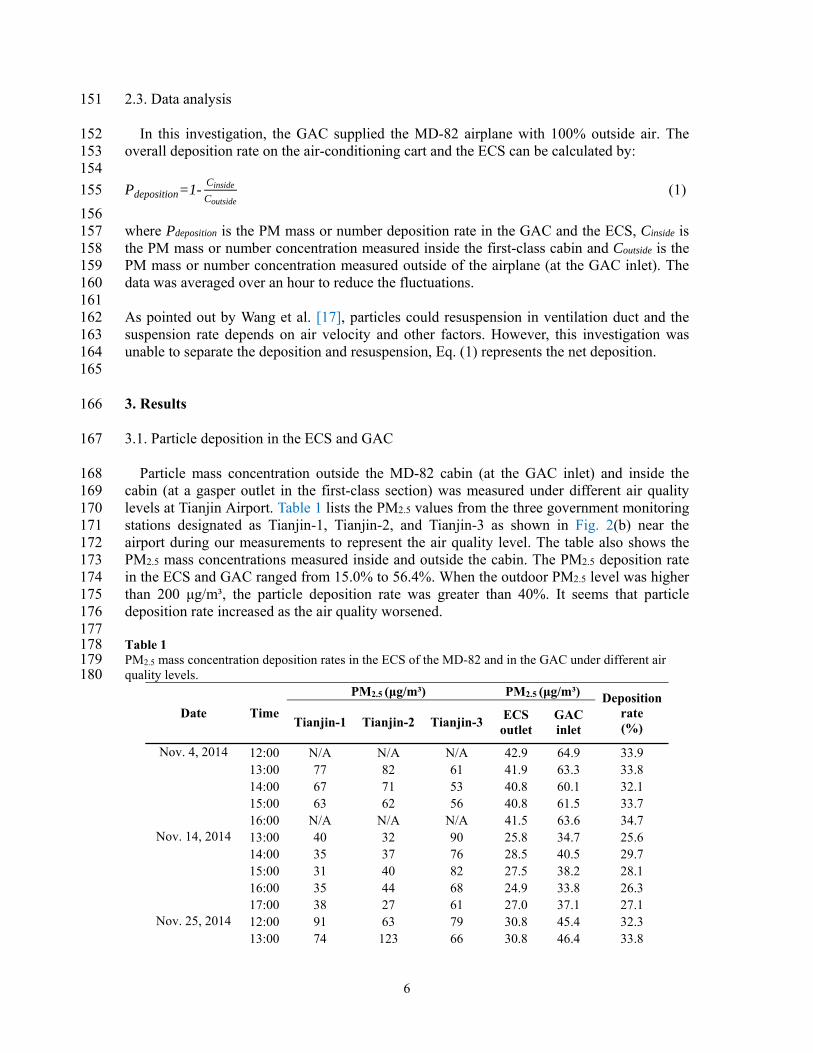
Particle mass concentration outside the MD-82 cabin (at the GAC inlet) and inside the 168 cabin (at a gasper outlet in the first-class section) was measured under different air quality 169 levels at Tianjin Airport. Table 1 lists the PM2.5 values from the three government monitoring 170 stations designated as Tianjin-1, Tianjin-2, and Tianjin-3 as shown in Fig. 2(b) near the 171 airport during our measurements to represent the air quality level. The table also shows the 172 PM2.5 mass concentrations measured inside and outside the cabin. The PM2.5 deposition rate 173 in the ECS and GAC ranged from 15.0% to 56.4%. When the outdoor PM2.5 level was higher 174 than 200 μg/m³, the particle deposition rate was greater than 40%. It seems that particle 175 deposition rate increased as the air quality worsened. 176
177 Table 1 178 PM2.5 mass concentration deposition rates in the ECS of the MD-82 and in the GAC under different air 179 quality levels. 180
181 Fig. 5 further shows the PM2.5 concentrations inside and outside the MD82 cabin on a good 182
day, moderate day, unhealthy day, and hazardous day, respectively. AQI ranges of 0-50, 51-183 100, 101-150, 151-200, 201-300, and 300+ indicate that the air quality is good, moderate, 184 unhealthy for sensitive groups, unhealthy, very unhealthy, and hazardous, respectively, 185 according to the China’s Ministry of Environmental Protection. The concentration inside the 186 cabin correlated positively with that in the outside air. As the air quality worsened, the 187 deposition rate increased. 188
189
(a)
15:00 15:30 16:00 16:300
10
20
30
40
0
20
40
60
80
100
De
po
sitio
n r
ate
(
)
2014/12/01 Particle deposition rate in ECS and GAC PM2.5 mass measured inside the aircraft cabin PM2.5 mass measured outside the airplane
PM
2.5
ma
ss c
on
cen
tra
tion
(g
/m3 )
Time (hh:mm)
14:30
8
(b)
(c)
(d)
Fig. 5. PM2.5 mass concentrations measured inside and outside the MD82 cabin on days under different air 190 quality levels: (a) good, (b) moderate, (c) unhealthy, and (d) hazardous. 191 192
13:00 14:00 15:00 16:000
60
120
180
0
20
40
60
80
De
po
sitio
n ra
te (
)
2014/11/04 Particle deposition rate in ECS and GAC PM2.5 mass measured inside the aircraft cabin PM2.5 mass measured outside the airplane
PM
2.5
ma
ss c
once
ntr
atio
n (g
/m3)
Time (hh:mm)
12:00
14:20 14:50 15:20 15:50 16:20 16:500
60
120
180
240
300
0
20
40
60
80
100
De
po
sitio
n r
ate
(
)
2014/11/28 Particle deposition rate in ECS and GAC PM2.5 mass measured inside the aircraft cabin PM2.5 mass measured outside the airplane
PM
2.5
ma
ss c
on
cen
tra
tion
(g
/m3)
Time (hh:mm)
13:50
14:45 15:15 15:45 16:15 16:450
100
200
300
400
500
0
20
40
60
80
100
De
posi
tion
rate
(
)
2014/11/26 Particle deposition rate in ECS and GAC PM2.5 mass measured inside the aircraft cabin PM2.5 mass measured outside the airplane
PM
2.5
ma
ss c
on
cen
tra
tion
(g
/m3 )
Time (hh:mm)
14:15
9
By statistically analysing the measured PM2.5 concentration data versus the data from the 193 monitoring stations, Fig. 6 confirms that the heavier the outdoor air pollution was, the higher 194 was the deposition rate of particles in the GAC and ECS. The reason is that when the air 195 quality was bad, there were a greater percentage of large particles, which can be easily 196 deposited. 197 198
199 Fig. 6. Correlation between PM2.5 deposition rate and average PM2.5 of the monitoring stations. 200
201 The particle number and size distributions were also measured with a Fluke 983 counter at 202
the airport outside the airplane on days with different AQI values. As shown in Fig. 7, when 203 the AQI value was high, the air contained more large particles by percentage. When the AQI 204 value was low, most of the particles in the air (80%) were very small in size (0.3 to 0.5 μm). 205 Since particles with small diameters do not have much mass, their contributions to the PM2.5 206 were small. 207
208
209 Fig. 7. Correlations between AQI value and percentage of particles in different size ranges. 210
211 To distinguish the particle deposition in the GAC from that in the ECS, simultaneous 212
measurements of the PM2.5 mass concentration at the inlet and outlet of the GAC and at the 213 inlet and outlet of the ECS were conducted. Note that the outlet of the GAC was the inlet of 214
0 50 100 150 200 250 300 35010
20
30
40
50
60
Y=0.10X+23.30
R2=0.766
PM
2.5 d
epos
ition
ra
te (
%)
Average PM2.5
of the mornitoring stations (g/m3)
0~100 100~200 200~300 300~4000
20
40
60
80
100
Per
cent
age
(%
)
AQI
2~5m 1~2m 0.5~1m 0.3~0.5m
10
the ECS. Since we had only two DustTrak meters, the measurements were conducted 215 separately for the GAC and ECS. Table 2 shows the particle deposition rates in the GAC on 216 spring days with different air quality levels. The primary pollutant in Tianjin in the spring 217 was usually PM10 because of the dust in the air from the bare land around the airport [18]. In 218 the spring, as shown in Table 2, the average PM2.5 concentration of the three monitoring 219 stations was generally low, while PM10 was relative high. The monitoring stations measured 220 the PM2.5 and PM10 by drying the samples while the DusTrak meter measured the sample 221 with water vapor that has absorbed on the particles. The particle deposition rate in the GAC 222 was about 10%, which was much lower than that in the ECS (30-40%). Most of the particles 223 were deposited in the ECS because of its complex geometry, such as bends, heat exchangers, 224 and turbines, before the air entered the main duct. 225
226 Table 2 227 PM2.5 mass concentrations and deposition rates in the ground air-conditioning cart. 228
229 As the MD-82 cabin is very long, this study also investigated the particle deposition in the 230
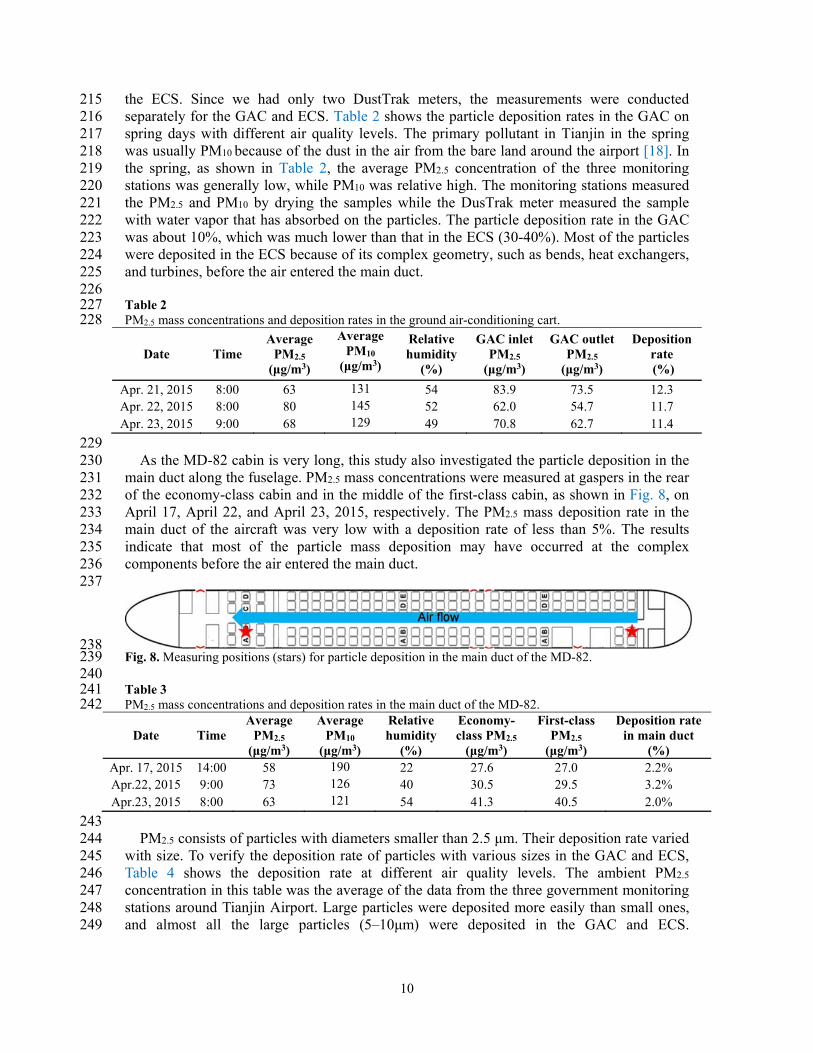
main duct along the fuselage. PM2.5 mass concentrations were measured at gaspers in the rear 231 of the economy-class cabin and in the middle of the first-class cabin, as shown in Fig. 8, on 232 April 17, April 22, and April 23, 2015, respectively. The PM2.5 mass deposition rate in the 233 main duct of the aircraft was very low with a deposition rate of less than 5%. The results 234 indicate that most of the particle mass deposition may have occurred at the complex 235 components before the air entered the main duct. 236
237
238 Fig. 8. Measuring positions (stars) for particle deposition in the main duct of the MD-82. 239 240 Table 3 241 PM2.5 mass concentrations and deposition rates in the main duct of the MD-82. 242
243 PM2.5 consists of particles with diameters smaller than 2.5 μm. Their deposition rate varied 244
with size. To verify the deposition rate of particles with various sizes in the GAC and ECS, 245 Table 4 shows the deposition rate at different air quality levels. The ambient PM2.5 246 concentration in this table was the average of the data from the three government monitoring 247 stations around Tianjin Airport. Large particles were deposited more easily than small ones, 248 and almost all the large particles (5–10μm) were deposited in the GAC and ECS. 249
11
Surprisingly, when the air quality was bad, the number of fine particles (0.3–0.5μm) inside 250 the cabin was found to be greater than that outside the airplane. 251 252 Table 4 253 The deposition rates for particle with various sizes on days under different air quality levels. 254
We initially suspected that chemical reactions inside the cabin had produced additional fine 255 particles. To determine which chemical reactions could generate fine particles, we conducted 256 a literature review. Sarwar et al. [19] investigated secondary particles resulting from 257 homogeneous reactions between O3 and α-pinene. Their experimental results indicated that 258 rapid fine particle growth occurred as a result of reactions between O3 and α-pinene. Fan et 259 al. [20] and Rai et al. [21] demonstrated that O3 can initiate reactions in a complex mixture of 260 commonly occurring indoor VOCs, which included terpenes, and that these reactions 261 ultimately generated ultra-fine particles. Other studies have suggested that indoor air 262 chemistry, particularly the reactions between terpenes and O3, can generate fine particles [22-263 28]. Terpenes originate from many consumer products, such as cleaners and fragrances, and 264 O3 comes from the outdoor air. These studies concluded that ozone reactions with terpenes 265 such as α-pinene and limonene can be important sources of sub-micron particles in indoor air. 266 Such chemistry is not limited to terpenes, pinene, or limonene. Secondary aerosol formation 267 can also occur with oxidation of a number of hydrocarbon species some of which may be 268 present in the ambient air, especially when the O3 level in the ambient air was high as shown 269 on Table 4. Even water vapour on the aerosols could play a role and change the size 270 distribution. To find the exact reason would need additional work in the future. 271
3.2. Particle deposition in ECS during commercial flights 272
To confirm the deposition of particles in the ECS, particle mass and number concentrations 273 were measured on a number of flights. These included a test flight of a new regional aircraft 274 in Xi'an, China, two commercial flights (an A319 and a B737) between Tianjin and Xi'an, and 275 three commercial flights (two A320s and one B737) between Tianjin and Chongqing, China. 276 The measurements during the commercial flights started after boarding was completed and 277 stopped when the aircraft door was opened. Since the results of the in-flight measurements 278 were similar, this section uses the data from the new regional aircraft and the commercial 279 flight from Chongqing to Tianjin on a Boeing 737 as examples. 280
12
Fig. 9(a) shows the particle mass concentrations and Fig. 9(b) the particle number 281 concentration measured inside the regional jet during the test flight. The airplane cruised at 282 two different heights: first at 10,000 ft and then 31,000 ft. On the test day, the ground PM2.5 283 and PM10 concentrations measured at the nearest monitoring station were 144 μg/m3 and 288 284 μg/m3, respectively. The particle concentration measured in the aircraft before taxiing and the 285 outside PM concentration was used in equation (1) to obtain the deposition rate. The mass 286 deposition rate was about 48% for PM2.5 and 55% for PM10. The outdoor particle number 287 concentration on the ground was 3.7×10⁵ #/L on average. Fig. 9 shows that when the jet was 288 on the ground (parked at the gate or taxiing), the particles that penetrated into the cabin were 289 mostly from the outdoor air. The particle concentration decreased after the airplane start 290 taxiing because the HEPA filter in the ECS removed some of the particles from the return air. 291 When the jet was in the air, the outdoor particle concentration decreased as the altitude 292 increased. Although we did not have detailed information on the particle concentration in the 293 outside air, the particle concentration in the cabin at 10,000 ft looks higher than that at 31,000 294 ft, which seems reasonable. There were peaks during the two cruising periods, as shown in 295 Fig. 9 (a), which may have been caused by in-flight activities. 296
297
(a)
(b)
Fig. 9. (a) PM2.5 and PM10 mass concentrations and (b) particle (>0.3μm) number concentration measured 298 inside a regional aircraft in Xi’an. 299 300
20 40 60 80 100 120 1400
50
100
150
2002014/10/22
PM2.5-Inside the cabin PM10-Inside the cabin
Par
ticle
mas
s co
ncen
trat
ion
(ug/
m3 )
Time after closing of cabin door (min)
Taxiing Cruising
Climbing
Cruising Descending
Taxiing
Door open
and climbing
0 20 40 60 80 100 120 1400.0
5.0x10⁴
1.0x10⁵
1.5x10⁵
2.0x10⁵
Par
ticle
num
ber
conc
entr
atio
n (#
/L)
Time after closing of cabin door (min)
2014/10/22 >0.3um
TaxiingCruising
Climbing
Cruising Descending
Taxiing
Door open
Start taxiing
and climbing
13
0 30 60 90 120 1500
20
40
60
80
2014/11/12Boeing 737
PM2.5 PM10
Par
ticle
ma
ss c
once
ntra
tion
(ug/
m3 )
Time after closing of cabin door (min)
Climbing
Taxiing
Cruising Descending
Taxiing
Deplaning
Cabin service36~60 min after boarding
Start taxiing
Stop taxiing
0 30 60 90 120 1500
1x10⁴
2x10⁴
3x10⁴
4x10⁴
5x10⁴
Par
ticle
num
ber
conc
entr
atio
n (#
/L)
2014/11/12Boeing 737
>0.3um
Time after closing of cabin door (min)
Turbulence(broadcast)29 min after boarding
Turbulence(broadcast)125 min after boarding
Climbing
Taxiing
Cruising Descending
Taxiing
Deplaning
Start taxiing
Stop taxiing
Fig. 10(a) shows the particle mass concentrations and Fig. 10(b) the particle number 301 concentration measured on a commercial flight (Boeing 737) from Chongqing to Tianjin. The 302 PM2.5 and PM10 mass concentrations measured at the air quality monitoring station closest to 303 the departure airport were 103 μg/m³ and 117 μg/m³, respectively. The particle mass 304 deposition rates were about 55.0% for PM2.5 and 87.5% for PM10. Greater quantities of PM2.5 305 and PM10 were deposited during this flight than during the flight on the regional jet. This 306 difference may have been caused by the longer pipelines and more complexity of the ECS on 307 the Boeing 737 than those on the regional jet. At t = 80 min, the measurements were 308 interrupted by the crew so no data was available. 309
The sudden increase in the measured particle concentrations during the cruising period 310 may have been caused by cabin meal service and/or turbulence. Li et al. [16] investigated 311 particle number concentration on several commercial flights and reported similar findings. 312
313
(a)
(b) Fig. 10. (a) PM2.5 and PM10 mass concentrations and (b) particle (>0.3μm) number concentration measured 314 on a Boeing 737 flight from Chongqing to Tianjin. 315
14
4. Discussion 316
As far as we know, the government air quality monitoring stations, such as Tianjin-1, 317 Tianjin-2, and Tianjin-3, probably used heated instruments with tapered element oscillating 318 microbalances (TEOM) technology that dried the aerosols. However, we used DustTrak that 319 was based on very different principles. A literature search revealed that a number of previous 320 studies have addressed the differences between the TEOM and DustTrak methods. Kingham 321 et al. [29] compared PM10 mass concentration data generated by a TEOM and a DustTrak 322 monitor and found a good correlation, but the DustTrak results required a substantial 323 correction factor to make the data comparable in real terms. The DustTrak monitor over-324 recorded the PM value relative to the TEOM by a factor of 2.73. According to Hill et al.[30], 325 a DustTrak monitor appeared to over-predict PM2.5 concentrations in a rural dust by a factor 326 of approximately two, and by a factor of up to three under humid conditions. Chung et al. 327 [31] found that the measurements from a DustTrak aerosol monitor overestimated PM10 328 concentration by a factor of approximately three compared to a TEOM in central California 329 under a range of winter conditions. 330
Overall, the studies show that DustTrak data correlates well with TEOM data, but 331 concentrations measured by a DustTrak monitor were two to three times higher than those 332 measured by a TEOM. This difference occurs because the heating used by the TEOM may 333 cause volatilization of semi-volatile aerosol components while the DustTrak includes 334 absorbed water in the measurements. Standard usage of PM2.5 and PM10 for health studies is 335 to use dried or heated samples to exclude water which is not a pollutant. The challenge of 336 using a wet sample is that the amount of water absorbed will depend on the humidity and also 337 on the nature of the pollutant. If pollutants (e.g., nitrates or sulfates) form a hydroscopic 338 coating on the dust particle or if the particle is sea salt, it will absorb more water. So the 339 dependence with humidity will also depend on the nature of a given pollution event. 340
In order to identify the difference between the data from the government monitoring 341 stations and that measured by DustTrak, this study compared the data measured by our 342 DustTrak monitor and that at Tianjin-1 monitoring station. Fig. 11 shows the correlations 343 between the two sets of data for PM2.5 and PM10. The DustTrak data has been multiplied by a 344 factor of 0.46, as recommended by TSI China. However, the datasets for PM2.5 and PM10 345 were still 35% and 56% higher, respectively, than those measured by the air quality 346 monitoring station. The calibration factors should be 0.3 and 0.2, respectively, rather than 347 0.46. In other words, the DustTrak overestimated the data by a factor of 3.3 and 5.0 times for 348 PM2.5 and PM10, respectively. The factors found in this investigation were slightly larger than 349 previous studies. 350
351
15
352 Fig. 11. Correlation between PM (PM2.5 and PM10) mass concentrations measured in the air quality 353 monitoring station and by a DustTrak monitor. 354 355
Since standard PM air quality instruments dehumidify samples but the DustTrak not, water 356 vapor that has absorbed onto the particles would affect the PM2.5 and PM10 results reported 357 here. The importance of humidity on these measurements may also be affected by the nature 358 and amount of the pollution event (i.e., the relative importance of dust, soot, and volatile 359 organic/inorganic compounds). More studies should be carried out in the future. 360
5. Conclusions 361
This investigation measured particle deposition in the environmental control systems of 362 commercial airplanes and a ground air-conditioning cart. This investigation aimed to study 363 the effect of heavy air pollution in Chinese airports on the aircraft ECS performance. The 364 following conclusions can be obtained based on the measured results: 365
Simultaneous measurements of particle mass and number concentrations inside and outside 366 the MD82 airplane with a GAC found that PM2.5 deposition rate in the GAC and ECS 367 accounted for 40-50% of the total particle mass. About 10% of the PM2.5 mass was deposited 368 in the GAC and 30-40% in the ECS. For particles with a diameter of 5 μm or larger, the 369 deposition rate was more than 90%, while the deposition rate of very fine particles was 370 minimal. PM10 deposition rate was expected to be very high because large particles 371 contribute more than 90% of the total mass of PM10. When the AQI value rose, both the 372 number and percentage of large particles increased. 373
This investigation measured particle mass and number concentrations during a test flight of 374 a regional jet and on several commercial flights. The results show that the particle 375 concentrations in the cabin air were high when the airplanes were on the ground. At cruising 376 altitude, the cabin air was very clean. However, cabin service and turbulence could have 377 generated significant quantities of particles in the cabin air. 378
This study used DustTrak aerosol monitors for measuring particle mass concentration, and 379 the Fluke 983 counter for particle number concentration at different sizes. The government 380 air quality monitoring stations use instrument with drying capability to measure particle mass 381 concentration. When the DustTrak mass concentrations for PM2.5 were multiplied by a factor 382 of 0.3, they were similar to those measured by a government air quality monitoring station. 383
0 100 200 300 400 500 600 7000
50
100
150
200
250
300
350
PM2.5
PM10
Y2.5
=0.65X2.5
+9.03, R2=0.893
Y10
=0.44X10
+28.10, R2=0.886
PM
mas
s co
nce
ntr
atio
n in
Tia
njin
-1 s
tatio
n (g
/m3 )
PM mass concentration by DustTrak (g/m3)
16
Funding 384
The research presented in this paper was partially supported by the National Basic 385 Research Program of China (the 973 Program) through Grant No. 2012CB720100. 386
References 387
[1] Ambient (Outdoor) Air Pollution in Cities Database 2014. 388 http://www.who.int/phe/health_topics/outdoorair/databases/cities/en/ 389
[2] China national urban air quality real-time publishing platform. 2014. 390 http://113.108.142.147:20035/emcpublish/ 391
[3] Ellermann T, Massling A, Løfstrøm P, Winther M, Nøjgaard JK, Ketzel M. Assessment of the air 392 quality at the apron of Copenhagen Airport Kastrup in relation to the occupational environment. 393 Aarhus University, DCE-Danish Centre for Environment and Energy; 2012. 394
[4] Flightstats. Airline Performance Reports; 2014. http://www.flightstats.com/ 395 [5] Shanghai CS Capital. 2013. http://www.cscapital.cn/ 396 [6] Qureshi BA, Zubair SM. The impact of fouling on performance of a vapor compression refrigeration 397
system with integrated mechanical sub-cooling system. Appl Energ 2012;92:750-62. 398 [7] Zhang J, Li A, Li D. Modeling deposition of particles in typical horizontal ventilation duct flows. 399
Energ Convers Manage 2008;49:3672-83. 400 [8] Li A, Liu Z, Zhu X, Liu Y, Wang Q. The effect of air-conditioning parameters and deposition dust on 401
microbial growth in supply air ducts. Energ Buildings 2010;42:449-54. 402 [9] Sippola MR. Particle deposition in ventilation ducts. Lawrence Berkeley National Laboratory 2002. 403 [10] Zhu Y, Fanning E, Yu RC, Zhang Q, Froines JR. Aircraft emissions and local air quality impacts from 404
takeoff activities at a large International Airport. Atmos Environ 2011;45:6526-33. 405 [11] Fang G-C, Wu Y-S, Lee W-J, Chou T-Y, Lin I-C. Study of ambient air particulates pollutants near 406
Taichung airport sampling site in central Taiwan. J. Hazard Mater 2007;144:492-8. 407 [12] Schwarze P, Øvrevik J, Låg M, Refsnes M, Nafstad P, Hetland R, Dybing E. Particulate matter 408
properties and health effects: consistency of epidemiological and toxicological studies. Hum Exp 409 Toxicol 2006;25:559-79. 410
[13] Lee SC, Poon CS, Li XD, Luk F. Indoor air quality investigation on commercial aircraft. Indoor Air 411 1999;9:180-7. 412
[14] Spicer CW, Murphy MJ, Holdren MW, Myers JD, MacGregor IC, Holloman C, James RR, Tucker K, 413 Zaborski R. Relate air quality and other factors to comfort and health symptoms reported by 414 passengers and crew on commercial transport aircraft (Part I), ASHRAE Project 1262-TRP, American 415 Society for Heating, Refrigerating and Air Conditioning Engineers. Atlanta. 2004. 416
[15] Spengler JD, Vallarino J, McNeely E, Estephan H, Sumner AL. In-flight/onboard monitoring: 417 ACER’s component for ASHRAE 1262, Part 2, Report No. RITE-ACER-CoE-2012-6 National Air 418 Transportation Center of Excellence for Research in the Intermodal Transport Environment (RITE)–419 Airliner Cabin Environmental Research (ACER) Program. 2012. 420
[16] Li Z, Guan J, Yang X., Lin C-H. Source apportionment of airborne particles in commercial aircraft 421 cabin environment: Contributions from outside and inside of cabin. Atmos Environ 2014;89:119-28. 422
[17] Wang S, Zhao B, Zhou B, Tan Z. An experimental study on short-time particle resuspension from 423 inner surfaces of straight ventilation ducts. Build Environ 2012;53:119-27. 424
[18] Zhao P, Dong F, He D, Zhao X, Zhang X, Zhang W, Yao Q, Liu H. Characteristics of concentrations 425 and chemical compositions for PM 2.5 in the region of Beijing, Tianjin, and Hebei, China. Atmos 426 Chem Phys 2013;13:4631-44. 427
[19] Sarwar G, Corsi R, Allen D, Weschler C. The significance of secondary organic aerosol formation and 428 growth in buildings: experimental and computational evidence. Atmos Environ 2003;37:1365-81. 429
[20] Fan Z, Weschler CJ, Han I-K, Zhang JJ. Co-formation of hydroperoxides and ultra-fine particles 430 during the reactions of ozone with a complex VOC mixture under simulated indoor conditions. Atmos 431 Environ 2005;39:5171-82. 432
[21] Rai AC, Guo B, Lin C-H, Zhang J, Pei J, Chen Q. Ozone reaction with clothing and its initiated 433 particle generation in an environmental chamber. Atmos Environ 2013; 77:885-92. 434
[22] Weschler CJ, Shields HC. Experiments probing the influence of air exchange rates on secondary 435 organic aerosols derived from indoor chemistry. Atmos Environ 2003;37:5621-31. 436
17
[23] Fan Z, Lioy P, Weschler C, Fiedler N, Kipen H, Zhang J. Ozone-initiated reactions with mixtures of 437 volatile organic compounds under simulated indoor conditions. Environ Sci Technol 2003;37:1811-438 21. 439
[24] Rohr AC, Weschler CJ, Koutrakis P, Spengler JD. Generation and quantification of ultrafine particles 440 through terpene/ozone reaction in a chamber setting. Aerosol Sci Tech 2003;37:65-78. 441
[25] Sarwar G, Olson DA, Corsi RL, Weschler CJ. Indoor fine particles: the role of terpene emissions from 442 consumer products. J Air Waste Manage Assoc 2004;54:367-77. 443
[26] Toftum J, Freund S, Salthammer T, Weschler CJ. Secondary organic aerosols from ozone-initiated 444 reactions with emissions from wood-based materials and a “green” paint. Atmos Environ 445 2008;42:7632-40. 446
[27] Lamorena RB, Lee W. Influence of ozone concentration and temperature on ultra-fine particle and 447 gaseous volatile organic compound formations generated during the ozone-initiated reactions with 448 emitted terpenes from a car air freshener. J Hazard Mater 2008;158:471-7. 449
[28] Langer S, Moldanová J, Arrhenius K, Ljungström E, Ekberg L. Ultrafine particles produced by 450 ozone/limonene reactions in indoor air under low/closed ventilation conditions. Atmos Environ 2008 451 42:4149-59. 452
[29] Kingham S, Durand M, Aberkane T, Harrison J, Wilson JG, Epton M. Winter comparison of TEOM, 453 MiniVol and DustTrak PM 10 monitors in a woodsmoke environment. Atmos Environ 2006;40:338-454 47. 455
[30] Hill LB, Zimmerman NJ, Gooch J, Force CAT. A multi-city investigation of the effectiveness of 456 retrofit emissions controls in reducing exposures to particulate matter in school buses. Clean Air Task 457 Force Boston, MA; 2005. 458
[31] Chung A, Chang DP, Kleeman MJ, Perry KD, Cahill TA, Dutcher D, McDougall EM, Stroud K. 459 Comparison of real-time instruments used to monitor airborne particulate matter. J Air Waste Manage 460 Assoc 2001;51:109-20. 461