Page 1
Experimental study on cavitating flow in an axisymmetric system
WANG Jian1*, WANG Yong2 and Matevž DULAR3
1. School of Shipping and Mechatronic Engineering, Taizhou University, Taizhou 225300, China
2. Research Center of Fluid Machinery Engineering and Technology, Jiangsu University, Zhenjiang 212013, Jiangsu, China
3. Laboratory for Water and Turbine Machines, Faculty of Mechanical Engineering, University of Ljubljana, Askerceva 6, 1000 Ljubljana, Slovenia
Abstract
We experimentally studied the cavitating flow in an axisymmetric system, aiming at finding reliable approaches to analyze
cavitation. Three image post-processed approaches were applied to analyze the test data, in order to obtain the cavitation
characteristics. The cavitating flow pattern was studied by high speed images. In one cavitation developing period, there could be
three distinct cavitation clouds, whereas the second one is not fully developed. The first image post-processing approach was
applied to obtain the mean value and standard deviation distribution, which indicate the erosion area may cover almost all the
cavitation developing route and the most vulnerable erosion area locates near the cavitation collapse site. It is coincides with the
erosion tests analyzed through the pit-count algorithm approach. The cavitation circulation frequency was invested via PSD
analysis approach. It shows that the frequency linearly decreasing with decreasing cavitation number. Additionally, the cavitation
intensity effect on cavitation erosion was quantitatively studied based. It is found that the damages are strongly enhanced when
increasing the flow velocity. Moreover, the growth rate of eroded pits number is actually stepwise instead of linear (similar to our
previous work in a venturi tube), which supports the idea that the cloud cavitation collapse is the primary reason for erosion. The
present approaches applied here shows good potential ability of investigating cavitating flows and can be utilized for other
apparatus.
Key words: Cavitating flow; Cavitation erosion; Visualization; Collapse; Orifice plate
*Corresponding Author: Tel:+86 13775530081
E-mail address: [email protected]
Page 2
1. Introduction
Cavitation is defined as bubbles generation. It happens
where the local pressure is below the liquid saturation
pressure, and then the bubbles collapse when they are
convected downstream, because of pressure recovery. If the
collapse occurs in the vicinity of solid wall, the shock wave
or micro jet generated during this process would erode the
surface of the rigid boundary. As the energy impacting on
the surface exceeds the material’s fatigue strength, then
erosion happens. Such damage pattern is found almost in
every hydrodynamic machines, like vessels, propellers,
pumps and so on, resulting in enormous economic lose
[1-6].
Remarkable attempts have been made to clarify the
physical mechanism of cavitation erosion, since last
century in 1917 Rayleigh discussed about the issue of
cavitation erosion on ship propellers [7]. The intensity of
the shock wave emitted by bubbles collapse is one of the
most important factors resulting in cavitation erosion,
which could reach several GPa [8-9]. Various measurement
approaches are applied to obtain the impact load on solid
surface. But it seems like that different approaches might
get different results. Franc et al. [10] tested the cavitation
generated by two parallel circular plates with a straight
nozzle on one of them in the center, and the other one was
placed 2.5mm away as the eroded sample. A maximum
impact load of 500N was measured via a conventional
pressure transducer as the cavity velocity ranges from
45m/s to 90m/s. However, Carnelli et al. [11] only got an
order of 20N impact load on a same test system by using
the spherical nanoindentation measurement. Also, Hattori
et al. [12] obtained similar results (a maximum impact load
of 20N) at flow velocity up to 184m/s by following the
standard ASTM G124-95. Furthermore, Soyama et al. [13]
employed the poly vinylidene fluoride (PVDF) to measure
the impact load in a cavitating jet device. It turned out to be
up to 200N when the jet velocity at the nozzle outlet ranges
from 126m/s to 155m/s. The discrepancy between these
tests was significant. One of the reasons lies in that the size
of the pressure transducers adopted in these works are still
larger than the tiny bubbles, although they are ―micro‖. The
measured impact load may be caused by several bubbles
collapse. And the lower sampling frequency of the pressure
transducer, compared with the fast progress of collapse,
could also influence the test result.
Another prevalent measurement is the pitting test, first
proposed by Knapp in the 1950s [14-15]. By exposing the
solid material to a cavitating flow, it is used as a transducer
during the erosion incubation period, which means the
material only suffers plastic deformation without mass loss.
In this way, one can obtain the distribution of pits and even
the number and area, but such erosion experiments still
require a long exposure time [16-20]. Hutli et al. [19] tested
the cavitation erosion process by exposing the copper
samples to a high speed submerged cavitating jet for 30min.
Rijsbergen et al. [20] tested cavitating flow around a 2D
NACA hydrofoil, aiming at studying the sheet cavitation
collapse behavior and related erosion mechanism. The
detailed cavitation evolution structures were captured from
side and top views by two high speed cameras. And the
cavitation erosion was measured by oil painting method for
1 hour. Such long testing time makes it difficult to
investigate the relationship between cavitation structures
and erosion. A common way to solve this issue is the
utilization of softer material as the transducer [21-22].
Recently, our previous work applied a thin aluminum foil
attached on the solid surface as an erosion sensor. The tests
only lasted few seconds to minutes, which enabled us to
record the cavitation erosion progress and the cavitation
evolution synchronously by high speed camera [23-25].
The results presented a strong demonstration that the cloud
cavity separation and collapse are responsible for the
damage.
In the meantime, great effort has been made on the
prediction of cavitation erosion, based on various
mechanisms [26-31]. And most of them were conducted by
CFD method. A recent study performed by Gavaises et al
[32] predicted the cavitation area in an axisymmetric
geometry (similar to the current work) via both
visualization and CFD approaches, in order to correlate the
eroded location with the location of cavitation development.
The simulation results had great agreement with the
visualizations.
In the present study, we performed jet flow cavitation
tests through two adjacent parallel plates with a nozzle
tube—orifice plate. Aiming at providing insight into the
details of the correlation between cloud cavitation collapse
and cavitation-induced erosion, and establishing fully
experimental methods for investigating different cavitating
Page 3
devices, three image post-processing approaches were
employed to analyze the cavitation characteristics. The
prediction results were validated by cavitation erosion tests.
2. Experimental setup
All the experiments were conducted in a cavitation
loop test platform in the Laboratory for Water and Turbine
Machines, University of Ljubljana. As seen in Fig. 1, the
entire closed test system was driven by a loop pump, a
upstream tank which can be used for water heating, a
downstream tank which is connected with a compressor
and a vacuum pump for controlling the system pressure, a
test section composed of two parallel plates, an
electromagnetic flow meter, ABB WaterMaster V with a
measurement uncertainty of 2% and two pressure
transducers, ABB 266AST with ±0.04% measurement
uncertainty. Hence, the measurement uncertainties due to
instruments was estimated less than 3%. The detailed test
rig facilities can be referred in [25]. In the attempt of
obtaining the full cavitation erosion data from the very
beginning of the cavitation being generated, two valves are
mounted upstream and downstream from the test section,
far enough for avoiding disturbance. To assure the test
repeatability, the dissolved gases were measured by the
Van-Slyke method [33] after running the test rig for 30 min
at a low pressure, since the dissolved gases have significant
influence on cavitation. In the presented work, the gas
content of 15 mg/L in water was maintained.
Fig. 1 Test rig
①Loop pump ②Downstream tank ③Orifice plates ④Upstream
tank ⑤⑥Valves ⑦Electromagnetic flow meter ⑧Heater
⑨Pressure transducer ⑩Compressor ⑪Vacuum pump
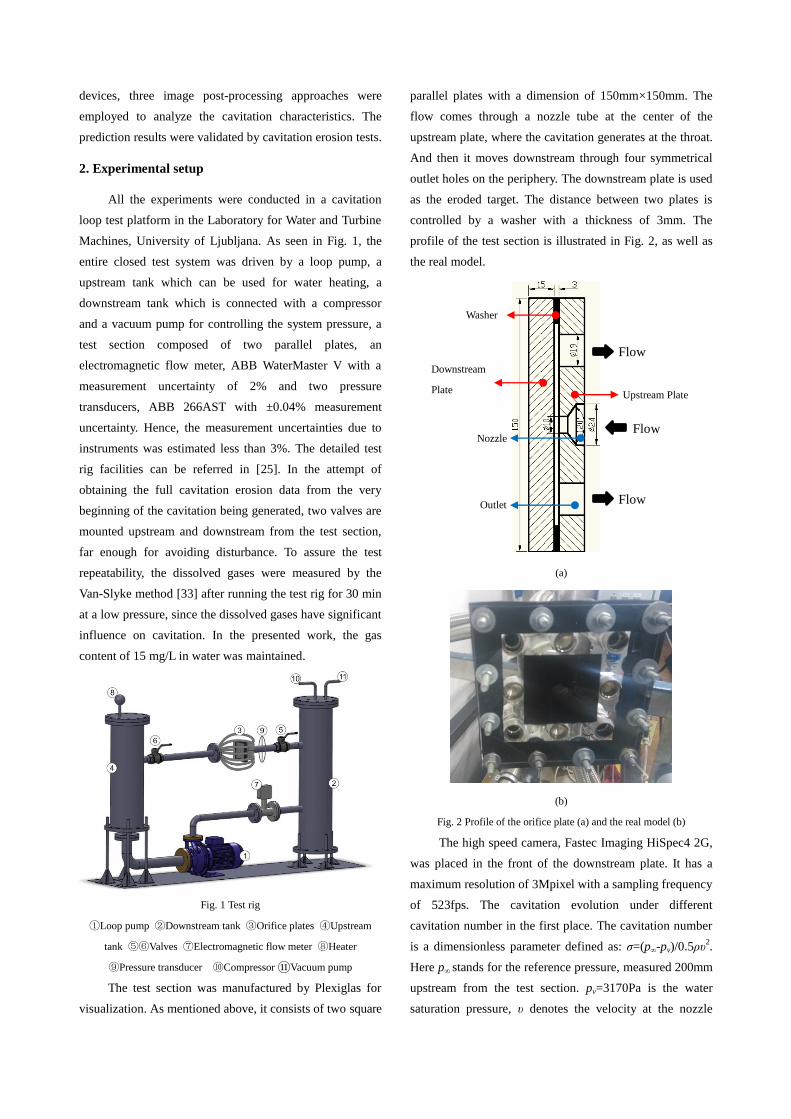
The test section was manufactured by Plexiglas for
visualization. As mentioned above, it consists of two square
parallel plates with a dimension of 150mm×150mm. The
flow comes through a nozzle tube at the center of the
upstream plate, where the cavitation generates at the throat.
And then it moves downstream through four symmetrical
outlet holes on the periphery. The downstream plate is used
as the eroded target. The distance between two plates is
controlled by a washer with a thickness of 3mm. The
profile of the test section is illustrated in Fig. 2, as well as
the real model.
(a)
(b)
Fig. 2 Profile of the orifice plate (a) and the real model (b)
The high speed camera, Fastec Imaging HiSpec4 2G,
was placed in the front of the downstream plate. It has a
maximum resolution of 3Mpixel with a sampling frequency
of 523fps. The cavitation evolution under different
cavitation number in the first place. The cavitation number
is a dimensionless parameter defined as: σ=(p∞-pv)/0.5ρυ2.
Here p∞ stands for the reference pressure, measured 200mm
upstream from the test section. pv=3170Pa is the water
saturation pressure, υ denotes the velocity at the nozzle
Washer
Downstream
Plate Upstream Plate
Nozzle Flow
Flow
Outlet Flow
Page 4
throat and ρ=998.2kg/m3 means the water density.
During the cavitation erosion tests, the pump was
firstly operated at a low frequency to get the water
circulating in the system at a low velocity without any
cavitation. Then, the desired operating condition was set by
closing the upstream valve and switched the pump
operating frequency. At the end, the desired operating
condition was achieved by opening the upstream valve
rapidly. The cavitation damages were measured by a 10μm
thick aluminum foil attaching on the downstream plate.
The eroded progress was also recorded by high speed
camera, since the exposure time only lasts for 5min. The
whole test section is symmetrical, so the foil only covers
part of the surface, as shown in Fig. 3.
Fig. 3 Aluminum foil attached downstream plate
Fig. 4 Cavitation structure under various cavitation numbers
3. Results and discussions
Fig. 4 shows the instantaneous cavitation structures
under various cavitation numbers. These successive images
were recorded by high speed camera at a shooting
frequency of 2773fps for 2min.
As seen, the cavitation structure is annular, and the
size increases with the decreasing cavitation number. For
σ=3.36, the length reaches 26.9mm (from the cavitation
inception point to collapse point), while it is only 6.1mm at
σ=5.15. Also, because the distance between two plates is
only 3mm, we can note that the generated cloud cavitation
is composed of numerous tiny bubble clusters.
For predicting the eroded areas, the successive
images of the cavitation structure were post-processed by
calculating the standard deviation valve. Each image is
treated as matrix, within which every each element
Cavitation
Length
σ=4.56 σ=3.80 σ=3.57
σ=3.41 σ=3.37 σ=3.21
Page 5
Fig. 5 Mean value (upper) and standard deviation distribution (below) under various cavitation numbers
σ=4.56 σ=3.80 σ=3.57
σ=3.41 σ=3.37 σ=3.21
μ
μ
ζ
ζ ζ ζ
ζ ζ
μ μ
μ μ
Erosion
Diameter
Page 6
indicates one pixel. More details concerning to the applied
post-processing approach can be found in ref. [34].
Fig. 5 presents the mean value and standard deviation
distribution under various cavitation numbers. From which,
we can identify the cavitation covering area via the mean
value distribution, and predict the potential eroded area
through the standard deviation distribution. One can notice
that the size of the mean value and standard deviation
distributions are almost identical with each other. However,
the contours are not that analogous when the cavitation
number drops below 3.41. The standard deviation indicates
that the most potential erosion region locates on the
periphery with highest deviation value, while the most
covered cavitation region given by the mean value lie in the
middle of the contour (The scales of the standard deviation
and mean value are used for better image contrast to
identify the cavity covered region and potential erosion
region). When the cavitation number goes above 3.57, the
distributions are nearly the same. The reason is that as the
cavitation number decreases, the cavitation evolution
process becomes more distinct and regular. As a result, the
likely eroded area concentrates at the sites where collapse
occurs, making it prone to be damaged by emitted shock
wave or jet flow. Whereas the cavitation evolution is a little
irregular as the cavitation number is higher. Besides, one
may find that the distribution is not strict symmetrical. We
reckon that it is probably caused by the uneven screw
intension.
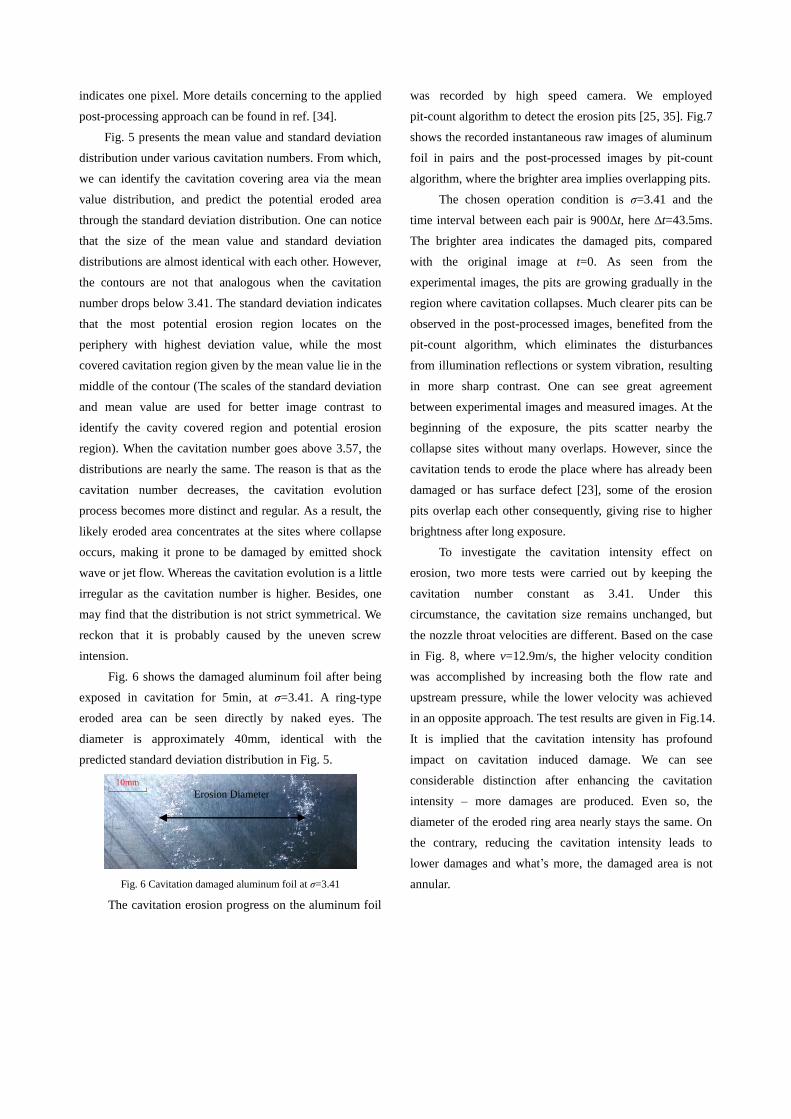
Fig. 6 shows the damaged aluminum foil after being
exposed in cavitation for 5min, at σ=3.41. A ring-type
eroded area can be seen directly by naked eyes. The
diameter is approximately 40mm, identical with the
predicted standard deviation distribution in Fig. 5.
Fig. 6 Cavitation damaged aluminum foil at σ=3.41
The cavitation erosion progress on the aluminum foil
was recorded by high speed camera. We employed
pit-count algorithm to detect the erosion pits [25, 35]. Fig.7
shows the recorded instantaneous raw images of aluminum
foil in pairs and the post-processed images by pit-count
algorithm, where the brighter area implies overlapping pits.
The chosen operation condition is σ=3.41 and the
time interval between each pair is 900∆t, here ∆t=43.5ms.
The brighter area indicates the damaged pits, compared
with the original image at t=0. As seen from the
experimental images, the pits are growing gradually in the
region where cavitation collapses. Much clearer pits can be
observed in the post-processed images, benefited from the
pit-count algorithm, which eliminates the disturbances
from illumination reflections or system vibration, resulting
in more sharp contrast. One can see great agreement
between experimental images and measured images. At the
beginning of the exposure, the pits scatter nearby the
collapse sites without many overlaps. However, since the
cavitation tends to erode the place where has already been
damaged or has surface defect [23], some of the erosion
pits overlap each other consequently, giving rise to higher
brightness after long exposure.
To investigate the cavitation intensity effect on
erosion, two more tests were carried out by keeping the
cavitation number constant as 3.41. Under this
circumstance, the cavitation size remains unchanged, but
the nozzle throat velocities are different. Based on the case
in Fig. 8, where v=12.9m/s, the higher velocity condition
was accomplished by increasing both the flow rate and
upstream pressure, while the lower velocity was achieved
in an opposite approach. The test results are given in Fig.14.
It is implied that the cavitation intensity has profound
impact on cavitation induced damage. We can see
considerable distinction after enhancing the cavitation
intensity – more damages are produced. Even so, the
diameter of the eroded ring area nearly stays the same. On
the contrary, reducing the cavitation intensity leads to
lower damages and what’s more, the damaged area is not
annular.
Erosion Diameter
Page 7
Fig. 7 Raw images of recorded aluminum foil (upper), post-processed images (middle) and predicted results of the eroded area at this instant (down)
at σ=3.41
Fig. 8 Cavitation erosion tests under different velocity at constant cavitation number σ=3.41
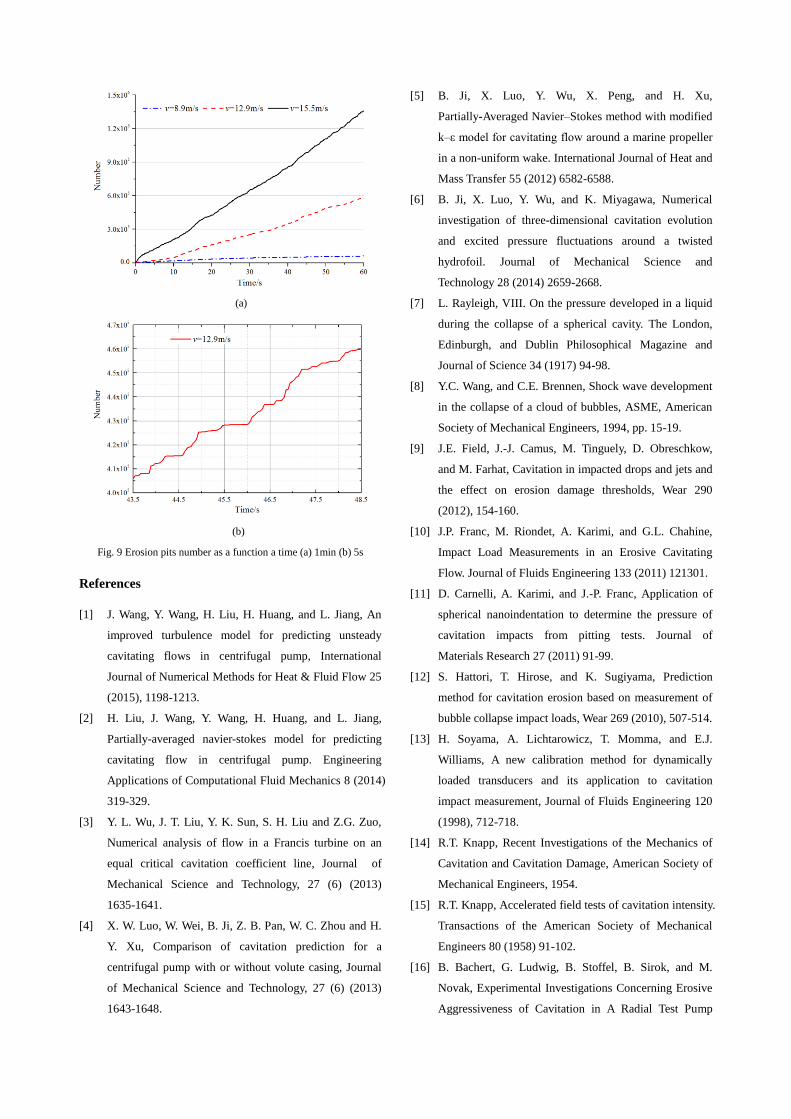
On the basis of the pit-count algorithm, the pits
number accumulation as a function of time is obtained, as
plotted in Fig. 9(a). It obviously indicates that the
cavitation intensity significantly increase the damage
process. The growth rate increases linearly with increasing
velocity when keeping the cavitation number constant. To
be more precise, we focus on a smaller time range from
43.5s to 48.5s. The case of v=12.9m/s is selected, as shown
in Fig. 9(b). We can find that instead of a straightly linear
pits increment, it presents a stepwise growth pattern. The
reason lies in that the pits are mainly caused by the periodic
cavitation collapse [25, 30], during the cavitation growing
time, only a few pits could be generated.
t=0
t=1800∆t
t=3600∆t
t=5400∆t
v=15.5m/s v=8.9m/s
Page 8
(a)
(b)
Fig. 9 Erosion pits number as a function a time (a) 1min (b) 5s
References
[1] J. Wang, Y. Wang, H. Liu, H. Huang, and L. Jiang, An
improved turbulence model for predicting unsteady
cavitating flows in centrifugal pump, International
Journal of Numerical Methods for Heat & Fluid Flow 25
(2015), 1198-1213.
[2] H. Liu, J. Wang, Y. Wang, H. Huang, and L. Jiang,
Partially-averaged navier-stokes model for predicting
cavitating flow in centrifugal pump. Engineering
Applications of Computational Fluid Mechanics 8 (2014)
319-329.
[3] Y. L. Wu, J. T. Liu, Y. K. Sun, S. H. Liu and Z.G. Zuo,
Numerical analysis of flow in a Francis turbine on an
equal critical cavitation coefficient line, Journal of
Mechanical Science and Technology, 27 (6) (2013)
1635-1641.
[4] X. W. Luo, W. Wei, B. Ji, Z. B. Pan, W. C. Zhou and H.
Y. Xu, Comparison of cavitation prediction for a
centrifugal pump with or without volute casing, Journal
of Mechanical Science and Technology, 27 (6) (2013)
1643-1648.
[5] B. Ji, X. Luo, Y. Wu, X. Peng, and H. Xu,
Partially-Averaged Navier–Stokes method with modified
k–ε model for cavitating flow around a marine propeller
in a non-uniform wake. International Journal of Heat and
Mass Transfer 55 (2012) 6582-6588.
[6] B. Ji, X. Luo, Y. Wu, and K. Miyagawa, Numerical
investigation of three-dimensional cavitation evolution
and excited pressure fluctuations around a twisted
hydrofoil. Journal of Mechanical Science and
Technology 28 (2014) 2659-2668.
[7] L. Rayleigh, VIII. On the pressure developed in a liquid
during the collapse of a spherical cavity. The London,
Edinburgh, and Dublin Philosophical Magazine and
Journal of Science 34 (1917) 94-98.
[8] Y.C. Wang, and C.E. Brennen, Shock wave development
in the collapse of a cloud of bubbles, ASME, American
Society of Mechanical Engineers, 1994, pp. 15-19.
[9] J.E. Field, J.-J. Camus, M. Tinguely, D. Obreschkow,
and M. Farhat, Cavitation in impacted drops and jets and
the effect on erosion damage thresholds, Wear 290
(2012), 154-160.
[10] J.P. Franc, M. Riondet, A. Karimi, and G.L. Chahine,
Impact Load Measurements in an Erosive Cavitating
Flow. Journal of Fluids Engineering 133 (2011) 121301.
[11] D. Carnelli, A. Karimi, and J.-P. Franc, Application of
spherical nanoindentation to determine the pressure of
cavitation impacts from pitting tests. Journal of
Materials Research 27 (2011) 91-99.
[12] S. Hattori, T. Hirose, and K. Sugiyama, Prediction
method for cavitation erosion based on measurement of
bubble collapse impact loads, Wear 269 (2010), 507-514.
[13] H. Soyama, A. Lichtarowicz, T. Momma, and E.J.
Williams, A new calibration method for dynamically
loaded transducers and its application to cavitation
impact measurement, Journal of Fluids Engineering 120
(1998), 712-718.
[14] R.T. Knapp, Recent Investigations of the Mechanics of
Cavitation and Cavitation Damage, American Society of
Mechanical Engineers, 1954.
[15] R.T. Knapp, Accelerated field tests of cavitation intensity.
Transactions of the American Society of Mechanical
Engineers 80 (1958) 91-102.
[16] B. Bachert, G. Ludwig, B. Stoffel, B. Sirok, and M.
Novak, Experimental Investigations Concerning Erosive
Aggressiveness of Cavitation in A Radial Test Pump
Page 9
with The Aid of Adhesive Copper Films, Proceedings of
the 5th International Symposium on Cavitation,
CAV2003, Japan, 2003.
[17] E. Hutli, M.S. Nedeljkovic, A. Bonyár, and D. Légrády,
Experimental study on the influence of geometrical
parameters on the cavitation erosion characteristics of
high speed submerged jets, Experimental Thermal and
Fluid Science 80 (2017), 281-292.
[18] J.R. Laguna-Camacho, R. Lewis, M. Vite-Torres, and J.V.
Méndez-Méndez, A study of cavitation erosion on
engineering materials, Wear 301 (2013), 467-476.
[19] J.P. Franc, Incubation time and cavitation erosion rate of
work-hardening materials, Journal of Fluids Engineering
131 (2009), 021303.
[20] M. Rijsbergen, E. J. Foeth, P. Fitzsimmons, and A.
Boorsma, High-Speed Video Observations and
Acoustic-Impact Measurements on a NACA 0015 foil,
Proceedings of the 8th International Symposium on
Cavitation, CAV2012, Singapore, 2012.
[21] S. Lavigne, A. Retailleau, and J. Woillez, Measurement
of the aggressivity of erosive cavitating flows by a
technique of pits analysis. Application to a method of
prediction of erosion, Proc. Int. Symp. Cavitation
CAV95, 1995.
[22] X. Escaler, M. Farhat, F. Avellan, and E. Egusquiza,
Cavitation erosion tests on a 2d hydrofoil using
surface-mounted obstacles, Wear 254 (2003), 441-449.
[23] M. Dular, and A. Osterman, Pit clustering in cavitation
erosion. Wear 265 (2008) 811-820.
[24] M. Dular, O.C. Delgosha, and M. Petkovsek,
Observations of cavitation erosion pit formation.
Ultrason Sonochem 20 (2013) 1113-1120.
[25] M. Petkovšek, and M. Dular, Simultaneous observation
of cavitation structures and cavitation erosion. Wear 300
(2013) 55-64.
[26] G.Bark, and R.E. Bensow, Hydrodynamic mechanisms
controlling cavitation erosion, International Shipbuilding
Progress 60 (2013), 345-374.
[27] R.F. Patella, A. Archer, and C. Flageul, Numerical and
experimental investigations on cavitation erosion, IOP
Conference Series: Earth and Environmental Science,
vol. 15, 2012.
[28] M. Dular, B. Stoffel, and B. Širok, Development of a
cavitation erosion model, Wear 261 (2006), 642-655.
[29] N. Ochiai, Y. Iga, M. Nohmi, and T. Ikohagi, "Numerical
prediction of cavitation erosion in cavitating flow,"
Proceedings of the 7th International Symposium on
Cavitation, CAV2009, USA, 2009.
[30] J. Wang, M. Petkovšek, H.l. Liu, B. Širok, and M. Dular,
Combined numerical and experimental investigation of
the cavitation erosion process, Journal of Fluids
Engineering 137 (2015), 051302.
[31] Z.R. Li, M. Pourquie, and T. van Terwisga, Assessment
of cavitation erosion with a URANS method, Journal of
Fluids Engineering 136 (2014), 041101.
[32] M. Gavaises, F. Villa, P. Koukouvinis, M. Marengo, and
J.-P. Franc, Visualisation and les simulation of cavitation
cloud formation and collapse in an axisymmetric
geometry, International Journal of Multiphase Flow 68
(2015), 14-26.
[33] F. Brand, Ein physikalisches verfahren zur bestimmung
von geloesten und ungeloesten gasen in wasser, Voith
Forschung und Konstruktion 27 (1981).
[34] M. Dular, B. Bachert, B. Stoffel, and B. Širok,
Relationship between cavitation structures and cavitation
damage. Wear 257 (2004) 1176-1184.
[35] T. Keil, P.F. Pelz, U. Cordes, and G. Ludwig, Cloud
cavitation and cavitation erosion in convergent divergent
nozzle, WIMRC 3rd International Cavitation Forum
2011, University of Warwick, UK, (2011) 1-7.