IOSR Journal of Mechanical and Civil Engineering (IOSR-JMCE) e-ISSN: 2278-1684,p-ISSN: 2320-334X, Volume 8, Issue 6 (Sep. - Oct. 2013), PP 53-65 www.iosrjournals.org www.iosrjournals.org 53 | Page Experimental Study on Performance of Recycled Concrete Aggregate as Course Aggregate and Silica Fume As Partial Replacement for Cement with Different Water Binder Ratio K.M.Gopalakrishnan 1 , G.Nithyaprakash 2 , E.Sivaraj 3 , Dr.R.Murugesan 4 1 & 2 Assistant Professor, Erode Sengunthar Engineering College,3-Sivaraj Timbers& 4- Professor, IRTT, Erode I. Chapter 1.1 INTRODUCTION: One of the construction sector’s major contributions to the preservation of the environment and sustainable development is the reuse and recycling of the waste materials it generates (reducing, reusing, recycling and regenerating the residues that originate the constructive activity). One way of achieving this is to introduce recycled aggregates from construction and demolition debris and rubble into the production processes. This increases the life cycle of these materials, thereby reducing the amount of waste dumping and natural resource extraction. 1.2 ADVANTAGES OF RECYCLED CONCRETE AGGREGATE There are many advantages through using the recycled aggregate. The advantages that occur through usage of recycled aggregate are 1. Environmental Gain 2. Save Energy 3. Cost 1.3 SILICA FUME IN CONCRETE: The American concrete institute (ACI) defines Silica fume as, “Very non-crystalline silica produced in electric furnaces as a by product of the production of elemental silicon alloys containing silicon” Silica fume usually referred as 1) Condensed Silica Fume 2) Micro Silica 3) Volatized Silica. 1.4 SCOPE OF THE INVESTIGATION: To determine the strength characteristic of Recycled Concrete Aggregate and to determine the optimum level of replacement of Natural Coarse Aggregate by Recycled Concrete Aggregate To determine the strength characteristic of concrete by adding the Silica fume as a partial replacement for different water- binder ratio and to conduct the durability studies. II. Chapter 2.1 PROPERTIES OF MATERIALS 2.1.1 INTRODUCTION Experiments were conducted to study the physical and mechanical properties of materials such as Cement, Sand, Natural Coarse Aggregate and Recycled Concrete Aggregate (NCA & RCA) the results are shown in Table 2.1 to 2.4. 2.1.2 SILICA FUME Table – 2.1 Chemical Properties of Silica fume Constituent Percentage (%) Constituent Percentage (%) SiO2 90-96 Na2O 0.2-0.7 Al2O3 0.5-0.8 K2O 0.4-1.0 MgO 0.5-1.5 C 0.5-1.4 Fe2O3 0.2-0.8 S 0.1-0.4 CaO 0.1-0.5 Loss of Ignition 0.7-2.5
Transcript
IOSR Journal of Mechanical and Civil Engineering (IOSR-JMCE)
Experimental Study on Performance of Recycled Concrete
Aggregate as Course Aggregate and Silica Fume As Partial
Replacement for Cement with Different Water Binder Ratio
K.M.Gopalakrishnan1, G.Nithyaprakash
2, E.Sivaraj
3, Dr.R.Murugesan
4 1 & 2
Assistant Professor, Erode Sengunthar Engineering College,3-Sivaraj Timbers& 4- Professor, IRTT, Erode
I. Chapter 1.1 INTRODUCTION:
One of the construction sector’s major contributions to the preservation of the environment and
sustainable development is the reuse and recycling of the waste materials it generates (reducing, reusing,
recycling and regenerating the residues that originate the constructive activity). One way of achieving this is to introduce recycled aggregates from construction and demolition debris and rubble into the production processes.
This increases the life cycle of these materials, thereby reducing the amount of waste dumping and natural
resource extraction.
1.2 ADVANTAGES OF RECYCLED CONCRETE AGGREGATE
There are many advantages through using the recycled aggregate. The advantages that occur through
usage of recycled aggregate are
1. Environmental Gain
2. Save Energy
3. Cost
1.3 SILICA FUME IN CONCRETE:
The American concrete institute (ACI) defines Silica fume as, “Very non-crystalline silica produced in
electric furnaces as a by product of the production of elemental silicon alloys containing silicon” Silica fume
usually referred as
1) Condensed Silica Fume
2) Micro Silica
3) Volatized Silica.
1.4 SCOPE OF THE INVESTIGATION:
To determine the strength characteristic of Recycled Concrete Aggregate and to determine the optimum
level of replacement of Natural Coarse Aggregate by Recycled Concrete Aggregate To determine the strength characteristic of concrete by adding the Silica fume as a partial replacement for
different water- binder ratio and to conduct the durability studies.
II. Chapter 2.1 PROPERTIES OF MATERIALS
2.1.1 INTRODUCTION
Experiments were conducted to study the physical and mechanical properties of materials such as
Cement, Sand, Natural Coarse Aggregate and Recycled Concrete Aggregate (NCA & RCA) the results are
Experimental Study On Performance Of Recycled Concrete Aggregate As Coarse Aggregate And
www.iosrjournals.org 54 | Page
2.1.3 RECYCLED CONCRETE AGGREGATE
Table – 2.2 Properties of RCA
Sl
.no Properties
0% RCA +
100 %
NCA
10% RCA
+
90% NCA
20%
RCA
+
80%
NCA
30%
RCA
+
70%
NCA
40%
RCA
+
60%
NCA
50%
RCA
+
50%
NCA
1 Specific
gravity 2.81 2.85 2.70 2.85 3.05 3.27
2 Impact value
in percentage 16 20.8 21 22 22.7 23.6
3
Los Angeles
Abrasion
value in
percentage
28.5 29 29.5 29.7 30.6 31.4
4
Aggregate
Crushing
Value
28.25 29 29.3 29.8 32 33.25
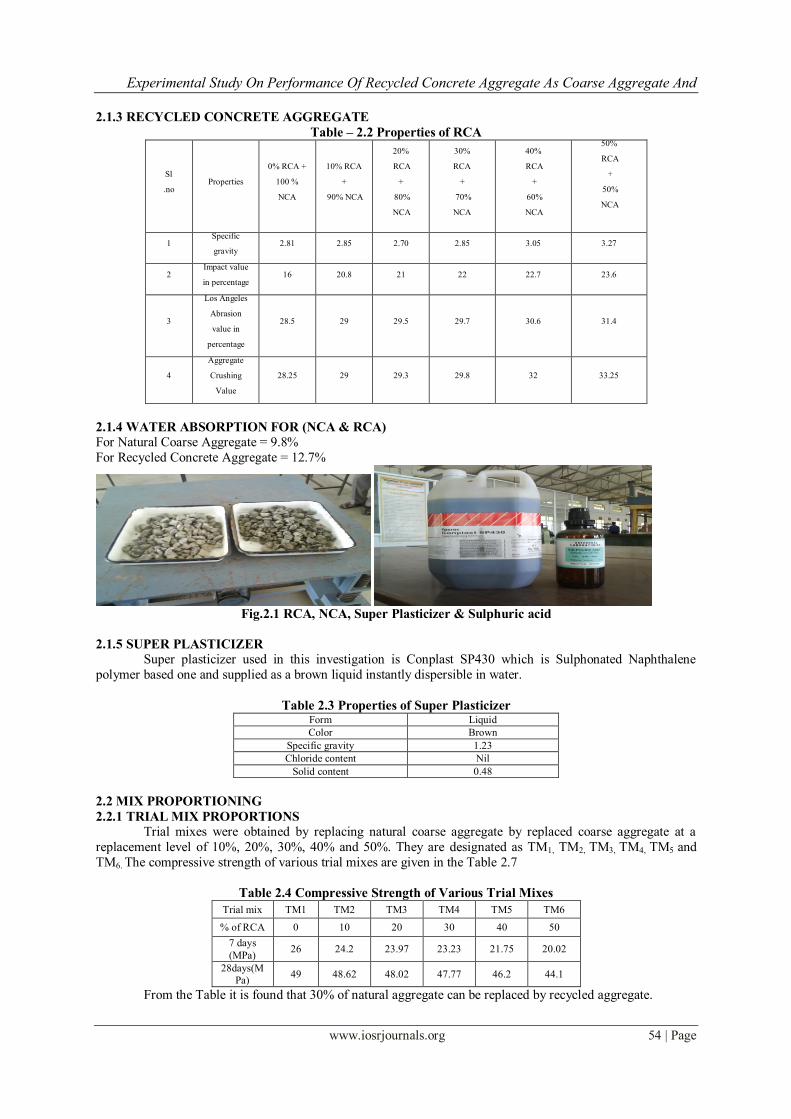
2.1.4 WATER ABSORPTION FOR (NCA & RCA)
For Natural Coarse Aggregate = 9.8%
For Recycled Concrete Aggregate = 12.7%
Fig.2.1 RCA, NCA, Super Plasticizer & Sulphuric acid
2.1.5 SUPER PLASTICIZER
Super plasticizer used in this investigation is Conplast SP430 which is Sulphonated Naphthalene
polymer based one and supplied as a brown liquid instantly dispersible in water.
Table 2.3 Properties of Super Plasticizer Form Liquid
Color Brown
Specific gravity 1.23
Chloride content Nil
Solid content 0.48
2.2 MIX PROPORTIONING
2.2.1 TRIAL MIX PROPORTIONS
Trial mixes were obtained by replacing natural coarse aggregate by replaced coarse aggregate at a
replacement level of 10%, 20%, 30%, 40% and 50%. They are designated as TM1, TM2, TM3, TM4, TM5 and
TM6. The compressive strength of various trial mixes are given in the Table 2.7
Table 2.4 Compressive Strength of Various Trial Mixes
Trial mix TM1 TM2 TM3 TM4 TM5 TM6
% of RCA 0 10 20 30 40 50
7 days
(MPa) 26 24.2 23.97 23.23 21.75 20.02
28days(M
Pa) 49 48.62 48.02 47.77 46.2 44.1
From the Table it is found that 30% of natural aggregate can be replaced by recycled aggregate.
Experimental Study On Performance Of Recycled Concrete Aggregate As Coarse Aggregate And
www.iosrjournals.org 55 | Page
Hence in this thesis all the mixes contain 30% of Recycled Concrete Aggregate (RCA) and 70% of
natural coarse aggregate.
The following specimens are cast to study the mechanical properties of conventional and recycled
concrete.
Table 2.5 Specimens Details S.
No
Properties
Studied
Specimen’s
Shape
Properties
Studied
No. of
Specimens
Specimens
Size in mm
1
Concrete
Strength
Properties
Cube Compressive
Strength 3X5X15=225 150X 150X150
2 Prism Flexural
Strength 3X5X3=45 100X100X500
3 Cylinder Split Tensile
Strength 3X5X6=90 150X300
4 Test on
Beams Rectangle
Flexural
Strength 3X2=6
100X200X200
0
2.3 EXPERIMENTAL PROGRAMME
2.3.1 PARAMETERS STUDIED
The experiments are conducted on five series of test specimens. The following properties were studied
for all the three grades of concrete.
Mechanical Properties
Compressive strength of concrete – cubes
Compressive strength of concrete – cylinders
Split tensile strength of concrete – cylinders Flexural strength of concrete – beams
Durability Studies
Modified Sorptivity
Sulphate Resistance
Chloride Resistance
2.3.2 DESCRIPTION OF TEST PROGRAMME
2.3.2.1 WORKABILITY The workability is defined as the property of concrete which determines the amount of useful
internal work necessary to produce full compaction.
2.3.2.2 MEASURMENT OF WORKABILITY
The following tests are commonly employed to measure workability.
Slump cone test
Compacting factor test
2.3.2.3 SLUMP CONE TEST
Slump cone test is the most commonly used method of measuring consistency. It doesn’t measure
all factors contributing to workability; it is used as a control test and gives an indication of uniformity of
batches. The addition of super plasticizer gives workability to the concrete mix. The obtained test result for
various percentage of replacement of RCA with different percentage of Super plasticizer for different mixes is
shown in Table 2.6.
Table- 2.6 Slump Cone Test Results Mix M I M II M III
Fly ash (%) Super plasticizer (%) Slump in mm Slump in mm Slump in mm
0 1.25 30 28 28
10 1.25 28 30 27
12.5 1.50 27 29 30
15 2.00 24 25 23
17.5 2.50 26 29 28
2.3.2.4 Compacting Factor Test
Compacting factor test is more precise and sensitive than the slump cone test. This test gives an idea
for degree of compaction and adopted to find the workability of concrete where aggregate size does not exceed
Experimental Study On Performance Of Recycled Concrete Aggregate As Coarse Aggregate And
www.iosrjournals.org 56 | Page
20mm and the mixes are comparatively dry. The obtained test results for various percentage of fly ash, for
different mixes are shown in Table2.7.
Table- 2.7 Compacting Factor Test Result MIX M I M II M III
Silica Fume (%) Super plasticizer
(%) Compacting Factor
0 1.25 0.97 0.96 0.94
10 1.25 0.95 0.95 0.96
12.5 1.50 0.97 0.97 0.98
15 2.00 0.95 0.98 0.98
17.5 2.50 0.95 0.94 0.97
The compacting factor test results given in Table 2.7 shows that as the percentage of super plasticizer
increases, the compaction factor increases. It also shows that the addition of super plasticizer enhance more
workability to the mix which it is added.
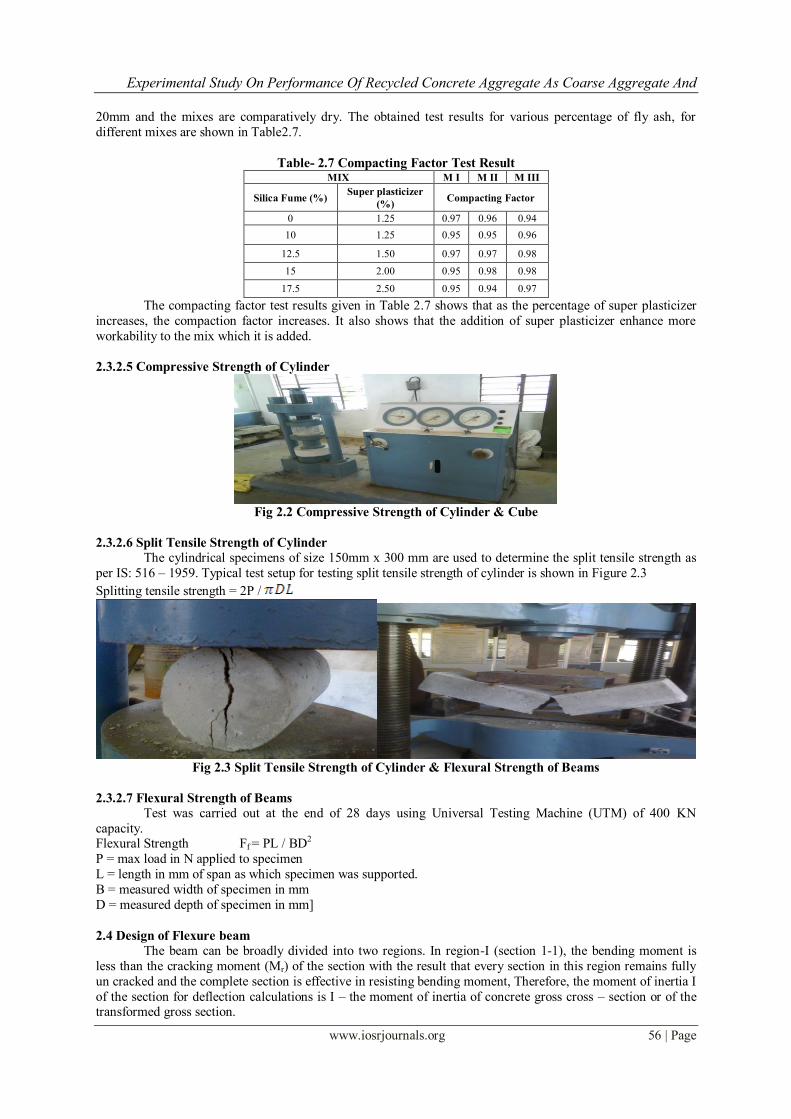
2.3.2.5 Compressive Strength of Cylinder
Fig 2.2 Compressive Strength of Cylinder & Cube
2.3.2.6 Split Tensile Strength of Cylinder
The cylindrical specimens of size 150mm x 300 mm are used to determine the split tensile strength as
per IS: 516 – 1959. Typical test setup for testing split tensile strength of cylinder is shown in Figure 2.3
Splitting tensile strength = 2P /
Fig 2.3 Split Tensile Strength of Cylinder & Flexural Strength of Beams
2.3.2.7 Flexural Strength of Beams
Test was carried out at the end of 28 days using Universal Testing Machine (UTM) of 400 KN
capacity. Flexural Strength Ff = PL / BD2
P = max load in N applied to specimen
L = length in mm of span as which specimen was supported.
B = measured width of specimen in mm
D = measured depth of specimen in mm]
2.4 Design of Flexure beam
The beam can be broadly divided into two regions. In region-I (section 1-1), the bending moment is
less than the cracking moment (Mr) of the section with the result that every section in this region remains fully
un cracked and the complete section is effective in resisting bending moment, Therefore, the moment of inertia I
of the section for deflection calculations is I – the moment of inertia of concrete gross cross – section or of the transformed gross section.
Experimental Study On Performance Of Recycled Concrete Aggregate As Coarse Aggregate And
www.iosrjournals.org 57 | Page
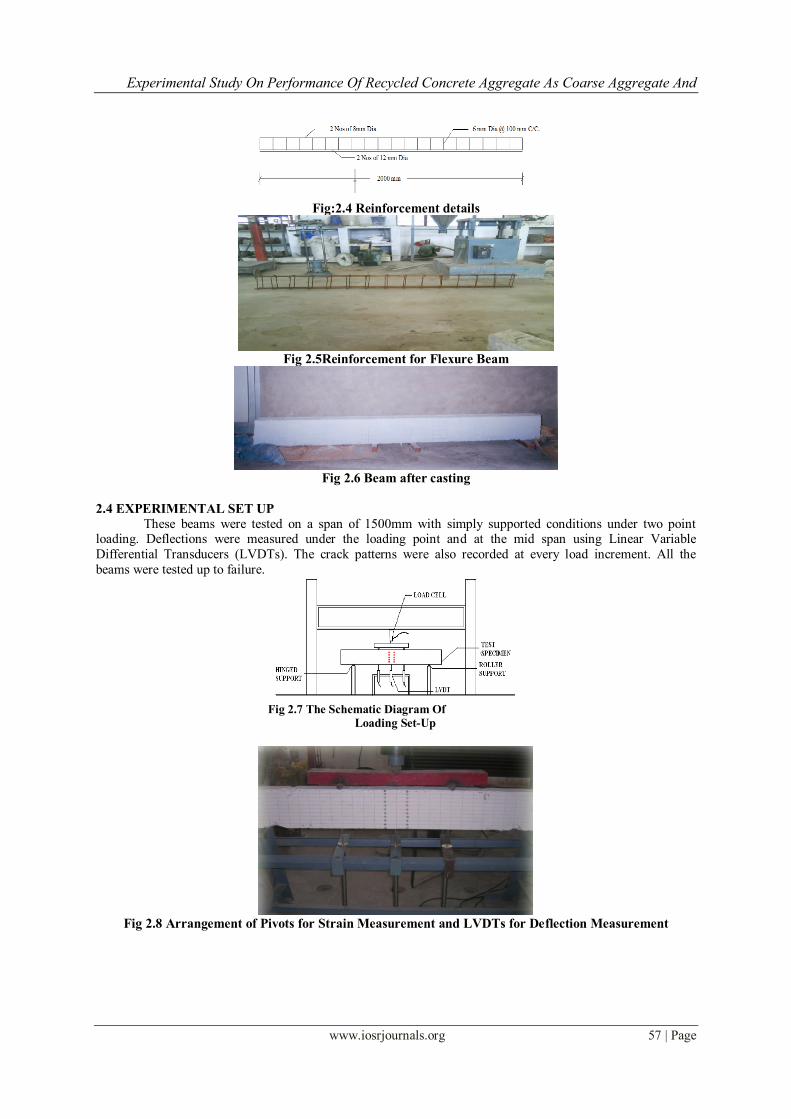
Fig:2.4 Reinforcement details
Fig 2.5Reinforcement for Flexure Beam
Fig 2.6 Beam after casting
2.4 EXPERIMENTAL SET UP
These beams were tested on a span of 1500mm with simply supported conditions under two point loading. Deflections were measured under the loading point and at the mid span using Linear Variable
Differential Transducers (LVDTs). The crack patterns were also recorded at every load increment. All the
beams were tested up to failure.
Fig 2.8 Arrangement of Pivots for Strain Measurement and LVDTs for Deflection Measurement
Fig 2.7 The Schematic Diagram Of
Loading Set-Up
Experimental Study On Performance Of Recycled Concrete Aggregate As Coarse Aggregate And
www.iosrjournals.org 58 | Page
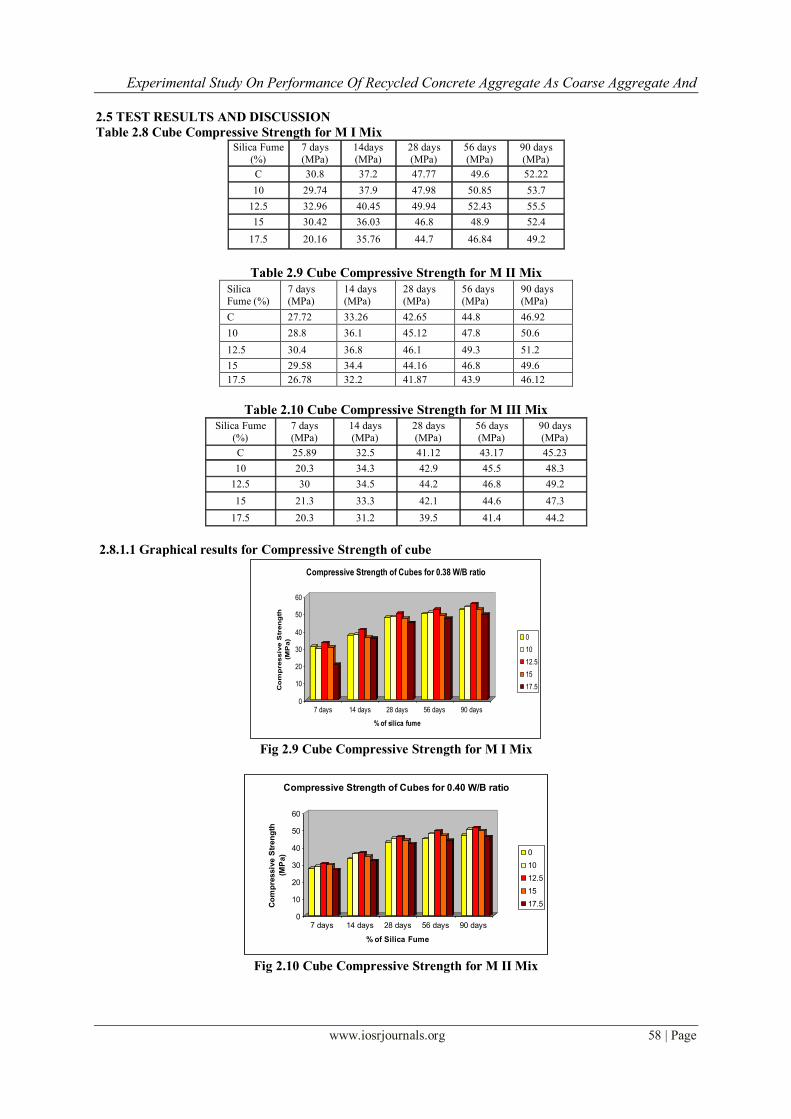
2.5 TEST RESULTS AND DISCUSSION
Table 2.8 Cube Compressive Strength for M I Mix Silica Fume
(%)
7 days
(MPa)
14days
(MPa)
28 days
(MPa)
56 days
(MPa)
90 days
(MPa)
C 30.8 37.2 47.77 49.6 52.22
10 29.74 37.9 47.98 50.85 53.7
12.5 32.96 40.45 49.94 52.43 55.5
15 30.42 36.03 46.8 48.9 52.4
17.5 20.16 35.76 44.7 46.84 49.2
Table 2.9 Cube Compressive Strength for M II Mix
Silica
Fume (%)
7 days
(MPa)
14 days
(MPa)
28 days
(MPa)
56 days
(MPa)
90 days
(MPa)
C 27.72 33.26 42.65 44.8 46.92
10 28.8 36.1 45.12 47.8 50.6
12.5 30.4 36.8 46.1 49.3 51.2
15 29.58 34.4 44.16 46.8 49.6
17.5 26.78 32.2 41.87 43.9 46.12
Table 2.10 Cube Compressive Strength for M III Mix
Silica Fume
(%)
7 days
(MPa)
14 days
(MPa)
28 days
(MPa)
56 days
(MPa)
90 days
(MPa)
C 25.89 32.5 41.12 43.17 45.23
10 20.3 34.3 42.9 45.5 48.3
12.5 30 34.5 44.2 46.8 49.2
15 21.3 33.3 42.1 44.6 47.3
17.5 20.3 31.2 39.5 41.4 44.2
2.8.1.1 Graphical results for Compressive Strength of cube
0
10
20
30
40
50
60
Co
mp
ressiv
e S
tren
gth
(MP
a)
7 days 14 days 28 days 56 days 90 days
% of silica fume
Compressive Strength of Cubes for 0.38 W/B ratio
0
10
12.5
15
17.5
Fig 2.9 Cube Compressive Strength for M I Mix
0
10
20
30
40
50
60
Co
mp
ressiv
e S
tren
gth
(MP
a)
7 days 14 days 28 days 56 days 90 days
% of Silica Fume
Compressive Strength of Cubes for 0.40 W/B ratio
0
10
12.5
15
17.5
Fig 2.10 Cube Compressive Strength for M II Mix
Experimental Study On Performance Of Recycled Concrete Aggregate As Coarse Aggregate And
www.iosrjournals.org 59 | Page
0
5
10
15
20
25
30
35
40
45
50
Co
mp
ress
ive
Str
eng
th
(MP
a)
7 days 14 days 28 days 56 days 90 days
% of Silica Fume
Compressive Strength of Cubes for 0.42 W/B ratio
0
10
12.5
15
17.5
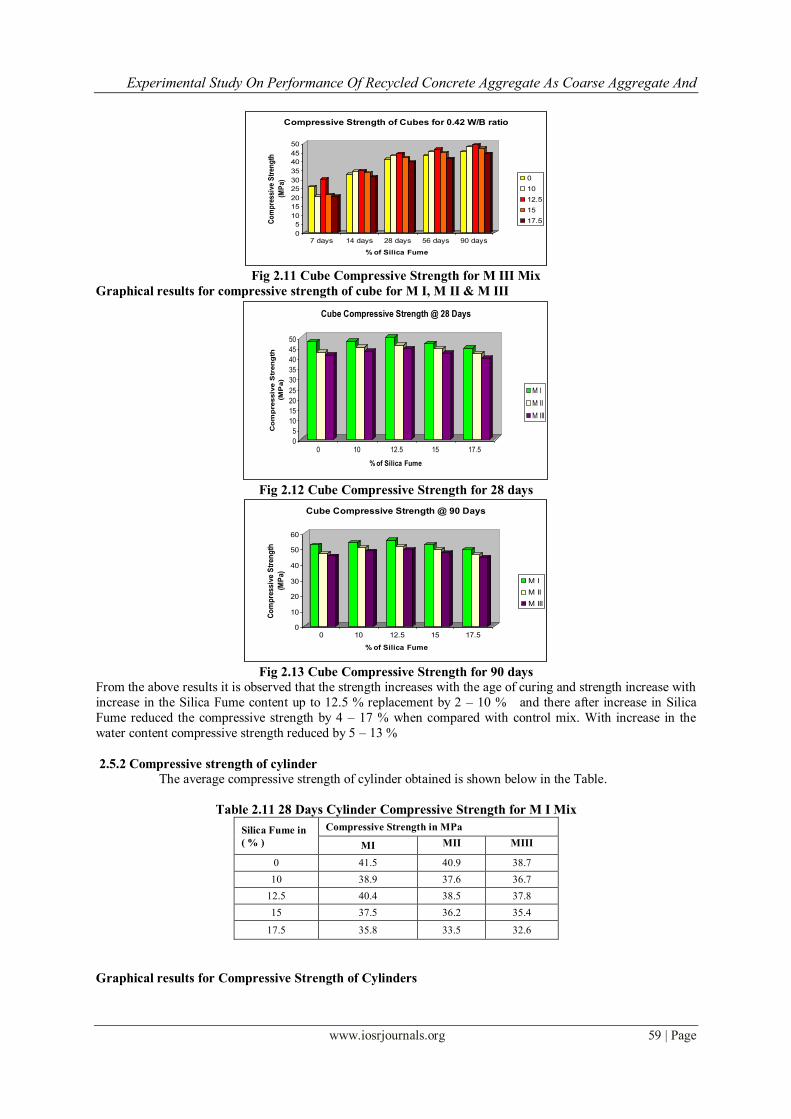
Fig 2.11 Cube Compressive Strength for M III Mix
Graphical results for compressive strength of cube for M I, M II & M III
0
5
10
15
20
25
30
35
40
45
50
Co
mp
ressiv
e S
tren
gth
(MP
a)
0 10 12.5 15 17.5
% of Silica Fume
Cube Compressive Strength @ 28 Days
M I
M II
M III
Fig 2.12 Cube Compressive Strength for 28 days
0
10
20
30
40
50
60
Co
mp
ressiv
e S
tren
gth
(MP
a)
0 10 12.5 15 17.5
% of Silica Fume
Cube Compressive Strength @ 90 Days
M I
M II
M III
Fig 2.13 Cube Compressive Strength for 90 days
From the above results it is observed that the strength increases with the age of curing and strength increase with
increase in the Silica Fume content up to 12.5 % replacement by 2 – 10 % and there after increase in Silica
Fume reduced the compressive strength by 4 – 17 % when compared with control mix. With increase in the
water content compressive strength reduced by 5 – 13 %
2.5.2 Compressive strength of cylinder
The average compressive strength of cylinder obtained is shown below in the Table.
Table 2.11 28 Days Cylinder Compressive Strength for M I Mix
Silica Fume in
( % )
Compressive Strength in MPa
MI MII MIII
0 41.5 40.9 38.7
10 38.9 37.6 36.7
12.5 40.4 38.5 37.8
15 37.5 36.2 35.4
17.5 35.8 33.5 32.6
Graphical results for Compressive Strength of Cylinders
Experimental Study On Performance Of Recycled Concrete Aggregate As Coarse Aggregate And
www.iosrjournals.org 60 | Page
32
33
34
35
36
37
38
39
40
41
42
Co
mp
ressiv
e S
tren
gth
(MP
a)
0 10 12.5 15 17.5
% of Silica Fume
Compressive Strength of Cylinder for 0.38 W/B ratio
28 Days
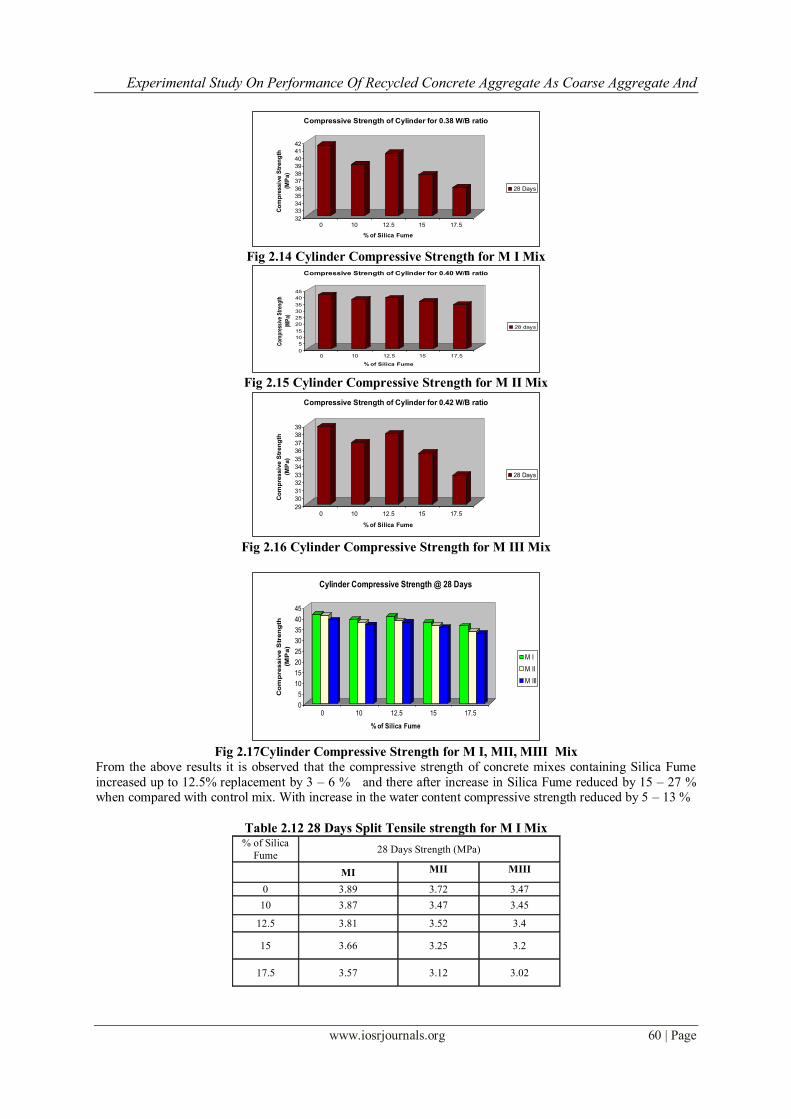
Fig 2.14 Cylinder Compressive Strength for M I Mix
0
5
10
15
20
25
30
35
40
45
Com
pres
sive
Str
engt
h
(MP
a)
0 10 12.5 15 17.5
% of Silica Fume
Compressive Strength of Cylinder for 0.40 W/B ratio
28 days
Fig 2.15 Cylinder Compressive Strength for M II Mix
29
30
31
32
33
34
35
36
37
38
39
Co
mp
ressiv
e S
tren
gth
(MP
a)
0 10 12.5 15 17.5
% of Silica Fume
Compressive Strength of Cylinder for 0.42 W/B ratio
28 Days
Fig 2.16 Cylinder Compressive Strength for M III Mix
0
5
10
15
20
25
30
35
40
45
Co
mp
ressiv
e S
tren
gth
(MP
a)
0 10 12.5 15 17.5
% of Silica Fume
Cylinder Compressive Strength @ 28 Days
M I
M II
M III
Fig 2.17Cylinder Compressive Strength for M I, MII, MIII Mix
From the above results it is observed that the compressive strength of concrete mixes containing Silica Fume
increased up to 12.5% replacement by 3 – 6 % and there after increase in Silica Fume reduced by 15 – 27 % when compared with control mix. With increase in the water content compressive strength reduced by 5 – 13 %
Table 2.12 28 Days Split Tensile strength for M I Mix % of Silica
Fume 28 Days Strength (MPa)
MI MII MIII
0 3.89 3.72 3.47
10 3.87 3.47 3.45
12.5 3.81 3.52 3.4
15 3.66 3.25 3.2
17.5 3.57 3.12 3.02
Experimental Study On Performance Of Recycled Concrete Aggregate As Coarse Aggregate And
www.iosrjournals.org 61 | Page
Graphical results for split tensile strength
Split Tensile Test for 0.38 W/B ratio
3.4
3.5
3.6
3.7
3.8
3.9
4
0 10 12.5 15 17.5
% of Silica FumeS
pli
t T
ensi
le S
tren
gth
(M
Pa)
28 days
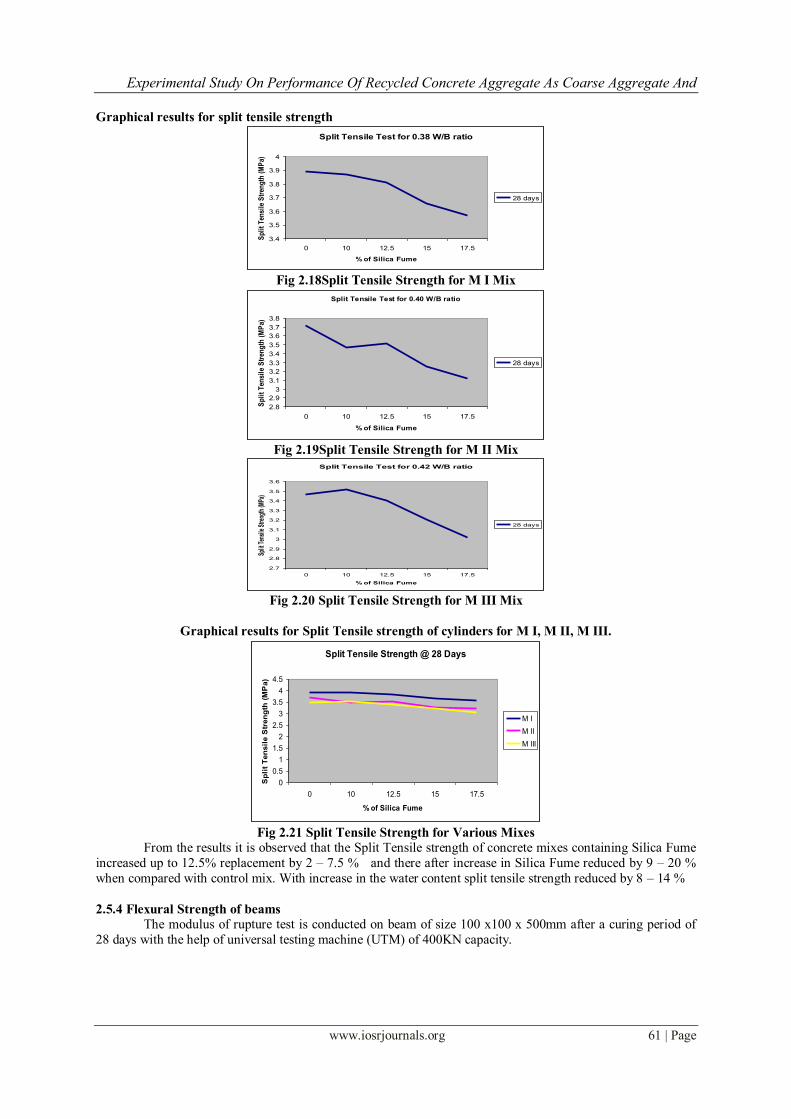
Fig 2.18Split Tensile Strength for M I Mix
Split Tensile Test for 0.40 W/B ratio
2.8
2.9
3
3.1
3.2
3.3
3.4
3.5
3.6
3.7
3.8
0 10 12.5 15 17.5
% of Silica Fume
Sp
lit
Ten
sile
Str
eng
th (
MP
a)
28 days
Fig 2.19Split Tensile Strength for M II Mix
Split Tensile Test for 0.42 W/B ratio
2.7
2.8
2.9
3
3.1
3.2
3.3
3.4
3.5
3.6
0 10 12.5 15 17.5
% of Silica Fume
Split
Ten
sile
Stre
ngth
(MPa
)
28 days
Fig 2.20 Split Tensile Strength for M III Mix
Graphical results for Split Tensile strength of cylinders for M I, M II, M III.
Split Tensile Strength @ 28 Days
0
0.5
1
1.5
2
2.5
3
3.5
4
4.5
0 10 12.5 15 17.5
% of Silica Fume
Sp
lit
Ten
sil
e S
tren
gth
(M
Pa)
M I
M II
M III
Fig 2.21 Split Tensile Strength for Various Mixes
From the results it is observed that the Split Tensile strength of concrete mixes containing Silica Fume
increased up to 12.5% replacement by 2 – 7.5 % and there after increase in Silica Fume reduced by 9 – 20 %
when compared with control mix. With increase in the water content split tensile strength reduced by 8 – 14 %
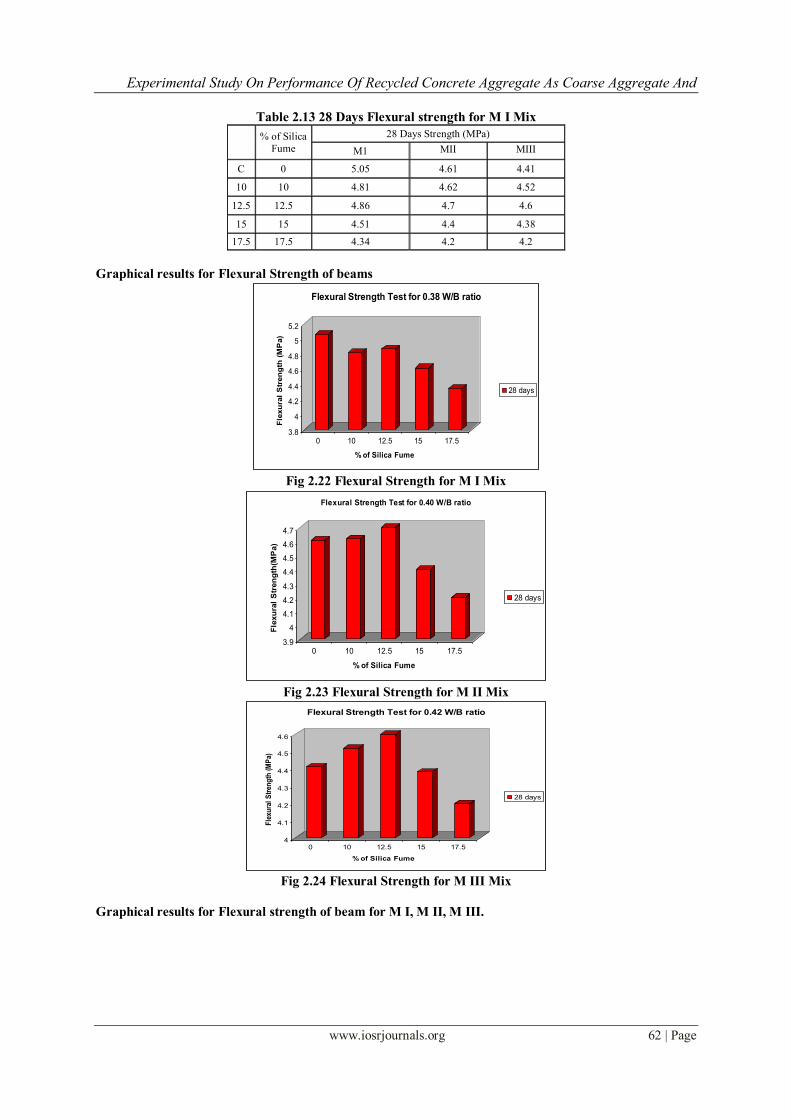
2.5.4 Flexural Strength of beams The modulus of rupture test is conducted on beam of size 100 x100 x 500mm after a curing period of
28 days with the help of universal testing machine (UTM) of 400KN capacity.
Experimental Study On Performance Of Recycled Concrete Aggregate As Coarse Aggregate And
www.iosrjournals.org 62 | Page
Table 2.13 28 Days Flexural strength for M I Mix
% of Silica
Fume
28 Days Strength (MPa)
M1 MII MIII
C 0 5.05 4.61 4.41
10 10 4.81 4.62 4.52
12.5 12.5 4.86 4.7 4.6
15 15 4.51 4.4 4.38
17.5 17.5 4.34 4.2 4.2
Graphical results for Flexural Strength of beams
3.8
4
4.2
4.4
4.6
4.8
5
5.2
Fle
xu
ral
Str
en
gth
(M
Pa)
0 10 12.5 15 17.5
% of Silica Fume
Flexural Strength Test for 0.38 W/B ratio
28 days
Fig 2.22 Flexural Strength for M I Mix
3.9
4
4.1
4.2
4.3
4.4
4.5
4.6
4.7
Fle
xu
ral
Str
en
gth
(MP
a)
0 10 12.5 15 17.5
% of Silica Fume
Flexural Strength Test for 0.40 W/B ratio
28 days
Fig 2.23 Flexural Strength for M II Mix
4
4.1
4.2
4.3
4.4
4.5
4.6
Fle
xura
l S
tren
gth
(M
Pa)
0 10 12.5 15 17.5
% of Silica Fume
Flexural Strength Test for 0.42 W/B ratio
28 days
Fig 2.24 Flexural Strength for M III Mix
Graphical results for Flexural strength of beam for M I, M II, M III.
Experimental Study On Performance Of Recycled Concrete Aggregate As Coarse Aggregate And
www.iosrjournals.org 63 | Page
0
1
2
3
4
5
6
Fle
xu
ral S
tre
ng
th (
MP
a)
0 10 12.5 15 17.5
% of Silica Fume
Flexural Strength Test @ 28 Days
M I
M II
M III
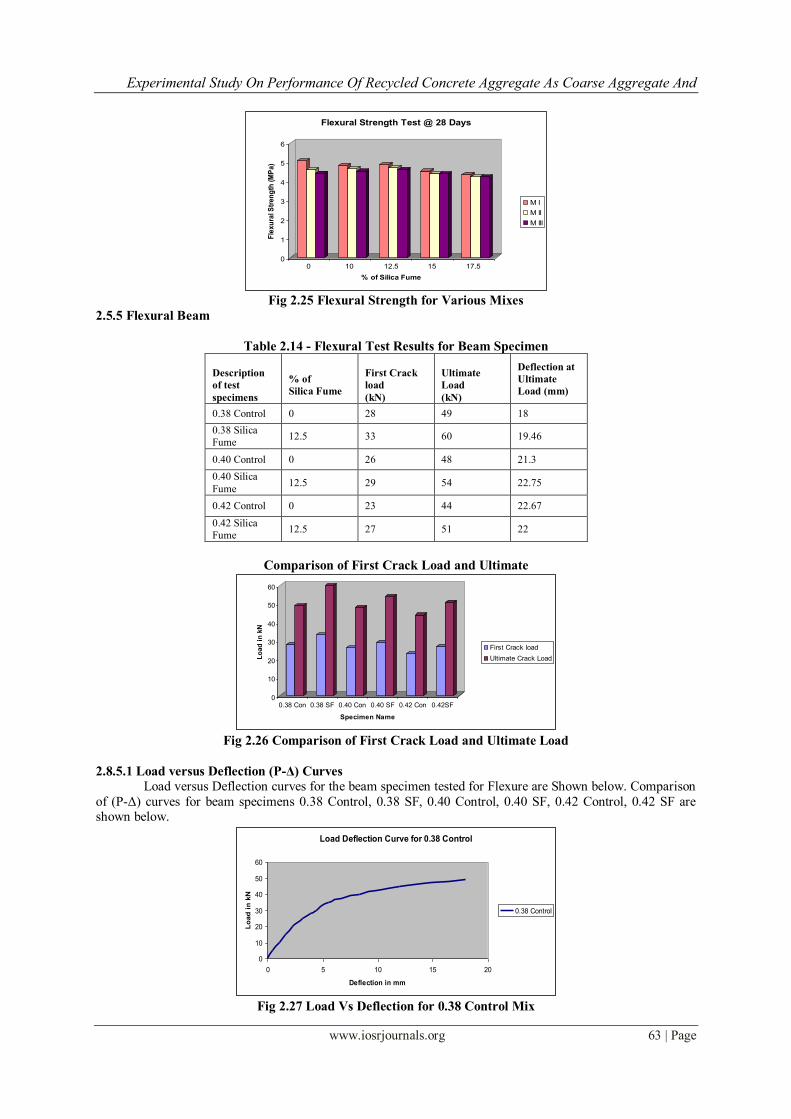
Fig 2.25 Flexural Strength for Various Mixes
2.5.5 Flexural Beam
Table 2.14 - Flexural Test Results for Beam Specimen
Description
of test
specimens
% of
Silica Fume
First Crack
load
(kN)
Ultimate
Load
(kN)
Deflection at
Ultimate
Load (mm)
0.38 Control 0 28 49 18
0.38 Silica
Fume 12.5 33 60 19.46
0.40 Control 0 26 48 21.3
0.40 Silica
Fume 12.5 29 54 22.75
0.42 Control 0 23 44 22.67
0.42 Silica
Fume 12.5 27 51 22
Comparison of First Crack Load and Ultimate
0
10
20
30
40
50
60
Lo
ad
in
kN
0.38 Con 0.38 SF 0.40 Con 0.40 SF 0.42 Con 0.42SF
Specimen Name
First Crack load
Ultimate Crack Load
Fig 2.26 Comparison of First Crack Load and Ultimate Load
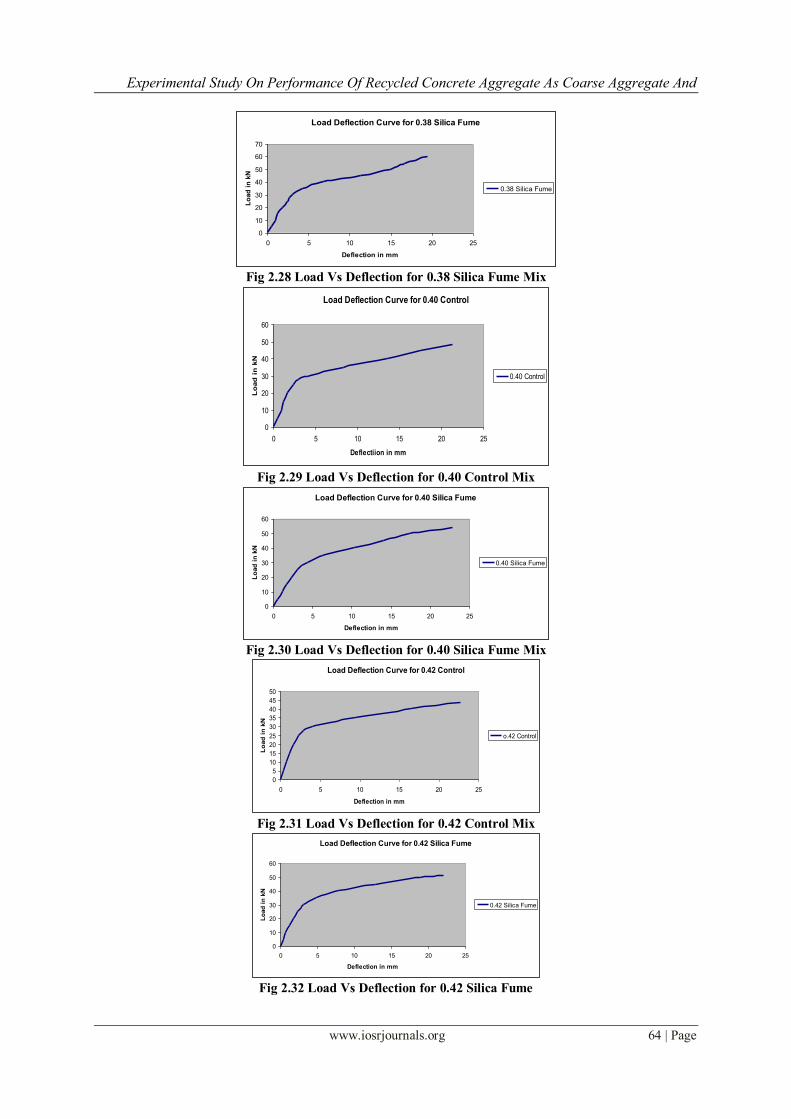
2.8.5.1 Load versus Deflection (P-Δ) Curves
Load versus Deflection curves for the beam specimen tested for Flexure are Shown below. Comparison
of (P-Δ) curves for beam specimens 0.38 Control, 0.38 SF, 0.40 Control, 0.40 SF, 0.42 Control, 0.42 SF are shown below.
Load Deflection Curve for 0.38 Control
0
10
20
30
40
50
60
0 5 10 15 20
Deflection in mm
Lo
ad
in
kN
0.38 Control
Fig 2.27 Load Vs Deflection for 0.38 Control Mix
Experimental Study On Performance Of Recycled Concrete Aggregate As Coarse Aggregate And
www.iosrjournals.org 64 | Page
Load Deflection Curve for 0.38 Silica Fume
0
10
20
30
40
50
60
70
0 5 10 15 20 25
Deflection in mm
Lo
ad
in
kN
0.38 Silica Fume
Fig 2.28 Load Vs Deflection for 0.38 Silica Fume Mix
Load Deflection Curve for 0.40 Control
0
10
20
30
40
50
60
0 5 10 15 20 25
Deflectiion in mm
Lo
ad
in
kN
0.40 Control
Fig 2.29 Load Vs Deflection for 0.40 Control Mix
Load Deflection Curve for 0.40 Silica Fume
0
10
20
30
40
50
60
0 5 10 15 20 25
Deflection in mm
Lo
ad
in
kN
0.40 Silica Fume
Fig 2.30 Load Vs Deflection for 0.40 Silica Fume Mix
Load Deflection Curve for 0.42 Control
0
5
10
15
20
25
30
35
40
45
50
0 5 10 15 20 25
Deflection in mm
Lo
ad
in
kN
o.42 Control
Fig 2.31 Load Vs Deflection for 0.42 Control Mix
Load Deflection Curve for 0.42 Silica Fume
0
10
20
30
40
50
60
0 5 10 15 20 25
Deflection in mm
Lo
ad
in
kN
0.42 Silica Fume
Fig 2.32 Load Vs Deflection for 0.42 Silica Fume
Experimental Study On Performance Of Recycled Concrete Aggregate As Coarse Aggregate And
www.iosrjournals.org 65 | Page
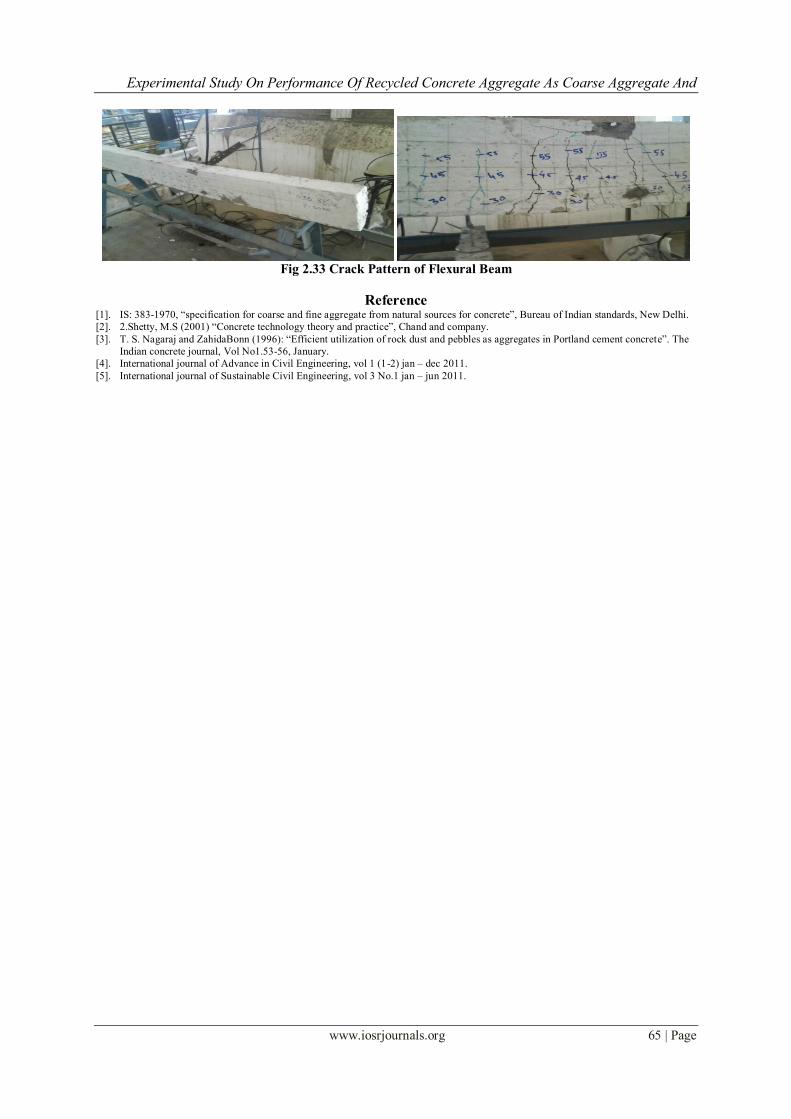
Fig 2.33 Crack Pattern of Flexural Beam
Reference [1]. IS: 383-1970, “specification for coarse and fine aggregate from natural sources for concrete”, Bureau of Indian standards, New Delhi. [2]. 2.Shetty, M.S (2001) “Concrete technology theory and practice”, Chand and company. [3]. T. S. Nagaraj and ZahidaBonn (1996): “Efficient utilization of rock dust and pebbles as aggregates in Portland cement concrete”. The
Indian concrete journal, Vol No1.53-56, January. [4]. International journal of Advance in Civil Engineering, vol 1 (1-2) jan – dec 2011. [5]. International journal of Sustainable Civil Engineering, vol 3 No.1 jan – jun 2011.


![FUME EXTRACTION SOLUTIONS - Excision€¦ · Fume Extraction System 3 Fume is smoke, vapor, or gas, especially if irritating, harmful, or smelly. [1] Welding fume is one of the most](https://static.documents.pub/doc/80x56/5e8d4bd234b64275ca5b8ae3/fume-extraction-solutions-excision-fume-extraction-system-3-fume-is-smoke-vapor.jpg)


