Ice in the Environment: Proceedings of the 16th IAHR International Symposium on Ice Dunedin, New Zealand, 2nd–6th December 2002 International Association of Hydraulic Engineering and Research EXPERIMENTAL STUDY ON SPREADING OF OIL SPILLED AMONG PACK ICE Natsuhiko Otsuka 1 , Kouji Ogiwara 2 , Kohei Kanaami 3 , Shinjiro Takahashi 4 and Hiroshi Saeki 3 ABSTRACT In order to determine the characteristics of the spread of crude oil in seawater with pack ice, experiments were carried out using model pack ice made of circular ice plates under various conditions of oil discharge rate, oil volume and ice concentration. Results of experiments in which the ice concentration was small showed that the spilled oil spread between ice plates but that the rate of spread was much lees than that in the case of open water. On the other hand, when the ice concentration was high and there were isolated areas of open water, spilled oil spread by overtopping the parts of the circular ice plates that were in contact with each other and oil was trapped in the isolated open water areas. The characteristics of the spread of spilled oil depend on the density and concentration of ice, density and viscosity of oil, and net surface tension between ice, oil and water. INTRODUCTION Extraction of crude oil from the northeastern shelf off Sakhalin Island in the Sea of Okhotsk started in the summer of 1999. Transportation of the crude oil by oil tankers has only been possible during the period from July to November because of the blockage caused by ice floes in winter. However, it has been planned to continue extracting crude oil year-round by constructing an underwater pipeline. This will involve a risk of oil spillage accidents occurring in the winter in the Sea of Okhotsk, when the sea is covered with ice. Ice floes in the Sea of Okhotsk consist of ice sheets of various shapes, and the concentration of ice floes varies greatly. If an oil spill occurred under the ice-covered sea, the oil would spread beneath the ice cover. If, however, the ice floes did not completely cover the water surface, the oil would spread through the areas of open water between the ice sheets. The characteristics and mathematical modeling of radial spreading of oil under a flat ice sheet have been studied by laboratory experiments (Yapa and Chowdhury, 1990), and the characteristics of oil spreading under broken ice were studied by Yapa and Weerasuriya 1 North Japan Port Consultants Co. Ltd., Heiwa dori, 2-11-18, Shiroishi-ku, Sapporo, Japan 2 Mitsubishi Heavy Industries Ltd., Kannon-shinnmachi, 4-6-22, Hiroshima, Japan 3 Hokkaido University, North 13, West 8, Kita-ku, Sapporo, Japan 4 Nishimura Gumi Ltd., Yubetsu-cho, Monbetsu-gun, Japan
Transcript
Ice in the Environment: Proceedings of the 16th IAHR International Symposium on IceDunedin, New Zealand, 2nd–6th December 2002International Association of Hydraulic Engineering and Research
EXPERIMENTAL STUDY ON SPREADING OF OIL SPILLEDAMONG PACK ICE
Natsuhiko Otsuka1, Kouji Ogiwara2, Kohei Kanaami3,Shinjiro Takahashi4 and Hiroshi Saeki3
ABSTRACTIn order to determine the characteristics of the spread of crude oil in seawater with packice, experiments were carried out using model pack ice made of circular ice plates undervarious conditions of oil discharge rate, oil volume and ice concentration. Results ofexperiments in which the ice concentration was small showed that the spilled oil spreadbetween ice plates but that the rate of spread was much lees than that in the case of openwater. On the other hand, when the ice concentration was high and there were isolatedareas of open water, spilled oil spread by overtopping the parts of the circular ice platesthat were in contact with each other and oil was trapped in the isolated open water areas.The characteristics of the spread of spilled oil depend on the density and concentration ofice, density and viscosity of oil, and net surface tension between ice, oil and water.
INTRODUCTIONExtraction of crude oil from the northeastern shelf off Sakhalin Island in the Sea ofOkhotsk started in the summer of 1999. Transportation of the crude oil by oil tankers hasonly been possible during the period from July to November because of the blockagecaused by ice floes in winter. However, it has been planned to continue extracting crudeoil year-round by constructing an underwater pipeline. This will involve a risk of oilspillage accidents occurring in the winter in the Sea of Okhotsk, when the sea is coveredwith ice. Ice floes in the Sea of Okhotsk consist of ice sheets of various shapes, and theconcentration of ice floes varies greatly. If an oil spill occurred under the ice-covered sea,the oil would spread beneath the ice cover. If, however, the ice floes did not completelycover the water surface, the oil would spread through the areas of open water between theice sheets.
The characteristics and mathematical modeling of radial spreading of oil under a flat icesheet have been studied by laboratory experiments (Yapa and Chowdhury, 1990), and thecharacteristics of oil spreading under broken ice were studied by Yapa and Weerasuriya
1 North Japan Port Consultants Co. Ltd., Heiwa dori, 2-11-18, Shiroishi-ku, Sapporo, Japan2 Mitsubishi Heavy Industries Ltd., Kannon-shinnmachi, 4-6-22, Hiroshima, Japan3 Hokkaido University, North 13, West 8, Kita-ku, Sapporo, Japan4 Nishimura Gumi Ltd., Yubetsu-cho, Monbetsu-gun, Japan
(1997). Otsuka et al. (2001) carried out an experimental study on the spread of oil underuneven ice sheets. However, spread of oil in the case of loosely packed ice floes andspread of oil in the case of existence of open water between ice sheets were notconsidered in those studies. Sayed and Ng (1993) carried out an experimental study onspread of oil over and between densely packed ice floes. Buist and Bjerkelund (1986)carried out a field experiment on spread of oil between pack ice. In their study, 1 m3 ofcrude oil was discharged into pack ice of different concentrations. It was found that thearea over which the oil spread and the rate of spread were much less than those estimatedby a theoretical model in open water (Fay, 1971). However, little is known about thespread of oil in the sea between sheets of pack ice such as those in the Sea of Okhotsk.The aim of this study was therefore to determine the characteristics of the spread of crudeoil on the surface of water between sheets of pack ice with various concentrations.Experiments were carried out using model pack ice made of circular ice plates undervarious conditions of oil discharge rate, oil volume and ice concentration to determine thecharacteristics of the spread of oil in seawater with pack ice.
EXPERIMENTAL METHODA round glass-bottomed steel tank of 1.6 m in diameter and 0.8 m in depth was used toobserve the spreading of oil (Fig. 1). The tank was filled with 3 % saline water cooled to–5 degrees. Model pack ice was made using circular plates of frozen saline watermeasuring 3 cm in thickness and 10 cm in diameter. As shown in Fig. 2, experiments wereconducted with ice concentrations of 90 %, 60 % and 0 % (no ice). In the case of iceconcentration of 90 %, the ice plates were in contact with each other, thus creating openwater areas only in the gaps made by the curves of the circular ice plates. In the case of iceconcentration of 60 %, the ice plates were not in contact with each other (narrowest gapbetween the ice plates being 1 cm), thus creating a continuous area of open water betweenthe ice plates. In this case, the ice plates were fixed by thin foam polystyrene rods.
Figure 1: Experimental apparatus Figure 2: Arrangements of model pack ice
In the experiment, Iranian Light crude oil was injected at a constant rate under the modelpack ice using an air compressor. The subsequent spreading of oil, which could be viewedthrough the glass tank bottom, was recorded by a video camera, and the spreadingvelocity and area were measured. The experimental conditions are summarized inTable 1.
10cm 1cm
open water area
Ice sheet
Concentration = 90 � Concentration = 60 �
Table 1: Experimental Conditions
Case No. Case 1 Case 2 Case 3-1 Case 3-2Concentration of model pack ice 0 % 60 % 90 % 90 %Oil temperature 1 –0.5 –0.5 –2.5Oil viscosity (mPa*s) 95 190 145 118Specific gravity 0.876 0.876 0.876 0.876
Oil volume (l) 0.079 0.157 0.157 0.864
Discharge rate of oil Q (l/s) 0.00248 0.00193 0.00442 0.01542Saline temperature 0.2 –0.5 –0.5 –0.5
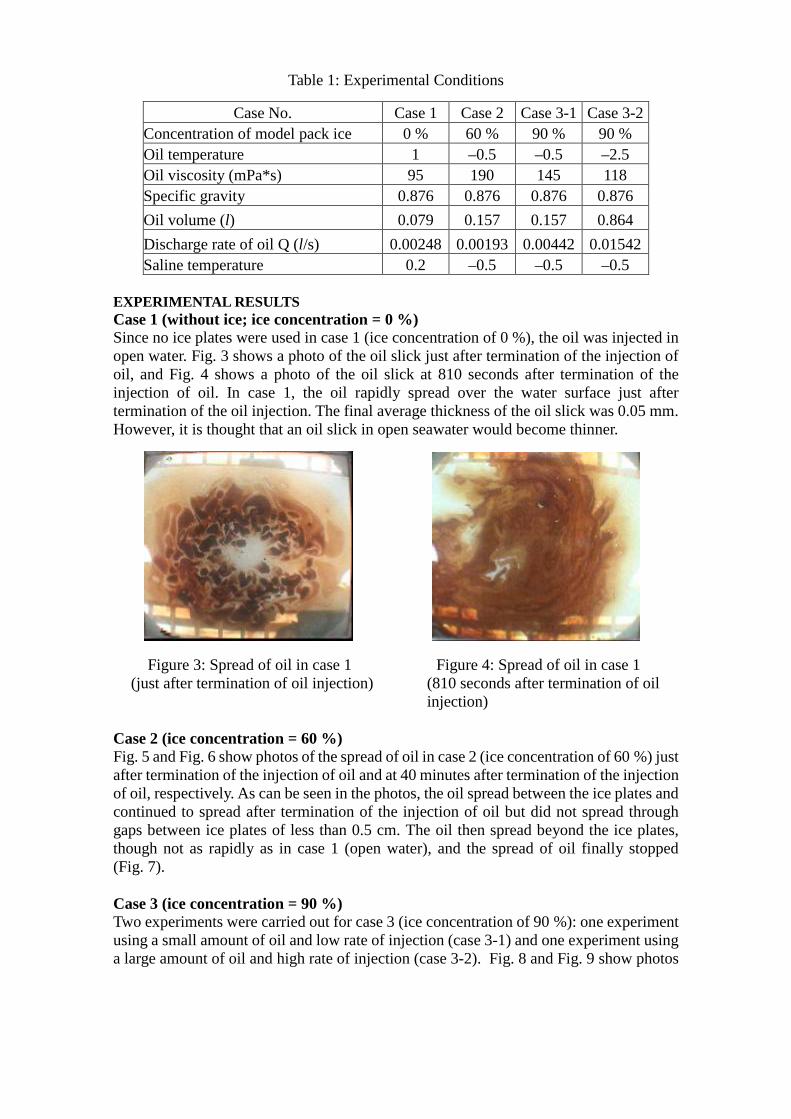
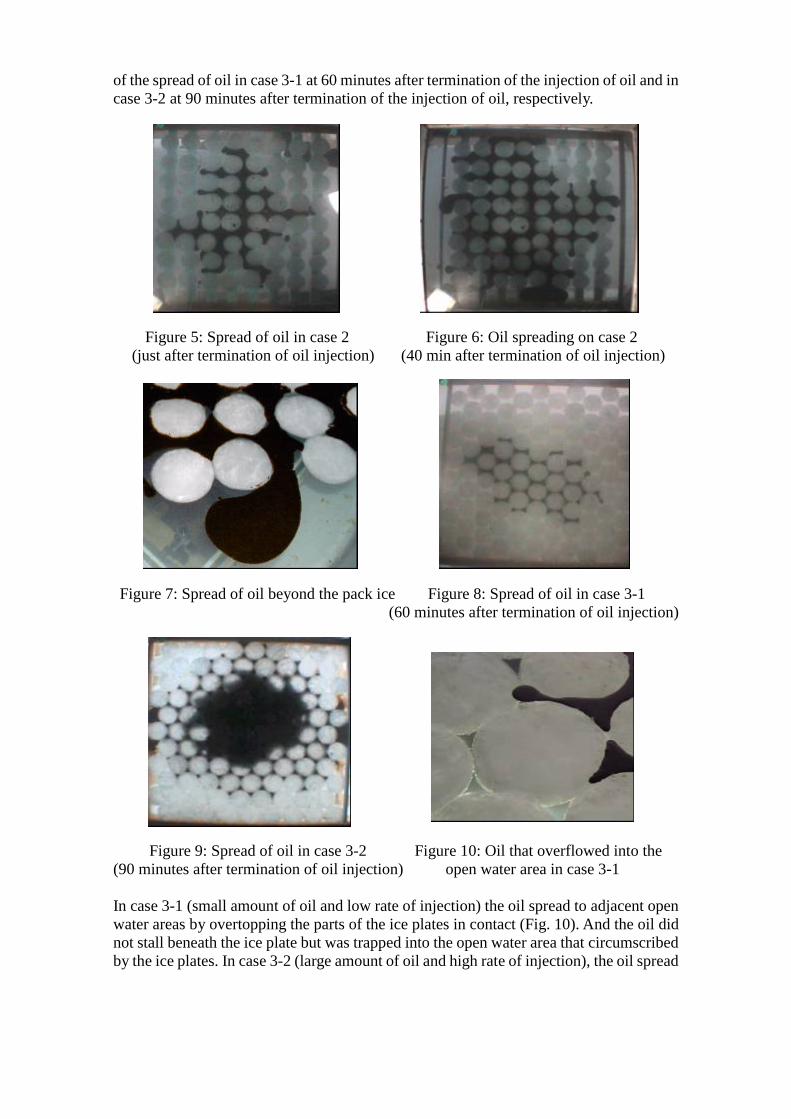
EXPERIMENTAL RESULTSCase 1 (without ice; ice concentration = 0 %)Since no ice plates were used in case 1 (ice concentration of 0 %), the oil was injected inopen water. Fig. 3 shows a photo of the oil slick just after termination of the injection ofoil, and Fig. 4 shows a photo of the oil slick at 810 seconds after termination of theinjection of oil. In case 1, the oil rapidly spread over the water surface just aftertermination of the oil injection. The final average thickness of the oil slick was 0.05 mm.However, it is thought that an oil slick in open seawater would become thinner.
Figure 3: Spread of oil in case 1 Figure 4: Spread of oil in case 1(just after termination of oil injection) (810 seconds after termination of oil
injection)
Case 2 (ice concentration = 60 %)Fig. 5 and Fig. 6 show photos of the spread of oil in case 2 (ice concentration of 60 %) justafter termination of the injection of oil and at 40 minutes after termination of the injectionof oil, respectively. As can be seen in the photos, the oil spread between the ice plates andcontinued to spread after termination of the injection of oil but did not spread throughgaps between ice plates of less than 0.5 cm. The oil then spread beyond the ice plates,though not as rapidly as in case 1 (open water), and the spread of oil finally stopped(Fig. 7).
Case 3 (ice concentration = 90 %)Two experiments were carried out for case 3 (ice concentration of 90 %): one experimentusing a small amount of oil and low rate of injection (case 3-1) and one experiment usinga large amount of oil and high rate of injection (case 3-2). Fig. 8 and Fig. 9 show photos
of the spread of oil in case 3-1 at 60 minutes after termination of the injection of oil and incase 3-2 at 90 minutes after termination of the injection of oil, respectively.
Figure 5: Spread of oil in case 2 Figure 6: Oil spreading on case 2(just after termination of oil injection) (40 min after termination of oil injection)
Figure 7: Spread of oil beyond the pack ice Figure 8: Spread of oil in case 3-1(60 minutes after termination of oil injection)
Figure 9: Spread of oil in case 3-2 Figure 10: Oil that overflowed into the(90 minutes after termination of oil injection) open water area in case 3-1
In case 3-1 (small amount of oil and low rate of injection) the oil spread to adjacent openwater areas by overtopping the parts of the ice plates in contact (Fig. 10). And the oil didnot stall beneath the ice plate but was trapped into the open water area that circumscribedby the ice plates. In case 3-2 (large amount of oil and high rate of injection), the oil spread
from the injection point over the upper surface of the ice plates, and the peripheral part ofthe oil slick spread by overtopping the parts of the ice plates in contact as in case 3-1. Theblackened areas of the ice plates in the photo are the areas in which the oil spread over theice plates.
DISCUSSIONSpread of oil under the condition of discharge of oil at a constant rateThe rates of oil injection in the experiments are shown in Table 1. Fig. 11 shows thechanges in the areas of oil slicks with elapse of time under the condition of discharge ofoil at a constant rate. The area of the oil slick was measured by counting the number ofpixels in graphical data. As the data in the figure indicate, the slick area expanded at analmost constant rate and the rate of oil spread between the ice plates was only about onetenth of that in open water (case 1). Figure 12 shows the changes in thicknesses of oilslicks with elapse of time under the condition of discharge of oil at a constant rate. Thethickness of the oil slick was calculated by dividing the slick area by the volume of oil. Asthe data in the figure indicate, the thickness of the oil slick remained almost constantthroughout the entire period of oil discharge except for the beginning of oil injection.
Figure 11: The changes in oil slick area Figure 12: The changes in oil slickunder constant oil discharge rate thickness under constant discharge rate
Characteristics of spread of oil under the condition of a constant volume of oilFig. 13 and Fig. 14 show the changes in the areas of oil slicks and the changes inthicknesses of oil slicks with elapse of time under the condition of a constant volume ofoil, respectively, and Table 2 shows the final slick thicknesses. The oil spread graduallyafter the termination of oil injection and the spread of oil stopped after some time. Thefinal oil slick area in case 2 was larger than that in case 3-1. Since the same volumes of oilwere injected in these two cases, this result indicates that the final oil slick area is smallerthe greater the ice concentration is. The final oil slick thickness in the case of iceconcentration of 90 % was 60-times greater than that in the case of open water and10-times greater than that in the case of ice concentration of 60 %. These results indicatethat the greater the ice concentration is, the greater is the final oil slick thickness.
In case 2, the spread of oil between the ice plates stopped when the gap between the iceplates was less than 0.5 cm. In this case, the force accelerating the spread of the oil slick isbuoyancy force (gravity force), and the forces that retard spreading are surface tensionacting on the surface of the oil slick above the water and on the surface between the oiland water, and interfacial tension between the oil and ice plate acting on both ends of the
0.000
0.100
0.200
0.300
0.400
0.500
0 50 100time(sec)
Oil
slic
kar
ea(m
2)
Case3-2(90%)
Case3-1(90%)
Case2(60%)
Case1(0%)
10.0E-6
100.0E-6
1.0E-3
10.0E-3
100.0E-3
1.0E+0
0 50 100time(sec)
Oil
slic
kth
ickn
ess
(m)
Case3-2(90%)
Case3-1(90%)
Case2(60%)
Case1(0%)
gap. If the gap between ice plates is small, it is thought that interfacial tension between theoil and the ice plate and surface tension of the oil slick create a balanced force that acts inan arch manner against the buoyancy force, thus causing the spread of oil in narrow gapsbetween ice plates to stop (Fig. 15).
Figure 13: Changes in areas of oil under Figure 14: Changes in thicknesses of oilthe condition of a constant volume of oil under the condition of a constant volume
of oil
Table 2: The final slick thickness
Figure 15: Interfacial tension acting on gaps between ice plates
Scale effectsFay (1971) proposed a theory regarding the spread of oil on the surface of water in whichthe spread of oil is divided into three phases. Immediately after a spill, the oil slick isrelatively thick, and the spread of oil is accelerated by gravity (buoyancy) force and
retarded by inertial force (phase 1). As time elapses and the oil slick becomes thinner,viscosity force predominates over inertial force as a retarding force (phase 2). As the oilslick thins further, surface tension and viscosity become the prevailing forces (phase 3).As a step toward elucidation of the mechanisms of spreading of oil spilled under flat icesheets, Yapa and Chowdhury (1990) derived equations from Fay's theory for the slickradius at which the spreading terminates and for the time until spreading terminates usingmodels in which the spreading stops due to a balance between interfacial tension andbuoyancy.
However, the scaling effect is a problem in modeling and experimental studies on theprocess by which oil spilled in icy seawater. An ideal solution is to conduct experimentsusing conditions that correspond exactly with physical conditions in the field and to tuneup the coefficient between experimental and real-scale phenomena by using field data.Froude similitude can be used in the case of oil spreading in open water in phase 1, butReynolds similitude should be used in phase 2, in which viscous force is dominant. Inphase 3, in which surface tension force is dominant, the Weber number should be matched.However, considering those scale effects, it is very difficult to control oil volume, oilviscosity, and interfacial tension between oil, ice and water in laboratory experiments.Therefore, the series of experiments carried out in the present study are considered to bevery small-scale actual spills.
Comparison of experimental results and field dataIn field tests on oil spilled in water between pack ice conducted by Buist and Bjerkelund(1986), crude oil of almost the same viscosity as that of the oil used in this study wasreleased into a pack ice field of concentrations of 50 % and 90 %. The ice floes rangedfrom small pancake-like structures to large floes of 5 to 28 m in diameter and 0.5 to 1.6 min thickness. The mean size of ice floes in southern Okhotsk Sea was reported by Toyotaand Enomoto (2002) to be about 100 m, and the mean thickness was reported by Uto andShimoda (2000) to be about 0.5 m. It is thought that the conditions of the pack ice in thefield tests conducted by Buist and Bjerkelund (1986) are similar to those of pack ice in theOkhotsk Sea and that their field test data can therefore be applied to an oil spill in theOkhotsk Sea. In their field tests, the final oil slick thickness was 0.04 to 0.2 mm at an iceconcentration of 50 %. In the present study, however, the oil slick thickness in case 2, inwhich the ice concentration was 60 %, was 0.5 mm. Moreover, in their field testconducted in an ice field with an ice concentration of 90 %, most of the gaps between iceplates were covered by brush ice and the oil slick thickness was 1.5 to 3.0 cm. This rangeof oil slick thicknesses is similar to the range of thicknesses of oil slicks under ice floesreported by Otsuka et al. (2001). In the present study, however, the oil slick thickness incases 3-1 and 3-2, in which ice concentration was 90 %, was about 3 mm. From theseresults, the magnitude relation of oil slick thickness responds to the ice concentration isconsistent in spite of scale difference between laboratory experiment and field test.
CONCLUSIONA series of experiments on the characteristics of oil spread were carried out using modelpack ice made of circular ice plates under various conditions of oil discharge rate, oilvolume and ice concentration. The following results were obtained.
1. In an experiment in which the ice concentration was small and there was a continuousarea of open water between ice plates, the oil spread between the circular ice plates
arranged in a lattice pattern. The oil continued to spread after the termination of oilinjection but stopped at gaps of less than 0.5 cm between ice plates, suggesting thatinterfacial tension between ice and oil plays a role in the balancing of force againstbuoyancy force, which accelerates the spread of oil.
2. In the case in which the ice concentration was high and open water areas only existedin the gaps made by the curves of the circular ice plates in contact with each other, theoil spread to adjacent open water areas by overtopping the parts of the ice plates incontact. And the oil did not stall beneath the ice plate but was trapped into the openwater area that circumscribed by the ice plates.
3. The final thickness of an oil slick between the model pack ice was much greater thanthat in open water. A correlation was found between ice concentration and oil slickthickness. A comparison of our experimental results and field test results reported byBuist and Bjerkelund (1986) showed that the magnitude relation of oil slick thicknessresponds to the ice concentration was consistent.
ACKNOWLEDGEMENTThis study was supported by the Program for Promoting Fundamental TransportTechnology Research from the Corporation for Advanced Transport & Technology(CATT).
REFERENCESBuist, I.A. and Bjerkelund, I. Oil in pack ice; preliminary result of three experimental
spills. In Proc. of 9th Arctic Oil Spill Program (1986) 379–397.Fay, J.A. Physical processes in the spread of oil on a water surface. In Proc. Joint Conf. on
Prevention and Control of Oil Spills (1971) 463–467.Otsuka, N., Ogiwara, K., Takahashi, S., Maida, K., Watanabe, S. and Saeki, H.
Experimental study on spreading of oil under ice floes. In Proc. of 16th InternationalConference on Port and Ocean Engineering under Arctic Conditions Vol.3, Ottawa,Canada (2001) 1333–1342.
Sayed, M. and Ng, M.S. Crude Oil Spreading in Brush Ice. Rep. NO. 6B3017.3 (1993).Toyota, T. and Enomoto, H. Analysis of the sea ice floes in the southern Sea of Okhotsk
using ADEOS/AVNIR images. In Proceedings of the 17th International symposiumon Okhotsk Sea and Sea Ice, Monbetsu, Japan (2002) 150–156.
Uto, S. and Shimoda, H. On the sea ice properties in the southernmost part of the sea ofokhotsk by the ship-based observations. In Proceedings of the 15th InternationalSymposium on Okhotsk Sea and Sea Ice. The 2nd Ice Scour & Arctic Marine PipelinesWorkshop, Monbetsu, Japan (2000) 142–148.
Yapa, P.D and Chowdhury, T. Spreading of oil spilled under ice. Journal of HydraulicEngineering 116(12): 1468–1483 (1990).
Yapa, P.D. and Weerasuriya, S.A. Spreading of oil spilled under floating broken ice.Journal of Hydraulic Engineering 123(8): 676–682 (1997).