Experiments on a dry granular avalancheimpacting an obstacle: dead zone,granular jump and induced forces
P. Caccamo, T. Faug, H. Bellot & F. Naaim-BouvetCemagref, ETGR, St-Martin d’Hères, France
Abstract
This work describes small-scale laboratory tests on dry granular avalanches.Avalanches flow down a channel and impact a wall-like obstacle. A depositgenerates upstream of the obstacle and plays an important role in the definitionof the total mean force induced on the obstacle by the flow. The estimation of thisforce is crucial to design efficient protection structures against snow avalanches.Keywords: granular, avalanche, obstacle, force, stagnant zone, laboratory tests.
1 Introduction
Mountainous areas have often to take into account the snow avalanche hazard.Protection systems are designed even to prevent the flow to start (active protection)or to protect goods once the avalanche released (passive protection). Passiveprotection can be done by stopping the flow (catching dams), by deviating itscourse (deflecting dams) or by spreading the flow and dissipating its energy(breaking mounds). The optimal solution, for passive defence, depends on thelocation in the run-out zone and the shape of protection structures and on theforce they have been designed to support. When a snow avalanche impacts anobstacle, a deposit generates upstream of the obstacle and plays an important rolein the definition of the total mean force induced on the obstacle by the flow. Thisstudy aims at investigating the behavior of this deposit and its evolution fromthe beginning to the end of the flow. In Section 2 the experimental approach isintroduced. First, an overview on the experimental device and on previous studiescarried out on the same device is given, then the new adopted measurementtechniques are described. Section 3 presents obtained results in terms of the
influence zone upstream of the obstacle. Experimental data are presented and thenused to extrapolate a theoretical prediction. Finally, Section 4 concludes this workshowing its contribution to the knowledge on avalanche protection matter.
2 Experimental approach
This study is based on a small-scale experimental approach. This kind of approachallows the repetition of as many tests as wished in totally safe condition,and the control of characteristic parameters. Tests are based on the conceptof measurement repeatability. Anyway, in order to avoid random errors due toexperimental conditions, each test has been repeated five to ten times at constantparameters and the average value is presented as representative of the sample. Agranular material has been chosen to reproduce dense snow avalanches. Analogiesbetween snow and granular material have been previously underlined in [1,10–12].
2.1 The device
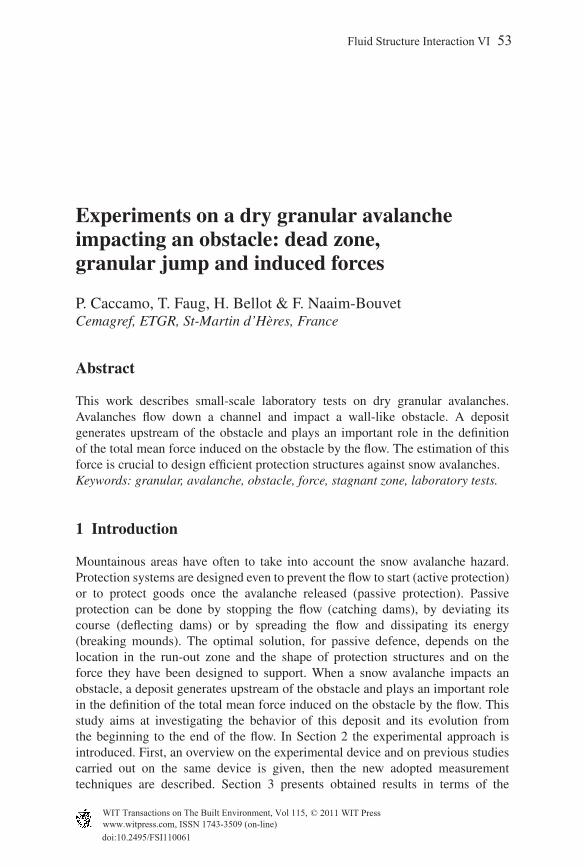
The experimental device is shown in Fig.1a and it consists in an inclined plane onwhich a channel has been mounted. The channel bottom is covered with sandpaperto introduce roughness. The inclination of the plane can be varied as well as thechannel width and its length. For presented tests, the channel width and length arefixed and equal, respectively, to 0.25m and 1.3m. On top of the channel a reservoiris mounted. It stores a constant massm = 9.2kg of granular material which can bereleased by opening a gate. The granular material consists in monodispersed glassbeads of density ρp = 2450kg/m3 and mean diameter d = 1mm. Glass beadshave been characterized with the function hstop(ϑ) which defines the relevantfriction angles of the material [7,9]. Tests have been performed by releasing a finitevolume of material down the incline and observing the final deposit height (hstop)remaining on the bottom with respect to the channel slope. As shown in Fig.1c, thefriction angles ϑmin (inclination value for which hstop tends to infinite) and ϑmax
(value for which hstop tends to zero) have been experimentally found to be close to20◦ and 28◦. ϑmin and ϑmax refer to the effective friction coefficients associatedwith quasi-static deformation and rapid collisional flows, respectively. As shownin Fig.1c, note that these friction angles are larger in the 3D case compared to the2D case (see 2D numerical study reported in [4, 5]).
Performed tests aim to investigate the flow depth h, the flow velocity U and theforce F that the flow can exert on an obstacle placed at a distance x = 1300dfrom the releasing gate, in a range of slopes from 21◦ (close to ϑmin) to 33◦ (closeto ϑmax). Additionally, tools integrate the experimental device to carry out thiskind of measurements. A high frequency video camera can be fixed normal to theflow surface or to the channel side (side walls are made of plexiglass). Each test isfilmed and image sequences are then treated. A laser is installed on the device forflow depth measurements. For force measurements an obstacle can be mounted atthe end of the channel in order to span the whole channel width and to measure themean force exerted by the flow. Fig.1b shows the obstacle. It consists in a flat steel
Figure 1: (a) Experimental device overview; (b) Front view of the obstacle. Yellowarrows indicate the direction of the incoming flow; (c) hstop behaviorversus the slope angle ϑ for 2D and 3D case [4, 5].
beam of 2.5cm height normal to the bottom and to the flow direction. Because ofvibration and resonance problems, only the central 10cm are connected to forcesensors, the rest of the obstacle obstructs the channel without contributing to theforce computation.
2.2 Previous measurements and results
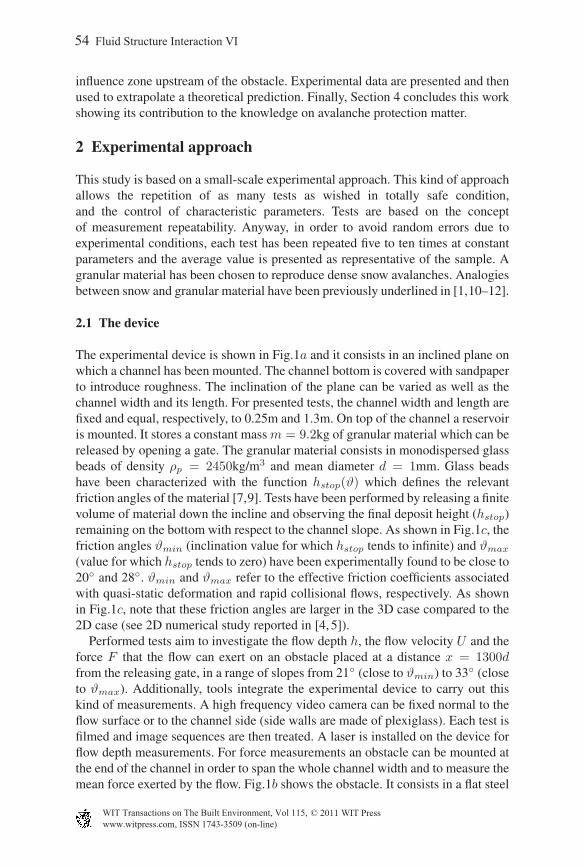
The presented work focuses on some aspects of a wider frame. The previousstudy, realised on the same experimental device, aimed to characterise the flowfrom a dynamic point of view and to measure forces that the flow can exert.Reference tests were performed first. It consisted in releasing avalanches withoutany obstacle along the flow path and to measure the flow depth and the surfacevelocity evolution versus time at different slope angles (ϑ = 21◦–33◦ each degree).Results are shown in Fig.2a and b. Then, thanks to the force sensors, the forceexerted on the obstacle could be quantified for each inclination angle (see Fig.2c).The maximum force value has been retained and compared to two typical forcecontributions, the hydrostatic force Fhyd and the dynamic one Fdyn:
Figure 2: Reference measurements results. (a) Evolution of the flow height hnormalised by the beads diameter d versus the time t. The insert showsthe maximum values of h/d versus the slope angle ϑ; (b) surface velocityU versus t. The insert shows the maximum U values versus ϑ; and (c)mean force F versus t. The insert shows maximum F values versusϑ. Measurements have been carried out at a distance x = 1300d fromthe releasing gate. (d) Evolution of Fmax/Fdyn and Fmax/Fhyd ratiosversus ϑ.
where t has been considered as th=hmax and the volume fraction ϕ derives fromthe scaling law relating ϕ to U and h [6]. Fig.2d shows the ratios Fmax/Fhyd andFmax/Fdyn versus the slope angle ϑ. Both the ratios underline a change in theregime occurring around ϑmax. Results match with numerical simulations carriedout for the 2D case [4,5]. Fmax/Fdyn tends to one for high slopes meaning that themaximum force is purely dynamic. For low slopes Fmax is about 5–6 time Fhyd.A third contribution occurs and plays an important role in the total force. Thiscontribution is given by the presence of the stagnant zone upstream the obstacle(see Fig.3b) resulting from the flow/obstacle interaction. This is why the actualstudy aims to better understand the behavior of the stagnant zone.
2.3 New measurements
As mentioned above, previous studies investigated the flow characteristics atdifferent slope angles. Now attention is focused on one slope angle ϑ = 31◦
(larger than ϑmax) and two main kinds of measurements have been carried out in
presence of the wall-like obstacle, which allows to have the access to the free-surface modification in the vicinity of the wall. First, the laser has been added tothe device and the high frequency video camera fixed at the end of the channel,normal to the bottom and to the main flow direction. Flow depth measurementshave been coupled with force measurements. Then the video camera has beenpositioned on the side of the channel, on the same axis of the obstacle, normalto the flow direction. The flow has been recorded and the image sequences treatedthanks to a Matlab routine.
2.3.1 Flow depth measurementsFlow depth measurements have been realised using a laser technique. A laserbeam is projected along the channel axis and deviated by the incoming flowtransit. The deviation ∆ of the line is proportional to the flow height h. Thevideo camera recorded each test at an acquisition frequency of 350fps. An accuratecalibration is needed to relate the measured ∆ values to the incoming flow depth.This calibration has been realised by using three standard plates in order to covera calibration range of 0–24mm thickness. The error on the laser line detectionincreases when increasing the dilution rate. For rather dense flows it is estimatedto be less than 0.5d whereas for very dilute flows it is difficult to define it.
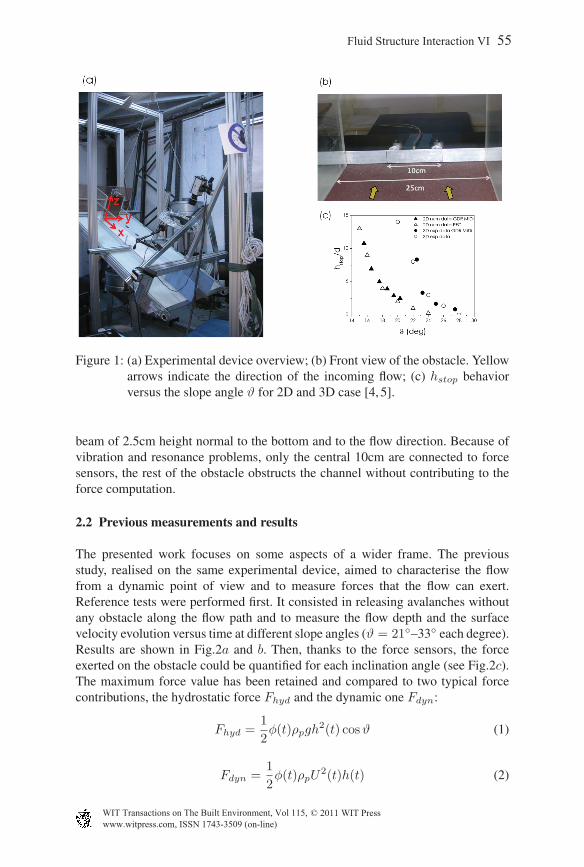
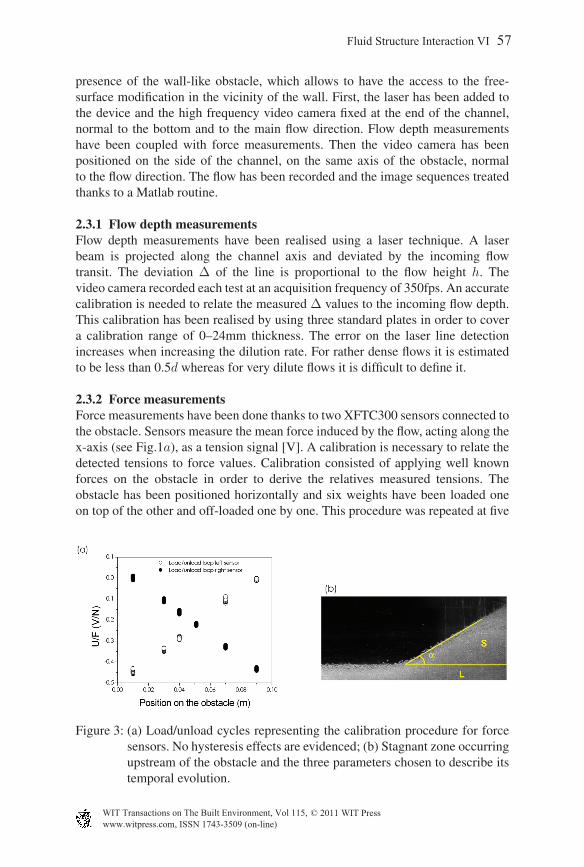
2.3.2 Force measurementsForce measurements have been done thanks to two XFTC300 sensors connected tothe obstacle. Sensors measure the mean force induced by the flow, acting along thex-axis (see Fig.1a), as a tension signal [V]. A calibration is necessary to relate thedetected tensions to force values. Calibration consisted of applying well knownforces on the obstacle in order to derive the relatives measured tensions. Theobstacle has been positioned horizontally and six weights have been loaded oneon top of the other and off-loaded one by one. This procedure was repeated at five
Figure 3: (a) Load/unload cycles representing the calibration procedure for forcesensors. No hysteresis effects are evidenced; (b) Stagnant zone occurringupstream of the obstacle and the three parameters chosen to describe itstemporal evolution.
positions all along the upstream face of the obstacle. The load/unload cyclehas been tested to find out potential hysteresis effects. Fig.3a shows that theseeffects are negligible. Two different kind of validations [2] has been carried outto test the reliability of the calibration. With those two methods, the maximumestimated error is equal to 21mN for a minimum calibration force of 0.65N, whichcorresponds to an error of 3%.
2.3.3 Image treatmentSide view recordings allow the investigation of the parameters characterizing theevolution of the stagnant zone. With respect to Fig.3b, the stagnant zone is definedas the area upstream of the obstacle where the obstacle exerts its influence on theflow. To quantify its evolution, three parameters have been chosen: the length Lof the influence zone, the mean inclination angle α of the free surface and theinvolved surface S. The high speed video camera is set at an acquisition frequencyof 350fps. Image treatment analyses each picture, detects the area occupied bythe flow and derives the corresponding free surface profile. This profile allowsthe definition of the three parameters every t = 1/350s. The treatment has beenvalidated by a cross comparison with data obtained for flow depth measurementsrealised with and without the obstacle thanks to the laser technique. The precisionof this method depends, as for the flow depth case, on the dilution rate of theflow. The arrival and the final phase of the flow are characterised by a very dilutestate where image treatment cannot be very reliable. For the rest of the flow theestimated error in the free surface detection is less than 2d, which corresponds toan error of less than 2% on the final deposit mean length.
3 Results
3.1 Experimental data
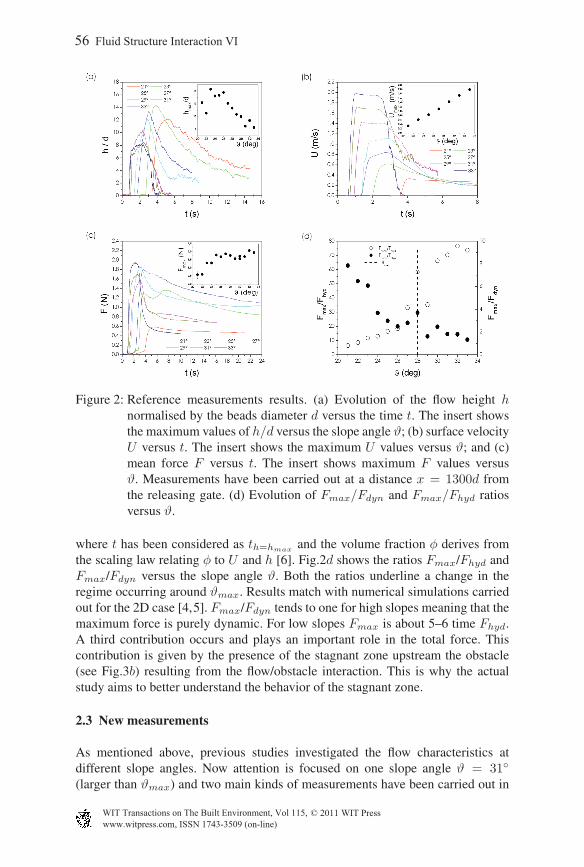
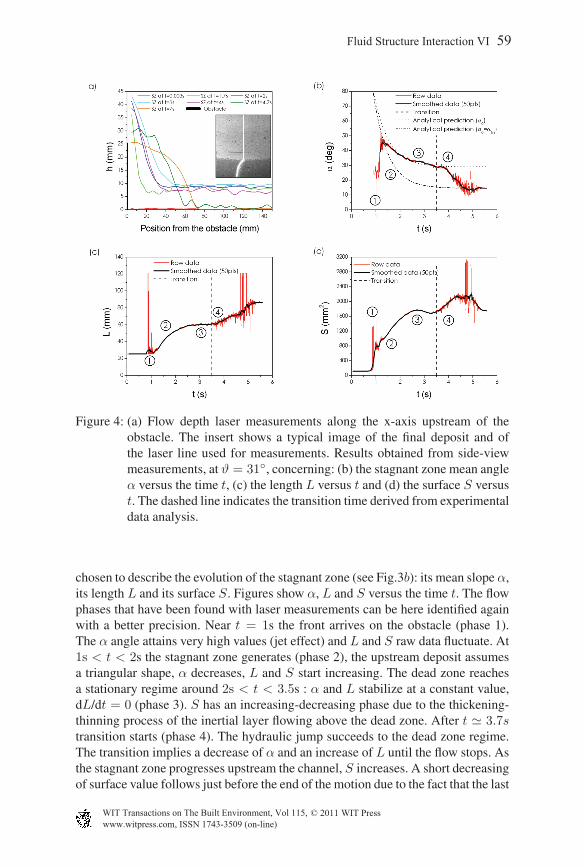
A first rough analysis of the obtained videos (side view) gives an impression that atransition occurs in the stagnant zone regime. Both realised measurements confirmit. Fig.4a shows the flow height h along the x-axis upstream of the obstacle. Heightvalues have been obtained with the laser technique. With respect to curves inFig.4a, at 0.003s < t < 1.3s the avalanche front arrives, it impacts the obstacle anda jet occurs. Near t = 2s a dead zone regime is attained. A quasi-static triangularzone forms upstream of the obstacle and the inertial flow starts flowing above.This inertial layer becomes thicker (t = 3s) and then thinner again before thetransition starts. In fact, at 4s < t < 4.7s the stagnant zone switches from a deadzone to a granular jump regime. Curves show a change in the stagnant zone shape.The triangular quasi-static zone develops into more of a trapezoidal surface (seeFig.5a), increasing in volume and progressing upstream in the opposite direction ofthe flow until the motion stops. This new regime is characterized by a discontinuityin flow depth and surface velocity.
Fig.4b, c and d show results obtained thanks to an accurate treatment of sideview images. As already mentioned in section 2.3.3, three parameters have been
Figure 4: (a) Flow depth laser measurements along the x-axis upstream of theobstacle. The insert shows a typical image of the final deposit and ofthe laser line used for measurements. Results obtained from side-viewmeasurements, at ϑ = 31◦, concerning: (b) the stagnant zone mean angleα versus the time t, (c) the length L versus t and (d) the surface S versust. The dashed line indicates the transition time derived from experimentaldata analysis.
chosen to describe the evolution of the stagnant zone (see Fig.3b): its mean slope α,its length L and its surface S. Figures show α, L and S versus the time t. The flowphases that have been found with laser measurements can be here identified againwith a better precision. Near t = 1s the front arrives on the obstacle (phase 1).The α angle attains very high values (jet effect) and L and S raw data fluctuate. At1s < t < 2s the stagnant zone generates (phase 2), the upstream deposit assumesa triangular shape, α decreases, L and S start increasing. The dead zone reachesa stationary regime around 2s < t < 3.5s : α and L stabilize at a constant value,dL/dt = 0 (phase 3). S has an increasing-decreasing phase due to the thickening-thinning process of the inertial layer flowing above the dead zone. After t ≃ 3.7stransition starts (phase 4). The hydraulic jump succeeds to the dead zone regime.The transition implies a decrease of α and an increase of L until the flow stops. Asthe stagnant zone progresses upstream the channel, S increases. A short decreasingof surface value follows just before the end of the motion due to the fact that the last
portion of the avalanche volume flows down the channel eroding a part of the finalvolume. After t ≃ 5.2s the avalanche flow comes to a standstill. The final deposit,stored upstream of the obstacle, is then characterized by constant values of thethree parameters corresponding to static condition. Additionally, Fig.4b shows theanalytical predictions for the stagnant zone slope angle. An empirical exponentiallaw defines the angle α as
α = α0 +(π2− α0
)e
Ti−t
τ (3)
(see for details [3]). α0 is the value of α attained for stationary regime (α0 = 29◦),Ti the time of impact (Ti = 0.8s) and τ is a characteristics time of the flow(τ = 0.6s). This empirical law allows to reproduce the behavior of α duringthe formation of the stagnant zone until the stationary phase. If forcing theprediction to stabilize α at a value corresponding to the α angle of the final deposit(αfin = 14.5◦), the law is not reliable any more except for the final slope value.Fig.4b highlights that the difference between the final deposit value of α (αfin)and the stationary value (α0) is due to the observed transition from the dead zoneto the granular jump regime.
3.2 Theoretical analysis and prediction
The dead zone to granular jump transition has been analysed more in details.According to the classical analysis of bi-dimensional hydraulic jump, the massand momentum fluxes are conserved across the jump while the mechanical energyis dissipated [8]. Eq.(4) is obtained writing the mass and momentum conservationacross a stationary jump in order to calculate the critical obstacle height which cangenerate a jump:
Hc
h=
1
2(√1 + 8Fr2 − 1)− Fr2/3 (4)
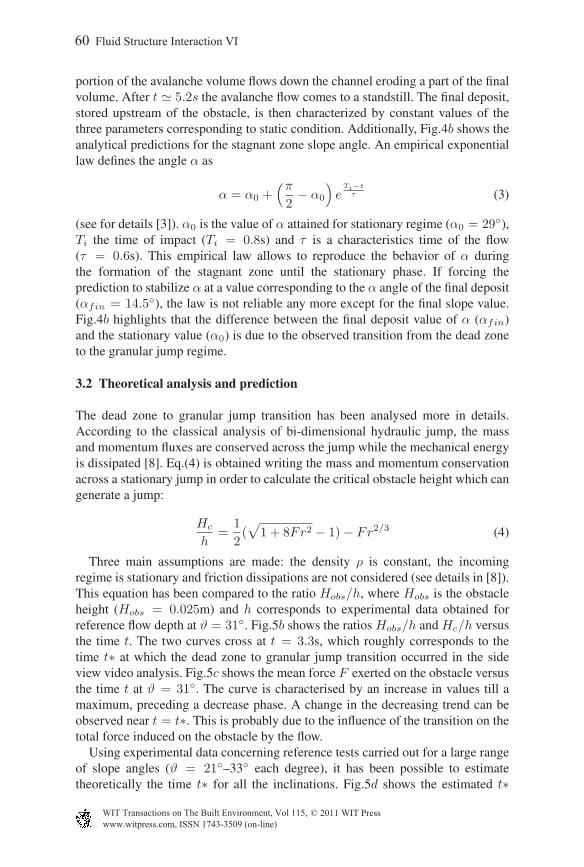
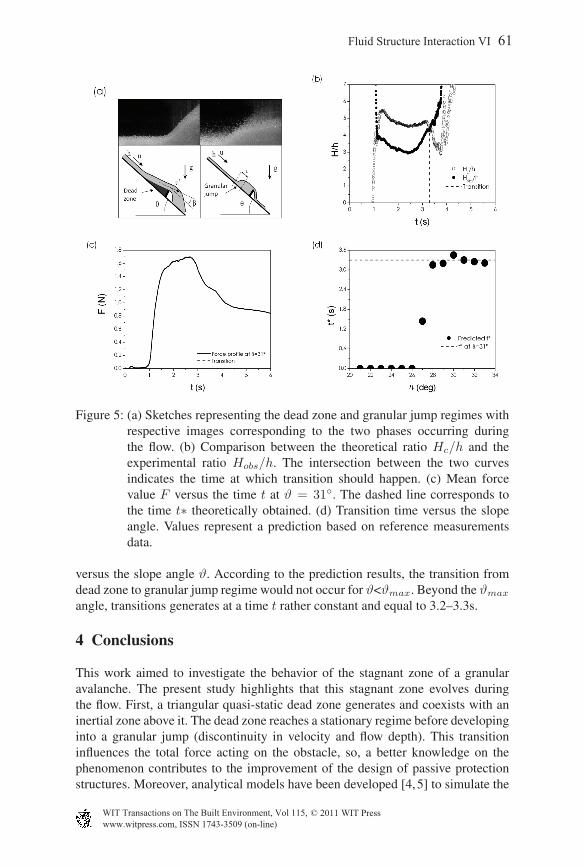
Three main assumptions are made: the density ρ is constant, the incomingregime is stationary and friction dissipations are not considered (see details in [8]).This equation has been compared to the ratio Hobs/h, where Hobs is the obstacleheight (Hobs = 0.025m) and h corresponds to experimental data obtained forreference flow depth at ϑ = 31◦. Fig.5b shows the ratios Hobs/h and Hc/h versusthe time t. The two curves cross at t = 3.3s, which roughly corresponds to thetime t∗ at which the dead zone to granular jump transition occurred in the sideview video analysis. Fig.5c shows the mean force F exerted on the obstacle versusthe time t at ϑ = 31◦. The curve is characterised by an increase in values till amaximum, preceding a decrease phase. A change in the decreasing trend can beobserved near t = t∗. This is probably due to the influence of the transition on thetotal force induced on the obstacle by the flow.
Using experimental data concerning reference tests carried out for a large rangeof slope angles (ϑ = 21◦–33◦ each degree), it has been possible to estimatetheoretically the time t∗ for all the inclinations. Fig.5d shows the estimated t∗
Figure 5: (a) Sketches representing the dead zone and granular jump regimes withrespective images corresponding to the two phases occurring duringthe flow. (b) Comparison between the theoretical ratio Hc/h and theexperimental ratio Hobs/h. The intersection between the two curvesindicates the time at which transition should happen. (c) Mean forcevalue F versus the time t at ϑ = 31◦. The dashed line corresponds tothe time t∗ theoretically obtained. (d) Transition time versus the slopeangle. Values represent a prediction based on reference measurementsdata.
versus the slope angle ϑ. According to the prediction results, the transition fromdead zone to granular jump regime would not occur for ϑ<ϑmax. Beyond the ϑmax
angle, transitions generates at a time t rather constant and equal to 3.2–3.3s.
4 Conclusions
This work aimed to investigate the behavior of the stagnant zone of a granularavalanche. The present study highlights that this stagnant zone evolves duringthe flow. First, a triangular quasi-static dead zone generates and coexists with aninertial zone above it. The dead zone reaches a stationary regime before developinginto a granular jump (discontinuity in velocity and flow depth). This transitioninfluences the total force acting on the obstacle, so, a better knowledge on thephenomenon contributes to the improvement of the design of passive protectionstructures. Moreover, analytical models have been developed [4,5] to simulate the
dynamical behavior of an avalanche interacting with an obstacle. These modelsare based on the assumption that the parameters of the stagnant zone evolve asmentioned in Section 3.1, without taking into account the dead zone to granularjump transition. So these results additionally allow the improvement of analyticalmodels providing a contribution to the general knowledge on the physics ofgranular avalanches around an object.
Acknowledgements
This study received financial support from the European project Dynaval(INTERREG-ALCOTRA). The authors would like to thanks Frederic Ousset forhis crucial contribution to the experimental device design and Benoit Chanut forprevious inspiring works.
References
[1] P. Bartelt and B. W. McArdell. Instruments and methods: Granulometricinvestigation of snow avalanches. Journal of Glaciology, 55:829–833, 2009.
[2] P. Caccamo, B. Chanut, T. Faug, H. Bellot, and F. Naaim-Bouvet. Small-scaleexperiments to investigate dry granular avalanche dynamics and forces on awall-like obstacle. Granular Matter, in prep.
[3] B. Chanut. Force exercée par une avalanche granulaire dense sur unobstacle. Application aux digues de protection paravalanche. PhD thesis,University of Grenoble, 2010.
[4] B. Chanut, T. Faug, and M. Naaim. Time-varying force from dense granularavalanches on a wall. Physical review E, 82(041302):1–12, 2010.
[5] T. Faug, R. Beguin, and B. Chanut. Mean steady granular force on a walloverflowed by free-surface gravity-driven dense flows. Physical Review E,80(021305):1–13, 2009.
[6] Y. Forterre and O. Pouliquen. Flows of dense granular media. The AnnualReview of Fluid Mechanics, 40:1–24, 2008.
[7] GDRMiDi. On dense granular flow. The European Physical Journal E,14:341–365, 2004.
[8] K. M. Hákonardóttir. The interaction between snow avalanches and dams.PhD thesis, University of Bristol, 2004.
[9] O. Pouliquen. Scaling laws in granular flows down rough inclined planes.Physics of Fluids, 11(3):542–548, 1999.
[10] P.G. Rognon, F. Chevoir, H. Bellot, F. Ousset, M. Naaim, and P. Coussot.Rheology of dense snow flows: inferences from steady state chute-flowexperiments. Journal of Rheology, 52(3):729–748, 2008.
[11] B. Salm. Flow, flow transition and run-out distances of flowing avalanches.Annals of Glaciology, 18:221–226, 1993.
[12] B. Sovilla, M. Kern, and M. Schaer. Slow drag in wet-snow avalanche flow.Journal of Glaciology, 56(198):587–592, 2010.