SERI/TR-252-2382 UC Category: 59a DE84013037 Experiments on Sorption Hysteresis of Desiccant Materials A. Pesaran F. Zangrando August 1984 Prepared under Task No. 1600:22 FTP No. 443 Solar Energy Research Institute A Division of Midwest Research Institute 1617 Cole Boulevard Golden, Colorado 80401 Prepared for the U.S. Department of Energy Contract No. DE-AC02-83CH10093
Transcript
SERI/TR-252-2382UC Category: 59 aDE84013037
Experiments on SorptionHysteresis of DesiccantMaterials
A. PesaranF. Zangrando
August 1984
Prepared under Task No. 1600:22FTP No. 443
Solar Energy Research InstituteA Division of Midwest Research Institute
1617 Cole BoulevardGolden, Colorado 80401
Prepared for the
U.S. Department of EnergyContract No. DE-AC02-83CH10093
Printed in the United States of AmericaAvailabte from:
National Technical Information ServiceU.S. Department of Commerce
5285 Port Royal RoadSpringfield, VA 22161
Price:Microfiche A01
Printed Copy AO?
NOTICE
This report was prepared as an account of work sponsored by the United StatesGovernment. Neither the United States nor the United States Department of Energy,nor any of their employees, nor any of their contractors, subcontractors, or theiremployees, makes any warranty, express or implied, or assumes any legal liabilityor responsibility for the accuracy, completeness or usefulness of any information,apparatus, product or process disclosed, or represents that its use would notinfringe privately owned rights.
S-~I /..~'"- II II- ~~~
PREFACE
TR-2382
This report documents the test facility, experimental procedure,and eKperimental results on sorption properties of promisingdesiccant materials to be used in solar desiccant cooling systems. This research was performed under task 1600.22 of the SolarDesiccant Cooling Program at Solar Energy Research Institute forthe U.S. Department of Energy. The authors would like to acknowledge the contribution of Harry Pohl, the laboratory technician,who wi'ed the instrumentation and ran the experiments; review comments by Terry Penney, Ken Schultz, and Al Czanderna of SERI,Kirk C<llier of Collier Engineering, and especially AnthonyFraioli of Argonne National Laboratory are appreciated.
f1.f).p~A. Pesaran
F. Zan
Approved for
SOLAR ENERGY RESEARCH INSTITUTE
~I=Solar Heat Research Division
TR-2382S=~II_I----------------------..!..!:~1..Q£
SUMMARY
Objective
To develop a test facility to measure the sorption properties of candidatesolid desiccant materials under dynamic conditions as well as equilibrium conditions, under different geometrical configurations, and under a broad rangeof process air stream conditions characteristic of desiccant dehumidifieroperation.
Discussion
The report summarizes the theory of perturbation chromatography and its application to determining sorption properties; describes the test facility, theinstrumentation, and its capabilities; describes the test cells used toevaluate the effect of dehumidifier geometry (packed bed and parallel passage)on dynamic performance; and details the methodology used for the dynamic andequilibrium experiments conducted on silica gel.
Conclusions
The results of experiments conducted on silica gel in various geometries ofdehumidifiers for solar cooling are displayed graphically and discussed interms of dimensionless parameters, which facilitate comparison of the varioustests. The dependence of the sorption processes on air velocity and test cellaspect ratio was identified. It was found that with an increase in airvelocity and aspect ratio, the rotational speed of a parallel passage dehumidifier wheel should increase. The dynamic hysteresis between adsorption anddesorption processes was also identified. The dynamic hysteresis showedfundamental differences between the adsorption/desorption process which has tobe accounted for in the modeling to accurately predict dehumidifier performance in solar cooling applications. The experiments provide data on thedynamic performance of silica gel in a parallel-passage configuration, whichis under preparation for tests in a rotary dehumidifier that will be conductedat SERI in late FY 1984. The experimental results of the equilibrium testswere in discrepancy with the published data. The possible reasons for thisdiscrepancy were attributed to invalidity of one of the basic assumptions inthe theory of isotopic perturbation chromatography for silica gel-water vaporsystems under the experimental conditions of this study.
iv
S=~I
TABLE OF CONTENTS
TR-2382
1.0 Introduction•••••••••••••••••••••••••••••••••• s ••••••••••••••••••••• 1
1.1 Background...................................................... 11.2 Purpose of this Study........................................... 3
2.0 Application of Chromatography to Sorption••••••••••••••••••••••••••• 4
2.12.22.3
Background ••••••••••••••••••••••••••••••••••••••••••••••••••••••Perturbation Chromatography •••••••••••••••••••••••••••••••••••••Theory of Perturbation Chromatography •••••••••••••••••••••••••••
445
3.0 Description of the Experimental Set-Up •••••••••••••••••••••••••••••• 8
4.0 Description of Test Cells ••••••••••••••••••••••••••••••••••••••••••• 16
4.1 Introduction.................................................... 164.2 Material........................................................ 164.3 Packed Bed Test Cell............................................ 164.4 Parallel Passage Test Cell...................................... 16
Appendix C - Detailed Operating Procedure •••••••••••••••••••••••••••••••• 59
C.IC.2C.3C.4C.5C.6C.7
Procedure ••••••••••••••••••••••••••••••••••••••••••••••••••••••Preliminary Set-Up•••••••••••••••••••••••••••••••••••••••••••••Isothermal Bath for the Gas Bubbler••••••••••••••••••••••••••••Heaters (2 kW and 6 kW) ••••••••••••••••••.•••••.•••••••••••••••Thermal Conductivity Power Unit Start-Up •••••••••••••••••••••••Operation of Ultra High Vacuum System••••••••••••••••••••••••••Overall Shut-Down Instructions •••••••••••••••••••••••••••••••••
59626364656667
Appendix D - Raw Data•••••••••••••••••••••••••••••••••••••••••••••••••••• 68
D.I
D.2
Samples of Data from Residual Gas Analyzer and ThermalConductivity Detector ••••••••••••••••••••••••••••••••••••••••••Breakthrough Data for Each Experiment ••••••••••••••••••••••••••
1-1 Equilibrium Data for Regular Density Silica Gel..................... 13-1 Schematic Diagram of the Improved Experimental Set-Up as
Originally Designed••••••••••••••••••••••••••••••••••••••••• 5....... 9
3-2 Schematic Diagram of the Chromatograph Loop......................... 103-3 Schematic Diagram of the Residual Gas Analyzer...................... 113-4 Schematic Diagram of the Humidifier System.......................... 133-5 Schematic Diagram of the Injection Subsystem........................ 144-1 Schematic of the Packed Bed Test Cell............................... 174-2 Schematic of the Parallel Passage Test Cell......................... 184-3 Parallel Passage Test Cells......................................... 196-1 Typical Breakthrough Data for Adsorption of Water Vapor on Silica
Gel in a Parallel Passage Geometry (Experiment No 43)............... 256-2 Typical Breakthrough Data for Desorption of Water Vapor from
Silica Gel in a Parallel Passage Geometry (Experiment No. 44) ••••••• 29
6-3 Repeatability of Breakthrough Data for Experiment Nos. 40 and 42 •••• 3.0
6-4 Repeatability of Breakthrough Data for Experiment Nos. 1 and lR••••• 31
Solid desiccant cooling systems, which can take advantage of solar energy,have received considerable attention as an alternative to standard vapor compression systems for air conditioning. The system process involves drying anair stream by passage through a desiccant bed and subsequent evaporativecooling to provide the air conditioning. The desiccant in the dehumidifier isregenerated with hot air provided by energy obtained from either a gas burneror solar collectors [1, 2]. The thermal performance of the system depends onthe efficiency of each component. The technology of all the components exceptdehumidifiers is reasonably advanced and components with fairly high effectiveness (between 0.9 and 0.95) are available; thus the greatest potential forimproving system performance lies in the development of advanced, highlyeffective dehumidifiers. The performance of the dehumidifier is limited bythe sorption desiccant capacity, sorption properties, and long-term stabilityunder cyclic operation conditions. The sorption processes in the desiccantbed are the passage of a thermal and a mass transfer wave with different diffusivities. Until recently, most of the research on solid desiccants wasmotivated by industrial adsorption applications involving thick packed bedsoperating near equilibrium conditions. This resulted in the compilation ofphysical property data for the most common industrial desiccant materialsunder equilibrium conditions, yet considerable scatter exists in the equilibrium isotherms in the literature; e s g , , ±15% scatter for silica gel (seeFigure 1.1). The much thinner desiccant cooling system dehumidifiers and
the advanced dehumidifier geometries proposed imply that the bed will notoperate at equilibrium because only a portion of the mass transfer wave willbe contained in the bed.
Two computer models have been developed to predict the performance of dehumidifiers. Barlow [2] developed a pseudo-steady-state model for coupled heatand mass transfer in desiccant dehumidifiers based on heat exchanger effectiveness equations. This model uses lumped gas-side heat and mass transfercoefficient correlations and is based on published equilibrium data of desiccant properties. The model showed good agreement with single-blow adsorptiontests, while the agreement was poor for desorption tests, even when differenteffective transfer coefficients were used for the two processes. Pesaran [3]developed a model at the University of California, Los Angeles, for the SolarEnergy Research Institute (SERI) that includes solid-side mass transfer resistance and showed that in packed beds the solid-side resistance controls thetransfer process. This model showed an improvement in predicting the adsorption process but an equal discrepancy in predicting the desorption process.These models have shown that performance predictions for thin beds, characteristic of desiccant cooling dehumidifiers, are very sensitive to variationsin physical properties and effective transfer coefficients. For example,Table 1-1, adapted from Herzenberg et ale [4], shows the effect of varioussilica gel properties on the performance of a dehumidifier. It can be seenthat heat of adsorption, isotherm shape, and hysteresis can have a strong
Table 1-1. Desiccant Properties and Dehumidifier Efficiency
Property Direction of Changeb
Heat of adsorption
Isotherm shapec
Hysteresis on thermal cyclingd
Maximum water capacitye
Moisture diffusivityf
Thermal capacitanceg
10-25%
20%
15-30%
9-11%
8%
15%
See Note c
+
+
a611 D is dehumidifier efficiency; ranges reflect variation withinlet state parameters
bFor increase in property value
clsotherms with a convex shape at low water vapor pressure, i.e.,type III and type V isotherms, plus the capillary action inhighly porous materials, are preferred
dCorresponds to a linear isotherm for adsorption and a convexregeneration isotherm
eCorresponds to shift from 25% to 100% capacity
fCorresponds to a factor of 4 decrease in moisture resistance
gCorresponds to tripling of thermal capacitance
2
TR-2382S=~II;."'~]-----------------------~- ~~~
impact on performance. This impact shows the need for accurate knowledge ofthe sorption properties of the desiccant and to correlate· them to dynamicoperating conditions in the various geometries being considered for theadvanced dehumidifier design [6]. The difference between adsorption anddesorption processes as noted by Barlow [2] and Pesaran [3] needs to beinvestigated under more controlled conditions.
1.2 PURPOSE OF THIS STUDY
Our objective has been to develop a versatile test facility to measure thesorption properties of candidate solid desiccant materials under dynamic aswell as equilibrium conditions and under different geometrical configurations. The chromatograph test facility assembled at SERI allows us to measuredynamic adsorption/desorption characteristics of any promising advanced desiccant material under a broad range of process air stream conditions characteristic of desiccant dehumidifier operation. It also allows us to analyzethe effect of various dehumidifier geometries on the dynamic performance ofthe desiccant. Experimental data obtained will permit us to improvetheoretical models of heat and mass transfer processes and dehumidifier performance models.
The first tests conducted in the sorption hysteresis test facility evaluatedthe dynamic sorption characteristics of silica gel under isothermal conditionsand the effect of dehumidifier geometry on the mass transfer process. Thesetests provide data for a silica gel, parallel-passage dehumidifier that willbe tested at SERI in FY 1984 [6]. Future tests will concentrate on characterizing other promising desiccant materials as well as on producing basicdata on sorption properties at near-adiabatic (instead of isothermal) conditions, which simulates the operation of actual desiccant dehumidifiers moreclosely.
The following sections summarize the theory of perturbation chromatography andits application to determining sorption properties; describe the SERI testfacility, instrumentation, and capabilities; describe the test cells used toevaluate the effect of dehumidifier geometry on dynamic performance; detailthe methods used for the dynamic and equilibrium experiments; discuss theexperimental results obtained in the first set of tests conducted in thisfacility; and summarize future test plans. The methods for data reduction aredescribed in Appendix A, the preparation of the test cells is described inAppendix B, the detailed operating procedure is described in Appendix C, andAppendix D contains the raw data collected at this test facility.
Two methods to measure desiccant sorption properties under controlled processair stream conditions of temperature, pressure, and water vapor concentrationare the following:
• Gravimetry, whereby a small sample of desiccant is suspended from amicrobalance in a chamber and exposed to the process air; direct measurement of the sample mass gives desiccant water content as a functionof time.
• Perturbation chromatography, whereby the process air stream flows into atest cell that contains the desiccant material, the air stream interactswith the desiccant, and the concentration of the outlet air stream ismonitored as a function of time; the water content of the sample is thencalculated from the retention time of an isotopic tracer injected intothe test cell.
While gravimetric techniques have very high accuracy, they cannot simulatedehumidifier geometry. Use of these techniques would require correlation withdata obtained in tests that can reproduce dehumidifier geometry. Chromatographic techniques are not as direct as gravimetric techniques, require moredata reduction, and are generally not as accurate to determine equilibriumconditions, but the test cell can be built to simulate a section of thedehumidifier; therefore, parametric studies can evaluate the effect of dehumidifier geometry and desiccant bonding methods on the dynamic sorptionproperties, which is why we chose a chromatograph loop for these tests.
2.2 PERTURBATION CHROMATOGRAPHY
In a chromatograph loop, a stream of dry process air can either flow directlyinto the test cell or it can first be humidified to a controlled water vaporconcentration. The thermal conductivities of the inlet and outlet streams arecompared in a two-chamber thermal conductivity detector. In the adsorptionprocess humid air is introduced into the initially dry test cell, the water issorbed by the dry desiccant, the air is dried, and the thermal conductivitydetector shows a large deviation. As the desiccant becomes loaded with water,the outlet water vapor concentration rises and the deviation decreases. Atequilibrium, the inlet and outlet water vapor concentrations match once againand the thermal conductivity detector shows no deviation. The reverse occursfor a desorption process. Therefore, the output of the thermal conductivitycell provides breakthrough data (effluent concentration as a function of time)for the sorption processes, giving sorption rate information. The actual concentration of the outlet stream can be determined from inlet conditions andthermal conductivity correlations, or it can be measured directly, as isdiscussed in Section 3.0. Once equilibrium is reached in the test cell, thewater content of the desiccant sample can be calculated after measuring the
retention time of isotopically labeled water vapor injected into the processair stream. This retention time can be obtained by observing the variation inthermal conductivity as the isotope peak passes through the thermal conductivity detector. The water content of the desiccant can be expressed as afunction of process stream conditions and retention times. This dependence isderived in Section 2.3.
2.3 THEORY OF PERTURBATION CHROMATOGRAPHY
The following derivation is adapted from Pitts and Czanderna [7]. Consider agas at water concentration C(x, t ) eluting through a test cell containing adesiccant of dry mass m and water content W(x,t). By continuity, the changein water concentration in a section of the test cell is given by the net fluxinto that section, or
on + V o(Cu)at ox o , (2-1)
where n is the total number of moles of H20 molecules in the section. Becausen = CsVs + CV, then by substitution in Eq. 2-1 we have
oCs oC oC V au + oCVs ~~ + V~ + C ox u V ox = 0 • (2-2)
Assuming that the process stream velocity in the test cell, u, is constant,then au/ox = 0 and Eq. 2-2 can be written as
uV ec
s s1 + v"8"C""
Since C is a conserved quantity, the Lagrangian derivative is zero, so we canwrite the velocity of a perturbation in C as
If an isotopic perturbation is introduced into the test cell and its relatedvariables are labeled with an asterisk, then Eq. 2-4 becomes
oC *V + __s_
oC*(2-5)
Assuming that the sorption process does not distinguish between the labeledand unlabeled water molecules, then
C *s
C C*s=--C
andoC·* C__s_ = ~.oC* C
(2-6)
Substituting this into Eq. 2-5 yields
V *R
CsV +-- •C
Substituting the desiccant water content (Wequation gives
Vs Cs Mw/m) in the above
V+-1!!WM C
w
and finally,
W (V * - V)R
M Cwm • (2-7)
In a real experiment, VR* cannot be measured directly because there is deadvolume, or volume between the test cell and detectors that is not packed. Thechromatograph described here uses the bypass method to correct for the deadvolume.
The bypass (a short length ofa six-port switching valve.suring the time it takes theand through the bypass:
empty tubing) and the test cell are attached toThe retention volume can be determined by meaperturbation to propagate through the test cell
V *R
V *R, tc- V *R,
= Q. t* Q. t*bp tc tc - bp bp
6
TR-2382S=~II_I---------------------==-'--"---'--
therefore
wM C
wm
The free gas volume, V, can be measured by passing a nonreactive gas, such ashelium, through the test cell and bypass, thus
V
therefore, the desiccant water content becomes
w [Q (t*tc tc
(2-8)
The flow rates and concentration in Eq. 2-8 can be expressed in terms of theequilibrium conditions of the process air prior to injection into the testcell/bypass section; the derivation of these relations for the SERI chromatograph loop is given in detail in Appendix A.
The measurement of retention time at one temperature and concentration yieldsone point on a sorption isotherm and is equivalent to measuring the massgained by a fixed sample of desiccant suspended from a microbalance andexposed to the same air stream conditions.
An isotherm is constructed from retention time data taken at different concentrations; a set of isotherms taken in this manner yields heat of adsorpti~n
information, as would be obtained gravimetrically. However, the use ofchromatography allows us to evaluate the effect of test cell geometry anddesiccant bonding techniques on the dynamic and equilibrium properties of thedesiccant.
A gas chromatographic sorption apparatus to characterize the sorption properties of desiccants was designed and constructed at the end of 1979 bySERI [7]. The apparatus was modified substantially for the present study.The experimental set-up consists of a chromatograph, support subsystems, andinstrumentation. A schematic diagram of the modified experimental set-up isgiven in Figure 3-1.
The gas reservoir consists of one or more cylinders of compressed, "bone-dry"air (less than 3-ppm water content). The air passes through a two-stagepressure regulator (manufactured by Union Carbide, Linde) and enters a manifold of two mass flow controllers (manufactured by Tylan). These control theair mass flow rate over a wide range and feed the gas into a humidifier toobtain the desired level of water vapor concentration in the process stream.The detail of the humidifier is explained in Section 3.3.3.
The humidified air then passes to a dew point hygrometer sensor (manufacturedby General Eastern), which measures and monitors the dew point temperature.The absolute pressure is monitored by a pressure transducer (manufactured byMKS Instrument, Inc.) at this point, and the gas stream is fed into thechromatograph, which is immersed in a constant-temperature bath. Samples ofisotopic tracer (D20) plus air as well as nonadsorbing gas (helium) can beinjected into the desiccant test cell via a 10-port switching valve V2(Figures 3-2 and 3-5). The details of the chromatograph and support subsystems are described in this section.
3.2 CHROMATOGRAPH LOOP
The chromatograph, shown in detail in Figure 3-2, consists of a thermal conductivity detector (D), three switching valves (VI, V2, V3), two sample loops(SI, S2), a bypass loop (bp), and the test cell (tc) containing a desiccant.The flow first enters a six-port switching valve (VI), which provides eitherthe process stream, i.e., air and water vapor (VI in primary position), orbone-dry air (VI in secondary position). The flow enters the first loop of athermal conductivity detector, then goes to a 10-port switching valve containing 2 sample loops for the injection of isotopic tracer (heavy water, D?O)or a nonadsorbing gas (helium). Next, the flow passes through another SlX
port switching valve, which contains the desiccant test cell and the bypassloop. The stream emerges from the test cell (V3 in primary position) orbypass (V3 in secondary position) and passes through the second loop of thethermal conductivi ty detector. At this point, the pressure drop across thechromatograph loop is measured using a differential pressure transducer (manufactured by MKS Instrument, Inc.). Then the process stream passes through anexhaust manifold where needle valves control the pressure maintained in theline at any given flow rate. A small portion of the process stream is theninjected into the vacuum chamber of the residual gas analyzer for analysis.
SWitching valves V1, V2, V3~ Gas flow in primary position--+ Gas flow in secondary position
(020 air exhaust)He
t
Thermalconductivity
---. detectoro
Bone dry ~ tairExhaust
Figure 3-2. Schematic Diagram of the Chromatograph Loop
Finally, the stream passes to a vacuum pump, through an atmospheric exhaust,and then outside the building.
3.3 SUBSYSTEMS
3.3.1 Constant-Temperature Bath
This subsystem consists of a 40-gal stainless steel tank filled with deionizedwater, a 2-kW (llO-V) heater, three 6-kW (480-V) heaters, two temperature controllers, a compressed air driven mixer (manufactured by Mixing Equipmentcs.), and a hydraulic scissor· jack (manufactured by American ManufacturingCo. ). The heaters are supported on a platform that also will act as a coverfor the tank when it is raised by the jack. The 6-kW heaters act as boostheaters to speed up the process of raising the water temperature. When thetemperature of the bath reaches within 10 to 2°C of the final desired bathtemperature, the temperature controller (manufactured by White-Rodgers) turns
. off the heaters. Through a thermistor-operated proportional temperature controller (manufactured by Yellow Springs Instruments), the 2-kW heater providesthe required power to compensate for the heat losses from the tank to maintaina stable bath temperature. For temperatures below ambient, a recirculatingcooler (manufactured by Neslab) is used.
3.3.2 Residual Gas Analyzer
This subsystem consists of an ultra high vacuum chamber, a pumping unit, a gasinlet valve, a forepump, and a capillary tube (all manufactured by Balzers),
10
TR-2382S=~II_;-------------------------
several heating tapes, a quadrupole mass analyzer (manufactured by SpectrumScientific Limited), and an associated mass spectrometer (DATAQUAD, manufactured by Spectrum Scientific Limited). The pumping unit consists of aturbomolecular pump to obtain ultra high vacuum, a rotary vane pump forbacking, and the control electr~~ics. ~e vacuum in the chamber is measuredby a vacuumfauge controller (10 to 10 torr) and a convection vacuum gauge(10-4 to 10 torr) (manufactured by Granville-Phillips). A schematic set-upof this subsystem is given in Figure 3-3.
The pumping unit removes the air and other gases from the vacuum chamber. Thesurface of the chamber is kept at 800 to 1000C to prevent adsorption ofmolecules to the interior surface and to have a J.:.~wer va~gum. The pumpingunit reduces the vacuum in the closed chamber to 10 to 10 torr. The quadrupole mass analyzer emits electrons, which ionize the molecules and atoms inthe chamber. The ionized gases in the chamber move toward the quadrupole,which measures the intensity (proportional partial pressure) of each ionizedmolecule based on its mass to charge ratio. The mass spectrometer (DATAQUAD)shows the results of th~ quadrupole analysis. DATAQUAD controls the range ofmass to charge ratio and the analysis rate of the quadrupole.
When the vacuum reaches its lower limit of 10-9 to 10-8 torr, DATAQUAD is setto analyze the gas in the chamber, which often is referred to as BACKGROUND.A small portion of the process gas is sampled through the heated capillaryinto the vacuum chamber by opening the gas inlet valve. A forepump draws thesample into the vacuum chamber at a fast rate (~128 L/s2~ The operatingvacuum for analysis of a sample is usually from 10 to 10 torr. The process gas is analyzed and the background analysis is subtracted from thisanalysis to find the true partial pressure of each mass to charge ratio.
Mass spectrometerRecorder
Quadrupole mass analyzer
E~Q)
iii1Il1IlQ)Ua'-Q.
Pumpingunit
Capillary tube
Vacuumchamber
Gas inlet valve
Vacuum gaugecontroller
Fore pump
Figure 3-3. Schematic Diagram. of the Residual Gas Analyzer
DATAQUAD also can monitor the partial pressure of one specific mass to chargeratio continuously (when in TREND ANALYSIS mode), which is a desirable featurefor transient experiments.
3.3.3 Humidifier
The humidifier is used to provide different, but uniform, humidity ratios tothe chromatograph loop. This subsystem consists of a lZ-gal isothermal bath(manufactured by Tams on) , a recirculating cooler (manufactured by Neslab), agas bubbler, a trap, and a mist eliminator. A schematic of the humidifier isgiven in Figure 3-4. Bone-dry air flows through the bubbler, which is aclosed stainless steel cylinder (0.15-m height and 0.04-m diameter), where theair comes into contact with deionized water. The air becomes saturated withwater vapor at a desired temperature when leaving the bubbler. A large masstransfer surface area is required to accomplish this task, therefore a (10-,u)sparger (porous metal) is used in the bubbler to break the air into finebubbles (l-mm diameter). The saturated air then goes into the trap where anycarry-over water is separated from the air and then enters into the misteliminator where very fine droplets of water are captured. The trap is anempty, closed PlexiglassR cylinder (0.30-m length and 0.07 -m diameter). Themist eliminator is a stainless steel cylinder (O.l-m length and O.OZ-mdiameter) filled with micron-size stainless screen for capturing the finedroplets. The saturated air, which does not have any entrained droplets, goesto the chromatograph loop through a dew point sensor and an absolute pressuretransducer. The humidity ratio of the inlet air to the chromatograph loop canbe calculated at this point (see Appendix A). The isothermal bath provides auniform temperature environment for the bubbler, trap, and mist eliminator;the recirculating cooler provides a stable temperature in the isothermal bathfor temperatures below ambient temperature. Note that the parameters thatcontrol the inlet humidity ratio to the chromatograph are this isothermal bathtemperature and the pressure in the system. Different inlet humidity ratioscan thus be obtained for different experiments by setting both the pressureand the isothermal bath temperature at desired values.
3.3.4 Isotope and Helium Injection Subsystem
This subsystem consists of helium (He) and bone-dry air cylinders, a smallchamber for mixing air and isotopic water vapor (DZO), a lO-port switchingvalve (VZ) with two sample loops (Sl, S2), and several valves for purging andcutting off. The schematic diagram of the injection subsystem is given inFigure 3-5.
When the process air is passing through one sample loop, the other loop can beloaded with He or DZO and air. Helium can be loaded by opening valves LV3 andLV5 while the other valves are closed. DZO and air can be loaded by openingvalves LVI, LV2, and LV4. The sequence of opening and closing of these valvesis explained in detail in Section 5.0. For injection of the DZO (or He) weswitch the position of 10-port valve (V2) after loading of DZO (or He) iscompleted.
12
TR-2382S=~III.II---.-------------------
Process air in
0 20 cut-offvalveLV2
Process air out
~
----p (/Sample loop
S2He purge valve
LV3
Air cut-off valveLV1
t--DlC:J-- 0 20 purge valveLV4
He cut-off valveLV5
Helium
Air
Figure 3-5. Schematic Diagram of the Injection Subsystem
3.4 INSTRUMENTATION
The mass flow rate of air through the system fS measured by two Tyl~n massflow controllers of different range (lO-SOO em /min and 400-20,000 cm /min).The reading of the mass flow controller is the volumetric flow rate atstandard conditions (l atm, OOC), Qreadin. The absolute pressure and pressure drop across the test cell are measure~ by an MKS absolute pressure transducer (0-1000 torr) and an MKS differential pressure transducer (0-1000 torr),respectively. All temperatures are measured using a copper-constantan (typeT) thermocouple. The humidity ratio (or water vapor concentration) of processair upstream of the test cell is measured by a General Eastern optical condensation dew point hygrometer. The composition of process air downstream ofthe test cell is measured by a residual gas analyzer. However, because of along dead volume between the test cell and the vacuum chamber of the gasanalyzer, the response of the analyzer is not fast enough for breakthroughexperiments. The residual gas analyzer measures accurately the composition ofprocess air at the start of the breakthrough experiment and when thebreakthrough is finished (when the test cell has reached its equilibriumstate). For breakthrough tests, GOW-MAC thermal conductivity detectorsmeasure the relative conductivity of effluent air stream to inlet processstream.
A thermal conductivity detector is made of a block of metal with two cavitiesand two electrical resistances (filaments) in the cavities. The process airfirst passes through one of the cavities and then to the test cell. Afterexchange of water vapor in the test cell, the air passes through the othercavity. The filaments are electrically heated, and heat transfers from thefilaments to the process air. The rate of heat transfer and thus the
temperature of the filaments depend on flow rates, temperature, pressure, andthermal conductivity of the process air. The resistance of the filamentstrongly depends on its temperature. When the same process air (pressure,temperature, flow rate, and thermal conductivity) passes through both cavitiesof the thermal conductivity detector, the resistances of the filaments areequal and the thermal conductivity detector is "balanced." The thermal conductivity of process air depends on its composition (water vapor concentration). When process air of different composition passes through the twocavities of the detector, the resistances of the filaments are not equal, andthus the detector is not balanced. The degree of deflection from balance is ameasure of the difference between the compositions of process air goingthrough the two cavities. Knowing one composition, the deflection frombalance, and calibration curve, one can measure the other composition.Usually, the deflection is measured in volts, which are linearly proportionalto concentration (see Ref. 8 and Appendix A).
Injection of DZO (or He) through the test cell (or bypass) changes the thermalconductivity detector of air and thus the deflection of the thermalconductivity detector, so thermal conductivity can be used for perturbationstudies. The residual gas analyzer is also used for detection of DZO (or He)for perturbation studies.
The output signals of all sensors, i.e., thermocouples, pressure transducers,dew point hygrometers, and thermal conductivity detector, are collected by aninterface data acquisition system (HP-3497A) and a desk computer (HP-85) at apreprogrammed time interval. The data are then recorded by a printer (EPSONMX80) or stored on a cartridge. The output signal of the thermal conductivitydetector is also recorded on a strip chart recorder (Gould-IIO) for visualobservation.
15
TR-2382
SECTION 4.0
DESCRIPTION OF TEST CELLS
4.1 INTRODUCTION
Two different configurations of test cells were designed and constructed forthe sorption hysteresis studies: packed bed and parallel passage. The packedbed test cell was used to obtain equilibrium data of the desiccant materialsand to compare the data with published values. The packed bed experimentaldata were also used as a reference base for results obtained with the parallelpassage geometry to find the effect of adhesive and filling materials onadsorption capacity. The parallel passage test cell simulates one of thechannels of the SERI parallel passage dehumidifier, which has the largest heattransfer to pressure drop ratio among the available dehumidifier geometries.Both packed bed and parallel passage test cells are described in detail inthis section. Preparation of the desiccant material selected forexperimentation is also described.
4.2 MATERIAL
The desiccant material used in this study is silica gel (Davison, Grade 40) ,since silica gel has been recommended in solar desiccant cooling applications[1,9] because of its high moisture recycling capacity in the temperature rangeavailable from solar collectors. The size of this gel as provided by themanufacturer is mesh 6-12 (1.4-3.4-mm particle diameter), but finer particles(0.1-0.5 mm) were used in the SERI parallel passage dehumidifier to haveminimal diffusional resistance in the particles. The larger gel was groundand sieved to produce two batches of finer particles with a narrower range ofdistribution: mesh 45-60 (0.3-mm average particle diameter) and mesh 60-80(0.2-mm average particle diameter). No significant changes in sorptioncapacity of silica gel are expected from the grinding, since the internal porevolume of the gel that primarily determines the sorption capacity has notchanged.
4.3 PACKED BED TEST CELL
The packed bed test cell is made of 3.2-mm (l/8-in.) a.D. stainless tubingwith 0.5-mm (0.02-in.) wall thickness and packed with small particles ofdesiccant material (e s g , , mesh 45-60, Davison Grade 40 silica gel). Thepacking length is about a.1 m (4 Ln , }, and glass wool plugs are used tosupport the particles. A schematic of the packed bed test cell is shown inFigure 4-1. The masses of the dry empty test cell and dry packed test cellare measured to obtain the mass of dry desiccant used in the test cells. SeeAppendix B for the details for preparing packed bed test cells.
4.4 PARALLEL PASSAGE TEST CELL
The SERI parallel fassage dehumidifier is composed of parallel channels ofdouble-sided Mylar (polyester) tapes on which fine particles of silica gel
16
TR-2382S=~II_I-----------------------------------
Plugs (glass wool)
Fittings, Swagelok
Desiccant particles
TUbing (stainless steel)
Figure 4-1. Schematic of the Packed Bed Test Cell
are impregnated. To simulate this configuration in the chromatograph loop,two test cells were designed and then constructed at the SERI machine shop.Each test cell was fabricated from two LexanR (polycarbonate) sheets machinedso that when they are fastened together a parallel passage is formed as shownin Figure 4-2. LexanR was chosen for its good thermal and physical propertiesand ease of fabrication. Appropriate sizes of double-sided MylarR tape wereglued to the walls of the passage. Fine particles of silica gel weresprinkled on the MylarR tape to form one layer of silica gel particles. Theweight of dry silica gel used in the test cell was calculated by weighing thedry test cell with and without silica gel. See Appendix B for details ofthese measurements and preparation of the parallel passage test cell forexperiments. The width (Y) of the passage is 0.02 m, The total length (L t)of the channel is 0.2 m. The length of the tapes (L) can be varied so thatdifferent aspect ratios (h/L) can be obtained consistent with our testplan [5]. Two parallel passage test cells with two different channel spacing(ht = 3 and 1.7 mm) were constructed. The actual flow passage (h) depends onht, the thickness of the MylarR tape (6), and particle size (d), whereh = h t - 26 - 2d (see Figure 4-2). By changing the thickness of the tapes,the particle size, and the length of the tape, the aspect ratio may be variedto obtain a range of 0.0025 - 0.075.
The overall outside dimensions of the test cells are 0.016 x 0.048 x 0.353 m(see Figure 4-2). The exterior of the test cells was machined in such a wayas to have small wall thickness near the silica gel coated tapes. This willenhance the heat transfer to and from the isothermal bath so that the testcells remain isothermal during the sorption process. NitrileR a-rings sealthe test cell components. The LexanR sheets were fastened together by Allen
17
S=~II.ITR-2382- ~~~
A en
T...
0 ~~0.016 m0 0 0 0 o C1;
1 o 0.048:
O~0 0 0 0 0
A
Cross section A-A
Lexan
Mylar tape,*~h = hi -2 o-2d
Particles -------.
~
h
Figure 4-2. Schematic of the Parallel Passage Test Cell
drive set screws. Figure 4-3 is a photograph of the two parallel passagecells. The upper cell is open to show the interior structure of the cell; thelower cell is assembled to show the outside configuration. The air-watervapor mixture enters through one of the SwagelokR connectors at either end,passes through a flow straightener, and spreads horizontally across the airgap. The flow straightener is composed of glass wool fibers (the whitematerial in Figure 4-3) and a rectangular metallic screen. The flowstraighteners were set on both ends of the passage to minimize end effects.The air-water vapor mixture exchanges water with silica gel and exits from theother SwagelokR connector.
The relevant parameters for the test cells used in this study are summarizedin Table 4-1.
18
S-~I ".~'"- II Ii- ,~~~
TR-2382
Figure 4-3. Parallel Passage Test Cells (open and closed)
The chromatograph loop was described in Section 3.0 and shown schematically inFigure 3-2; the test cells are described in Section 4.0 and shown in Figures 4-1 and 4-2. These test cells were prepared in advance and installed inthe chromatograph loop. The configuration is such that process air streamconditions can be set up through the bypass loop, and once they have reachedthe desired operating values of temperature, pressure, flow rate, and relativehumidity, the flow is switched into the test cell and the experiment begins.
Three units require long times to equilibrate: the two water baths that maintain the chromatograph loop and the humidifier at different isothermal conditions, and the vacuum chamber of the mass spectrometer. These units aregenerally brought to the desired conditions the evening before starting a testrun.
Once these units are at the desired operating conditions,is loaded into the data acquisition system and thechromatograph loop are set as follows:
a monitoring programother units in the
• The bone-dry air supply is turned on and adjusted through a coarse pressure regulator.
• The mass flow controllers are turned on and set at the desired flow rate.
• The pressure in the loop is set by regulating the pressure control valvesdownstream of the chromatograph loop and the coarse valve of the vacuumpump at the process air discharge point.
• The dew point hygrometer upstream of the test cell is turned on andbalanced.
• The humidifier temperature and adjustment valves are set to obtain thedesired humidity ratio by monitoring the dew point sensor.
• Once the flow parameters have reached equilibrium, the thermal conductivity detector is turned on and zeroed (balanced).
• The mass spectrometer inlet valve is opened and the process air stream issampled to ensure that the process air is of uniform composition and toverify the operating conditions.
Once all operating parameters are set and have been equilibrated, the dataacquisition and storage program is loaded into the HP computer, the processair stream is switched into the test cell, and the breakthrough part of thetest begins.
5.2 MONITORING OF EXPERIMENTS
The data acquisition and storage program records all operating parameters atselected time intervals and stores the data on cartridge. Additionally, the
21
TR-2382S=~I !~.-~! -------------------~~~- '.::~~
outputs of the thermal conductivity detector and of the mass spectrometer aredisplayed graphically so that the trend in the process air stream concentration can be observed. The variation of these outputs as a function of timegives the breakthrough curve for the operating conditions. These outputs aremonitored until no variation is observed in the process stream concentration,downstream of the test cell; this implies that the sorption process hasreached equilibrium.
Determination of the desiccant water content requires measurement of retentiontimes for a nonreactive gas (helium) and an isotopic tracer (deuteriumdioxide), and the derivation is given in Section 2.0 and Appendix A. Theretention times are measured as follows:
1. The inactive loop of the 10-port valve is loaded with heavy water vapor(D20).
2. The thermal conductivity detector is zeroed again.
3. The process air stream is switched into the loop loaded with D20 vaporso that a small volume of tracer is carried into the test cell.
4. The pressure variation in the loop is small when the 10-port valve isswitched, but it does affect the output of the thermal conductivitydetector; this gives the initial time reference for the injection ofthe perturbation. A chronometer is started to obtain a redundantmeasurement with the mass spectrometer output.
5. The thermal conductivity detector is monitored until a variation inoutput is recorded; this gives the time at which the perturbation hasreached the· thermal conductivity detector after passing through thetest cell and interacting with the desiccant. The same is monitored onthe output of the mass spectrometer.
6. The same series of measurements are made in the bypass section toobtain a reference value for all the piping length outside the testcell.
7. Steps 1 through 6 are repeated with the helium gas to obtain a measureof the free gas volume in the test cell.
Once these steps. are completed, the test loop is reset to new operatingparameters for the next test run.
The detailed operating procedure for the SERI sorption test facility can befound in Appendix C.
22
TR-2382
SECTION 6.0
RESULTS AND DISCUSSION
In this section the results of breakthrough and equilibrium experiments fortwo silica gel bed configurations, packed and parallel passage, are presented. Breakthrough data were obtained after a step change in the inlet airhumidity to a test cell and consist of effluent water vapor concentrationversus time. Equilibrium data, silica gel water content versus air watervapor concentration, were obtained by isotope injection at the end of thebreakthrough experiments. The operating procedures are summarized inSection 5.0 and detailed in Appendix C. Appendix A shows how the raw data canbe converted to more meaningful values. Both adsorption and desorption testswere performed. A description of the test cells can be found in Section 4.0and their relevant parameters are summarized in Table 4-1.
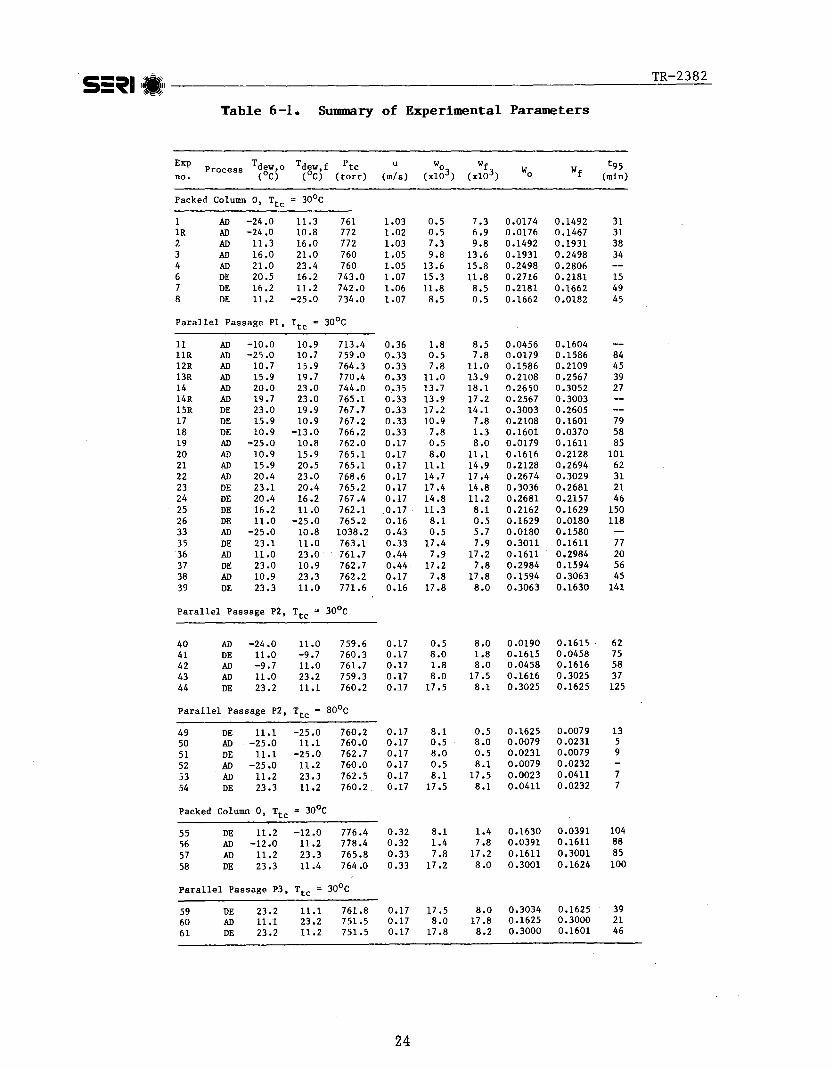
Table 6-1 summarizes the pertinent experimental parameters for the successfulbreakthrough tests conducted in this study. It is divided into sectionsdepending on the type of test cell geometry used and on the isothermal bathtemperature (Tt c). Table 6-1 shows:
• The experiment number, where R stands for "repeat" of an experiment
• Whether it was an adsorption or desorption process (AD/DE)
• The dew point temperature of an air stream in equilibrium with thedesiccant before starting the test (Tdew,o)
• The dew point temperature of the inlet air stream (Tdew,f)
• The pressure in the test cell (Pt c)
• The air velocity in the test cell (u)
• The absolute humidity ratios related to the dew point temperatures (wo'wf)
• The initial and final desiccant water content (Wo' Wf) estimated frompublished data [10]
• The breakthrough time, defined as the time to reach 95% of the inlethumidity ratio.
For all tests conducted, we attempted to maintain the average pressure in thetest cell (Pt c) near 760 torr and to operate between 5 humidity ratios (or dewpoint temperatures) that are approximately 0.0005 (-250C), 0.008 (lloC) , 0.012(16 oC), 0.015 (20oC), 0.018 (230C). In this way, groups of experiments can becompared directly by normalizing the breakthrough response in the particularhumidity ratio ranged selected, and to evaluate the effect of cell geometryand gas velocity on the dynamics of the sorption process. The data of eachexperiment are presented in Appendix D. In the remainder of this section theresults of typical experimental runs are discussed. The dependence of sorption processes on air velocity, temperature, and test cell dimensions (aspectratio for parallel) is discussed.
Figure 6-1 shows the adsorption results obtained in Experiment No. 43. Duringthis experiment, the parallel passage test cell PI was maintained at a
temperature Tt c = 300 c and was initially at a desiccant water loadingWo = 0.1616 kg H20/kg dry desiccant, in equilibrium with an air stream ofhumidity ratio Wo = 0.008 kg H20/kg dry air using Rojas' [10] data. Theexperiment was conducted with an inlet air stream of humidity win = 0.0175 kgH20/kg dry air flowing through the test cell at velocity u = 0.17 mise Duringthe course of the experiment, the outlet humidity ratio changed from theinitial value Wo to the final value wf = win. At equilibrium, the desiccantwater loading was estimated [10] to be Wf = 0.3025 kg H20/kg dry desiccant.
The first graph of Figure 6-1 shows the experimentally measured voltage outputof the thermal conductivity detector as a function of time. Initially, whenthe test cell is bypassed, the two cavities are exposed to air at the samehumidity win' therefore the output of the detector is zero. At the beginningof the experiment, the air stream is switched into the test cell, one chamberof the detector is exposed to win' and the other is exposed to the air thatpassed through the test cell, which is initially in equilibrium with Wo; i.e.Woe The sharp change of voltage output marks the beginning of the experiment. The outlet concentration stays at Wo for a short period depending oninlet air conditions (air velocity, humidity, temperature). During thisperiod the desiccant in the test cell has sufficient adsorption capacity toadsorb water vapor from win to Woe For this period, output voltage of thethermal conductivity detector is at its maximum derivation as seen from firstgraph of Figure 6-1. As time passes the dessicant in the test cell loses itsadsorption capacity and the outlet concentration starts to increase (thirdgraph of Figure 6-1). Initially the slope of the increase in outlet concentration is steep, because of the large concentration driving force; however,the slope becomes smoother after the driving force becomes smaller. Finally,the desiccant in the test cell becomes saturated at the process conditions anddoes not adsorb any water; thus, the outlet concentration reaches the inletconcentration and remains constant as can be seen from third graph of Figure 6-1. After this point the output voltage of the thermal conductivitydetector is at its minimum deviation. Ideally, we expect this deviation to bezero; however, because of pressure changes it is not zero in some of theexperiments. The second graph shows the normalized humidity ratio as a function of time, displaying the shape of the breakthrough curve , normalized onthe interval Wo to wf. The third graph shows the actual outlet humidity ratioas a function of time. Conversion between these data is discussed inAppendix A.
If we define the breakthrough time as the time for the humidity ratio to reach95% of the inlet humidity after the beginning of the experiment, then thebreakthrough time for Experiment No. 43 is 37 minutes. The breakthrough timesdefined in this manner are shown in Tables 6-1 and 6-2. The same type ofdata is shown in Figure 6-2, describing the results of Experiment No. 44, adesorption test between the same humidity and desiccant water content pointsas in Experiment No. 43. However, the breakthrough time in this case is125 minutes and the shape of the breakthrough curve is different.
The response of the desiccant in the desorption case seems to be the reverseof adsorption; it can be explained in the same way as explained for adsorption. Table 6-2 compares breakthrough times of pairs of adsorption/desorption experiments. It can be seen that in more than 75% of the experiments breakthrough time of adsorption is less than breakthrough time of
26
TR-2382S=~II_! --*.J,~~
Table 6-2. Comparison of Breakthrough Tiaes ofAdsorption and Desorption Experiaents
Exp. No. Process Wox 10-3 wf x 10-3 t 95 (min)
Packed Column, 0, Tt c = 30°C
lR AD 0.5 6.9 31
8 DE 8.5 0.5 45
2 AD 7.3 9.8 387 DE 11.8 8.5 49
3 AD 9.8 13.6 346 DE 15.3 11.8 15
Parallel Passage, PI, Tt c = 30°C
l1R AD 0.5 7.8 8418 DE 7.8 0.5 58
12R AD 7.8 11.0 4517 DE 10.9 7.8 79
19 AD 0.5 8.0 8526 DE 8.1 0.5 118
20 AD 8.0 11.1 10125 DE 11.3 8.1 150
21 AD 11.1 14.9 6224 DE 14.8 1l.2 46
22 AD 14.7 17.4 3123 DE 17.4 14.8 21
36 AD 7.9 17.2 2037 DE 17.2 7.8 56
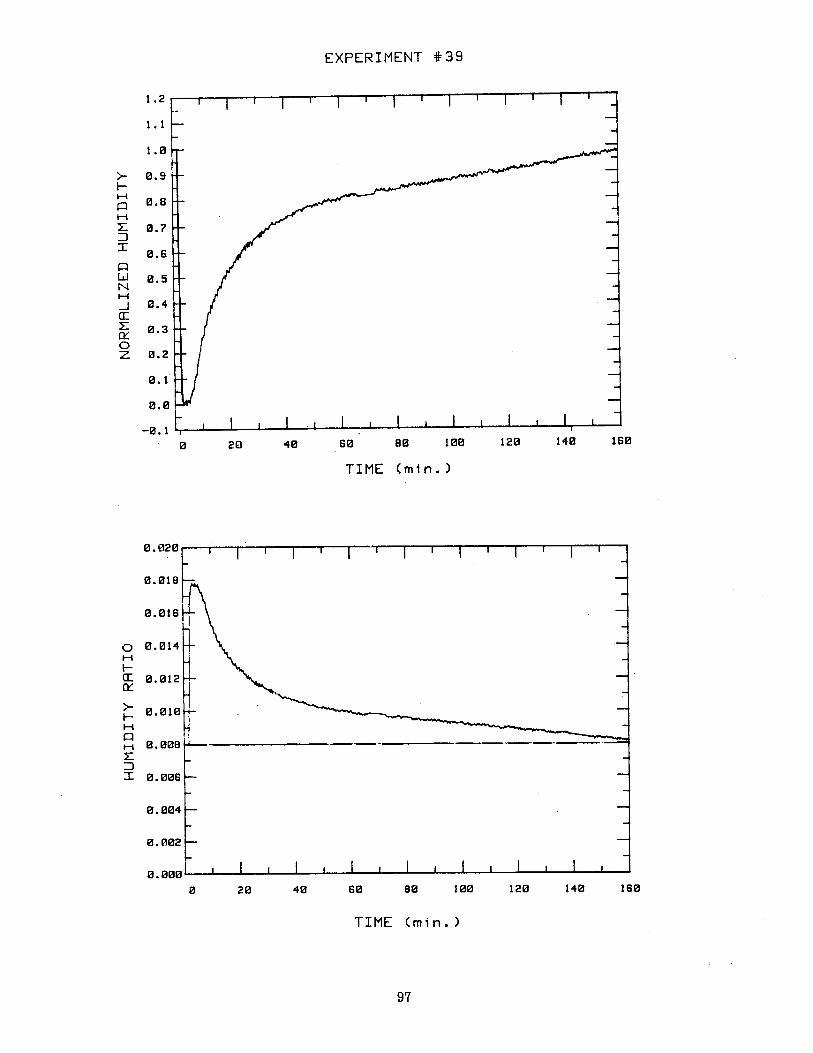
38 AD 7.8 17.8 4539 DE 17.8 8.0 141
Parallel Passage, P2, Tt c = 30°C
40 AD 0.5 8.0 6241 DE 8.0 1.8 7542 AD 0.5 8.0 58
43 AD 8.0 17 .5 3744 DE 17.5 8.1 125
27
TR-2382S=:SII;.~~!--------------- --.J~~-~ '.::~~
Table 6-2. Comparison of Breakthrough Uaes ofAdsorption and Desorption Experiments(Concluded)
Exp. No. Process Wox 10-3 wf x 10-3 t95 (min)
Parallel Passage, P2, Tt c = 800C
49 DE 8.1 0.5 1350 AD 0.5 8.0 551 DE 8.0 0.5 9
Packed Column, 0, T 300 ctc
56 AD 1.4 7.8 8855 DE 8.1 1.4 104
57 AD 7.8 17 .2 8558 DE 17.2 8.0 100
Parallel Passage, P3, T = 300Ctc
59 DE 17 .5 8.0 3960 AD 8.0 17.8 2161 DE 17 .8 8.2 46
desorption. The physical reason for this behavior is that silica gel is ahighly porous material and consists of very many microvoids [3,10]. One canvisualize these voids as cylindrical pores. During adsorption, the pores areinitially empty (dry silica gel) and the water molecules penetrate into thepores by surface and Knusdsen diffusion [3] and then are adsorbed on the surface of the pores. In this process all the internal surface area of the poreis available for adsorption. As time passes this area decreases· until thepore fills. For the desorption the process is reverse: the surface areaavailable for mass transfer is initially small and as time passes itincreases. At the beginning of each case where the mass transfer drivingforce is the same (W - Wf ' or w - w. ), the larger mass transfer surface
o 01n . .area for adsorption compared to desorption causes the pore to f1ll faster thanit empties. Therefore, the adsorption breakthrough time becomes less thandesorption breakthrough time.
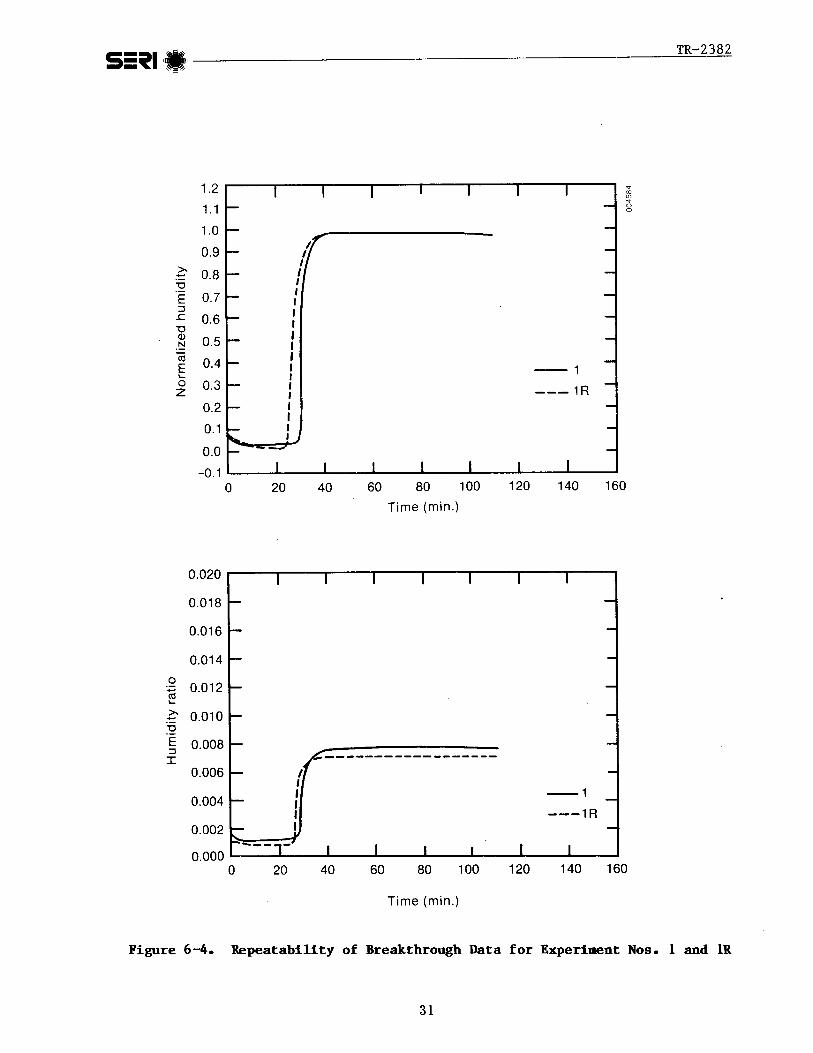
In order to check the repeatability of the breakthrough data, ExperimentNos. 1 and 40 were repeated. Experiment No. 40 was conducted between humidityratios of 0.0005 and 0.008; its repeat experiment, Experiment No. 42, was conducted between humidity ratios of 0.002 and 0.008 with the same operating conditions. The results are presented in Figure 6-3 and show the repeatabilityof the experimental results. Experiment No. 1 was conducted between humidityratios of 0.0005 and 0.0073; its repeat experiment, Experiment No. 1R, wasconducted between humidity ratios of 0.0005 and 0.0069. The outlet humidity
28
TR-2382S=~II_! ------------------------------~~==
ratios for the two experiments are compared in Figure 6-4, which shows therepeatability of the breakthrough data.
Figure 6-5 shows the variation in outlet humidity ratio with time for a seriesof adsorption (Experiment Nos. 19 through 22) and desorption experiments(Experiment Nos. 23 through 26). These tests were conducted with parallelpassage test cell PI, with aspect ratio h/L = 0.0095, and at an air velocityof 0.15 m/s. Notice the proportionally longer breakthrough time between 0.008and 0.01l for both adsorption and desorption. This is characteristic of allthe tests conducted in the above humidity ratio range, possibly because offormation of a second layer of adsorbed molecules on the interal surfaces ofthe silica gel at this range. Note that the rate of adsorption of the secondlayer on the first layer is slower than the rate of adsorption of the firstlayer on the silica gel pore surfaces [12].
Figure 6-6 shows the variatiort in outlet humidity ratio with time for twoadsorption and two desorption tests. These tests were conducted with parallelpassage test cell P2, with aspect ratio h/L = 0.01~2, and at u = 0.15 m/s. Incontrast to Figure 6-5, where the aspect ratio is a factor of two smaller, andtests were conducted with a single interval between humidity ratios of 0.008and 0.018.
Figure 6-7 shows the dependence of breakthrough data on air velocity. Fourexperiments are compared in these graphs of normalized humidity as a functionof time between the humidity ratios 0.008 and 0.017. Experiment Nos. 36 and37 were conducted at air velocity u = 0.44 mls and Experiment Nos. 38 and 39at u = 0.17 mls and u = 0.16 mis, respectively. Although the shape of thecurves looks the same in each case, the outlet humidity in the experimentswith higher velocity (Nos. 38 and 37) reaches its final value faster; i.e.,the breakthrough times of higher velocity experiments are smaller. Thephysical reason for this behavior can be described in the following manner.Consider an adsorption experiment: when the air velocity Ls increased moremass of water vapor per mass of desiccant is exposed to the desiccant. Thusthe desiccant adsorbs more in a fixed period of time and loses its adsorptioncapacity faster at higher air velocities. The same velocity dependence onbreakthrough time can be explained for desorption cases. Note that in theadsorption cases, the breakthrough curve is only shifted, while in the desorption cases, the shift is less pronounced initially. More experimental data ondependence of air velocity on breakthrough response are presented inFigure 6-8.
The effect of aspect ratio on the breakthrough response is shown in Figure 6-9for both adsorption and desorption tests for humidity ratios between 0.008 and0.018 with air velocity of u = 0.17 m/s. In an attempt to quantify the relative effect of aspect ratio on the breakthrough response, we must look at thenondimensional parameters NTU and DAR, which are commonly used in the study ofdesiccant dehumidifiers [2,3,6,9,13]. NTU is the number of transfer units andfor parallel passage geometry is defined as
KcNTU = pu h '
L
34
TR-Z382S=~II_! --------------------~~~
where KG is mass transfer coefficient; for fully developed flows in parallelpassages it is [13]
1Kc = Zh Nu pD ,
where D is H20-air diffusivity and Nu is the mass transfer Nusselt number andis constant L13]. DAR is the ratio of mass of desiccant to mass of air, andfor parallel passage geometry it is
where ~ is the duration of the experiment. Neinberg [9] found that if DAR isincreased the desiccant loses its adsorption capacity slower or the breakthrough time is longer. When aspect ratio (h/L) is lowered NTU and DAR willbe increased and thus the breakthrough time will increase. This can beobserved from Figure 6-9: as aspect ratio decreased the curves are shifted tothe right with longer breakthrough times. This observation is more clear foradsorption data. Note that when we decrease h and keep everything else constant, less mass of water vapor per mass of desiccant is exposed to thedesiccant, so the adsorption capacity of the desiccant will increase, which isthe physical reason for the above observation.
The effect of isothermal bath temperature on breakthrough data can be seen inFigure 6-10. The responses of the parallel passage test cell PZ for the sameinlet humidity range (0.008 to 0.018) and air velocity at 300 and 800C arecompared for adsorption and desorption cases. The breakthrough times areshorter for higher temperature for both cases. The physical reason for thisbehavior is that at higher temperatures sorption capacity of the desiccant issmaller; thus the desiccant can sorb less and becomes saturated faster.
Table 6-3 shows the results of equilibrium tests on silica gel and Rojas' [10]equilibrium water content. It was found that ~tHe, the time differencebetween passing helium through the test cell and the bypass column, is usuallyless than 20 seconds , However, ~t*, the time difference between passingdeuterium dioxide through the test cell and the bypass column, is usu~lly muchlarger than 20 seconds. Therefore, ~ tHe is ignored compared t 0 ~ t in thewater content calculations (using Eq. A-Z1) and is not reported inTable 6-3. As can be seen the experimental equilibrium water contents(Wf cal) are consistently lower than those of Rojas (Wf Rojas)' Rojas' dataare' close to the other published data (see Figure 1-1).' So one may concludethat the the equilibrium results calculated in Table 6-3 are erroneouslyobtained. It was found that error in the experimental measurements does notaccount for the discrepancies. Therefore the experimental techniques ofisotope injection and detection were suspected. The isotope injection systemin which DZO humidifies the air that then fills the sample loops is shown inFigure 3-5. We suspected that the concentration of D20 in the sample loop wasnot sufficient to be detected. To modify the injection method the aircylinder was removed and a vacuum pump was added in the isotope loop. Thisprovides isotope vapor (at its maximum possible concentration) in the sampleloop, ensuring that the isotope peak exiting the test cell is consistently
38
IIIIIIN-h ;;;;;;~11.11~~!'?-
Table 6-3. Summary of Results of Equilibrium Experiments
Exp. !:J.t* *Process Pt c u m w
Wf,cal Wf,Rojas !:J.t &or a sNo. (torr) (m/s ) (g) (x 18-3) (s)
detectable. With this method the detection of isotope was easier and morecons~stent. However, no major changes were detected in ~t**and thus Wf cal.To f1nd out other possible sources of error the expected ~t were calculatedfr~m Eq , A-13~ based on Rojas' data, which are reported in Table 6-3 as~t Rojas. ~t is consistently lower than ~t*Rojas' which suggests that theisotope peaks exit from the test cell faster tfian expected. This suggeststhat the residence time of DZO in the desiccant is shorter than it is supposedto be according to Eq. A-13. The validity of assumptions made in the derivation of Eq. A-13 (or Eq. 2-8) was investigated. It was found that the weakestassumption may be the one presented as Eq. Z-6. This was consistent with thecomments of Dr. Anthony Fraioli of Argonne National Laboratory (ANL) in hisreview of the draft of this report.
The principal assumption in isotopic perturbation underlies Eq , Z-6. Thisassumption should perhaps be restated that the adsorption process does notdis tinguish between the labeled and unlabeled water molecules, and further,that isotopic exchange is rapid and complete through the mass of unlabeledpre-adsorbed H20 in time of D20 perturbation exposure [14]. It appears thatthe underlined addition is part of the basic assumption on which the method isderived, and that it may not be valid in practice. The work at ANL [15] hasshown that certain features of the Type IV isotherm exhibited by water onsilica gel can be interpreted in terms of capillary-bound water held in thepore-blocked periphery of the individual particles, and the water can beintroduced into the interior of the particle until the meniscial balance isreestablished. The capillary-bound water is extremely localized (immobileadsorption), and thus the diffusion of DZO into the interior of the microporous particle is not easily achieved. In otherwords, DZO is restricted fromfree exchange into the interior of the particle, so the second part of thebasic assumption above is not valid. DZO molecules interact with only theouter layers of adsorbed HZO and do not penetrate far enough into the interiorof the particle. Therefore the residence time of DZO molecules in the particles is shorter than the residence time when DZO molecules penetratecompletely into the interior *of the particles. This is confirmed by ourexperimental measurement of ~t (see Table 6-3).
The above discussion presents one possible reason why our experimental determination of silica gel water content was unreliable. In other words, isotopicperturbation chromatography for this particular setup was an unreliable methodfor determining silica gel water content. It is quite possible that themethod is reliable at very low water contents or other desiccants such asmanganese dioxide and molecular sieve. We still have not ruled out the possibility of using the method for obtaining equilibrium desiccant watercontent. More investigation of the theory and experimental procedure isneeded.
41
TR 2382S=~II;.~~' -------------------~~~-~ \l!~~
SECTION 7.0
CONCLUSIONS AND RECOMMENDATIONS
7.1 CONCLUSIONS
• A test facility to analyze the dynamic mass transfer process and equilibrium capacity of any promising desiccant material was assembled.
• The test facility can operate under a broad range of process air streamconditions with various desiccant materials in different geometriescharacteristic of solid desiccant dehumidifier with particular emphasison solar cooling operations.
• Two different dehumidifier configurations, i.e., packed bed and parallelpassage, were constructed using silica gel and tested.
• Breakthrough and equilibrium data were obtained for both packed bed andparallel passage under a broad range of operating conditions. These dataallow for future analysis and model verification of solar dehumidifierperformance.
• Both adsorption and desorption experiments under isothermal conditionswere performed, and a dynamic hysteresis between these two processes wasidentified. The hysteresis showed fundamental differences between theadsorption/desorption process which have to be accounted for in themodeling to accurately predict solar dehumidifier performance.
• The dependence of the sorption process on air velocity and aspect ratiowas determined. As the air velocity, aspect ratio, and temperatureincrease, the breakthrough time decreases. The practical application ofthis conclusion is that with an increase in air velocity and aspectratio, the rotational speed of a parallel passage dehumidifier wheelshould also increase.
• A large discrepancy between the equilibrium experimental results andpublished data was found. This decrepancy was attributed to the experimental procedure or the invalidity of one of the basic assumptions in thetheory of isotopic perturbation chromatography for silica gel-water vaporsystems.
7.2 RECOMMENDATIONS AND FUTURE PLANS
• The validity of assumptions in the theory of perturbation chromatographyshould be investigated for water vapor-silica gel systems to see whetheror not this system can be used.
• The experimental procedure for isotope injection and detection should beinvestigated so that it would be consistent with the theory of perturbation chromatography.
• Breakthrough and equilibrium tests with other promising desiccants suchas manganese dioxide under various geometries and operating conditionsshould be made to identify their usefulness.
2. Barlow, R. S., Analysis of the Adsorption Process of Desiccant CoolingSystems - A Pseudo-Steady-State Model for Coupled Heat and Mass Transfer,SERI/TR-631-1330, Golden, CO: Solar Energy Research Institute, 1982.
3. Pesaran, A. A., Moisture Transport in Silica Gel Particle Beds, Ph.D.Dissertation, Los Angeles, CA: University of California, 1983.
4. Herzenberg, S. A., L. K. Hien, and R. Silberglitt, Active Solar EnergySystem Material Research Priorities, DHR Contract No. C5269, Washington,D.C., 1982.
5. Pesaran, A. A., F. Zangrando, and T. Penney, Test Plan to QuantifySorption Hysteresis of Desiccant Materials in Solar Desiccant CoolingSystems, SERI draft report to DOE, John Goldsmith, Program Manager, underTask 1600, WPA No. 443, Golden, CO, July 1983.
6. Schlepp, D., K. Schultz, and F. Zangrando, Facility Design and Plan forCyclic Testing of Advanced Solid Desiccant Dehumidifier, SERI Report underTask 1600.21, WPA No. 443-83, Golden, CO, 1984
7. Pitts, R., and A. Czanderna, Design for a Gas Chromatograph forCharacterizing Desiccant Materials, SERI/RR-334-550, Golden, CO: SolarEnergy Research Institute, 1980.
8. Lawson, A. E., .Jr , , and J. M. Miller, "Thermal Conductivity Detectors inGas Chromatography," Journal of Gas Chromatography, Vol. 4, No.8, 1966,pp. 278-284.
9. Nienberg, J. W., Modeling of Desiccant Performance for Solar-DesiccantEvaporative Cooling Systems, M.S. Thesis, Los Angeles, CA: University ofCalifornia, 1977.
10. Rojas, F., Pure Vapor Adsorption of Water on Silica Gels of DifferentPorosity, M.S. Thesis 2342, Golden, co: Colorado School of Mines, 1980.
l L, Maclaine-Cross, I. L., A Theory of Combined Heat and Mass Transfer inRegenerators, Ph.D. Dissertation, Australia: Monash University, 1974.
12. Lunde, P. J., and F. L. Kester,Finite Multimolecular Layer, "pp. 1497 -1505.
"Chemical and Physical Gas Adsorption inChern. Eng. Science, Vol. 30, 1975,
44
TR-2382S=~I I_I---------------------~~~13. Schlepp, D., and R. Barlow, Performance of SERI Parallel-Passage
Dehumidifier, final draft, SERI/TR-252-1951, Golden, co: Solar EnergyResearch Institute, 1983.
14. Communication with Dr. Anthony Fraioli of Argonne National Laboratory.
15. Fraioli, A. V., Topical Report for Improved Solid Desiccants (49532),Draft Report, Argonne, IL: Argonne National Laboratory, 1984.
We are interested in obtaining the equilibrium isotherm of a desiccant atvarious configurations at a specified temperature. An equilibrium isothermcurve shows the relation between desiccant water content, W, and water vaporconcentration, Gt c (or desirable relative humidity), of a gas in equilibriumwith the desiccant. To build up an isotherm we need to know both thedesiccant water content and the relative humidity of air in equilibrium withthe desiccant.
A.I.I Calculation of the Relative Humidity
The following measurements can provide the required information for calculation of relative humidity of air in equilibrium with the desiccant in a testcell: dew point temperature in the dew point sensor, Td ew; total pressure inthe dew point sensor, Pdew; temperature of the desiccant in test cell, Tt c;and total pressure in the test cell, Pt c•
The water content of air (humidity ratio) in the dew point sensor is the sameas the water content into (and out of) a test cell at equilibrium, since nowater is added to the air between the sensor and the test cell (see Figure 3-1); thus
wdew • (A-1)
Assuming air and water vapor are ideal gases, then
wPwater Mwater
Pair Ma i r(A-2)
RT
Using these relations:
MwaterMair
1828.94
0.622 ,
and
Pair = Ptotal - Pwater '
one can obtain
46
TR-2382S=~I [_I -'"-=-=0=-
w 0.622 PwaterPtotal - Pwater
(A-3)
Dew point temperature is the temperature at which water vapor starts condensing, thus the air is saturated and
(A-4)
The humidity ratio of air in the dew point sensor using the above equation is
P (Td)0. 622 sat ew
P - P (T ).dew sat dew
(A-S)
The relative humidity in the test cell, RHt c' is
RHtc
= Pwater, tcP (T)·sat tc
(A-6)
From Eq. A-3 one can obtain
wPwater = 0.622 + w P •
total(A-7)
Substitute Eq. A-7 in Eq. A-6 for the test cell to obtatn
RHtc
wtc
0.622 + wt c
Ptc
P (T)·sat tc
(A-8)
(A-9)
1/2 6Pt c' thus
Pd - 21
6Pew tcP
s a t(T
t c)
wdewRHt c = 0.622 + w
dew
However, wt c
Substitute Eq. A-S into Eq. A-9 to obtain
RHtc
1P - - 6Pdew 2 tc
Pdew
(A-lot
Equation A-lO, which is in terms of measuring parameters, can be used to calculate relative humidity of air in the test cell.
Water vapor saturation pressure can be obtained from a correlation byMaclaine-Cross [11]:
47
TR-2382S=~II.I----__--------------~~~
Ps a t
(T) 7.5001 x 10⁻³exp 23.28199 _ 378~.82 225805
T2(A-U)
where T in kelvins and P is in torrs.
A.l.2 Calculation of Desiccant Water Content
In Section 2.0 the following relation was derived to obtain gel water contentfrom the perturbation chromatography and flow conditions:
M CW [. (* - tHe) _ Q (t* _ tHe)] water tc
= Qtc ttc tc bp bp bp m (A-12)
If the pressure difference between the bypass and the test cell is small, thenQtc ~ Qbp· Defining
t* - t*tc bp
and
tHe Hetc - t bp
then Eq. A-12 can be expressed as
(A-l3)Ctc
MW = (l:It* - l:ItHe) Qtc ~w_~
m
where
air volume flow rate in the test cell (m3/s)
air water vapor c~ncentration in the test cell (kmol/m3)
= mass of desiccant in the test cell (kg)time difference between passing D20 through the test cell and bypasscolumn (s)time difference between passing helium through the test cell andbypass column (s).
Using the ideal gas law,
Ctc
Pwater,tc RHt c Ps a t (Tt c)-R....,T~...:.-- = ---R-T----
tc tc
(A-14)
where Pwater, tc is the partial pressure of water in the test cell.
The mass flow rate of humid air to the test cell is related to the· bone-dryair mass flow rate through the mass flow controller:
48
TR-2382S=~II_I -------------------------=-=-==
(l+wd
i .ew(A-IS)
Bone-dry air mass flow rate is related to the standard conditions (Po' To) andvolume flow rate reading of the mass flow meters. Assuming the ideal gas law,
•m.a1r•Qreading
P Mo airR To
(A-16)
Substitute Eq. A-16 in Eq. A-IS to obtain
•mtc
•Qreading
P Mo air (1 + w
d)
R To ew(A-17)
•Qtc is related to mt c through the ideal gas law:
R Ttc= mtc P Mtc tc
(A-18)
Substituting Eq, A-17 in Eq , A-18 and noting that Mt c = Mai r sincewdew = wt c « 1, we obtain
P 'fQ -2.... .ss (l + w
d)
reading P T ewtc 0
(A-19)
Substituting E~. A-14 and A-19 into Eq. A-13 we obtain
(A-20)
P• 0 1Qreading PT
tc 0
Ps at (Tt c)
R m
RH(l + w ) M _..;;;.t..;;;.c-.-;;;..=~...;;;...;;;...
dew w
Using Eqs ••A-S and A-lO, Eq , A-20 can be rearranged in terms of measurablequantities Qreading, Tt c' Tdew' Pdew' ~t* , and ~tHe:
1. Calculate wdew using Eqs. A-II and A-5.2. Estimate the average value of Pt c using
3.4.5.6.7.8.9.
Calculate RHt c using Eqs. A~10 and A-II.Calculate Ct c using Eqs. A-II and A-14.Calculate ~tc usinnEq. A-19.Estimate L\t and L\t e using Eqs. A-22 and A-23.Calculate W using Eq. A-13.Repeat steps 1 through 7 for one set of experiments at one temperature.Plot W versus RHt c•
A BASIC computer program (DATRED) performs steps 1 through 7. A listing ofDATRED is given at the end of this Appendix•
. A.2 BREAKTHROUGH DATA
A.2.I Conversion of Thermal Conductivity Detector Output
The output signal of the thermal conductivity detector needs to be convertedto concentration of water vapor. A calibration curve was obtained to convertoutput voltage to concentration level by humidifying air to a known level ofconcentration, having it flow through one cavity of the thermal conductivitydetector, and then passing the humid air through a completely dried packed bedtest cell. Initially, the moisture in the effluent air stream is fullyadsorbed by the desiccant; therefore, dry air comes out of the test cell andpasses through the other cavity of the detector. In this way the filament inthe first cavity responds to humid air, while the second filament responds todry air. Since the output signal of the detector is a measure of relativeconcentration of air in the first cavity to concentration of air in the secondcavity, this output signal can be used to obtain the absolute level of concentration in the first cavity, since the concentration in the second cavityis zero. Figure A-I shows the results of the calibration of the thermal conductivity detector (model 10-680). It can be seen that the output voltage ofthe thermal conductivity detector is approximately linear (±5%) with airhumidity ratio.
A.2.2 Calculation of Normalized Humidity and Outlet Humidity Ratio
The data fromexperiment can
the thermal conductivity detector during the breakthroughbe converted to concentration, or humidity ratio, as follows.
Figure A-I. Dependence of Thermal Conductivity Detector (Gow-Mac ModelIO~80) Output Voltage on Air Humidity Ratio
Consider an adsorption case where the inlet humidity is win and the desiccanthas an initial water content of Wo' which is drier relative to the inletair. After adsorption of water vapor from the air by the desiccant in thetest cell, the outlet concentration from the test cell is initially inequilibrium with the desiccant in the test cell; i.e.,
At this time, the difference between the outlet concentration (wo) and inletconcentration (win) is at its largest value, so the output of the thermal conductivity detector is also at its largest value. As time passes, thedesiccant in the test cell loses its adsorption capacity and the outlet concentration increases, while the output voltage of the thermal conductivitydetector decreases, until the outlet concentration reaches its final value,wf = win' when the test cell has reached equilibrium. The first graph in Figure A-2 shows the general trend for an adsorption case.
We define the normalized voltage as
v - Vet)max
v - Vmax min
(A-25)
and the normalized humidity as
wn(t)w - w( t )
o •w - wo f
(A-26)
Since the output voltage depends linearly on humidity ratio (Figure A-i), wecan use the normalized voltage to determine the shape of the normalizedhumidity curve.
By equating the two normalized values, we obtain
w - wet)ow - w
o f
therefore, the dimensional outlet humidity ratio is
wet) (A-27)
The inlet humidity ratio can be calculated from measured quantities usingEq. A-5. The equilibrium humidity ratio can be obtained from the initial conditions of the test cell which, in turn, depend on the inlet conditions of theair for the previous experiment. Vn(t) is the quantity that can be calculatedfrom the output of the thermal conductivity detector.
The second graph in Figure A-2 shows the general trend for a desorption caseand shows that Eqs. A-24 to A-27 are the same for the desorption case.
A BASIC program (CAL) is used to calculate win and weq• A listing of CAL isgiven at the end of this Appendix.
The advantage of using the normalized humidity curves is that the shape of thebreakthrough data can be compared directly, whether the tests were for adsorption or desorption and whether the inlet and equilibrium conditions were different for each test. In this manner, the dynami.c performance can beevaluated directly, as discussed in Section 6.0.
.36564395#*RWA70 MW=18' : TO=273.15 : PO=760! R=62.358 'torrs mA3/kmoie K80 READ PDEW, TDEW, TTC, DPTC 'from previous experiment.90 DATA 777.1, 23.05. 30.00, 15.850 :REM FROM PREVIOUS EXPERIMENT100 REM Calculate absolute humidity ratio ,AHR,at dew point sensor.110 T=TDEW+273.15 : PSD=FNPSAT(Tl: AHR=.622*PSD/(PDEW-PSDl120 LPRINT II ***** CALCULATIONS OF EXPERIMENT # 23 *****1:30 LPRINT " ": LF'RINT "******INITIAL CONDITIohIS****'il-*": LPF:INT " " : LPRli'·lTTDE\>.J="TDE\l-J C"140 LPRINT "PDEvJ=" PDEW " torrs"150 LPRINT "160 WE[!=AHR170 REM Estimate average value of total pressure in test cell,PTC.180 PTC=PDEW-DPTC/2!190 REM Calculate initial relative humidity,RH,in test cell.200 T=TTC+273.15 PST=FNPSAT(Tl210 RH=PSD*PTC/PSTfPDEW220 LPF:INT "PTC=" PTC "torrs"230 LPRINT "240 REM Calculate desiccant250 WO=FNWIRHl260 L.PF: I NT "TTC="270 READ PDEW,280 DATA 773.0,290 REM300 REM Calculate absolute humidity ratio ,AHR,at dew point sensor.:310 REM
zo F:EI"I30 REM This program analyzes the raw data to obtain EQUILIBRIUM data.40 F:EM50 DEF FNPSATIXI=.0075001#*EXP(23.28199-3780.82/X-225805'/X A2)
60 MW=18' : TO=273.15 : P0=760' R=62.358 'torrs mA3/kmole K70 READ PDEW. TDEW, TTC, DPTC80 DATA 774.1. 20.3, 30.00, 15.90090 F,Et1100 REM Calculate absolute humidity ratio ,AHR,at dew point sensor.110 F;EM1:20 T=TDEl·J+2T:;.15 : PSD=FNF'SAT en: AHR=. 622*PSD/ (PDEv)-PSDIL",O LPFdNT " ****.;0; DATA REDUCTION OF EXPERIMENT # 21 **** ..140 LPF:INT u ": l_PF:INT " ": LPRINT LPF:INT "TDEvi=" TDEW" C"150 LPF:INT "PDEvi=" PDEl'i " t.or r s,"
160 LPRINT " AHR=" AHR: LPF:INT170 F:EI'1180 REM Estimate average value of total pressure in test cell,PTC.190 REM200 PTC=PDEW-DPTC/2!210 REM220 REM Calculate relative humidity,RH,and vapor concentration ,C,in test cell.230 REt1240 T=TTC+273.15 PST=FNPSAT(TI250 RH=PSD*PTC/PST/PDEW: C=RH*PSTfR/T260 LPF.:INT "PTC='" PTC "t~orrs" : LPRIi'n "TTC=" TTC .. C"270 LPF:INT .. C='" C "kmole/m·..··3..280 LPRIJH " RH=" F:H:LPRINT " ..290 READ QR, M, OTO, OTH300 DATA 170.16, 0.6277, 000.0, 0.00.310 REM320 REM Calculate actual flow rate in test cell,QTC.330 REM340 QTC=QR*PO*T*11 '+AHRI/PTC/TO350 REM360 REM Calculate water content factor, F.370 REt1
2. Wrap heat tape around the test cell and air line and heat to about 100°C.
3. While at 100°C, purge with the dry air for about 30-45 min.
4. After purging, close both valves of the test cell, turn off the heatingtape, close the valve of the air tank, and let the test cell cool down toambient temperature.
5. Measure and record the weight of the dry and empty test cell five times,then calculate the average weight by using the electrical balance MettlerAK160, (160-g maximum).
6. Record the ambient temperature near the balance.
7. Pack the test cell with silica gel according to "How Packed Columns AreMade." Record the particle size.
8. Plug both ends of the test cell with glass wool.
9. Repeat steps B.1.1, B.1.2, and B.1.3 with one exception: purge for 1 h.
10. Repeat step B.1.4.
11. Measure and record the weight of the dry and packed test cell five times,and calculate the average weight.
12. Record the ambient temperature near the balance. (Now the packed testcell is ready for installation. Keep this test cell in a clean enclosure;e.g., a Zip-Ioc® bag, until it is ready for installation.)
13. Subtract the average weights obtained in steps B.1.s and B.1.l1 to get theaverage weight of the dry silica gel and glass wool.
14. At the end of the experiment(s), take out the glass wool plugs and freethe glass wool of all silica gel particles. Dry the glass wool and weighit five times. Calculate the average weight.
15. Subtract the averages obtained in steps B.1.13 and B.1.14 to get theaverage weight of the dry silica gel.
B.2 PARALLEL PASSAGE TEST CELL
1. Preparation of the empty test cell:
a. Calculate the desired h/L ratio.
b. Calculate the number of MylarR tapes needed for the desired height.
c. Cut the specified pieces of MylarR tape (length and width).
d. Paste the tapes on the top and bottom walls of the test cells.
f. Close the test cell, and tighten the screws thoroughly.
g. Connect the SwagelokR fittings and the two valves.
h. Leak test the test cell with soap bubbles.
2. Purge the empty test cell with dry air for 60 min as in steps Bv l s l ,B.l.2., and B.l.3, but heat to only 60°C.
3. Close both valves of the test cell, turn off the heating element, closethe valve of the air tank, and let the test cell cool down to ambient temperature (as in step B.l.4).
4. Measure and record the weight of the dry and empty test cell five times.Calculate the average weight using the optical balance Mettler H315(lOOO-g maximum).
5. Record the ambient temperature near the balance.
of silica gel particlesthe excess particles ofRecord the size of the
Open the test cell and sprinkle the specified sizeevenly on the top and bottom tapes. Gently brushsilica gel away from all parts of the test cell.silica gel particles used.
7. Close the test cell and leak test it with soap bubbles. In leak testing,do not exceed 20 PSI.
6.
8. Purge and heat the test cell for 60 minutes to remove all moisture fromthe silica gel. (This step is similar to step B.2.2).
9. Close both valves of the test cell and proceed as in step B.2.3.
10. Measure and record the weight of the dry, silica gel loaded test cell fivetimes. Calculate the average weight.
11. The silica gel loaded test cell is now ready for installation. Keep thetest cell in a clean and dry environment (e.g., a Zip-Ioc@ bag) until timeof installation.
12. Subtract the average values obtained in steps B.2.4 and B.2.10 to obtainthe average weight of the dry silica gel in the test cell.
58
TR-2382S=~II_!---------------------------
APPENDIX e
DETAILED OPERAT.ING PROCEDURE
e.l PROCEDURE
1. Install the test cell with specified characteristics between ports #5 and#6 of Valco port valve V3. Set V3 in S.
2. Start the preliminary set-up. See Section C.2.
3. Refer to Data Sheet for values of the experimental parameters.
4. Start the isothermal bath for the bubbler at the specified temperature(TBBL). See Section C.3.
5. Start the isothermal tank (40 gal) at the specified temperature (TBTH).See Section C.4.
6. LOAD and RUN the specified HP-85 computer program with specifiedparameters.
7. Turn on the Mass Flow Controller Unit. Open the bypass gas bubbler valvecompletely. Close the gas bubbler valves #1 and #2 completely.
8. Turn on the Dew Point Hygrometer indicator. Try to BALANCE it, then setit to OPERATE position.
9. Set the dials of the Mass Flow Controller unit at the specified settingsto obtain the desired flow rates (Q2, Q3).
10. Open the cut-off valve of the zero air cylinder and set the supply pressure at specified value (PS) with the regulator while the shut-off valveof the regulator is closed (fully CW).
11. Open the shut-off valve(s) of the Mass Flow Controllers. (valve of massflow controller #2 or #3 or both #2 and #3).
12. Open the pressure control valves completely. If the line pressure ofthis experiment is the same as the line pressure of previous experiment,there is no need to change the setting of the valves.
13. Turn on the vacuum pump while the vacuum exhaust valve is closed. Notethat if the pressure of this experiment is the same as the pressure ofprevious experiment, there is no need to change the setting of thisvalve.
14. Open the shut-off valve of the regulator of the supply air and regulatethe supply pressure if necessary.
15. Open the vacuum exhaust valve so that the line pressure (channel 114 ofMKS indicator on the instrument rack) reaches within 10-50 torr of thespecified pressure P(T). This is a coarse adjustment.
16. Close (or open) the pressure control valves to reach the specified pressure P(T) within ±5 torr. This is a fine adjustment.
17. Turn onrecorder.
the thermal conductivity power supplyLeave the chart switch at off position.
unit and the chartSee Section C.5.
59
S-~I /,.~'"- (I I!- \;:~~
TR-2382
18. Moisturize the dry air at the specified dew point temperature (TDEW).
a. If the specified TDEW is below -JOC, leave the bypass gas bubblervalve open and gas bubbler valves #1 and #2 closed.
b. If the specified TDEW is above -7°C, open gas bubbler valves #1 and#2 completely, and close the bypass gas bubbler valve completely.
19. When TDEW is steady (i:0.3°C) try to "zero" the Thermal Conductivity Unitwithin ±0.01 mV at sensitivity of 1-8. Use a DVM or channel #18 of HP3497A for monitoring.
19a. Open the Ultra High Vacuum (UHV) valve to sample the process air into theUHV chamber for analysis. See Section C.6.
C.I.I Start of the Breakthrough Part
20. Reset the time step (Push K5) of the HP-45 computer program to newspecified time step and store the data.
21. Start feeding the paper of the chart recorder at a specified speed,response, and span.
21a. Set the mass spectrometer to TREND ANALYSIS of mass 18.
22. Switch V3 to P (air flow through test cell).
23. Observe the trend of response of the thermal conductivity detector to theeffluent air from test cellon the chart recorder. When there are nochanges of voltage (±0.1 mV) and the thermal conductivity detector is"zeroed" again (±0.1 mV), the silica gel in the test cell has reachedequilibrium and the breakthrough part is finished.
23a. Record the results of the sample gas analysis of the Mass Spectrometer onits chart printer every minute. See Section C.6. .
24. Store the data with specified file name on a tape by pushing "STOP," keyK3, of HP-85.
25. Stop the chart paper of chart recorder.
C.I.2 Start of the Equilibrium Part
26. Load the inactive loop of the 10-port valve (VZ) with DZO plus dry air:
a. Make sure that there is enough heavy water (DZO) in the DZO chamber.
b. Turn off D20 shut off valve, LVZ.
c. Turn on air shut off valve, LVI, at 5 PSi.
d. Turn on DZO purge valve, LV4.
e. Turn on DZO shut off valve, LVZ, slightly so that air does not bubblethrough the heavy water vigorously.
f. Purge DZO air for 1 to Z minutes, then close DZO purge valve, LV4.
g. Close DZO shut off valve, LV2.
h. Close air shut off valve, LVI.
60
TR-2382S=~II_!--------------------
27. "Rezero" the thermal conductivity detector and then start the chart paperwith paper speed of 20 cm/min and span of 2 mV.
28. Restart the computer program by pushing Kl, K2 keys of HP-85.
29. Switch the position of V2 (from Secondary to Primary or P to S) whilestarting the stop watch. Observe the response of the thermal conductivity detector on the chart recorder. Turn the paper feed off aftera peak is observed. Record on the chart paper the speed, span, response,sensitivity, and action taken.
29a. Observe the trend of analysis of D20 on mass spectrometer and stop thestop watch when a peak is observed. Use the mass spectrometer printer toprint the results, and record the action taken and the time difference.
30. Load the inactive loop of ten-port valve (V2) with helium gas:
a. Turn on He shut off valve, LV5, at 15 PSi.
b. Turn on He purge valve, LV3.
c. Close He purge valve (LV3) after purging 1 to 2 minutes.
d. Close He shut off valve, LV5.
31. "Rezero" the thermal conductivity detector and then start the chart paperwith paper speed of 20 cm/min and span of 20 mV.
32. Switch the position of V2 (P to S) while starting the stop watch.Observe the response of thermal conductivity detector on the chartrecorder. Turn off the paper feed after a peak is observed. Record onthe chart paper the speed, span, response, sensitivity and the actiontaken.
32a. Observe the trend of analysis of He on the mass spectrometer and recordthe time when a peak is observed. Use mass spectrometer printer to printthe results, also record the action taken and the time difference.
33. Switch V3 to Secondary position to flow through the bypass and wait untilpressure, flow rate and dew point temperature become steady •.
34. Load the inactive loop of ten-port valve (V2) with He gas:
a. Turn on He shut off valve (LV5) at 15 PSi.
b. Turn on He purge valve (LV3).
c. Close He purge valve (LV3) after purging 1 to 2 minutes.
d. Close He shut off valve (LV5).
35. "Rezero" the thermal conductivity detector and then start the chart paperwith paper speed of 20 cm/min and span of 20 mV.
36. Switch the position of V2 (P to S) while starting the stop watch.Observe the response of the thermal conductivity detector on the chartrecorder. Turn off the paper feed after a peak is observed. Record onthe chart paper the speed, span, response, sensitivity and the actiontaken.
36a. Observe the trend of analysis of He on mass spectrometer and stop thestop watch when a peak is observed. Use mass spectrometer printer toprint the results, also record the action taken and the time difference.
37. Load the inactive loop of ten-port valve (V2) with DZO and zero air:
a. Make sure that there is enough heavy water (DZO) in the DZO chamber.
b. Turn off DZO shut off valve, LVZ.
c. Turn on air shut off valve, LVI, at 5 PSi.
d. Turn on DZO purge valve, LV4.
e. Turn on DZO shut off valve, LVZ, slightly so that air does not bubblethrough the heavy water vigorously.
f Purge DZO air for 1 to Z minutes, then close DZO purge valve, LV4.
g. Close DZO shut off valve, LVZ.
h. Close air shut off valve, LVI.
38. "Rezero" the thermal conductivity detector and then start the chart paperwith paper speed of 20 em/min and span of 2 mV.
39. Switch the position of VZ (from Secondary to Primary or P to S) whilestarting the stop watch. Observe the response of the thermal conductivity detector on the chart recorder. Turn the paper feed off aftera peak is observed. Record on the chart paper the speed, span, response,sensitivity and the action taken.
Make sure that switch V3 is in S40. The Equilibrium Part is finished.(secondary).
41. Follow either 41 (a) or 41 (b) below as specified in Data Sheet:
a. Test is finished.tion C.7.
Follow the shut down instructions. See Sec-
b. Change the specified experimental parameters as mentioned in the DataSheet and follow Steps 3 to 41.
C.2 PRELIMINARY SET-UP
C.2.l Valves
1. Set Valco port valve, VI, to primary.
Z. Set Valco port valve, VZ, to secondary.
3. Set Valco port valve, V3, to secondary (test cell out).
4. Set the by-pass valve to open (CCW).
5. Set the two (Z) pressure control valves to open (CCW).
6. Set the coarse and fine bypass exhaust valve to close position (fullyCW) •
7. Set the by-pass gas bubbler valve to open (fully CCW).
8. Set the gas bubbler valve #1 and #Z to close (fully CW).
9. Set all the valves of helium or DZO loading to open.
1. Valves on gas or air cylinders closed (CW position).
2. Regulator valve closed (CW position).
C.2.3 Thermal Conductivity Power Supply Control Unit, Hodel 40-002
1. Set zero potentiometer to 500.
2. Set sensitivity control to 1.
3. Set polarity switch to either position (+ or -).
4. Set power switch to "off" position.
5. Set coarse current potentiometer fully CCW.
6. Set fine current potentiometer about mid-range.
C.2.4 Mass Flow Controller Read-out Box, Hodel RQ-14-300
1. Set the function switch to the "off" position.
C.2.5 Gould 110 Strip Chart Recorder, Model 15-4328-10
1. Set power switch to "off" position.
2. Set the chart switch to "off" position.
3. Remaining controls to be determined.
4. Connect amonitoring.
Digital Volt MeterUse 200-mV scale.
(DVM) to the chart recorder for
C.2.6 Vacuum Pump
1. Set the power switch of the Vacuum, Pump to "off" position.
C.3 ISOTHERMAL BATH FOR THE GAS BUBBLER
C.3.1 Start-Up
1. Insure that the isothermal bath is filled with deionized water.
2. Insure that the temperature is set to the desired temperature.
3. The safety cutout should be set at about 200 above the temperaturesetting.
4. The Heating Capacity control should be set to fully CW position.
S. Set the Cool-Flow temperature 10 to 30C below the isothermal bathtemperature.
63
TR-2382S=~II.I -----------------_------'~~-~ .
6. Turn on the Main Power switch of the isothermal bath.
7. Turn on the Boost Heater switch, if necessary.
8. Turn on the main power switch of the Cool-Flow 75.
9. Monitor the bath temperature on the instrument rack or on the printerunder TBBL.
C.3.2 Shut-Down
Check the experimental matri~ before shutting down the isothermal bath and theCool-Flow 75. It may be feasible to let these run constantly or be allowed torun through one or more tests.
1. To shut down, turn off the main power switch on the Cool-Flow 75.
2. Turn off the main power switch on the isothermal bath.
C.4 HEATERS (2 kW and 6 kW)
C.4.1 Start-Up Procedure
Before applying power to the heaters, the precautions in steps 1 through 11should be taken.
1.
2.
The main (lOa-A) circuit breaker is in the "off" position in panelPP129H.
The 35-kW (60-A) circuit breaker is in the "off" position in panelPP129H.
3. The safety latch is down and holding closed the door of the control paneladjoining panel PP129H.
4. The arm switch on the control panel door is in the "off" position.
5. The toggle switch on the control panel is in the "off" position (toggledown) •
6. The temperature control knob for the temperature controller for the 6-kWheaters is turned fully CCW.
7. On the YSI model 72 proportional temperature controller:
a. The power switch is set to "off" position (toggle down).
b. The band-width DC is set to any position.
c. All three temperature set-point knobs are set to O.
d. The line cord for the 2-kW heaters is disconnected.
8. The 40-gal tank is full of water; when this is confirmed, raise the tanksufficiently to fully engage the lid.
9. The metal safety block is placed in its proper position.
10. A sufficient amount of water is in the overflow container.
11. The stir is activated by opening the input air valve.
12. Connect the line cord for the 2-kW heater.
13. On the YS1 model 72:
a. Set the power switch to "on".
b. Set desired temperature.
c. Set desired band width.
14. Set desired temperature for the 6-kW heaters. (This setting should beabout 40 to SoC lower than the setting for the 2-kW heater.)
15. Turn on main 100-A circuit breaker.
16. Turn on the 60-A circuit breaker.
17. Set the arm switch to "on."
18. Switch the toggle switch to "on" (up position).
19. Monitor the temperature of the 40-gal tank by:
a. "TBTH" of the printer read-out,
b. Digital read-out "water" on the instrument rack.
C.4.2 Shut Down Procedure
20. 6-kW Heaters
a. Turn temperature controller knob fully CCW.
b. Switch the toggle switch to "off" (down position).
c. Set the arm switch to "off."
d. Set the 60-A circuit breaker to "off."
e. Set the 100-A circuit breaker to "off."
21. 2-kW Heaters
a. Set the power switch to "off."
b. Set the three temperature set point knobs to "0."
c. Disconnect the line cord for the 2-kW heater.
C.5 THERMAL CONDUCTIVITY P<NER UNIT START-UP
1. Insure that air is flowing through the thermal conductivity cell.
2. Set the power switch on the power supply control unit to the "on"position.
3. With the coarse and fine current controls, set the current to 3-7 rnAdepending on the temperature of the thermal conductivity cell; DO NOTEXCEED 8 rnA. Consult the manufacturer's graph. Allow time for warm-up.
65
TR-2382S=:SII;.~~'---------- ---.!.!~~-~ ~~~.
4. With the zero control of the power supply control unit, zero (balance)the circuit of the thermal conductivity cell.
5. Allow the system to stabilize; re-zero if necessary.
6. Switch polarity on the power supply control unit, if necessary, to give apositive reading on the DVM or an upward swing on the recorder.
C.6 OPERATION OF ULTRA HIGH VACUUM SYSTEM
C.6.1 Cham.ber
1. Let about 20 L/min of tap water flow through the cooling unit of TSU-170pumping unit.
2. Turn on the "pump" switch of TSU-170.
3.
4.
MO~!tor the pressure of the chamber using convection vacuum gauge above10 torr.
When the vacuum reaches 10-4 torr turn on the "heat" switch of TSU-170.
5. Apply power to the heating tapes on the chamber to maintain a surfacetemperature of about 100°C (40% power). Bake the chamber at higher temperatures if necessary.
6. The time required for the vacuum in the chamber to reach 10-9 to10-8 torr depends on the cleanliness of the chamber and the start-uppressure in the chamber.
7. The chamber can be degased using the ionization gauge tube andas~~ciatin~ ionization gauge controller. Maintain the vacuum between10 to 10 9 torr using the ionization gauge controller.
8. Best results can be obtained if the TSU-170 unit is not turned off; i.e.,is running at all times.
C.6.2 Mass Spectrometer (DATAqUAD)
1. Turn on the power and follow the instructions of the DATAQUAD manual.
2. Go to BARGRAPH mode with PERC 5, GAIN -10 M. Store it in BACKGROUND andprint it.
3. Sample the process air for analysis:
a. Turn on the forepump (Rotary Vane Pump, DUO 1.5 A).
b. Turn on the capillary tube heater.
c. Open the gas inlet valve of the chamber to create a chamber vacuum of10-6 to 10-5 torr.
4. Go to BARGRAPH mode with different gains (and PERC) for analysis of auniform composition process air.
5. Go to TREND ANALYSIS for qualitative analysis of a desired mass to electron ratio as instructed in the DATAQUAD manual.
To insure that the power switch on the thermal conductivity power supply control unit is turned to the "off" position before the air or gas supply is cutoff, proceed as follows:
1. Switch Valco port valve, V3, to secondary (test cell out).
2. Reduce the current by turning the coarse current control on the powersupply control unit all the way to CCW.
3. Turn the power switch of the power supply control unit to the "off"position.
4. Open the bypass bubbler valve, then close bubbler valves #1 and #2.
5. Turn the function switch of the mass flow controller read-out box to the"off" position.
6. Close the cut-off valve regulator of the air supply by turning it to CWo
7. Turn off the vacuum pump.
8. Close the cylinder valves of the air or gas supplies by turning to CWo
9. If the air or gas is to be bled off in the system, do it very slowly.
10. Close the ultra high vacuum gas inlet valve. Turn off the forepump andthe capillary tube heater.
11. Turn off the 6-kW and 2-kW heaters according to Section C.4.
12. Turn off the isothermal bath according to Section C.3.
13. Close all the valves for loading of helium or D20.
67
TR-2382S=~II;.~~!--------- ~~~!..f,..-~ ~~~
APPENDIX D
RAW DATA
n.; SAMPLES OF DATA FROM THE RESIDUAL GAS ANALYZER AND THERMAL CONDUCTIVITYDETECTOR
Samples of raw data obtained in Experiment No. 7 are shown in Figures D-1through D-5 for the following operating conditions:
Test Cell: Packed Column 0
Tt c 30°C
Tdew 1l.2°C
Pdew 852.1 torr
Qreading 100 cm3/min
Pt c 738 torr.
D.2 BREAKTHROUGH DATA FOR EACH EXPERIMENT
As discussed in Appendix A and shown in Figures 6-1 and 6-2 the output of thethermal conductivity detector can be converted to a normalized humidity and anabsolute humidity ratio. In the graphs at the end of this appendix, these twoquantities are plotted as a function of real time for each experiment. Forexperimental conditions of each experiment see Table 6-1.
All experiments conduct~d at Tt c = 30°C are plotted at an interval of 160 minfor ease of comparison between experiments, even if the duration of theexperiment was longer. Tests lasting longer than 160 min are discussed inSection 6.0, where the full breakthrough response is shown. Tests conductedat Tt c = 80°C are plotted with a time interval of 60 min, in order to displaythe rapid response. Characteristic results are compared in Section 6.0.
M. YaroshFlorida Solar Energy Center300 State Road, 401Cape eanaveral, FL 32920
Document Control \1. SERI Report No. 12. NTIS Accession No.
Page SERI/TR-252-23824. Title and Subtitle
Experiments on Sorption Hysteresis of DesiccantMaterials
7. Author(s)
A. Pesaran. F. Zanqrando9. Performing Organization Name and Address
Solar Energy Research Institute1617 Cole BoulevardGolden, Colorado 80401
12. Sponsoring Organization Name and Address
15. Supplementary Notes
3. Recipient's Accession No.
5. Publication Date
August 19846.
8. Performing Organization Rept. No.
10. ProjecVTask/Work Unit No.
3010.10I 11. Contract (C) or Grant (G) No.
(C)
(G)
13. Type of Report & Period Covered
Technical Report14.
16. Abstract (Limit: 200 words) Solid desiccant cooling systems take advantage of solar energyfor air conditioning. The process involves passing air through a desiccant bed fordrying and subsequent evaporative cooling to provide the air conditioning. Thedesiccant is then regenerated with hot air provided by a gas burner or solar collectors. This performance is limited by the capacity of the desiccant, its sorptiorproperties, and the long-term stability of the desiccant material under tyclicoperation conditions. Therefore, we have developed a versatile test facility tomeasure the sorption properties of candidate solid 'desiccant materials under dynamicconditions, under different geometrical configurations, and under a broad range ofprocess air stream conditions, characteristic of desiccant dehumidifier operation.We identified a dependence of the sorption processes on air velocity and the testcell aspect ratio and the dynamic hysteresis between adsorption and desorption processes. These experiments were geared to provide data on the dynamic performanceof silica gel in a parallel-passage configuration to prepare for tests with arotary dehumidifier that will be conducted at SERI in late FY 1984. We also recommend improving the accuracy of the isotopic perturbation technique.
H. Document Analysisa. Descriptors Dehumidification ; Desiccants ; Gas Chromatography ; Silica Gel ;
Sorption
b. Identifiers/Open-Ended Terms
c. UC Categories
59
18. Availability StatementNational Technical Information ServiceU.S. Department of Commerce5285 Port Royal RoadSpringfield, Virginia 22161