44
Expert evaluation network Job creation as an indicator of outcomes in ERDF programmes August 2013 Regional and Urban Policy

Expert evaluation network
Job creation as an indicator of outcomes in
ERDF programmes
August 2013
Regional and
Urban Policy

Expert evaluation network
delivering policy analysis on the
performance of Cohesion policy 2007-2013
2013
Job creation as an indicator of outcomes in ERDF
programmes
Synthesis report
August 2013
A report to the European Commission
Directorate-General for Regional and Urban Policy
. This report has been prepared by Terry Ward, Lydia Greunz and Sara Botti of Applica and Andrea Ciffolilli and Ilia Gaglio of ISMERI Europa. It is based on the country reports on the same theme produced by members of the Evaluation Network of national experts set up by DG Regional Policy who are listed on the next page. The authors are grateful for comments from Kai Stryczynski and Veronica Gaffey of the Evaluation Unit of DG Regional Policy.
The views expressed in the publication are those of the authors and do not necessarily reflect those of
the European Commission.
© European Union, 2013
Reproduction is authorised provided the source is acknowledged
Cover: Wassily Kandinsky, “Zarte Spannung (Delicate tension, Tension délicate), 1923 (B. Acq. 638)”
© SABAM Belgium 2012

Job creation as an indicator of outcomes in ERDF programmes EvalNet Synthesis Report, 2013
i
Contents
List of authors of policy papers .................................................................................................................................. ii
Executive Summary ........................................................................................................................................................ iii
Résumé ................................................................................................................................................................................ vi
Zusammenfassung ............................................................................................................................................................x
1. Introduction .............................................................................................................................................................. 1
2. Use of the indicator to assess outcomes in different policy areas ...................................................... 2
Use of the indicator at programme and sub-programme level ................................................................. 2
The policy areas in which jobs created is used as an indicator ................................................................ 3
The appropriateness of using jobs created as an indicator in programmes ....................................... 5
Other points .................................................................................................................................................................... 6
3. Definition, methods, data reporting and wider use of the indicator.................................................. 6
Definition and methods used for calculation .................................................................................................... 6
Content of data .............................................................................................................................................................. 9
Aggregation of jobs created across OPs ........................................................................................................... 11
Estimates of jobs created up to end-2011 ...................................................................................................... 11
Use of jobs created as an indicator of national programme outcomes ............................................... 13
4. Cost per job created ............................................................................................................................................ 14
5. Estimates of net jobs created .......................................................................................................................... 14
6. The proposed indicator of jobs created in the 2014-2020 period ................................................... 16
7. Concluding remarks ............................................................................................................................................ 17
Annex 1 Content of the reported data on job creation ................................................................................... 20
Annex 2 Estimates of average cost per job created ......................................................................................... 26
Annex 3 Data on jobs created reported in AIRs and adjustments ............................................................. 29
List of abbreviations
AIR Annual Implementation Report
OP Operational Programme
FEI Financial engineering instruments
FTE Full time equivalent
MA Managing Authority

Job creation as an indicator of outcomes in ERDF programmes EvalNet Synthesis Report, 2013
ii
List of authors of policy papers
Name Organisation Countries
Isabel Naylon METIS Austria
Andreas Resch
Lydia Greunz Applica sprl. Belgium
Daniela Mineva
Centre for the Study of Democracy Bulgaria Plamen Shalafov
Ruslan Stefanov
Jiri Blazek Charles University Czech Republic
Frederik Nordentoft Andersen New Insight A/S Denmark
Peter Plougmann
Tarmo Kalvet Tallinn University of Technology Estonia
Päivi Kilpeläinen
Urban Research TA Finland Seppo Laakso
Tamás Lahdelma
Michel Lacave Technopolis |ITD.eu| France France
Oliver Schwab Institut für Stadtforschung u. Strukturpolitik GmbH Germany
Sophia Athanassopoulou University of Athens
Greece and Cyprus Lena Tsipouri
Gábor Balás HÉTFA Centre for Economic and Social Analyses Hungary
Gabriella Borbas
Patrick Drudy Centre for Urban and Regional Studies, Dublin Ireland
Andrea Ciffolilli ISMERI Europa Italy
Ieva Moore Baltic International Centre for Economic Policy studies
Latvia Alf Vanags
Klaudijus Maniokas ESTEP Lithuania
Agne Miseliuniene
Matthieu Lacave Technopolis |ITD.eu| France Luxemburg
Gordon Cordina University of Malta/E-Cubed consultants Ltd Malta
Stephanie Vella
Luc Van Raaij ERAC Netherlands
Vincent Ketelaars
Grzegorz Gorzelak Warsaw University
Poland Marek Kozak
Dominika Wojtowicz Leon Koźmiński Academy, Warsaw
Heitor Gomez CEDRU Portugal
João Telha
Liliana Lucaciu L&G Business Services srl Romania
Karol Frank Institute for Economic Research, Bratislava Slovakia
Damjan Kavas Institute for Economic Research, Ljubljana Slovenia
Andres Faiña
University La Coruña Spain Jesús López-Rodríguez
Paulino Montes-Solla
Jan-Evert Nilsson Blekinge Institute of Technology Sweden
Peter Tyler St. Catherine's College, Cambridge University UK
Job creation as an indicator of outcomes in ERDF programmes EvalNet Synthesis Report, 2013
iii
Executive Summary The report synthesises the main points to come out of the 27 national studies produced by the
Evaluation Network of independent experts on jobs created as a core indicator of ERDF
programmes outcomes. Its main concern is with the comparability of the figures reported and
how far they can be meaningfully aggregated across programmes, which has become
increasingly important given the growing policy attention paid to job creation across the EU. It
examines, in turn, the extent to which the indicator is used; the way it is defined and method of
data collection; the coverage of the figures reported; the use made of the indicator, the average
cost per job created; how far estimates are made of net as well as gross jobs and Managing
Authority (MA) familiarity with the definition of the indicator for the next programming period.
Use of the indicator in different policy areas
The use of the indicator varies between measures, Operational Programmes (OPs) and Member
States. The indicator is most used in relation to enterprise support (accounting for most of the
jobs reported in most countries) and RTDI, while tourism, restoring the cultural heritage and
other locally-based initiatives account for 30% or more in Hungary, Slovenia and Slovakia.
The indicator is not used at all in Denmark and not in OPs relating to transport, energy and the
environment in most countries since job creation is not a primary aim of intervention. In Greece,
however, many of the jobs reported to have been created are in transport and environmental
projects. Differences between countries reflect differing objectives but also variations in the
application of the indicator to similar measures, making it difficult to interpret the national
totals reported.
In a number of Member States, there is a question-mark over the types of measure to which the
indicator is applied. The aim of supporting enterprises is often to increase their competitiveness
and assist structural change rather than to create jobs directly. Indeed, it may lead to jobs losses
in the short-term. This is even more so in respect of RTDI. The indicator adopted to monitor
outcomes should, therefore, reflect the policy objectives, which is not always the case. In a few
countries too (e.g. Italy and Lithuania), the indicator has been more widely applied as
unemployment has risen without the measures concerned changing.
Definition and methods of calculation
The definition of the indicator and calculation methods are inadequately described in many
cases in guidance documents, though the directions published by DG Regional Policy in 20091
led to more consistent data being reported. In many countries, however, even where the
guidance is satisfactory, it is not implemented in practice and the methods used differ across
regions. In only a few countries are efforts made to ensure consistency and, in most countries,
there are problems in aggregating the data to calculate national totals. Inconsistencies arise in
part from the decentralisation of data collection which can mean that not even MAs know how
the figures reported are defined. The timing of the figures also varies between countries. In
some, they are reported on an on-going basis, in others once a year, in yet others, only when
projects have finished. In general, only limited efforts are made to avoid double-counting of
jobs.
1 Indicative Guidelines on Evaluation Methods: Reporting on core indicators for the ERDF and the Cohesion Fund, European Commission, 2009.
Job creation as an indicator of outcomes in ERDF programmes EvalNet Synthesis Report, 2013
iv
Content of data
According to the Commission guidelines, the data reported should relate to actual permanent
jobs, adjusted to full-time equivalents (FTEs), directly created as a result of interventions. In
Sachsen in Germany, some OPs in Greece and most OPs in Slovenia, however, the simple number
of jobs is reported. In around half the countries, temporary as well as permanent jobs are
counted, including jobs in construction in Ireland, Greece, Luxembourg and the Brussels region.
In some cases (e.g. in some German regions), jobs reported are expected rather than actual, in
others (e.g. some regions in France and Italy), jobs created indirectly are included. In some cases
too (in Greece and Italy, especially), the figures include jobs maintained as well as those created
with no distinction between the two. These divergences from the guidelines add to the lack of
comparability of the figures reported.
Aggregation of jobs created across OPs
In France, the UK, Poland, the Czech Republic, Austria and Finland, the figures for jobs created
are summed across OPs to calculate a national total. In Germany, Portugal, Hungary and Latvia,
they are also summed but only for reporting to the Commission. In most of these, only limited
checks are made to ensure that the data are sufficiently consistent to be capable of being
summed to produce a meaningful total. In other countries, the figures are not aggregated at all.
Whatever the practice, any total figures calculated are hard to interpret given the differences
noted above and it is hard to judge whether they are likely to overstate or understate the true
ones. Although most national experts did not regard the totals to be very reliable, only a few
were able to suggest better estimates, most of them below the published ones after the
exclusion of expected, safeguarded or indirectly created jobs or jobs in construction. According
to the estimates, just under 395,000 jobs were created up to the end of 2011 as a direct result of
ERDF support.
Use of jobs created as an indicator for nationally financed programmes
The jobs created indicator is used in Germany, France, the UK, Belgium and several other
countries to measure the outcome of nationally funded programmes, in some cases because
creating jobs is a condition for receiving support. In the majority of countries, however, there
are no national programmes using it, including in most EU12 countries.
Cost per job created
The data available in most cases are not detailed enough to make satisfactory estimates of the
average cost per job created. The estimates that are made in the national reports show wide
variations between types of intervention and countries, partly because of this. They, therefore,
not only reflect the differences in the way that jobs are defined and calculated but also, to
differing extents, they relate to expenditure which covers measures with objectives other than
direct job creation. Equally they leave out of account jobs which might be indirectly created by
interventions, in particular, through raising business competitiveness or boosting regional
development. Accordingly, the estimates give no real guide to the cost effectiveness of measures
in increasing employment.
Estimates of net jobs created
It is equally important to take account of the possible effect of interventions in displacing jobs in
the enterprises not receiving support, as well as of any deadweight effects stemming from the

Job creation as an indicator of outcomes in ERDF programmes EvalNet Synthesis Report, 2013
v
fact that some or all of the jobs attributed to the ERDF would have been created even without
support. While the neglect of indirect effects means that the jobs created are understated,
measuring jobs in gross rather than net terms – i.e. not taking account of displacement and
deadweight – leads to them being overstated. Estimates of net jobs created are reported to have
been made in only around a third of the countries, mainly as part of evaluations. In a few
countries (Germany, Poland and the three Baltic States), estimates have been produced by
macroeconomic models and relate to the overall effect on employment of Cohesion policy
funding over the whole programming period. Estimates, however, are not systematically made
and published in Annual Implementation Reports which tend to ignore the issue.
The proposed indicator for the 2014-2020 period
In nearly all countries, officials from the MAs interviewed were familiar with the proposed
indicator for the next programming period, though not in Bulgaria, the Czech Republic and
Portugal and not fully in Romania and Lithuania. Many, however, foresaw problems in applying
it, mainly because of a lack of precision in how jobs created should be measured and reported to
ensure consistency. Some also considered that the use should be compulsory, that the value of
the indicator needs to be made clearer, that monitoring systems need to be improved and that
there should be systematic quality checks and effective coordination between MAs to ensure the
reliability and comparability of the data. As well as MAs, beneficiaries and others providing the
data need also to understand the new requirements.
Concluding remarks
Because of longer-term structural objectives, the number of jobs created directly is rarely a
suitable indicator on its own for monitoring outcomes of ERDF support. It is, in any case, only a
very partial measure of the employment effects of support and is liable to be a misleading guide
to the allocation of funding if the aim is to increase employment. Moreover, there are major
difficulties of data inconsistency and of interpreting the figures reported, raising a serious
question-mark over their meaningfulness.
If the figures in the coming programming period are to give a reasonably reliable indication of
the additional jobs which the ERDF has been directly responsible for, there is a need to define
the indicator in a clear and unambiguous way. There is also a need to ensure that:
the data collected conform to the definition
common methods of identifying the jobs created, and the measures to which the
indicator should be applied, are adopted
effective arrangements for checking and verifying the data are put in place.
There is a parallel need to take explicit account of other indicators as well as jobs created which
reflect longer-term and ultimately more important objectives of policy. It is equally important to
improve the evaluation of relevant measures (i.e. those to which the indicator is applied) to
produce better estimates of their overall net effect on employment, including the jobs they
indirectly help to create. This would put the gross figures reported by the indicator into
perspective and help to avoid misplaced policies being adopted in the search for more jobs.
Job creation as an indicator of outcomes in ERDF programmes EvalNet Synthesis Report, 2013
vi
Résumé Le présent rapport résume les principaux points qui ressortent des 27 rapports nationaux
rédigés par le Réseau d'experts indépendants en évaluation concernant la création d'emploi en
tant qu'indicateur clé des résultats des programmes du FEDER. Il s'intéresse tout
particulièrement à la comparabilité des chiffres rapportés, ainsi qu'à la mesure dans laquelle
ceux-ci peuvent être agrégés de manière appropriée entre les différents programmes, ce qui est
devenu de plus en plus important au vu de l'attention croissante accordée à la création d'emploi
au sein de l'UE. Il se penche successivement sur la mesure dans laquelle ledit indicateur est
utilisé, sur sa définition et sur la méthode de collecte de données, sur la couverture des chiffres
rapportés, sur l'utilisation de l'indicateur, sur le coût moyen par emploi créé, sur la mesure dans
laquelle les estimations s’appuient sur les emplois nets et les emplois bruts et sur le degré de
familiarité de l'Autorité de Gestion (AG) avec la définition de l'indicateur pour la prochaine
période de programmation.
Utilisation de l'indicateur dans les différents domaines d'action
L'utilisation de l'indicateur varie en fonction des mesures, des Programmes Opérationnels (PO)
et des États membres. L'indicateur est surtout utilisé dans le domaine de l'aide aux entreprises
(qui représente la plupart des emplois créés rapportés dans la majorité des pays) et dans celui
de la RDTI, alors que le tourisme, la restauration du patrimoine culturel et d'autres initiatives
locales représentent 30 % ou plus en Hongrie, en Slovénie et en Slovaquie.
L'indicateur n'est pas du tout utilisé au Danemark et dans les PO menés dans le domaine des
transports, de l'énergie ou de l'environnement dans la plupart des pays, étant donné que la
création d'emploi n'est pas le principal objectif d'intervention dans ces secteurs. En Grèce,
toutefois, nombreux ont été les emplois rapportés à avoir été créés dans le cadre de projets dans
le domaine des transports ou de l’environnement. Les différences constatées entre les pays
reflètent la diversité des objectifs poursuivis par ces derniers, ainsi que les variations dans
l'application de l'indicateur à des mesures similaires, ce qui rend l'interprétation des totaux
nationaux rapportés délicate.
Pour certains États membres, on s'interroge sur les types de mesures auxquelles l'indicateur
s'applique. L'aide aux entreprises vise souvent à accroître leur compétitivité ainsi qu'à
accompagner leurs changements structurels, et non pas directement à créer des emplois. Ce
type d'aide peut en effet à court terme entraîner la disparition de postes de travail. Cela est
encore plus vrai en ce qui concerne la RDTI. Aussi, l'indicateur adopté pour le suivi des résultats
devrait refléter les objectifs politiques, ce qui n'est pas toujours le cas. Dans un petit nombre de
pays (comme l'Italie et la Lituanie), l'indicateur a été appliqué d'une manière plus généralisée, le
chômage ayant augmenté sans que les mesures y afférentes aient subi de modification.
Définition et méthodes de calcul
Souvent, la définition de l'indicateur et les méthodes de calcul sont décrites de manière
inappropriée dans les documents d'orientation, bien que les orientations publiées en 2009 par
la DG Politique Régionale2 aient permis de rapporter des données plus cohérentes. Néanmoins,
dans de nombreux pays, même lorsque les orientations s'avèrent satisfaisantes, elles ne sont
2 Orientations indicatives sur les méthodes d'évaluation: Rapport sur les indicateurs clés pour le Fonds européen de développement régional et le Fonds de cohésion, Commission européenne, 2009.

Job creation as an indicator of outcomes in ERDF programmes EvalNet Synthesis Report, 2013
vii
pas mises en œuvre en pratique, et les méthodes utilisées diffèrent en fonction des régions. Ce
n'est que dans un petit nombre de pays que des efforts sont consentis pour garantir la
cohérence, et la plupart des États rencontrent des difficultés en ce qui concerne l'agrégation des
données en vue du calcul des totaux nationaux. Les incohérences trouvent leur source, en partie,
dans le caractère décentralisé de la collecte des données, ce qui peut impliquer que les AG elles-
mêmes ne savent pas comment sont définies les données. La période à laquelle les données se
rapportent varie aussi en fonction des pays. Dans certains pays, les données sont rapportées en
continu, dans d'autres, une fois par an ou uniquement après la clôture des projets. En général,
seuls des efforts limités sont consentis afin d'éviter une double comptabilisation des emplois.
Contenu des données
Selon les orientations de la Commission, les données rapportées doivent concerner des emplois
permanents effectifs, ajustés en équivalents temps plein (ETP), directement créés suite aux
interventions. Néanmoins, pour la Saxe, en Allemagne, ainsi que dans le cas de certains PO en
Grèce et pour la plupart des PO slovènes, seul le nombre d'emplois a été communiqué. Dans
environ la moitié des pays, aussi bien les emplois temporaires que permanents sont pris en
compte, et notamment les emplois dans le secteur de la construction en Irlande, en Grèce, au
Luxembourg et dans la région de Bruxelles. Dans certains cas (par exemple, dans plusieurs
régions allemandes), les emplois rapportés sont des emplois planifiés et non des emplois réels,
alors que dans d'autres (comme dans certaines régions françaises ou italiennes), les emplois
créés de manière indirecte sont aussi pris en considération. Par ailleurs, les chiffres incluent
parfois tant les emplois préservés que ceux créés sans faire de distinction (comme c’est
notamment le cas en Grèce et en Italie). Ces écarts par rapport aux orientations viennent
renforcer le caractère peu comparable des chiffres rapportés.
L'agrégation des emplois créés dans les différents PO
En France, au Royaume-Uni, en Pologne, en République tchèque, en Autriche et en Finlande, les
chiffres concernant les emplois créés sont additionnés pour l'ensemble des PO afin de calculer le
total national. Il en est également ainsi en Allemagne, au Portugal, en Hongrie et en Lettonie,
mais uniquement dans le but d’en informer la Commission. Dans la plupart de ces pays, seuls
des contrôles limités sont réalisés pour s'assurer que les données sont suffisamment cohérentes
pour faire l'objet d'une agrégation permettant de déboucher sur un total qui a du sens. Dans
d'autres pays, les chiffres ne sont pas agrégés. Quelle que soit l’approche, l'ensemble des totaux
calculés s'avère difficile à interpréter, au vu des différences évoquées ci-dessus, et il est malaisé
d’évaluer s'il s'agit d'une surévaluation ou d'une sous-évaluation par rapport aux chiffres réels.
Bien que la plupart des experts nationaux ne considèrent pas ces totaux comme étant très
fiables, seuls quelques-uns d'entre eux ont été en mesure de suggérer des estimations plus
correctes (la majorité étant inférieures aux chiffres publiés après avoir écarté les emplois
planifiés, préservés ou créés de manière indirecte, ou encore les emplois dans le secteur de la
construction). Selon les estimations, moins de 395.000 emplois découlant directement de l'aide
apportée par le FEDER ont été créés jusqu’à la fin de l’année 2011.
Utilisation des emplois créés comme indicateur pour les programmes financés à
l'échelle nationale
L'indicateur des emplois créés est utilisé en Allemagne, en France, au Royaume-Uni, en Belgique
et dans plusieurs autres pays, afin de mesurer les résultats des programmes financés à l'échelle

Job creation as an indicator of outcomes in ERDF programmes EvalNet Synthesis Report, 2013
viii
nationale, compte tenu du fait que dans certains cas, la création d'emploi constitue une
condition pour la perception de l'aide. Néanmoins, dans la plupart des pays, aucun programme
national ne fait appel à cet indicateur, y compris dans la majorité des pays UE12.
Le coût par emploi créé
Dans la majorité des cas, les données disponibles ne sont pas suffisamment détaillées pour
effectuer des estimations satisfaisantes sur le coût moyen par emploi créé. C'est en partie la
raison pour laquelle les estimations proposées dans les rapports nationaux mettent en évidence
des variations importantes en fonction des types d'interventions et des pays. Aussi, non
seulement elles reflètent les différences quant à la définition et au calcul des emplois, mais elles
sont, à des degrés divers, également liées aux dépenses consacrées à des mesures visant des
objectifs autres que la création directe d'emploi. Par ailleurs, elles ne tiennent pas compte des
emplois susceptibles d'être créés indirectement par les interventions, en particulier par le biais
de l'augmentation de la compétitivité des entreprises ou de la dynamisation du développement
régional. Aussi, les estimations ne fournissent pas d’indication fiable sur la rentabilité des
mesures en termes de création d’emploi.
Les estimations relatives aux emplois nets créés
Il importe également de prendre en considération les effets possibles des interventions pour ce
qui est du transfert des emplois dans les entreprises qui ne reçoivent pas d'aides, ainsi que les
effets d'aubaine découlant du fait que certains ou la totalité des emplois attribués au FEDER
auraient été créés même sans le soutien de ce dernier. Alors que le défaut de prise en compte
des effets indirects a pour conséquence une sous-évaluation des emplois créés, le fait de les
mesurer en termes bruts et non en termes nets (ne prenant pas en considération le transfert et
l'effet d'aubaine) débouche sur une surestimation. La réalisation d'estimations sur les emplois
nets créés est rapportée dans seulement environ un tiers des pays, principalement dans le cadre
des évaluations. Dans un petit nombre de pays (en Allemagne, en Pologne et dans les trois pays
baltes), les estimations ont été générées par des modèles macroéconomiques, et portent sur
l'effet général sur l'emploi des financements issus de la politique de cohésion sur l'ensemble de
la période de programmation. Néanmoins, les estimations ne sont pas réalisées et publiées de
manière systématique dans les rapports annuels de mise en œuvre, lesquels tendent à ignorer la
question.
L'indicateur proposé pour la période 2014-2020
Dans presque la totalité des pays, les fonctionnaires des AG interrogés connaissaient l'indicateur
proposé pour la période de programmation suivante, bien que cela n'ait pas été le cas en
Bulgarie, en République tchèque et au Portugal, et pas entièrement en Roumanie et en Lituanie.
Nombre d’entre eux ont toutefois anticipé des difficultés dans son application, principalement
en raison du manque de précisions quant à la manière dont les emplois créés devraient être
mesurés et rapportés pour garantir une cohérence. Par ailleurs, certains estiment que
l'utilisation de l'indicateur devrait être obligatoire, que sa valeur devrait être précisée, que les
systèmes de suivi devraient être améliorés et que des contrôles de qualité systématiques et une
coordination effective entre les AG devraient être mis en œuvre afin d'assurer la fiabilité et la
comparabilité des données. Comme pour les AG, les bénéficiaires et les fournisseurs de données
ont besoin de comprendre les nouvelles exigences.
Job creation as an indicator of outcomes in ERDF programmes EvalNet Synthesis Report, 2013
ix
Observations finales
Au vu des objectifs structurels à plus long terme, le nombre d'emplois créés directement
constitue rarement un indicateur adapté, en tant que tel, pour le suivi des résultats de l'aide
apportée par le FEDER. Il ne s'agit, en tout état de cause, que d'une simple mesure partielle des
effets sur l'emploi, susceptible de constituer une indication trompeuse pour l'attribution des
financements si le but poursuivi est celui de faire augmenter l'emploi. Par ailleurs, il y a des
difficultés majeures liées à l’incohérence des données et à l'interprétation des chiffres
rapportés, ce qui soulève des doutes sérieux sur leur pertinence.
Pour que les chiffres afférents à la prochaine période de programmation puissent constituer une
indication fiable des emplois supplémentaires attribués de manière directe au FEDER, il est
nécessaire de définir l'indicateur d'une manière claire et non ambiguë. Il faut également
s'assurer que:
les données collectées sont conformes à la définition ;
des méthodes communes d’identification des emplois créés (et des mesures auxquelles
l'indicateur devra être appliqué) sont adoptées ;
des dispositions efficaces en matière de contrôle et de vérification des données sont
mises en place.
Il convient, en parallèle, de prendre expressément en considération d'autres indicateurs, ainsi
que des emplois créés qui reflètent des objectifs politiques à plus long terme et en fin de compte
plus importants. Il importe également d'améliorer l'évaluation des mesures concernées (c'est-à-
dire celles pour lesquelles l'indicateur est appliqué) afin de générer de meilleures estimations
de leur impact global net sur l'emploi (notamment en termes d'emploi créés de manière
indirecte). Ceci permettrait de mettre en perspective les chiffres bruts rapportés dans le cadre
de l'indicateur, et d’éviter l'adoption de politiques mal ciblées en matière de création d'emploi.
Job creation as an indicator of outcomes in ERDF programmes EvalNet Synthesis Report, 2013
x
Zusammenfassung
Der Bericht fasst die wichtigsten Punkte der 27 einzelstaatlichen Studien zusammen, die vom
Evaluierungsnetzwerk unabhängiger Sachverständiger zur Arbeitsplatzschaffung als zentralem
Ergebnisindikator für EFRE-Programme erstellt wurden. Das Hauptaugenmerk des Berichts
liegt auf der Vergleichbarkeit der übermittelten Angaben und inwieweit diese sinnvoll über
verschiedene Programme hinweg aggregiert werden können. Dies ist angesichts der
vermehrten politischen Aufmerksamkeit, die der Schaffung von Arbeitsplätzen EU-weit
eingeräumt wird, zunehmend von Bedeutung. Der Bericht untersucht nacheinander folgende
Punkte: inwieweit der Indikator angewandt wird, die Art der Definition des Indikators und die
Datenerfassungsmethoden, die Erfassung der übermittelten Daten, die Nutzung des Indikators,
die durchschnittlichen Kosten pro neu geschaffenem Arbeitsplatz, inwieweit Schätzungen
hinsichtlich Netto- und Bruttoarbeitsplätzen angestellt werden sowie die Kenntnisse von
Verwaltungsbehörden in Bezug auf die Definition des Indikators für den nächsten
Programmplanungszeitraum.
Nutzung des Indikators in verschiedenen politischen Bereichen
Der Indikator kommt auf unterschiedliche Weise im Rahmen von Maßnahmen und
operationellen Programmen (OP) zum Einsatz, wobei Unterschiede zwischen den einzelnen
Mitgliedstaaten bestehen. Der Indikator wird in erster Linie bei der Förderung von
Unternehmen (die in den meisten Ländern einen Großteil der gemeldeten Arbeitsplätze
schaffen) und in den Bereichen Forschung, technologische Entwicklung und Innovation (FTEI)
verwendet. Dagegen beläuft sich der Anteil von Tourismus, der Wiederherstellung des
kulturellen Erbes und anderen lokalen Initiativen auf 30 Prozent, und noch mehr in Ungarn,
Slowenien und der Slowakei.
Keinerlei Verwendung findet der Indikator in Dänemark und in den meisten Ländern bei
operationellen Programmen in den Bereichen Verkehr, Energie und Umwelt, da die Schaffung
von Arbeitsplätzen kein Hauptziel von Interventionen darstellt. In Griechenland wurden jedoch
zahlreiche Beschäftigungsmöglichkeiten nachweislich im Rahmen von Verkehrs- und
Umweltprojekten geschaffen. Die landesspezifischen Unterschiede spiegeln die verschiedenen
Zielsetzungen, aber auch die Unterschiede wider, die bei der Anwendung des Indikators auf
ähnliche Maßnahmen bestehen. Folglich gestaltet sich die Auslegung der ausgewiesenen
nationalen Gesamtergebnisse als schwierig.
In mehreren Mitgliedstaaten gibt es Fragen zur Anwendung des Indikators auf verschiedene
Maßnahmearten. Die Förderung von Unternehmen erfolgt häufig mit dem Ziel, deren
Wettbewerbsfähigkeit zu steigern und sie bei strukturellen Veränderungen zu unterstützen. Die
direkte Schaffung von Arbeitsplätzen ist dabei eher zweitrangig. Tatsächlich kann die
Unternehmensförderung kurzfristig zu einem Stellenabbau führen, insbesondere im Bereich
FTEI. Der zum Ergebnismonitoring angewandte Indikator sollte daher die politischen
Zielsetzungen abbilden, was jedoch nicht immer gegeben ist. In einigen Ländern (z. B. Italien
und Litauen) findet der Indikator angesichts der steigenden Arbeitslosigkeit eine umfassendere
Anwendung, ohne dass die betreffenden Maßnahmen selbst Änderungen unterliegen.
Job creation as an indicator of outcomes in ERDF programmes EvalNet Synthesis Report, 2013
xi
Definition und Berechnungsmethoden
Obwohl die Definition des Indikators und die Berechnungsmethoden in vielen Fällen nur
unzureichend in den Leitlinien beschrieben werden, konnte durch die von der GD
Regionalpolitik 20093 veröffentlichen Leitlinien eine gesteigerte Datenkonsistenz erreicht
werden. In vielen Ländern jedoch, die über sachdienliche Leitlinien verfügen, werden diese
nicht in die Praxis umgesetzt, sodass bei den angewandten Methoden große regionale
Unterschiede bestehen. Lediglich eine begrenzte Anzahl von Ländern bemüht sich darum, die
Konsistenz sicherzustellen, und in den meisten Staaten gestaltet sich die Aggregation der Daten
zur Ermittlung von nationalen Gesamtzahlen als schwierig. Inkonsistenzen sind teilweise auf die
Dezentralisierung der Datenerfassung zurückzuführen, aufgrund derer selbst die
Verwaltungsbehörden nicht die Definitionen kennen, die den Angaben zugrunde liegen. Auch
hinsichtlich des Zeitpunkts der Datenerfassung bestehen landesspezifische Unterschiede. In
einigen Ländern werden die Daten fortlaufend ausgewiesen, während sie in anderen einmal
jährlich oder lediglich nach Abschluss von Projekten ermittelt werden. In der Regel werden nur
begrenzte Anstrengungen unternommen, um die doppelte Erfassung von Arbeitsplätzen zu
vermeiden.
Dateninhalt
Den Leitlinien der Kommission zufolge sollten sich die übermittelten Daten auf tatsächlich
geschaffene feste Stellen auf der Basis von Vollzeitäquivalenten beziehen, welche als
unmittelbare Folge von Projekten entstehen. Im Bundesland Sachsen, in einigen operationellen
Programmen in Griechenland und in der Mehrzahl der operationellen Programme in Slowenien
wird jedoch nur die Anzahl der Arbeitsplätze angegeben. Bei rund der Hälfte der untersuchten
Länder werden sowohl Saisonarbeitsplätze als auch feste Stellen erfasst, zu denen in Irland,
Griechenland, Luxemburg und in der Region Brüssel Arbeitsplätze im Baugewerbe gehören. In
einigen Fällen (z. B. in einigen Regionen Deutschlands) werden die erwarteten anstatt die
tatsächlichen Arbeitsplätze gemeldet, in anderen (z. B. in einigen französischen und
italienischen Regionen) werden auch die indirekt geschaffenen Arbeitsstellen erfasst. Zudem
weist eine Anzahl von Ländern (insbesondere Griechenland und Italien) gesicherte und neu
geschaffene Arbeitsplätze aus, ohne zwischen den beiden Kategorien zu unterscheiden. Diese
Abweichungen von den Leitlinien tragen zur fehlenden Vergleichbarkeit der übermittelten
Daten bei.
Aggregation von geschaffenen Arbeitsplätzen in sämtlichen operationellen Programmen
In Frankreich, Polen, der Tschechischen Republik, Österreich, Finnland sowie im Vereinigten
Königreich werden von sämtlichen operationellen Programmen die Zahlen neu geschaffener
Arbeitsplätze addiert, um ein nationales Gesamtergebnis zu erhalten. Auch in Deutschland,
Portugal, Ungarn und Lettland erfolgt eine solche Aggregation, jedoch nur für die
Berichterstattung an die Kommission. In der Mehrzahl dieser Länder werden nur begrenzt
Prüfungen durchgeführt, um sicherzustellen, dass diese Daten ausreichend vergleichbar sind
und zu einem aussagekräftigen Gesamtergebnis zusammengefasst werden können. In anderen
Ländern werden die Angaben in keiner Weise aggregiert. Unabhängig von der angewandten
Praxis gestaltet sich die Interpretation berechneter Gesamtzahlen aufgrund der genannten
3 Indikative Leitlinien zu Bewertungsverfahren: Berichterstattung über Hauptindikatoren für den Europäischen Regionalen Entwicklungsfonds und den Kohäsionsfonds, Europäische Kommission, 2009.
Job creation as an indicator of outcomes in ERDF programmes EvalNet Synthesis Report, 2013
xii
Unterschiede als schwierig. Es kann daher nur schwer beurteilt werden, ob eine Über- oder
Unterbewertung des Zahlenmaterials vorliegt. Fast alle nationalen Sachverständigen hielten die
Gesamtzahlen nicht für sehr verlässlich, und nur wenige konnten bessere Schätzungen
einbringen, die nach Ausschluss der erwarteten, gesicherten oder indirekt geschaffenen
Arbeitsplätze oder Beschäftigungsmöglichkeiten im Baugewerbe in den meisten Fällen unter
den veröffentlichten Daten lagen. Den Schätzungen zufolge wurden bis Ende 2011 als
unmittelbare Folge der Förderung durch den EFRE 395.000 Arbeitsplätze geschaffen.
Geschaffene Arbeitsplätze als Indikator für einzelstaatlich finanzierte Programme
Der Indikator für neu geschaffene Arbeitsstellen kommt in Deutschland, Frankreich, im
Vereinigten Königreich, in Belgien und zahlreichen anderen Ländern zum Einsatz, um die
Ergebnisse einzelstaatlich geförderter Programme zu bewerten. Grund hierfür ist in einigen
Fällen, dass die Schaffung von Arbeitsplätzen eine Voraussetzung für die Gewährung von
Fördermitteln darstellt. In der Mehrzahl der Länder, einschließlich der meisten EU-12-Staaten,
wird der Indikator jedoch nicht im Rahmen von nationalen Programmen verwandt.
Kosten pro geschaffenem Arbeitsplatz
Den verfügbaren Daten mangelt es in den meisten Fällen an Detailtiefe, um fundierte
Schätzungen zu den Durchschnittskosten pro geschaffenem Arbeitsplatz anstellen zu können.
Auf diesen Umstand ist teilweise zurückzuführen, dass die in die nationalen Berichte
eingebrachten Schätzungen in Bezug auf Maßnahmenarten und Länder erhebliche
Abweichungen aufweisen. Sie spiegeln daher nicht nur die unterschiedlichen Definitionen und
Berechnungen von Arbeitsplätzen wider, sondern beziehen sich zudem in unterschiedlichem
Ausmaß auf Ausgaben für Maßnahmen, die andere Ziele als die direkte Schaffung von
Arbeitsplätzen verfolgen. Desgleichen werden in diesem Rahmen Arbeitsstellen nicht
berücksichtigt, die indirekt durch Maßnahmen geschaffen werden, die insbesondere auf die
Steigerung der Wettbewerbsfähigkeit von Unternehmen und die Förderung der regionalen
Entwicklung abzielen. Dementsprechend können die Schätzungen nicht als verlässlicher
Hinweis für die Kosteneffizienz von Maßnahmen zur Verbesserung der Beschäftigungslage
dienen.
Schätzungen zu geschaffenen Nettoarbeitsplätzen
Ebenso wichtig ist die Berücksichtigung der möglichen Auswirkung von Interventionen, in
deren Rahmen Arbeitsplätze in Unternehmen verdrängt werden, die keine Fördermittel
erhalten, sowie von Mitnahmeeffekten, die sich aus der Tatsache ergeben, dass einige oder alle
dem EFRE zuzuschreibenden Arbeitsplätze auch ohne Förderung entstanden wären. Während
die Vernachlässigung indirekter Effekte dazu führt, dass die Zahl der geschaffenen Arbeitsplätze
als zu niedrig angesetzt wird, wird durch die Ermittlung in Brutto- anstatt in Nettowerten – d. h.
ohne Verdrängung und Mitnahmeeffekte zu beachten – die Anzahl der Stellen als zu hoch
eingestuft. Die Schätzungen zur Schaffung von Nettoarbeitsplätzen wurden den Angaben nach
nur in rund einem Drittel der Länder, meistens im Rahmen von Bewertungen, durchgeführt. In
einigen Ländern (Deutschland, Polen und die drei baltischen Staaten) wurden Schätzungen im
Rahmen von makroökonomischen Modellen angestellt. Diese beziehen sich auf die Förderung
durch kohäsionspolitische Mittel im gesamten Programmplanungszeitraum und der damit
erzielten Gesamtwirkung auf die Beschäftigungslage. Die Schätzungen werden jedoch nicht
Job creation as an indicator of outcomes in ERDF programmes EvalNet Synthesis Report, 2013
xiii
systematisch angestellt und in den jährlichen Tätigkeitsberichten veröffentlicht, die diese
Thematik häufig unberücksichtigt lassen.
Der für den Zeitraum 2014-2020 vorgeschlagene Indikator
In fast allen Ländern waren die befragten Bediensteten der Verwaltungsbehörden mit dem für
den nächsten Programmplanungszeitraum vorgeschlagenen Indikator vertraut. Ausnahmen
waren Bulgarien, die Tschechische Republik sowie Portugal, während in Rumänien und Litauen
Teilkenntnisse bestanden. Mehrheitlich wurden jedoch Probleme bei der Anwendung
vorhergesehen. Als Hauptgrund wurden fehlende Informationen zur Erfassung und
Übermittlung der Anzahl neu geschaffener Arbeitsplätze genannt, um Vergleichbarkeit zu
gewährleisten. Zum Teil wurde auch darauf hingewiesen, dass die Nutzung verbindlich sein
sollte, dass der Wert des Indikators deutlicher herausgestellt werden sollte, dass die
Überwachungssysteme verbessert werden und systematische Qualitätskontrollen sowie eine
effektive Koordinierung zwischen den Verwaltungsbehörden eingeführt werden sollten, um die
Verlässlichkeit und Vergleichbarkeit der Daten sicherzustellen. Neben den
Verwaltungsbehörden müssen auch Leistungsempfänger und sonstige Datenlieferanten die
neuen Anforderungen nachvollziehen können.
Abschließende Bemerkungen
Aufgrund langfristiger struktureller Zielvorgaben ist in den seltensten Fällen die Anzahl der
unmittelbar geschaffenen Arbeitsplätze alleine ein geeigneter Indikator, um die Ergebnisse der
EFRE-Förderung zu überwachen. Jedenfalls dient diese Anzahl nur sehr eingeschränkt als Maß
für die Beschäftigungseffekte, die durch eine Förderung erzielt werden, und ist bei der
Zuweisung von Fördermitteln irreführend, wenn das Ziel in einer Steigerung der
Beschäftigungsquote liegt. Darüber hinaus bestehen schwerwiegende Probleme hinsichtlich
Dateninkonsistenz und -interpretation, womit die Aussagekraft der Angaben ernsthaft in Frage
gestellt wird.
Um sicherzustellen, dass die Daten im kommenden Programmplanungszeitraum einen
angemessenen und verlässlichen Hinweis auf die zusätzlichen Arbeitsplätze geben, die durch
den EFRE direkt geschaffen wurden, muss der Indikator in eindeutiger und
unmissverständlicher Weise definiert werden. Zudem muss sichergestellt werden, dass
die erfassten Daten der Definition entsprechen;
einheitliche Methoden zur Ermittlung neu geschaffener Arbeitsplätze und die
Maßnahmen, auf die der Indikator anzuwenden ist, angenommen werden;
wirksame Vorkehrungen zur Kontrolle und Überprüfung der Daten getroffen werden.
Parallel dazu müssen ausdrücklich andere Indikatoren sowie neu geschaffene Arbeitsplätze
berücksichtigt werden, die längerfristige und letztlich wichtigere politische Ziele verfolgen. Eine
ebenso wichtige Rolle spielt die Bewertung der betroffenen Maßnahmen, (d.h. jene auf die der
Indikator Anwendung findet), um deren Gesamtnettoeffekt auf die Beschäftigung, einschließlich
der indirekt durch diese Maßnahmen geschaffenen Arbeitsplätze, besser einschätzen zu
können. Auf diese Weise könnten die durch den Indikator bemessenen Bruttozahlen relativiert
werden und im Rahmen der Bemühungen zur Verbesserung der Beschäftigungslage dazu
beitragen, verfehlte Maßnahmen zu vermeiden.
Job creation as an indicator of outcomes in ERDF programmes EvalNet Synthesis Report, 2013
1
1. Introduction This report synthesises the main points to come out of the 27 national studies produced by the
independent experts of the Evaluation network on the use of jobs created as an indicator of the
outcome of programmes supported by the ERDF4. Job creation is one the core indicators chosen
to measure the achievements of Cohesion policy because it is one of the few variables which, in
principle at least, can be summed across regions and countries to produce an overall ‘headline’
figure. Indeed, such a figure is increasingly used at EU level to demonstrate the tangible effects
of policy. There are serious questions, however, over the consistency of the data reported for
programmes across the EU, the extent to which the figures are comparable and how far they can
be meaningfully aggregated. The national studies were motivated by the importance of being
able to answer these kinds of question, particularly in a context where there is growing concern
about the scale of unemployment in the Union and increasing policy attention being paid to job
creation and the means of stimulating this.
Specifically, the aims of the studies were to examine:
the extent to which the indicator of gross jobs created is employed to monitor and
assess the outcome of interventions in terms of the policy areas and types of measure
concerned and its appropriateness in this regard;
the way the indicator is defined, the method of data collection and the extent to which
these are the same across programmes and regions both within countries and between
them, which is key to judging how far the data collected are comparable and can,
therefore, be meaningfully aggregated;
the average cost per job created by particular types of measures in different policy areas
in terms of both the public subsidy involved, whether financed by the ERDF or national
sources, and – where the data are available - the overall expenditure entailed;
the content of the figures reported for jobs created, the extent to which they include the
indirect as well as the direct effects of intervention and the job created during the
construction phase of projects as well as those which remain in the longer-term;
the use made of the data collected at national as well as EU level and how far the
indicator is applied to national policies in addition to ERDF co-financed measures;
the extent to which estimates are made of the number of net jobs created to supplement
the measure of gross jobs, taking explicit account of displacement effects and the
effective substitution of existing jobs by the new ones;
the familiarity of Managing Authorities with the new definition of the indicator adopted
for the next programming period and their views on it.
The findings in each case are set out below.
4 The experts are listed at the front of this report.

Job creation as an indicator of outcomes in ERDF programmes EvalNet Synthesis Report, 2013
2
2. Use of the indicator to assess outcomes in different policy areas
Use of the indicator at programme and sub-programme level
Although jobs created was chosen as a core indicator for the 2007-2013 period, with the
intention of producing aggregate figures for both countries and the EU as a whole, as concrete
evidence of the achievements of ERDF co-financed interventions, its application by Member
States remained voluntary and its use varies markedly between them. The variation comes not
only from the different approaches taken by Member States to the use of the indicator but also
from differences between regions – and Operational Programmes (OPs) more generally – within
countries in the extent of its application. This may be justifiable in some cases because of the
differing objectives of programmes, but in other cases it reflects differing attitudes towards the
relevance of the indicator.
Four cases can be distinguished:
1. The indicator is not used or reported at all. This is the case in Denmark in respect of all
expenditure, for the Regional Development OP in Bulgaria and for most OPs relating to
transport, energy and the environment across the EU, the reason being that job creation
is not regarded as a primary objective of policy and so other indicators which are
regarded as being of more direct relevance are monitored instead.
2. Data on jobs created are confined to reporting on the EU core indicator at OP level but
are not used at all to measure the outcome from interventions at sub-OP level. There are
many cases where ‘gross jobs created’ are reported for the whole of an OP but where
there is no breakdown published of the data by priority or measure (e.g. the Flemish OP
in Belgium, the Nordrhein-Westfalen OP in Germany, the Competitiveness OP in
Bulgaria, the Sustainable development and competitiveness OP in Cyprus, the ‘Investing
in Competitiveness for a Better Quality of Life’ OP in Malta and the Territorial
Valorisation OP in Portugal). In the Annual Implementation Reports (AIRs) for the OPs
concerned, there tends to be only a single reference to the indicator, typically in an
overview table setting out the total number of jobs created, with no further details given.
The reason why this is the case and the indicator is not shown, or perhaps even used, at
a more disaggregated level to report on outcomes by priority or measure is generally
not spelled out.
3. The indicator is reported in the AIR at both OP and priority level with the total at OP
level being different from the sum of the figures given for the different priorities because
only selected interventions are included in the total figure reported. There are a number
of OPs in which this is the case (e.g. the OPs for Lithuania, the Brussels region and
Bremen and Mecklenburg-Vorpommern in Germany).
4. The indicator is reported at both the OP and priority level with the total at OP level
being equal to the sum of the figures shown for the different priorities. There are many
OPs where this is the case (e.g. in a number of German regions – such as Baden-
Württemberg, Hessen, Niedersachsen, Rheinland-Pfalz and Sachsen-Anhalt – the
Walloon region and Hainaut in Belgium, the regions in the Netherlands and the
Luxembourg OP).

Job creation as an indicator of outcomes in ERDF programmes EvalNet Synthesis Report, 2013
3
In many countries, the approach, as suggested by the above, differs from OP to OP or from
region to region (e.g. in Germany, Italy, the UK, Poland, Portugal and Belgium), in that the
indicator is used extensively in one OP and much less in others. This opens up the possibility of
the nationally aggregated figures being based on a coverage of interventions which differs
between regions, or OPs, insofar as the jobs created by a given type of measure or in a particular
policy area are included in the figures reported in some cases but not in others. Accordingly, it
makes it difficult to interpret the national totals reported in these countries since they relate to
a varying proportion of the expenditure co-financed by the ERDF which is not necessarily
related to the composition of programmes.
In some countries, the indicator is used extensively in all OPs, in others little or not at all. In
Finland, for example, the number of jobs created is regarded as an important indicator for
measuring the outcome of many of the interventions supported by the ERDF and is used for all
priorities and in all policy areas, though not for all types of measure. In Sweden too, new jobs –
and new firms – created are used as an indicator in all the priority areas. Jobs created is also one
of the most commonly used indicators in current ERDF programmes across the UK, despite
some variation between regions, which is equally the case in Spain and France. On the other
hand, as noted above, the indicator is not included at all in the indicator system in Denmark or
in the Regional development OP in Bulgaria and is reported only at the OP level in Cyprus and
Malta.
The policy areas in which jobs created is used as an indicator
The number of jobs created is most used as an indicator of the outcome of ERDF-co-financed
expenditure on enterprise support, RTDI and in some areas of territorial development5,
especially tourism. This is the case in the large majority of Member States, the exceptions being
Bulgaria, Greece, Ireland, Luxemburg and Latvia. In other policy areas – specifically, transport,
the environment, energy and human resource development – it is either not used at all as an
indicator or very little (Table 1).
Enterprise support is the broad policy area in which most of the jobs reported are created–
63% of the jobs reported overall up to the end of 2011, over 90% in Austria, Belgium, Bulgaria,
Germany and Ireland and over 80% in the Czech Republic, Estonia, Finland, Latvia and Romania.
In France, Portugal and Sweden, the proportion of reported jobs created in this area together
with RTDI – the data available do not enable the two to be split – was also over 90%. By
contrast, in Poland and Lithuania, the proportion was only just over half, in Hungary, less than a
half and in Greece, only 35%, much smaller than in any other country.
RTDI is the second most important policy area in respect of jobs reported. In Luxembourg, the
proportion (57%) was larger than for enterprise support, while in Poland, it amounted to
around 40%, in Spain to around 30% and in Lithuania to around a quarter
Territorial development is the only other policy area in which the proportion of jobs reported
was over 10% in more than one country. In Hungary, it amounted to almost half of the total up
to the end of 2011 - the same as for enterprise support - though this includes jobs created
through support for renewable energy or improving energy efficiency. In Slovenia and Slovakia,
5 Territorial development covers support for a range of locally or regionally centred activities, such as cultural or community ones, social infrastructure and urban regeneration as well as tourism.
Job creation as an indicator of outcomes in ERDF programmes EvalNet Synthesis Report, 2013
4
the proportion was 30% or more – more than in RTDI – and in the Netherlands and Lithuania,
around a quarter, in the latter the same as in RTDI.
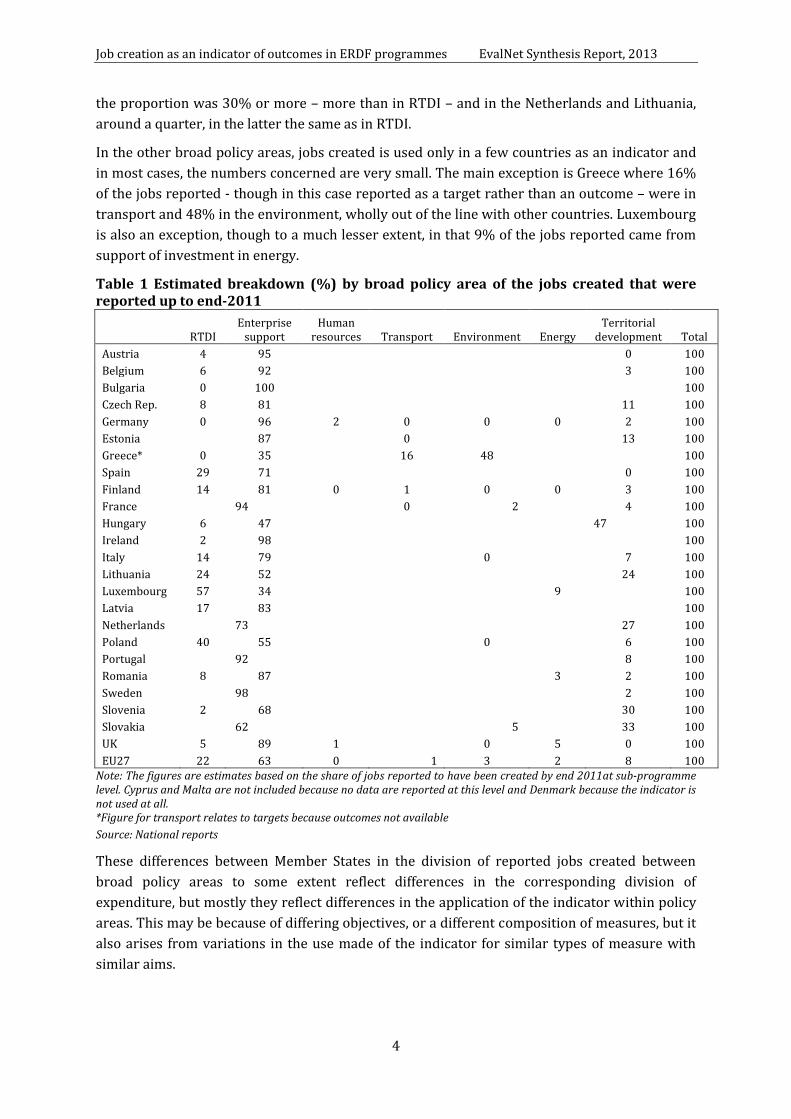
In the other broad policy areas, jobs created is used only in a few countries as an indicator and
in most cases, the numbers concerned are very small. The main exception is Greece where 16%
of the jobs reported - though in this case reported as a target rather than an outcome – were in
transport and 48% in the environment, wholly out of the line with other countries. Luxembourg
is also an exception, though to a much lesser extent, in that 9% of the jobs reported came from
support of investment in energy.
Table 1 Estimated breakdown (%) by broad policy area of the jobs created that were reported up to end-2011
RTDI
Enterprise support
Human resources Transport Environment Energy
Territorial development Total
Austria 4 95 0 100
Belgium 6 92 3 100
Bulgaria 0 100 100
Czech Rep. 8 81 11 100
Germany 0 96 2 0 0 0 2 100
Estonia 87 0 13 100
Greece* 0 35 16 48 100
Spain 29 71 0 100
Finland 14 81 0 1 0 0 3 100
France 94 0 2 4 100
Hungary 6 47 47 100
Ireland 2 98 100
Italy 14 79 0 7 100
Lithuania 24 52 24 100
Luxembourg 57 34 9 100
Latvia 17 83 100
Netherlands 73 27 100
Poland 40 55 0 6 100
Portugal 92 8 100
Romania 8 87 3 2 100
Sweden 98 2 100
Slovenia 2 68 30 100
Slovakia 62 5 33 100
UK 5 89 1 0 5 0 100
EU27 22 63 0 1 3 2 8 100 Note: The figures are estimates based on the share of jobs reported to have been created by end 2011at sub-programme level. Cyprus and Malta are not included because no data are reported at this level and Denmark because the indicator is not used at all. *Figure for transport relates to targets because outcomes not available
Source: National reports
These differences between Member States in the division of reported jobs created between
broad policy areas to some extent reflect differences in the corresponding division of
expenditure, but mostly they reflect differences in the application of the indicator within policy
areas. This may be because of differing objectives, or a different composition of measures, but it
also arises from variations in the use made of the indicator for similar types of measure with
similar aims.
Job creation as an indicator of outcomes in ERDF programmes EvalNet Synthesis Report, 2013
5
Types of intervention for which jobs created is used as an indicator
In the case of enterprise support, the jobs created which are reported primarily come from
direct assistance to companies, particularly in the form of investment grants (especially in
Germany, Austria, Belgium, Poland and Romania), and support for innovation and advanced
services. Indeed, in some Member States (such as Germany and Belgium), creating jobs is a legal
requirement for receipt of investment grants.
In Ireland, the figures reported relate mainly to support of micro-enterprises and in Estonia, to
support of exports and investment in technology, while in Latvia, they relate to a large extent to
jobs created in incubation centres. In some countries (such as Lithuania), the jobs reported also
include those created by Financial Engineering Instruments (FEIs).
In the case of RTDI, the jobs reported in most Member States relate to the research jobs created
through support of R&D projects in research centres or enterprises. In some countries (e.g. Italy
and Lithuania), however, the figures reported include other jobs as well as research ones.
In the case of territorial development, which covers a range of policy areas, the jobs reported
relate in many cases to those created through support for tourism and the cultural heritage (e.g.
in Italy, Poland and Romania) or for improving regional attractiveness (e.g. in the Walloon
region and Hainaut in Belgium). In some countries (e.g. Estonia and Lithuania), they also relate
to support for public services and social infrastructure.
The appropriateness of using jobs created as an indicator in programmes
As is evident from the above, jobs created is used as an indicator of outcome for the most part in
policy areas in which it would be expected to be applied in the sense that at least part of the
objective of intervention is to create jobs – in enterprise support rather than, say, in transport,
where the main aim is not to create jobs as such, especially directly.
In a number of Member States, however, there is a question-mark over the appropriateness of
applying the indicator to certain types of measure. In particular, support to enterprises in many
cases is explicitly aimed at increasing their competitiveness and bringing about structural
change rather than at directly creating jobs. Indeed, such support might lead to jobs losses in the
short-term. The strategic objectives of the intervention, therefore, need to be taken into account
when decisions are made on the most relevant indicator(s) to adopt to monitor outcomes and
whether or not jobs created is appropriate. In many Member States (such as Austria, Belgium,
Denmark and Finland), this happens in practice, in others (such as Italy), it is less evidently the
case.
In a number of counties (Denmark and Austria being prominent among them), there is
opposition to the use of jobs created as a ‘general indicator’, especially in Competitiveness
regions where ERDF support is small and is directed at other aims, such as stimulating
innovation and entrepreneurship. Nevertheless, jobs created is seen in many cases as a ‘must
have’ indicator from a political perspective even though it might not reflect the scope of
enterprise support policy and other indicators, which relate to the specific objectives of policy,
are more relevant.

Job creation as an indicator of outcomes in ERDF programmes EvalNet Synthesis Report, 2013
6
The use of jobs created as an indicator is particularly problematic in respect of RTDI, where, as
many reports point out, job creation is not a primary aim of the support provided and in some
cases not an aim at all.
Other points
At the time when the present OPs were initially prepared, the macroeconomic context was very
different from what it has turned out to be. Job creation was not a major aim of most ERDF co-
financed measures, though it might have been regarded as a positive side-effect. Accordingly,
the number of jobs created was not considered to be a key indicator of the output or results of
policy but instead a traditional indicator which Managing Authorities might continue to
monitor. (An exception is Greece where job creation seems to have been a priority for the
Government from the beginning of the programming period.)
Well after the start of programming period, because of the mounting unemployment resulting
from the crisis, jobs created was introduced as an indicator more extensively in a number of
countries (e.g. in Italy and Lithuania) to monitor the outcome of ERDF co-financed
interventions. In Italy, it is reported to have been adopted in most programmes without a real
sense of its usefulness or any feeling of ‘ownership’. In Romania, common indicators were
introduced only in 2011.
3. Definition, methods, data reporting and wider use of the indicator
Definition and methods used for calculation
The definition of the jobs created indicator and the methods to be used for calculating the
figures reported are in most cases set out in guidance documents or handbooks regulating the
implementation of projects. Guidance is also included in OPs in many countries. In a few cases, it
is relatively clear (in the UK, Luxembourg and the Competitiveness OP in Bulgaria), but in in
other cases, it is either poorly described (in Romania and Malta) or excessively general (in
Lithuania). For a number of countries, the directions included in Working Document no. 7,
prepared by DG Regional Policy in 20096, are reported to have made the definition of the
indicator clear and to have led to more consistency in the data reported (e.g. in Romania, the
Netherlands and some regions of Italy).
In some countries, however (Denmark, Latvia, Cyprus and Malta), there is no explicit definition
of the indicator and the methods to be used to calculate the number of new jobs created.
In Denmark, job creation is not used as an indicator of the outcome of ERDF-supported
measures but project promoters are asked to give an idea of the expected effects on job
creation; the resulting estimates are then made available for use in evaluations.
In Cyprus, progress in creating jobs from ERDF support was assessed in the Mid-term
evaluation through ad hoc surveys and the data provided by intermediaries on on-going
projects.
6 Indicative Guidelines on Evaluation Methods: Reporting on core indicators for the ERDF and the Cohesion Fund, European Commission, 2009.
Job creation as an indicator of outcomes in ERDF programmes EvalNet Synthesis Report, 2013
7
In Malta, it is left to beneficiaries of ERDF support to provide an explanation of how the
target figures for jobs created are set and how the data to monitor their achievement
will be collected.
While the definition of the indicator and the methods to be used for collecting data seem not
only to be clearly documented but for the most part followed in a number of countries (Austria,
Finland, Sweden, the UK, Lithuania, Poland, Slovenia and Slovakia), in others, there are
problems in the way the guidance given is implemented in practice:
In Estonia, no significant attempts are made to ensure the consistency of the way the
indicator is defined and the data are reported. As a result, the data collected lack
coherence and the fact that there are no explanatory notes on how they have been
calculated means that the meaning of the data is unclear.
In France, where DATAR has published guidelines on the definition of the indicator and
methods of data collection, the actual way the indicator is defined is not harmonised
across regions and the method used for calculation is in most cases not explained in any
detail. As a result, there is a lack of comparability of the data reported between regions,
though the extent of this is unclear.
In Spain, where the definition of the indicator and the methods to be used to collect data
are clearly documented, there are still differences between OPs in the way the jobs
created are actually defined and reported.
The late adoption of the clearer guidelines published by the Commission in 2009 has also
affected the reporting of data:
In Romania, the absence of a clear definition of the indicator during the initial period of
implementation led to inconsistencies in the reporting of the figures for jobs created and
it is only comparatively recently that this has been rectified, but there is still a question-
mark over how far all those involved in implementing projects understand and follow
the new guidelines.
In Greece, explicit guidelines defining the indicator and data collection methods were
formally adopted in 2009, but the evidence from the data reported suggest that these
were either not understood or not respected except for large projects for which impact
assessments are undertaken.
In the Czech Republic, the definition of the indicator used differed between OPs at the
beginning of the period and although a common definition was agreed and adopted in
2009, some MAs have continued to use their own specific definitions as well.
In Italy, the Commission’s guidelines were adopted by MAs as the reference for the
indicator after they were published in 2009, but since they are not binding, they have
not been universally applied in practice and there is little consistency in the data
reported.
In Lithuania, the revision of the definition and of the data collection methods in the
course of the programming period has led to the indicator being calculated differently
for projects under different calls for proposals, so that the cumulative figures reported
for jobs created lack consistency.
Job creation as an indicator of outcomes in ERDF programmes EvalNet Synthesis Report, 2013
8
In only a few countries are specific efforts made to ensure consistency of the definition of the
indicator and the data reported across OPs. In Austria, there is a control system to check that his
is the case, and in Slovakia, the central coordinating authority provides guidance and advice on
how the indicator should be defined. In many cases, however (in France, Portugal, the UK,
Finland, Poland, the Czech Republic, Hungary and Bulgaria), despite all MAs in principle
adopting the same definition and methods of data collection, there are some differences in the
data reported in practice.
In a number of countries, the lack of consistency makes it difficult if not impossible to aggregate
figures across regions to produce a national total for jobs created. This is particularly the case in
Lithuania, where the coverage of the indicator varies between MAs, policy areas and even
between measures in the same policy area managed by the same MA. In Luxembourg too, there
is no common way of collecting data and different methods are used in the same OP so that
adding the figures together to produce a national total is problematic.
In Italy, the lack of documentation on the indicator and the methods used to collect data means
that it is not possible to gauge the degree of consistency across regions in the figures reported.
In Poland, the rules for collecting and reporting data on jobs created by EU-supported projects
are both clear and applied by all MAs, but the lack of a common method of identifying the jobs
concerned other than the permanent ones resulting directly from the intervention makes it
impossible to calculate the overall number of jobs created. Consequently, the number reported
is an under-estimate.
In Belgium and Germany, aggregation of job creation figures across regions is made difficult by
each MA developing its own definition and method of data collection. In both countries, there is
virtually no coordination at national level and no common understanding has emerged. In
Germany, there is some de facto coordination only in respect of investment grants because of
ERDF support being combined with the ‘Joint Task’. For other measures, the Länder often
delegate responsibility for collecting and reporting data, which can mean that even MAs do not
have a detailed knowledge of how the indicator is defined. Only in few Länder (Sachsen-Anhalt
and Berlin are the main examples) are the definition and methods set out in handbooks or
guidance documents.
In most countries, ensuring consistency of the data is complicated by the fact that the
implementation of ERDF programmes is decentralised and data are collected from individual
projects, often by intermediaries, either from project reports (as in Italy, Spain, Portugal,
Sweden, Flanders in Belgium and Slovakia) or through annual surveys (as in Ireland7). Final
beneficiaries may also enter figures directly into the monitoring systems (as in Italy) or simply
‘communicate’ data to MAs (as in France).
The timing of reporting data also varies between countries. In some cases, it is done on an on-
going basis (as in Austria, Bulgaria and Poland), in others only once a year (as in Ireland and the
Brussels and Flemish regions in Belgium). In Finland, figures on jobs created are updated every
time a payment application is made, while in Italy, Spain and Portugal, beneficiaries are obliged
to quantify the number of jobs created only in the final report on a project. In Slovakia too,
7 Though here there are problems with the method used and, in particular, the assumptions that all additional jobs in firms receiving support can be attributed to that support.

Job creation as an indicator of outcomes in ERDF programmes EvalNet Synthesis Report, 2013
9
figures are reported only when a project has finished. In Latvia, the timing of reporting varies
between types of intervention. For high-value added investments, they are counted and
reported when the project is completed, while for business incubators, summary reports are
prepared every quarter and jobs created are cumulated at the end of the year.
In Finland, actual figures for jobs created by the FEIs managed by Finnvera, a State-owned
financing company, are not reported at all but only planned figures, since the company has no
interest in actual outcomes in this respect.
Content of data
The guidelines published by the Commission on the data to be reported for jobs created specify
that the data should be adjusted to a full-time equivalent basis (FTE); that they should
distinguish temporary jobs from permanent ones; that only actual jobs and not planned or
expected ones should be counted; that jobs involved purely in the construction phase of projects
should not be included and that only direct jobs should be taken into account and not those
which result indirectly from interventions; on the core indicator for jobs created. In practice, the
data reported comply with these guidelines in most cases but certainly not all.
It is also evident that efforts to avoid double-counting of jobs are limited in many cases, that for
the most part little effort is made to take account of the quality of the jobs created and in a
number of cases, jobs maintained or safeguarded are included with those created with no
distinction between the two. In some cases too, the jobs reported as being created as a result of
ERDF support might also be supported by the ESF, giving rise to the possibility of the jobs
created by the Structural Funds as a whole.
The main features of the content of the data for jobs created which are reported are
summarised below (see Annex Table 1 for more details):
In nearly all cases, jobs are either reported in FTE terms or only full-time jobs are
counted. The latter is especially so in EU12 countries, where part-time working tends to
account for only a small proportion of employment so that relatively few jobs are missed
by leaving them out of account. The exceptions are Sachsen in Germany, some OPs in
Greece and most OPs in Slovenia, where in each case the simple number of jobs are
counted. This was initially the case for OPs in Lithuania as well.
In around half the countries, no distinction is made between permanent and temporary
jobs. In some cases, this is deliberate. In France, for example, it is not considered
meaningful since temporary jobs are often renewed when fixed-term contracts come to
an end. In Sweden, most jobs start off being temporary and are then converted to
permanent ones after a period. Where a distinction is made, this is done in varying ways.
In some countries, only jobs which are expected to last for more than a minimum period
are reported, the minimum ranging from 5 years in Finland to one year in the UK and
just 9 months in Ireland. In others, such as Germany, or Hungary, reporting is confined
to jobs with permanent, or long-term, contracts of employment.
In nearly all cases, jobs created in construction are not included in the figures reported,
but they are included without distinguishing them in Ireland, the Brussels region and

Job creation as an indicator of outcomes in ERDF programmes EvalNet Synthesis Report, 2013
10
Luxembourg. They are also included in Greece, where they are converted to FTE terms if
they last for less than a year.
In most cases too, the jobs reported are actual rather than expected ones, though there
are some OPs where the status of the jobs reported is unclear (such as in Cyprus) or no
clear distinction is made (such as in some regions in France). There are also others
where expected jobs are reported because of a lack of data on actual jobs (such as some
regions in Germany and the Flemish region of Belgium before projects are completed
and are still underway).
In the large majority of cases, only jobs directly created are counted, but there are some
cases where those created indirectly are also included, such as in Luxembourg, 7 regions
in France, some regions in Italy and possibly the UK, in Belgium (though limited to
around 5% of the total in the Walloon region), and jobs resulting from investment in
infrastructure in Germany and from business infrastructure in Romania.
In many cases, little or no effort is made to avoid double-counting of the jobs which are
reported, though for many of the MAs concerned it is not regarded as likely to be a
serious problem because relatively few beneficiaries receive more than one source of
funding. In a number of Member States, however, checks have been put in place to avoid
double-counting, such as through a monitoring system to record beneficiaries as in
Austria or Slovenia or, more rigorously, by collecting details of the employees taken on,
as in Romania and Slovenia again.
In hardly any case is the quality of jobs created monitored or reported, though the
number of jobs in research gives some guide and in a few cases, details are collected of
the characteristics of the people employed (as in the Brussels region) or of the
qualifications needed (as in some regions in France).
In most cases, the data reported for jobs created do not include jobs maintained or
safeguarded as a result of interventions, but in some cases they do and the jobs
concerned are not separately distinguished. This applies to the figures reported for
Greece, Italy, Estonia, the Flemish region of Belgium, two regions in Germany, three in
France and some enterprise support measures in Lithuania.
In general, the jobs created by the ERDF which are reported do not include those also
supported by the ESF to any significant extent, though in some cases, it is not entirely
clear that this is so because no checks are made to verify that the projects co-financed by
the ERDF are not receiving financing from the ESF as well.
The above divergences from the guidelines mean that there is a significant lack of comparability
between the figures reported which adds to the differences in the coverage of the indicator
noted above and makes aggregating them across countries, or even in some cases across OPs
within countries, extremely problematic.
Job creation as an indicator of outcomes in ERDF programmes EvalNet Synthesis Report, 2013
11
Aggregation of jobs created across OPs
In a number of Member States, but by no means all, jobs created as a result of ERFD support are
summed across OPs, where there is more than one8, to calculate a national total. This is the case
in the Czech Republic, Austria and Finland, as well as in France – despite the differences in the
content of the data noted above - where the calculation is carried out by DATAR which also
undertakes plausibility and reliability checks. In Poland, national aggregates are obtained from
the national information system for monitoring and control.
When the data are more widely used at national level, they tend to be checked by the national
authority responsible for the monitoring system, as well as by the authorities managing OPs. In
the UK, however, while data are summed across OPs to produce a national running total, if only
as a broad guide to outcomes, there are no rigorous checks to ensure data consistency.
In other countries, the data for individual OPs can ‘technically’ be aggregated to produce a
national total from the information system in place, but this is not done in most cases other than
for reporting to the Commission (as in Hungary, Latvia, Germany and Portugal). In most
countries too, only limited, if any, checks are made to ensure that the data are consistently
defined and measured and, therefore, capable of being summed to produce a meaningful total.
In a number of countries (such as the Netherlands and Sweden), data are not aggregated across
OPs at all even for reporting purposes. In Germany and Belgium, there is no real interest in
doing so because of the Federal structure of the country and the responsibility for regional
policy being vested in the regions. In Spain, the central authority sums the data from the
information system across beneficiaries and intermediate bodies to calculate the number of jobs
created in the different ERDF programmes, but does not then aggregate these to produce a
national total.
Whatever the extent of aggregation in Member States, it is evident from the above that the
differences in the way in which the indicator is defined in practice and jobs created are
measured, as well as the variations in the extent to which it is applied to interventions, make it
difficult to interpret the figures which are reported at all levels. It is hard to judge whether these
figures are over-estimates of the gross jobs created as a result of ERDF-supported interventions
– because, for example, they include jobs safeguarded as well as created or involve double-
counting – or under-estimated, because, for example, they cover only certain measures.
Estimates of jobs created up to end-2011
The number of job which are reported in the AIRs to have been created up to the end of 2011 in
each country as a direct result of ERDF support are set out in Table 2 together with a
breakdown by area and, where available, the national expert’s adjustment of the reported
figures to exclude jobs in construction, safeguarded jobs and jobs indirectly created. In practice,
this was not always possible because of a lack of information on the jobs concerned, such as in
Greece or Cyprus. Overall, after adjustment, the total number of jobs created as a direct result of
the expenditure co-financed by the ERDF amounted to just under 395,000 at the end of 2011
(though in the Czech Republic and Malta, the figures relate to end-2012).
8 That is other than in countries like Cyprus, Malta and Luxembourg.

Job creation as an indicator of outcomes in ERDF programmes EvalNet Synthesis Report, 2013
12
Table 2 Estimates of gross jobs directly created in Member States from ERDF up to end-2011
Jobs reported in AIRs (incl non-
core) (1)
Jobs reported in SFC2007 (2) Core indicators end-2011 in AIRs (1) (3)
Adjusted direct gross FTE jobs
created (4) no. 1 no. 6 no. 9 no. 35
Total jobs created
Research jobs
FTE jobs in SMEs
Jobs in tourism
AT 3,284 3,143 3,143 141 3,284
BE 15,174 15,174 15,174 343 3,061 138 7,016
BG 1,399 756 1,399 0
1,399
CY 1,641 1,641 1,310 331
1,641
CZ 21,470 9,188 21,470 3,056
1,260 20,000
DE 76,803 43,462 46,039 674 29,053 928 37,500
EE 3,759 3,759 3,759 12
3,759
ES 46,538 40,743
46,538
41,774
FI 15,468 15,472 15,472 1,625 15,472 682 15,472
FR 25,002 19,068 25,002 771 7,244
28,501
GR 12,408 11,881
6 11,875
12,494
HU 31,343 17,650 31,343 1,922
2,791 31,343
IE 40,614 34,431
806 39,808
31,658
IT 44,361 43,647 10,946 1,318 7,109 707 12,370
LT 553 508 508 133
86 530
LU 113 113 113 63
90
LV 2,628 - 1,638 0 1,638
1,638
MT 109 - 189 87 189 1 109
NL 6,499 7,586 6,499
6,499
PL 32,321 31,233 32,321 2,487 32,321 1,901 45,700
PT 1,210 1,210 1,210 0 337 53 1,210
RO 4,360 4,360 4,360 611 1,593 84 4,174
SE 27,212 27,212 27,212 164
27,212
SI 2,154 1,543 1,543
611 2,154
SK 1,432 1,432 1,432
1,102 340 1,432
UK 55,480 48,011 48,889 2,593 14,510 171 55,480
EU27 473,335 383,223 300,970 17,142 211,850 9,753 394,439
Notes: based on National reports (1) Number of jobs created as reported in AIRs summed to national totals. Totals may not be meaningful since figures for
different measures may be defined differently and measures included may be more or less relevant.
(2) The total number of job created as recorded in the European Commission SFC2007 system might be the figure for core indicator no.1 or no.9 reported in the AIR or a combination (e.g. sum) of the four core indicators on jobs. For a few programmes the numbers in the SFC2007 system are different from those in the AIRs. See Annex 3 for details. (3) Definitions (source: DG Regional Policy, Working Document No. 7, “Indicative guidelines on evaluation methods: Reporting on core indicators for the ERDF and the Cohesion Fund, 2007-2013”)
(4) Excluding indirect, safeguarded and construction jobs as well as expected rather than actual jobs, as estimated by experts
BE: Adjusted figures exclude indirect+maintained jobs for Flemish OP and indirect+contstruction jobs for Brussels OP
CY: Expected jobs not distinguished from actual jobs in data reported.
CZ: No data available at end-2011. Figures refer to end-2012.
DE: No. 9 is the most reliable figure as it relates to similar measures as Joint Task. 35-40,000 is expert's best estimate of total.
EE: Maintained jobs may be included. Insufficient information to adjust figures reported.
ES: Main adjustment is removal of 4,764 jobs wrongly reported in Castilla La Mancha AIR
FI: In addition, there are 9,417 planned jobs to be created by Finnvera (FEI).
FR: Indirect+safguraded jobs included in some OPs. Big difference between data in AIRs and SFC2007.
GR: Safeguarded jobs may be included. Jobs during implementation of projects are included as temporary.
HU: Big difference between data in AIRs and SFC2007.
IE: Mix-up of concepts in data reported in regional OPs so aggregation not meaningful.
IT: Main adjustment: exclusion of 32,997 reported jobs in Puglia, estimates rather than actual.
LT: Figures adjusted to exclude maintained jobs reported for some measures supporting SMEs.
LU: Figures adjusted to exclude construction jobs.
LV: Safeguarded jobs included.
MT: No data available at end-2011. Figures refer to end-2012.
PL: Estimated total after adjusting for under-reporting of jobs in R&D and tourism.
RO: Figures adjusted by converting research jobs to FTE.
UK: Main adjustment: Inclusion of jobs created in addition to those reported as core indicators
Job creation as an indicator of outcomes in ERDF programmes EvalNet Synthesis Report, 2013
13
For a number of countries, the experts expressed doubts about the reliability of the figures
reported not only because jobs are more widely defined than specified by the guidelines but
also because of the limited checks made on the data reported by those responsible for projects.
This was the case in France, where efforts have been made to improve the reliability of the
figures (by DATAR, the central authority responsible for regional development), but
concentrated on the method used for calculating the data rather than on checking the reliability
of the figures reported by beneficiaries. On the other hand, there are many countries,, such as
Spain, where systematic checks are carried out on the figures received from the various projects
to verify their accuracy.
Because of the differences in the way that the indicator is defined in practice and data are
collected, many of the figures cannot meaningfully be compared with those for other counties.
An extreme case is Ireland, where the number of jobs reported to have created as a result of
ERDF-financed interventions is very much larger than elsewhere in relation to the expenditure
involved, but where a much more generous interpretation than elsewhere of the link between
the support provided and additional jobs has been adopted. (Essentially any additional jobs
created in firms supported are treated as being a result of the support.)
Use of jobs created as an indicator of national programme outcomes
The indicator of jobs created is used in a number of countries to measure the outcome of
interventions funded by national programmes as well as those co-financed by the ERDF. This is
especially so if creating jobs is a requirement for obtaining support, as is the case as regards the
Joint Task in Germany and investment grants in Belgium. In the latter, for example, jobs created
is commonly used to assess outcomes of long term development strategies such as the ‘Flanders
in Action Plan’ or the ‘Marshall Plan 2.Geen’ in the Walloon region.
In the UK, jobs created is widely applied as an indicator of the achievements of national
measures and has been for many years. At present, it is being used to monitor the National
Enterprise Zone and Regional Growth Fund in England and by the devolved administrations in
Wales, Scotland and Northern Ireland to monitor their development programmes.
In France, the indicator is used to measure the jobs created by the Contrats de Projets Etat-
Région (CPER) – the programme of development projects jointly planned and financed by the
central government and the regions.
In Slovakia, the indicator is used in programmes providing state aid to foreign direct
investments since job creation is a major aim.
In Sweden, it is used in national programmes explicitly aimed at creating new jobs, though these
are small compared to ERDF co-financed programmes.
In Finland, it is used to measure the performance of the Centre of Expertise Programme, one of
the main aims of which is to create jobs requiring a high level of skills.
On the other hand, there are no wholly nationally-funded programmes using jobs created as an
indicator in many EU12 countries - Poland, the Czech Republic, Hungary, Estonia, Latvia and
Malta – as well as in Greece, in part because such programmes, if they exist at all, are small in
relation to ERDF-financed ones.
Job creation as an indicator of outcomes in ERDF programmes EvalNet Synthesis Report, 2013
14
4. Cost per job created The number of jobs created as a result of ERDF-financed interventions, even if correctly and
consistently measured, in themselves are difficult to assess as a measure of policy performance
if they are not related to the expenditure involved in creating them. It is of some relevance,
therefore, to know whether, say, 10,000 jobs were created with expenditure of EUR 1 billion or
EUR 10 billion. This assumes, of course, that creating jobs is a primary objective of the
expenditure concerned, which in itself limits the extent to which such an exercise can be
meaningfully undertaken in respect of the ERDF in the present programming period. As
indicated above, therefore, job creation is a central aim only for a small number of interventions
– arguably many fewer than the cases in which it is used as an indicator.
The analysis carried out in the national reports demonstrates this forcibly. The wide variation in
the average cost per job created which is calculated in the reports stems from differences in the
types of measure concerned as well as in the objectives even in respect of measures which seem
similar. The differences, however, also stem from the differing extents to which it was possible,
from the data available, to confine the calculations to narrowly defined measures for which job
creation was the central aim, as well as from differences in the degree to which the data covered
all of the expenditure entailed.
Even leaving aside support for investment in infrastructure, for which the direct creation of jobs
is not be a major aim, and focusing on enterprise support alone, the estimates of average cost
per job vary from almost EUR 300,000 in Germany to only around EUR 12,400 in Lithuania (see
Annex 2). This in itself does not necessarily mean that the measure concerned in the latter is
over 20 times more cost effective in increasing employment than the measure in the former,
since it leaves out of account the jobs which may be indirectly created as well as the longer-term
effects. Few measures, therefore, can be meaningfully assessed by the jobs created indicator
alone. To obtain a complete picture, account needs to be taken of the wider effects of
interventions on, in particular, the competitiveness of firms and the development potential of
regions, which are likely to be more important objectives of ERDF support.
5. Estimates of net jobs created The gross jobs reported above are based on the (implicit) assumption that the additional jobs
associated with an intervention would not have been created in the absence of the support
involved9. There is, accordingly, no allowance for ‘deadweight’ effects – for the possibility that
some, or even all, of the additional jobs would have been created in any case even without the
support received. In addition, they take no account of the repercussions of the support given to
the enterprises receiving funding on other enterprises, which could well suffer a loss of market
share as a result, giving rise perhaps to a reduction in the people they employ. Equally, while,
therefore, the fact that indirect effects are not taken into account tends to understate the jobs
created as a result of ERDF financing, measuring jobs in gross rather than net terms tends to
overstate the overall effect on employment.
9 According to the Commission guidelines, the jobs reported should relate to ‘new working position(s) created… as a direct result of project completion’ (‘Indicative Guidelines on Core Indicators’, Working Document, No.7, Programming period 2007-2013, p. 9, authors’ bolding). It is not specified, therefore, that the jobs in question should be limited to those that are due to the funding provided, though to do so would inevitably raise problems of estimation.
Job creation as an indicator of outcomes in ERDF programmes EvalNet Synthesis Report, 2013
15
Estimating the overall net effect of interventions, however, is far from straight-forward since it
involves trying to identify what would have happened to employment if the interventions had
not occurred – or, in other words, carrying out some kind of counterfactual analysis. Such an
analysis is further complicated by the need to take account of the spatial objectives of the ERDF,
that the support provided is specifically aimed at strengthening the development potential of
problem regions, in part through increasing the competitiveness of the enterprises located there
and, therefore, their market shares. Accordingly, where any employment losses occur as a result
of interventions, whether in the region concerned or outside, whether in the EU or in the rest of
the world, is of some relevance.
Attempts to estimate the net effects on employment of ERDF support have been made in only
around a third of Member States, in most cases as part of evaluations of specific programmes or
measures, usually relating to enterprise support. In other cases, estimates have been generated
of the overall impact on jobs of Cohesion policy funding over the programming period by using
macroeconomic models. The estimates produced may be referred to in AIRs in the countries
concerned, though rarely if ever elaborated on. In the great majority of cases, however, the
issue, and the fact that it represents an important qualification to the figures for gross jobs
created which are reported, is not mentioned.
Only a few national reports, therefore, refer to efforts to estimate the net employment effects of
interventions:
In Germany, evaluations relating to the Joint Task have regularly tried to assess its effect
on employment using different methods, and a few studies have also focused on the
ERDF contribution. In addition, a number of studies have attempted to estimate the
overall employment effect of OPs using the HERMIN macroeconomic model.
In Finland, the ‘deadweight’ effects of enterprise support have been estimated by
various methods, while a number of counterfactual studies of the effect of such support
on growth and employment have been based on a large panel dataset for firms
constructed by Statistics Finland.
In Estonia, the Mid-term evaluation carried out in 2011 attempted to estimate the net
employment impact of all OPs. In addition, the National Audit Office has undertaken an
impact assessment of enterprise support measures using counterfactual methods as
well as surveys, while the Ministry of Economic Affairs and Communications used
qualitative as well as quantitative methods in its Evaluation of Enterprise and
Innovation Policy10.
In Cyprus, the Mid-term evaluation put special emphasis on estimating real job creation
through detailed investigation of the data and surveys.
In Latvia, net jobs created as a result of EU support over the period 2007-2013 were
estimated in 2011 by the Stockholm School of Economics in Riga by means of
macroeconomic model simulations; these showed a net gain to employment of around
10 Jaaksoo, K., Kitsing, M., Lember, K., Rebane, T. 2012. Mid-term evaluation of Enterprise and Innovation Policy (Ettevõtlus- ja innovatsioonipoliitika vahehindamine). http://www.mkm.ee/public/Ettevotlustoetuste_loppraport.pdf

Job creation as an indicator of outcomes in ERDF programmes EvalNet Synthesis Report, 2013
16
2.5% at its peak in 2012 (slightly smaller than the average amount of funding received
relative to GDP). The findings were partly reported in the 2011 AIR.
In Lithuania, econometric modelling have also been used to estimate net employment
gains at the macro-level, while counterfactual analysis has been undertaken to estimate
jobs created at project or measure level.
In Italy, a counterfactual evaluation of the effect of all forms of enterprise support going
to the craft sector in Piemonte, carried out for the period 2008-2009, estimated that
3,200 to 4,300 additional jobs were created at an average cost per job of EUR 10,130 to
EUR 13,070.
6. The proposed indicator of jobs created in the 2014-2020 period The national experts were asked to assess how far MAs were familiar with the proposed new
definition of the common indicator for jobs created for the 2014-2020 programming period. The
officials interviewed were, therefore, questioned on whether they had read the relevant
Commission document and had participated in meetings and discussions on it. The only
countries where officials professed to not being familiar with the definition were Bulgaria, the
Czech Republic and Portugal, though in Romania, there was some variation in response between
those surveyed. In Lithuania, it was reported that while MAs are familiar with the definition,
they do not have a clear understanding of it or how it should be applied in practice.
The proposed common indicator of jobs created for 2014-2020
Employment increase in supported enterprises – Gross new working positions in supported
enterprises in full time equivalents (FTE)
Essentially a 'before-after' indicator which captures the part of the employment increase that is (a) direct
consequence of project completion (workers employed to implement the project are not counted). The
positions needs to be filled (vacant posts are not counted) and increase the total number of jobs in the
enterprise. If total employment in the enterprise does not increase, the value is zero – it is regarded as
realignment, not increase. Safeguarded etc. jobs are not included.
Gross: Not counting the origin of the jobholder as long as it directly contributes to the increase of total
jobs in the organisation. The indicator should be used if the employment increase can plausibly be
attributed to the support.
Full-time equivalent: Jobs can be full time, part time or seasonal. Seasonal and part time jobs are to be
converted to FTE using ILO/statistical/other standards.
Durability: Jobs are expected to be permanent, i.e. last for a reasonably long period depending on
industrial-technological characteristics; seasonal jobs should be recurring. Figures of enterprises that
went bankrupt are registered as a zero employment increase.
Timing: Data is collected before the project starts and after it finishes; MAs are free to specify the exact
timing. Using average employment, based on 6 months or a year, is preferred to employment figures on
certain dates.
Guidance Document on Monitoring and Evaluation – ERDF and Cohesion Fund, Concepts and Recommendations, Programming Period 2014-2020, European Commission, April 2013. Annex 1
Monitoring systems need to be improved with systematic quality checks in order to
ensure that data collected are reliable and there needs to be effective coordination
between regional authorities, and MAs generally, to ensure that the data reported are
Job creation as an indicator of outcomes in ERDF programmes EvalNet Synthesis Report, 2013
17
consistent and comparable. The Commission should provide guidelines, spelling out the
frequency of checks, the methods for carrying them out and so on.
Some of the concepts used in the Guidelines, such as the ‘durability’ of jobs or the
definition of SMEs, need to be clarified to ensure that they are interpreted consistently
across OPs. There is also a need to make clearer how jobs which are a direct result of
projects should be distinguished.
There is equally a need to ensure that not only MAs but also implementing bodies and
beneficiaries, which are responsible for providing the data, are familiar with the new
requirements and have the same understanding of them.
In the German report, it is noted that focusing interventions too much on the immediate
creation of jobs runs the risk of supporting less productive and uncompetitive firms,
leading to an inefficient use of resources. It was suggested accordingly that ‘jobs created’
should be clearly distinguished from ‘employment effects’ of programmes. Similarly, the
view is expressed in a few other reports that there is a need to recognise that the
primary aim of ERDF support to enterprises, and even more to RTDI, is not to create
jobs as such but to improve competitiveness and to bring about structural change.
In the report for Malta, it is emphasised that the quality of jobs created should not be
ignored in the reporting system, given that it is an aim of EU policy to improve the
quality as well as quantity of jobs.
In a number of cases (in Spain, Greece, Estonia and Latvia), it is considered that the
proposal, if implemented effectively, is likely to impose a greater administrative burden
on recipients of funding as well as on MAs.
7. Concluding remarks When the current programmes were planned in 2006–2007, job creation was not a major aim of
policy and, accordingly, an indicator of this was not in many cases considered a useful measure
of performance. The adoption of the indicator was, therefore, largely in response to Commission
demands. The situation has changed over the intervening period because of the crisis and the
sharp increase in unemployment which has accompanied it. However, although there has been
an almost universal shift in policy priorities across the EU towards increasing employment, the
number of jobs created has not in general been more widely adopted as an indicator.
This is understandable given that creating jobs directly is rarely a primary aim of ERDF co-
financed interventions which tend to be directed at strengthening the development potential of
regions through helping to bring about structural change and increasing the competitiveness of
the enterprises located there. While an important part of the objective of such a focus is to
create the conditions for sustainable job creation over the long-term, it may not necessarily
boost employment in the short-term. Indeed, it could well be the case that even enterprise
support measures lead to employment declining for a time as a result of their effect in
increasing the efficiency of firms and shifting economic activity towards higher-value-added
areas.
Job creation as an indicator of outcomes in ERDF programmes EvalNet Synthesis Report, 2013
18
The number of jobs created directly by ERDF support, therefore, gives only a very partial
indication of the employment effects of the funding concerned and is liable to be a highly
misleading guide to the way support should be allocated if the priority is to increase
employment. As the indicator is at present defined and reported, this applies even in the short-
term given that it measures jobs in gross rather than net terms, that jobs in the implementation
of projects (such as in construction in particular) are excluded and that jobs created indirectly
(such as through the boost in demand to supplying firms or to the regional economy more
generally) are not taken into account.
There are good reasons for the present definition. Calculating both the net effect of
interventions – i.e. allowing for displacement and deadweight effects - and their indirect effects
involves a good deal of estimation and is time-consuming. Figures for gross jobs directly
attributable to support can, therefore, be produced much more quickly and with considerably
less effort to give at least an indication of the initial effect on employment.
In addition, defining the indicator to exclude jobs created in construction omits employment
which is inevitably temporary, lasting only so long as projects are being implemented.
Moreover, while increasing support for infrastructure projects may be a means of providing
employment for construction workers – as was the case in many countries as a response to the
recession in 2009 – such projects need to be decided and assessed in terms of their contribution
to, say, improving transport links or energy efficiency rather than the number of people they
employ11. Indeed, the additional projects undertaken during the recession had in the main
already been decided and were simply brought forward to give a boost to the economy and
employment.
However, while the definition and use of the indicator can be defended, the way that it is applied
in practice is more open to criticism as described above. The data for gross jobs at present
reported, therefore, are subject to serious problems of interpretation and comparability which
stem from:
significant variations between both OPs and Member States in the extent to which gross
jobs directly created is used as an indicator of outcomes, which means that differences
in the figures reported are as likely to stem from variations in the measures covered as
from differences in performance in actually creating jobs;
the failure to apply in OPs the definition of the indicator as specified in the Guidelines, so
that temporary as well as long-term jobs, jobs in construction and jobs created indirectly
are included in a number of cases in the figures reported, as are jobs which have been
safeguarded rather than created;
the failure in some cases to distinguish properly the jobs which are directly linked to
ERDF support which tends to mean that the figures reported overstate the true numbers
(the most extreme example being Ireland where all jobs created in enterprises receiving
support are attributed to it irrespective of whether they are a direct result or not);
11 If job creation were the ultimate end, then employment could be increased simply by reducing the amount of machinery used and reverting to old technology.
Job creation as an indicator of outcomes in ERDF programmes EvalNet Synthesis Report, 2013
19
the lack of coordination or cooperation between managing authorities in a number of
countries which means that the data collected are not on the same basis and therefore
cannot meaningfully be summed to produce a national total;
the highly variable extent of checking and verification of the data collected both by
individual managing authorities and centrally which means that some of the figures
reported are more uncertain than others, which adds to the difficulty of comparing
across countries.
These deficiencies raise a major question-mark over the usefulness of the indicator as it is
applied at present and give rise to serious doubts, in particular, over whether the headline
figures for the number of jobs created as result of ERDF support are at all meaningful. Certainly,
there is a need for substantial changes to be made in the next programming period to ensure
that the data reported give a reasonably reliable indication of the additional jobs which the
support provided has been directly responsible for. This means in effect:
not only defining the indicator in a clear and unambiguous way but ensuring that the
data collected conform to the definition and that common methods of identifying the
jobs created are applied in all programmes across the EU;
identifying the measures to which the indicator should be applied in all OPs so that the
data collected are on a common basis throughout the EU and relate to the same
categories of expenditure;
ensuring that effective arrangements for checking and verifying the data collected are
put in place in all Member States to help allay the doubts which surround the figures at
present. This means establishing a central system for monitoring the projects and
measures supported, combined with a database of the jobs created and of the people
filling them. Such systems have been established in a number of countries (such as
Austria) which can provide examples to others.
If the above arrangements are to be successfully put into effect and if the data reported on jobs
created are to become reliable, it is almost certainly the case that Member States and Managing
Authorities need to be persuaded of the value of the indicator and, accordingly, that it is in their
interests to ensure that the data they report are meaningful. So long as they collect the data
solely because the Commission asks them to, which applies in many cases at present, the quality
of the data is unlikely to improve as much as required.
There is a parallel need to take explicit account of other indicators as well as jobs created which
reflect longer-term, and ultimately more important objectives of policy, such as, in particular,
improving the competitiveness of businesses and strengthening the development potential of
regions so that they can sustain growth. It is equally important to extend and improve the
evaluation of the measures to which the indicator is applied in order to produce better
estimates of their overall net effect on employment, including the additional jobs they are
indirectly responsible for. This would put the figures for the gross jobs they directly create into
perspective and would help to avoid mistaken conclusions from being drawn about how the
ERDF contributes to the pursuit of employment objectives which can lead to misplaced policies
being adopted in the search for more jobs.
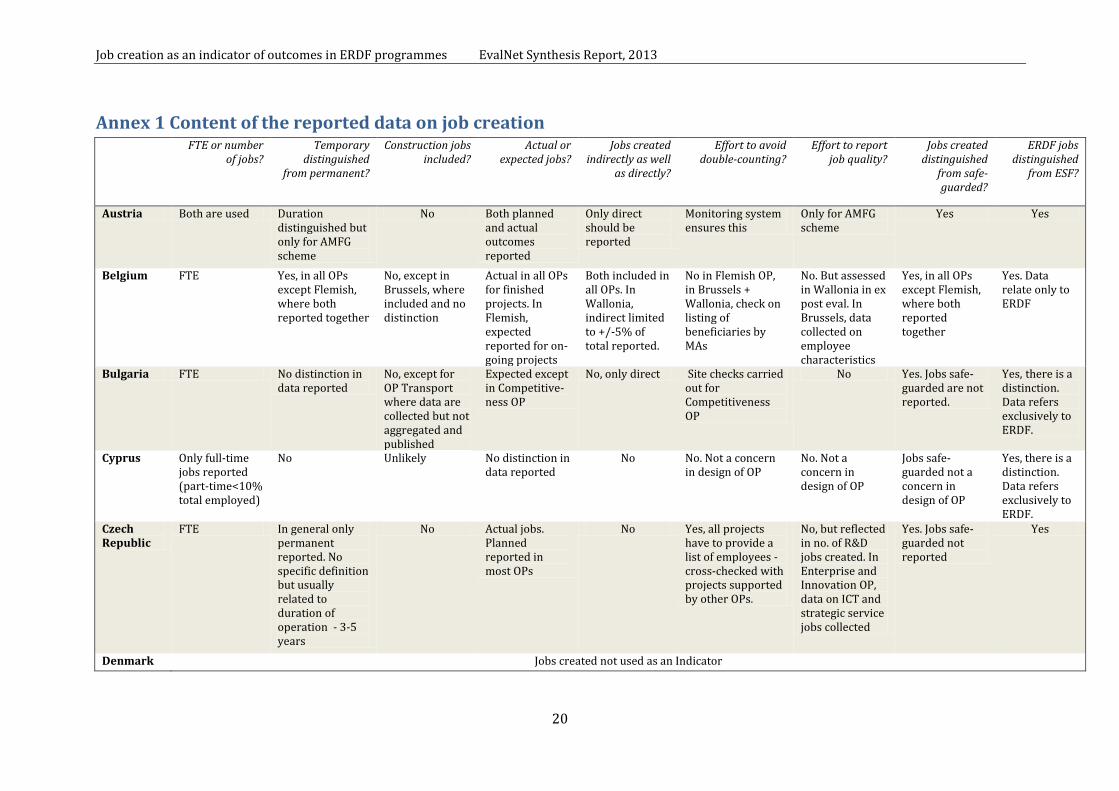
Job creation as an indicator of outcomes in ERDF programmes EvalNet Synthesis Report, 2013
20
Annex 1 Content of the reported data on job creation
FTE or number of jobs?
Temporary distinguished
from permanent?
Construction jobs included?
Actual or expected jobs?
Jobs created indirectly as well
as directly?
Effort to avoid double-counting?
Effort to report job quality?
Jobs created distinguished
from safe-guarded?
ERDF jobs distinguished
from ESF?
Austria Both are used Duration distinguished but only for AMFG scheme
No Both planned and actual outcomes reported
Only direct should be reported
Monitoring system ensures this
Only for AMFG scheme
Yes Yes
Belgium FTE Yes, in all OPs except Flemish, where both reported together
No, except in Brussels, where included and no distinction
Actual in all OPs for finished projects. In Flemish, expected reported for on-going projects
Both included in all OPs. In Wallonia, indirect limited to +/-5% of total reported.
No in Flemish OP, in Brussels + Wallonia, check on listing of beneficiaries by MAs
No. But assessed in Wallonia in ex post eval. In Brussels, data collected on employee characteristics
Yes, in all OPs except Flemish, where both reported together
Yes. Data relate only to ERDF
Bulgaria FTE No distinction in data reported
No, except for OP Transport where data are collected but not aggregated and published
Expected except in Competitive-ness OP
No, only direct Site checks carried out for Competitiveness OP
No Yes. Jobs safe-guarded are not reported.
Yes, there is a distinction. Data refers exclusively to ERDF.
Cyprus Only full-time jobs reported (part-time<10% total employed)
No Unlikely No distinction in data reported
No No. Not a concern in design of OP
No. Not a concern in design of OP
Jobs safe-guarded not a concern in design of OP
Yes, there is a distinction. Data refers exclusively to ERDF.
Czech Republic
FTE In general only permanent reported. No specific definition but usually related to duration of operation - 3-5 years
No Actual jobs. Planned reported in most OPs
No Yes, all projects have to provide a list of employees - cross-checked with projects supported by other OPs.
No, but reflected in no. of R&D jobs created. In Enterprise and Innovation OP, data on ICT and strategic service jobs collected
Yes. Jobs safe-guarded not reported
Yes
Denmark Jobs created not used as an Indicator

Job creation as an indicator of outcomes in ERDF programmes EvalNet Synthesis Report, 2013
21
FTE or number of jobs?
Temporary distinguished from
permanent?
Construction jobs included?
Actual or expected jobs?
Jobs created indirectly as well
as directly?
Effort to avoid double-
counting?
Effort to report job quality?
Jobs created distinguished
from safe-guarded?
ERDF jobs distinguished
from ESF?
Estonia Only full-time jobs reported (part-time<10% total employed)
No No Varies. Enterprise Estonia reports actual jobs. Data reported by Kredex make no distinction
No No No No, data may cover both
Yes
Finland FTE. 2 part-time or seasonal jobs counted as one
Yes. 'New jobs' are expected to continue for over 5 years
No Actual except for Finnvera (FEI), only planned jobs reported
No Some guidance given to prevent this but MAs admit there might still be some.
New R&D jobs and new women’s R&D jobs reported as well as sector of firms supported.
Yes. Jobs safe-guarded not reported
Yes
France FTE No. Official position of DATAR is that distinction makes no sense, since there are more and more fixed-term contracts
No indication that construction jobs reported. Might be included in some infrastructure projects.
Only 12 regions make distinction
7 regions report creation of indirect jobs.
No efforts reported
Some regions specify level of qualification of jobs created. 6 regions reported research jobs created.
6 regions refer to jobs maintained, half of them distinguish these, others report them together
Yes
Germany FTE in all regions except Sachsen, which counts the number of jobs
Only permanent jobs reported. Temporary jobs not mentioned. Definition='intention to maintain job without a time limit'
No Often not clearly indicated. In practice, usually actual but in a few OPs planned since data on actual not collected
Only direct for enterprises and RTDI support. For infrastructure, data relate to jobs created indirectly.
In Joint Task, avoided by linking jobs created to intervention. But may occur when a firm supported by different measures
Some indication given by R&D-jobs created
Yes, except in a few cases (Bremen, Hessen)
Yes in nearly all cases
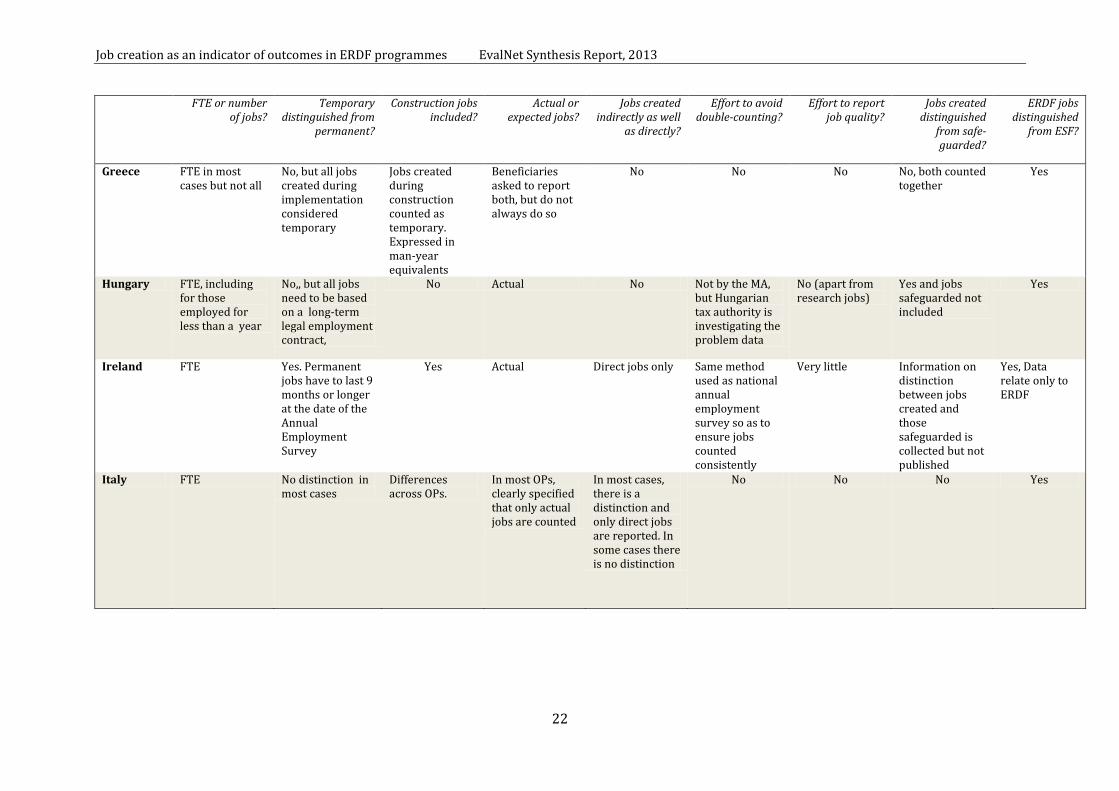
Job creation as an indicator of outcomes in ERDF programmes EvalNet Synthesis Report, 2013
22
FTE or number of jobs?
Temporary distinguished from
permanent?
Construction jobs included?
Actual or expected jobs?
Jobs created indirectly as well
as directly?
Effort to avoid double-counting?
Effort to report job quality?
Jobs created distinguished
from safe-guarded?
ERDF jobs distinguished
from ESF?
Greece FTE in most cases but not all
No, but all jobs created during implementation considered temporary
Jobs created during construction counted as temporary. Expressed in man-year equivalents
Beneficiaries asked to report both, but do not always do so
No No No No, both counted together
Yes
Hungary FTE, including for those employed for less than a year
No,, but all jobs need to be based on a long-term legal employment contract,
No Actual No Not by the MA, but Hungarian tax authority is investigating the problem data
No (apart from research jobs)
Yes and jobs safeguarded not included
Yes
Ireland FTE Yes. Permanent jobs have to last 9 months or longer at the date of the Annual Employment Survey
Yes Actual Direct jobs only Same method used as national annual employment survey so as to ensure jobs counted consistently
Very little Information on distinction between jobs created and those safeguarded is collected but not published
Yes, Data relate only to ERDF
Italy FTE No distinction in most cases
Differences across OPs.
In most OPs, clearly specified that only actual jobs are counted
In most cases, there is a distinction and only direct jobs are reported. In some cases there is no distinction
No No No Yes
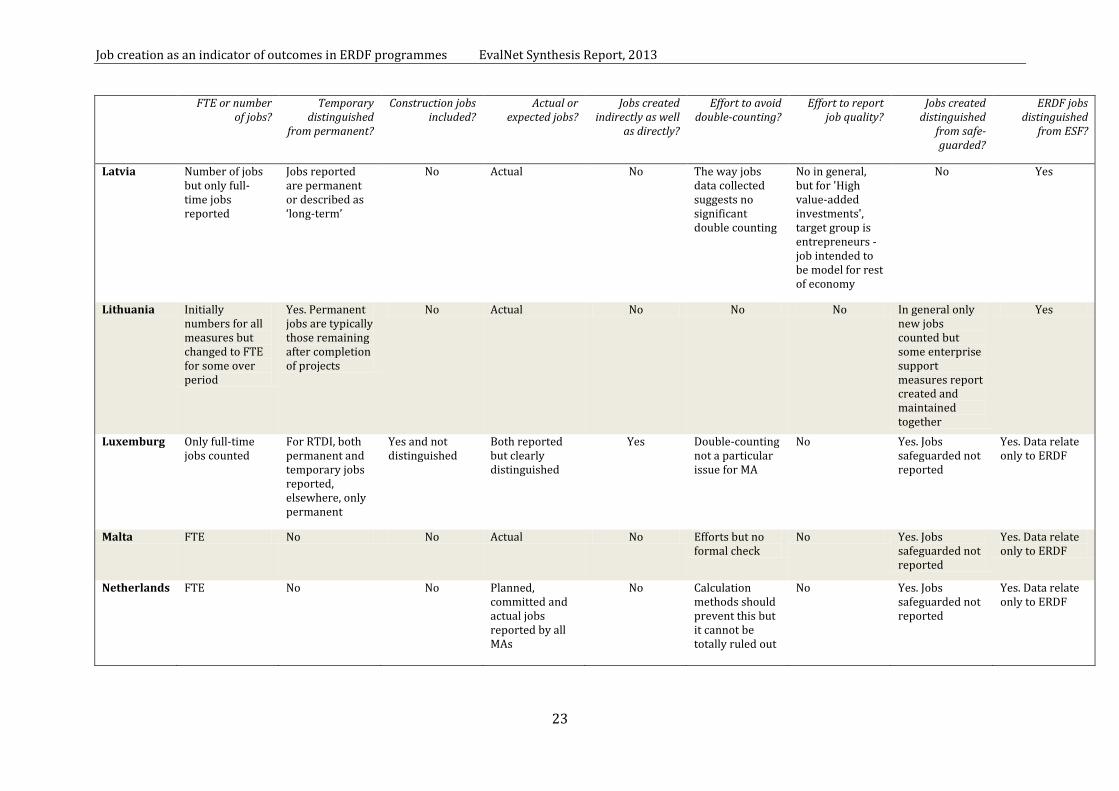
Job creation as an indicator of outcomes in ERDF programmes EvalNet Synthesis Report, 2013
23
FTE or number of jobs?
Temporary distinguished
from permanent?
Construction jobs included?
Actual or expected jobs?
Jobs created indirectly as well
as directly?
Effort to avoid double-counting?
Effort to report job quality?
Jobs created distinguished
from safe-guarded?
ERDF jobs distinguished
from ESF?
Latvia Number of jobs but only full-time jobs reported
Jobs reported are permanent or described as ‘long-term’
No Actual No The way jobs data collected suggests no significant double counting
No in general, but for 'High value-added investments', target group is entrepreneurs - job intended to be model for rest of economy
No Yes
Lithuania Initially numbers for all measures but changed to FTE for some over period
Yes. Permanent jobs are typically those remaining after completion of projects
No Actual No No No In general only new jobs counted but some enterprise support measures report created and maintained together
Yes
Luxemburg Only full-time jobs counted
For RTDI, both permanent and temporary jobs reported, elsewhere, only permanent
Yes and not distinguished
Both reported but clearly distinguished
Yes Double-counting not a particular issue for MA
No Yes. Jobs safeguarded not reported
Yes. Data relate only to ERDF
Malta FTE No No Actual No Efforts but no formal check
No Yes. Jobs safeguarded not reported
Yes. Data relate only to ERDF
Netherlands FTE No No Planned, committed and actual jobs reported by all MAs
No Calculation methods should prevent this but it cannot be totally ruled out
No Yes. Jobs safeguarded not reported
Yes. Data relate only to ERDF
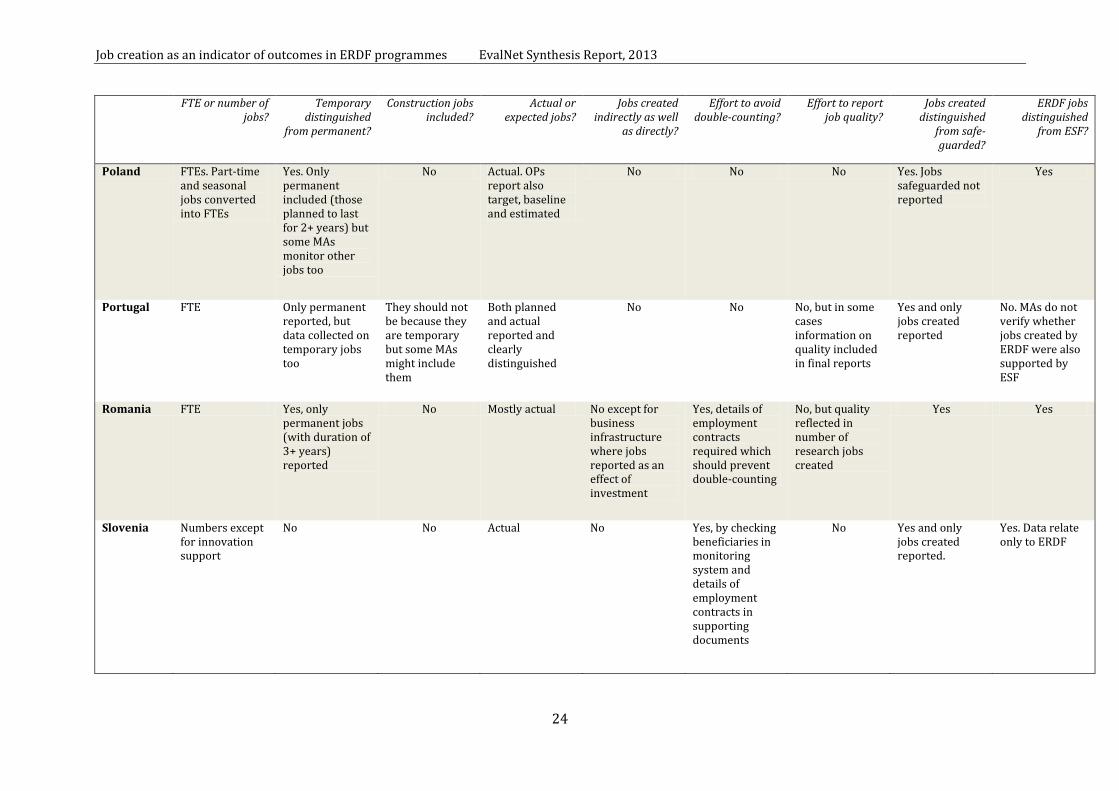
Job creation as an indicator of outcomes in ERDF programmes EvalNet Synthesis Report, 2013
24
FTE or number of jobs?
Temporary distinguished
from permanent?
Construction jobs included?
Actual or expected jobs?
Jobs created indirectly as well
as directly?
Effort to avoid double-counting?
Effort to report job quality?
Jobs created distinguished
from safe-guarded?
ERDF jobs distinguished
from ESF?
Poland FTEs. Part-time and seasonal jobs converted into FTEs
Yes. Only permanent included (those planned to last for 2+ years) but some MAs monitor other jobs too
No Actual. OPs report also target, baseline and estimated
No No No Yes. Jobs safeguarded not reported
Yes
Portugal FTE Only permanent reported, but data collected on temporary jobs too
They should not be because they are temporary but some MAs might include them
Both planned and actual reported and clearly distinguished
No No No, but in some cases information on quality included in final reports
Yes and only jobs created reported
No. MAs do not verify whether jobs created by ERDF were also supported by ESF
Romania FTE Yes, only permanent jobs (with duration of 3+ years) reported
No Mostly actual No except for business infrastructure where jobs reported as an effect of investment
Yes, details of employment contracts required which should prevent double-counting
No, but quality reflected in number of research jobs created
Yes Yes
Slovenia Numbers except for innovation support
No No Actual No Yes, by checking beneficiaries in monitoring system and details of employment contracts in supporting documents
No Yes and only jobs created reported.
Yes. Data relate only to ERDF
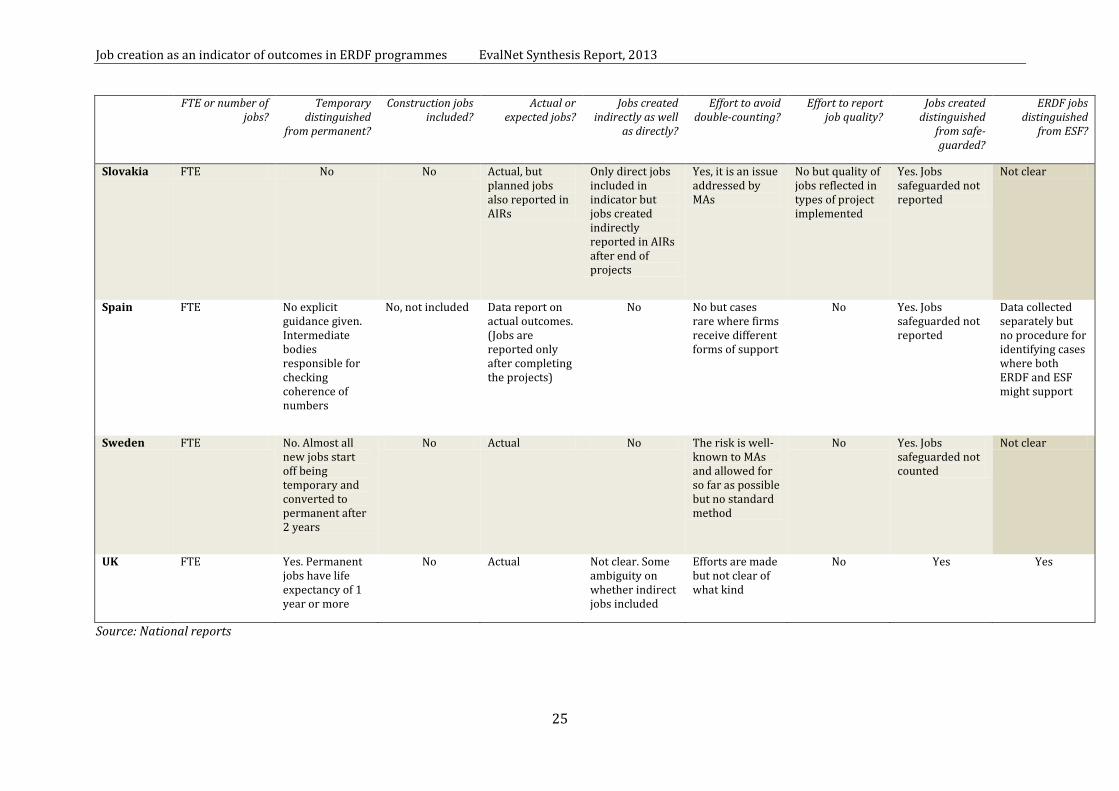
Job creation as an indicator of outcomes in ERDF programmes EvalNet Synthesis Report, 2013
25
FTE or number of jobs?
Temporary distinguished
from permanent?
Construction jobs included?
Actual or expected jobs?
Jobs created indirectly as well
as directly?
Effort to avoid double-counting?
Effort to report job quality?
Jobs created distinguished
from safe-guarded?
ERDF jobs distinguished
from ESF?
Slovakia FTE No No Actual, but planned jobs also reported in AIRs
Only direct jobs included in indicator but jobs created indirectly reported in AIRs after end of projects
Yes, it is an issue addressed by MAs
No but quality of jobs reflected in types of project implemented
Yes. Jobs safeguarded not reported
Not clear
Spain FTE No explicit guidance given. Intermediate bodies responsible for checking coherence of numbers
No, not included Data report on actual outcomes. (Jobs are reported only after completing the projects)
No No but cases rare where firms receive different forms of support
No Yes. Jobs safeguarded not reported
Data collected separately but no procedure for identifying cases where both ERDF and ESF might support
Sweden FTE No. Almost all new jobs start off being temporary and converted to permanent after 2 years
No Actual No The risk is well-known to MAs and allowed for so far as possible but no standard method
No Yes. Jobs safeguarded not counted
Not clear
UK FTE Yes. Permanent jobs have life expectancy of 1 year or more
No Actual Not clear. Some ambiguity on whether indirect jobs included
Efforts are made but not clear of what kind
No Yes Yes
Source: National reports
Job creation as an indicator of outcomes in ERDF programmes EvalNet Synthesis Report, 2013
26
Annex 2 Estimates of average cost per job created The calculations included in the national reports demonstrate forcibly the difficulties of
comparing the average expenditure involved in creating a job between both measures and
countries. This is because measures differ in their objectives, with few being aimed solely at the
short-term creation of jobs directly, and countries – and OPs – differ in terms of the degree of
detail at which date are available to do the calculations.
In some cases, therefore, instead of relating to a specific type of intervention in a particular area,
the calculation was carried out for specific categories of expenditure (as in Austria) or priority
axes (as in Sweden). While an attempt was made to cover FEIs in all countries in which they
receive support from the ERDF, since they are different in kind from other forms of
intervention, this was only possible for 8 countries. Moreover, data on the total expenditure
involved in creating jobs in particular areas, private as well as public and from national sources
of funding as well as from the ERDF, were available only in a limited number of countries. The
estimates presented in the reports, some of which are set out here, therefore, need to be
interpreted with caution, since some relate only to the public funding of expenditure and leave
out of account the private element. They, therefore, understate the total cost of creating an
additional job in the area concerned and cannot be compared with the estimates which include
all of the cost. (The two are presented in separate tables to emphasise their non-comparability.)
Additional difficulties of interpretation stem from the fact that not only is it often hard to link
jobs with expenditure, but it is frequently the case that figures for jobs created are recorded
only when projects have been completed, which means that they tend to understate the true
figures at any point in time. There can also be a time lag between the expenditure incurred and
the creation of jobs, which can equally lead to the figures reported being underestimates of the
longer-term effect on employment. This is particularly the case in respect of expenditure on
support of FEIs, where the costs might be measured at the time the support goes into the funds
concerned – which is when the ERDF is recorded as being spent – rather than when it reaches
final beneficiaries, but it may also be that the latter receive funding before hiring people.
Differences in respect of timing both of reporting and in hiring workers make for problems of
comparability as well as interpretation. Added to the other difficulties noted above, they mean
that variations in the cost per job calculated from the data available are only to be expected and
in themselves have little significance. The figures reported in the national studies do indeed
show variations which are marked, even if the comparison is confined to measures for which
jobs directly created is not only used as in indicator but is possibly an important objective of
policy (Table A.1). Even leaving aside interventions, such as support for transport or
environmental infrastructure, where the direct creation of jobs ought not to be a major aim of
the investment concerned – and even less an indicator of achievement – the average cost per
job, including both public and private funding, is calculated to vary from almost EUR 300,000 in
Germany to just under EUR 80,000 in the Netherlands and only around EUR 12,400 in Lithuania.
For interventions supporting research and RTDI, the average cost ranges from over EUR
490,000 in Germany to EUR 105,000 in Lithuania.
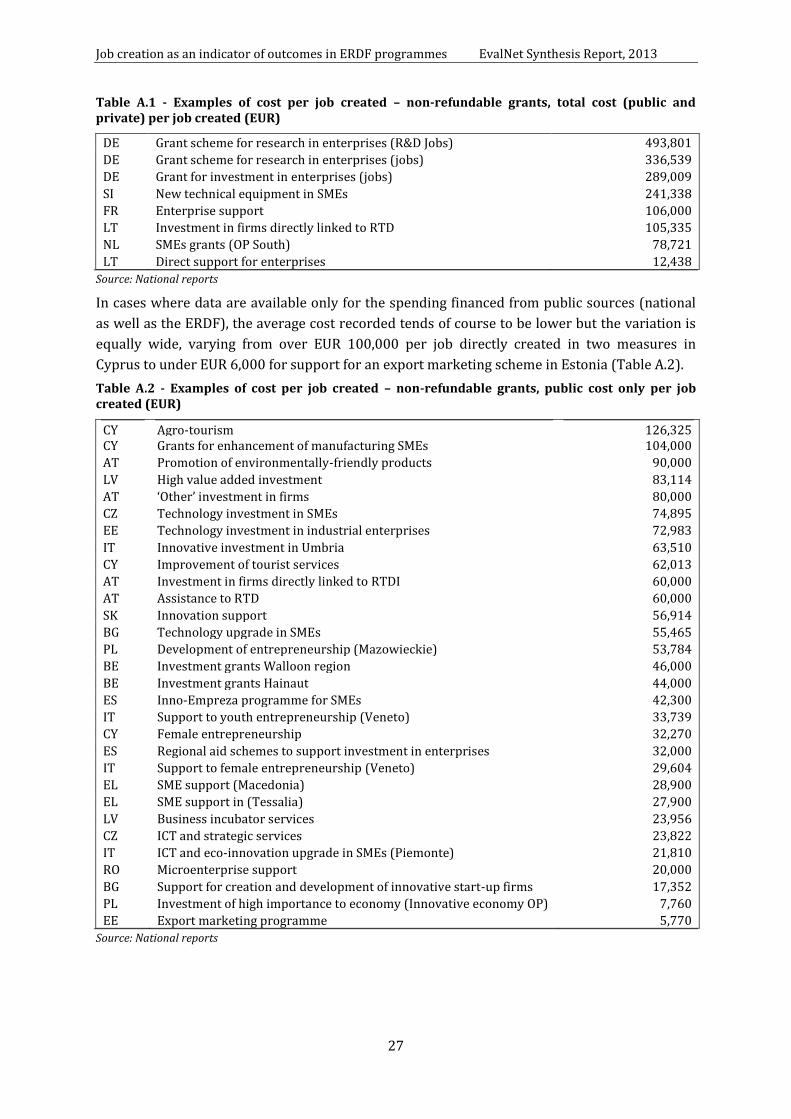
Job creation as an indicator of outcomes in ERDF programmes EvalNet Synthesis Report, 2013
27
Table A.1 - Examples of cost per job created – non-refundable grants, total cost (public and private) per job created (EUR)
DE Grant scheme for research in enterprises (R&D Jobs) 493,801
DE Grant scheme for research in enterprises (jobs) 336,539
DE Grant for investment in enterprises (jobs) 289,009
SI New technical equipment in SMEs 241,338
FR Enterprise support 106,000
LT Investment in firms directly linked to RTD 105,335
NL SMEs grants (OP South) 78,721
LT Direct support for enterprises 12,438
Source: National reports
In cases where data are available only for the spending financed from public sources (national
as well as the ERDF), the average cost recorded tends of course to be lower but the variation is
equally wide, varying from over EUR 100,000 per job directly created in two measures in
Cyprus to under EUR 6,000 for support for an export marketing scheme in Estonia (Table A.2).
Table A.2 - Examples of cost per job created – non-refundable grants, public cost only per job created (EUR)
CY Agro-tourism 126,325 CY Grants for enhancement of manufacturing SMEs 104,000
AT Promotion of environmentally-friendly products 90,000
LV High value added investment 83,114
AT ‘Other’ investment in firms 80,000
CZ Technology investment in SMEs 74,895
EE Technology investment in industrial enterprises 72,983
IT Innovative investment in Umbria 63,510
CY Improvement of tourist services 62,013
AT Investment in firms directly linked to RTDI 60,000
AT Assistance to RTD 60,000
SK Innovation support 56,914
BG Technology upgrade in SMEs 55,465
PL Development of entrepreneurship (Mazowieckie) 53,784
BE Investment grants Walloon region 46,000
BE Investment grants Hainaut 44,000
ES Inno-Empreza programme for SMEs 42,300
IT Support to youth entrepreneurship (Veneto) 33,739
CY Female entrepreneurship 32,270
ES Regional aid schemes to support investment in enterprises 32,000
IT Support to female entrepreneurship (Veneto) 29,604
EL SME support (Macedonia) 28,900
EL SME support in (Tessalia) 27,900
LV Business incubator services 23,956
CZ ICT and strategic services 23,822
IT ICT and eco-innovation upgrade in SMEs (Piemonte) 21,810
RO Microenterprise support 20,000
BG Support for creation and development of innovative start-up firms 17,352
PL Investment of high importance to economy (Innovative economy OP) 7,760
EE Export marketing programme 5,770
Source: National reports

Job creation as an indicator of outcomes in ERDF programmes EvalNet Synthesis Report, 2013
28
It is not possible to conclude much from these cost variations beyond the fact that the average
cost per job reported to have been directly created at the end of 2011 is lower for some
measures and for some countries than for others. It does not imply, in particular, that some
kinds of intervention are more effective than others in increasing employment or that directing
more funding to the measures where costs are calculated to lower will result in more jobs than
if directed to other measures, except possibly in the very short-term. When possible indirect
employment effects are taken into account and the time horizon is extended, it may well be that
the job gains are larger for these other measures as a result, for example, of the improvement of
the competitiveness of enterprises they help to bring about through, say, support for RTDI.
Similarly, support for investment in infrastructure in, for example, transport may directly create
few jobs outside of the construction industry, where by definition they are likely to be
temporary, but may have a major effect in strengthening links between economic centres and
with other regions and so generate significant economic and employment gains indirectly.
The figures for average cost per job directly created from FEIs are equally hard to interpret
since they are subject to the same kinds of difficulty as those for other measures but with the
added uncertainty over whether costs are confined to the funding which has reached final
beneficiaries or whether they also include the financing which is still waiting in funds to be paid
out to enterprises. The very high figure reported for average cost per job created by the venture
capital fund in Sweden (of almost EUR 520,000), therefore, may be because much of the funding
had yet to reach final beneficiaries by the end-2011 (Table A.3). The same may be the case in
respect of the ‘soft loan’ l fund in the Czech Republic (Table A.4).
Table A.3- Examples of cost per job created – Financial engineering instruments, total cost (public and private) per job created (EUR)
SE Venture capital 528,912
DE Credit scheme for development projects in enterprises (R&D Jobs) 166,498
DK Danish Solar Energy in Lolland 135,000
DE Credit scheme for development projects in enterprises (Jobs) 120,492
SE Seed capital 60,400
Source: National reports
Table A.4 Examples of cost per job created – Financial engineering instruments, public costs only per job created (EUR)
CZ Progress soft loan 102,695
BE Risk capital fund (Hainaut) 97,000
BE Risk capital fund (Walloon region) 67,000
EE KredEx subordinated loans 51,800
EL Energy saving subsidised loan 13,860
ES Jeremie fund (Andalusia) 17,500
BE Micro- seed cash credit (Brussels) 10,000
Source: National reports

Job creation as an indicator of outcomes in ERDF programmes EvalNet Synthesis Report, 2013
29
Annex 3 Data on jobs created reported in AIRs and adjustments Annex 3, which is in the form of an Excel table, sets out details of the data on jobs created in all
the OPs together with the adjustments to exclude indirect, safeguarded and construction jobs as
well as those which are estimated instead of actual.
Annex 3.xls


