Explaining Index Based Livestock Insurance in Kenya through Games: Describing Our Approach and Analyzing Game Play. John McPeak, 215 Eggers Hall, Department of Public Administration and International Affairs, Maxwell School of Citizenship and Public Affairs, Syracuse University. (315) 443-6146 [email protected]
Transcript
Explaining Index Based Livestock Insurance in Kenya through Games:
Describing Our Approach and Analyzing Game Play.
John McPeak,215 Eggers Hall,
Department of Public Administration and International Affairs, Maxwell School of Citizenship and Public Affairs,
IBLI – Index Based Livestock Insurance• This research was made possible by support provided in part by
the US Agency for International Development (USAID) Agreement No. EDH00-06-0003-00 awarded to the Assets and Market Access Collaborative Research Support Program (AMA CRSP).
• This research was conducted in collaboration with Andrew Mude, Munenobu Ikegami, Sommarat Chantarat, Chris Barrett, and Michael Carter and other individuals at the International Livestock Research Institute, Cornell University, University of Wisconsin-Madison, The Australian National University, and the University of California-Davis.
• All views, interpretations, recommendations, and conclusions expressed in this paper and presentation are those of the author and not necessarily those of the supporting or collaborating institutions.
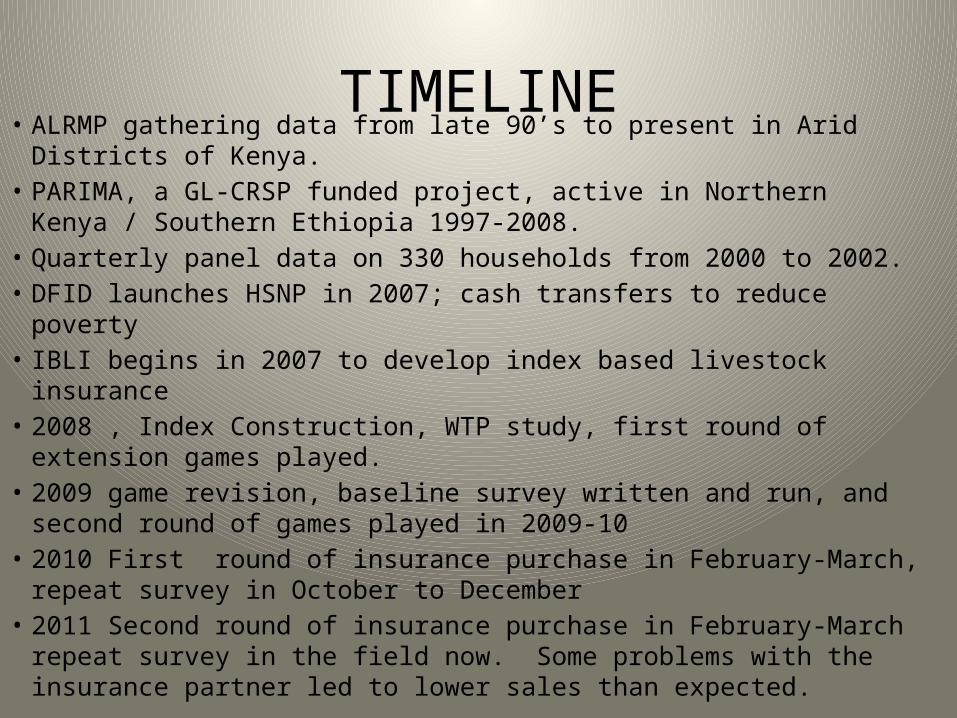
TIMELINE• ALRMP gathering data from late 90’s to present in Arid Districts of Kenya.• PARIMA, a GL-CRSP funded project, active in Northern Kenya / Southern
Ethiopia 1997-2008.• Quarterly panel data on 330 households from 2000 to 2002.• DFID launches HSNP in 2007; cash transfers to reduce poverty• IBLI begins in 2007 to develop index based livestock insurance• 2008 , Index Construction, WTP study, first round of extension games
played.• 2009 game revision, baseline survey written and run, and second round
of games played in 2009-10• 2010 First round of insurance purchase in February-March, repeat
survey in October to December• 2011 Second round of insurance purchase in February-March repeat
survey in the field now. Some problems with the insurance partner led to lower sales than expected.
The Basic Idea• is Income for household i at time t• is a vector of productive assets for hh i , time t• is the rate of return on these productive assets, possibly as a
function of asset levels.• is the household and period specific shock to the return on assets.• are household specific but time invariant income flows• is household and time specific transitory income• is household and time specific measurement error.
– From Barrett et al. (2006) JDS paper.
• Transfers such as Ui could raise income, impact future asset stocks, influence the rate of return to existing assets
• Assets could be subject to stochastic shocks, say , with theta + gamma defined as shocks over the interval [0,1] from some stochastic distribution.
Research Design
• IBLI is asset protection, reduce impact of shocks to A.
• HNSP is cash transfer, works like U.• Sites with IBLI and HSNP• Sites with only IBLI or HSNP• Sites with neither• Full comparison is ahead
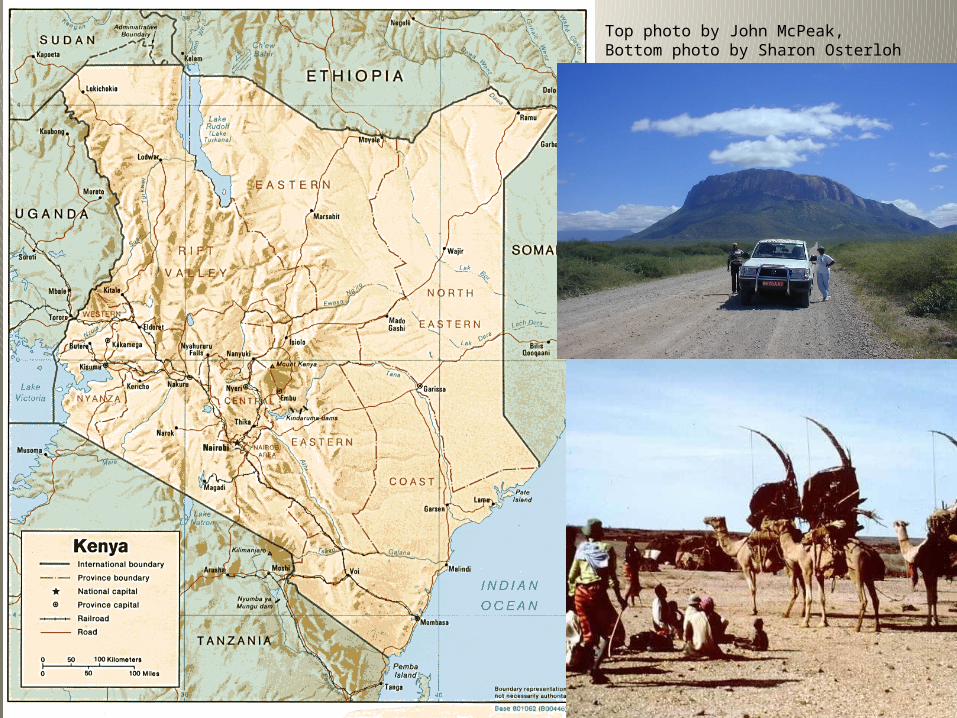
Top photo by John McPeak,Bottom photo by Sharon Osterloh
Google Earth Map of IBLI sites.Top photo by Chris Barrett, Bottom photo by John McPeak
NDVI
Normal Year (May 2007) Drought Year (May 2009)
From Chantarat and Mude 2011
Annual Deviation of NDVI 1999-2006
1999 2000 2001 2002 2003 2004 2005 2006
-40%
-30%
-20%
-10%
0%
10%
20%
30%
40%
50%
Dirib GumboKargiLogologoNorth HorrAVERAGE
What Is the Index Part?
• Figure 3: zNDVI for North Horr and Dirib Gumbo 1990 to 2008 by season
1990 1 3
1991 1 3
1992 1 3
1993 1 3
1994 1 3
1995 1 3
1996 1 3
1997 1 3
1998 1 3
1999 1 3
2000 1 3
2001 1 3
2002 1 3
2003 1 3
2004 1 3
2005 1 3
2006 1 3
2007 1 3
2008 1
-3
-2
-1
0
1
2
3
4
5
Dirib Gumbo
North horr
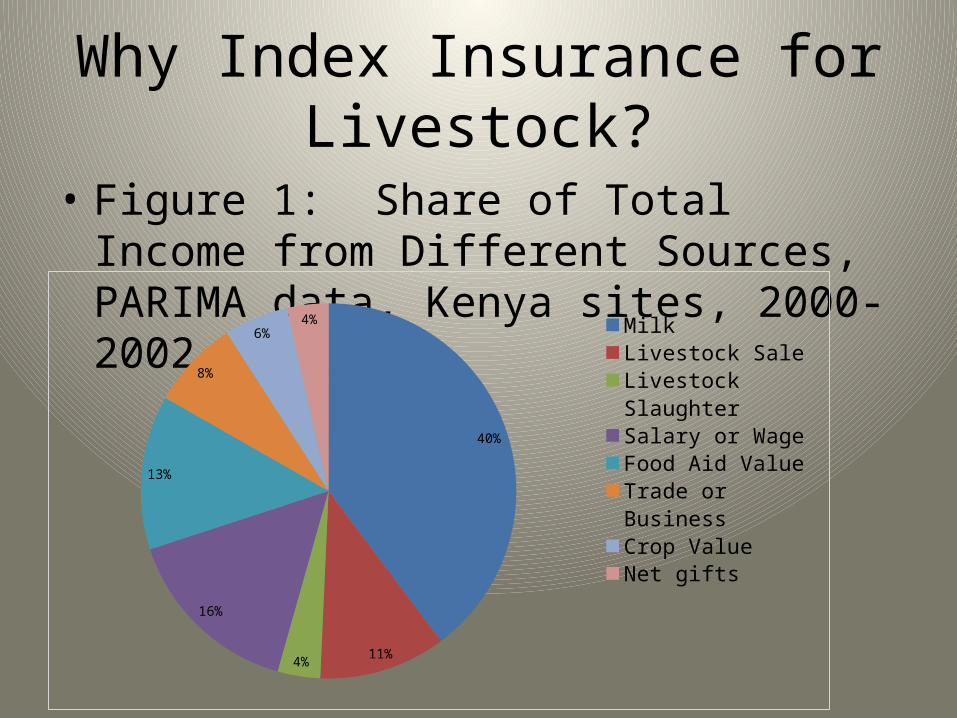
Why Index Insurance for Livestock?
• Figure 1: Share of Total Income from Different Sources, PARIMA data, Kenya sites, 2000-2002
40%
11%4%
16%
13%
8%
6%4%
Milk
Livestock Sale
Livestock Slaughter
Salary or Wage
Food Aid Value
Trade or Business
Crop Value
Net gifts
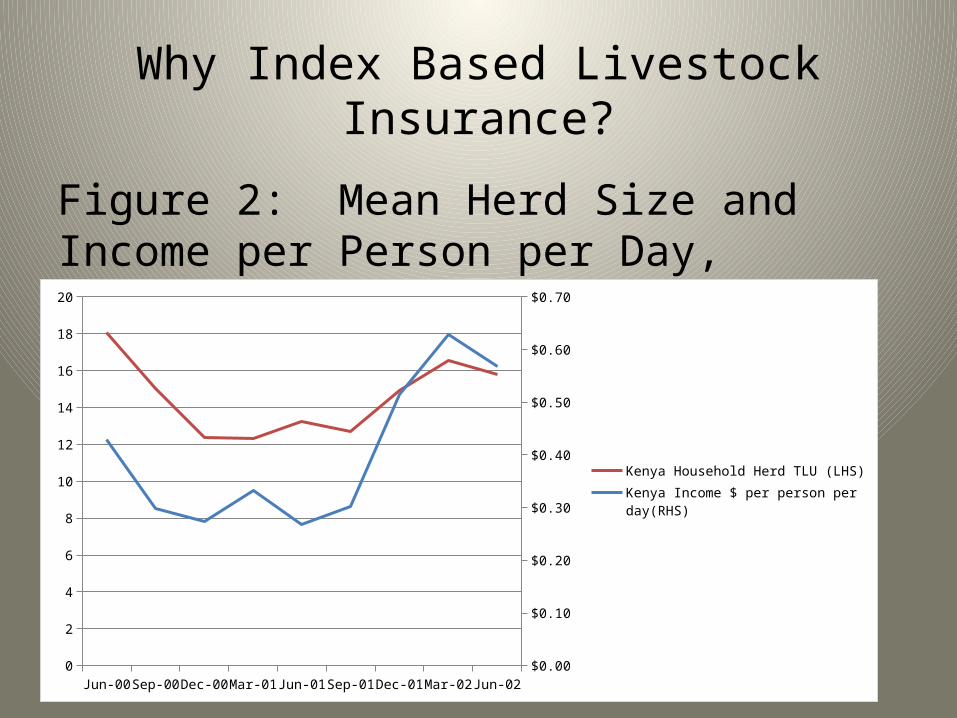
Why Index Based Livestock Insurance?
Figure 2: Mean Herd Size and Income per Person per Day, PARIMA data, 2000-2002
Jun-00Jul-0
0
Aug-00
Sep-00
Oct-00
Nov-00
Dec-00Jan
-01
Feb-01
Mar-01
Apr-01
May-01
Jun-01Jul-0
1
Aug-01
Sep-01
Oct-01
Nov-01
Dec-01Jan
-02
Feb-02
Mar-02
Apr-02
May-02
Jun-020
2
4
6
8
10
12
14
16
18
20
$0.00
$0.10
$0.20
$0.30
$0.40
$0.50
$0.60
$0.70
Kenya Household Herd TLU (LHS)Kenya Income $ per person per day(RHS)
otherDrank bad watertoo much rain/ too coldold agekilled to save motheraccidentpredatordiseasedrought/lack of pasture/starvation/emaciation
Total number of animal deaths from the Kenya sample of 180 households per round and reason cited for the death.
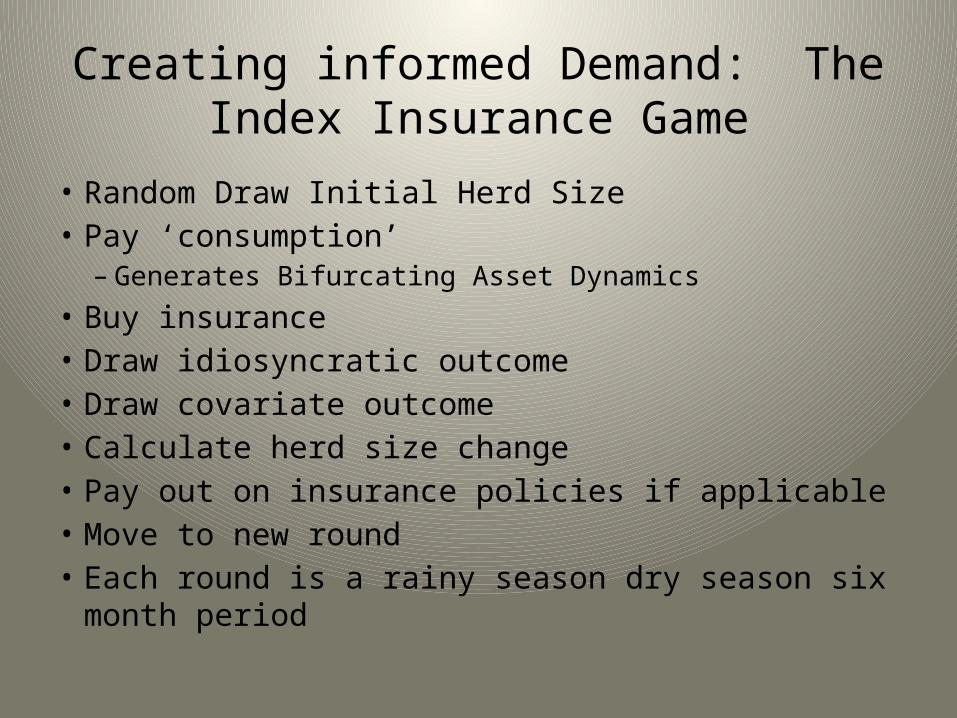
Creating informed Demand: The Index Insurance Game
• Random Draw Initial Herd Size• Pay ‘consumption’
– Generates Bifurcating Asset Dynamics• Buy insurance• Draw idiosyncratic outcome• Draw covariate outcome• Calculate herd size change• Pay out on insurance policies if applicable• Move to new round• Each round is a rainy season dry season six month period
Creating informed Demand: The Index Insurance Game
2008 All Sites
Covariate value -30% -20% 0% 10% 20%Probability of value 6% 6% 13% 44% 31%Idiosyncratic value -10% 0% 10%
October 2009: How many in a random sample of 924 people said they would buy insurance? 98%
First round of sales in early 2010 covering March 2010 to February 2011
October 2010: How many in a random sample of 723 people did buy insurance? 35%
Second round of sales in early 2011 covering March 2011 to February 2012
Currently working to manage a third round of contracts.
don't have
money t
o spend on in
sura
nce
did not underst
and insu
rance
well e
nough
waiting to se
e what h
appens to th
e people who bought t
he insu
rance
don't have
enough animals
did not have
an opportunity
to buy i
t
don't think i
nsura
nce w
ill help m
e
afraid of u
ncerta
nity in
insu
rance
don't tru
st any i
nsura
nce co
mpanies
discoura
ged by someone in
the co
mmunity
can re
ly on fa
milly and fr
iends
can re
ly on other p
ersons/s
ervice
(specif
y)
other (sp
ecify)
0%
5%
10%
15%
20%
25%
If not, why not from the 2010 sample?
March 2010_ February 2011
March 2011_February 2012
People buying contracts
1,979 638
TLU Insured 5,375 TLU 1,086 TLU
Value insured in USD
$1,193,080 $218,083
Insurance company received
$77,636 $13,641
Subsidy $31,039 $5,456
Herders Paid $46,597 $8,185
Subsidy as % of value insured
2.60% 2.50%
Herder paid as % of value insured
3.90% 3.75%
Insurance c. rec as % of value
6.50% 6.25%
TLU insured per person average
2.8 TLU 1.7 TLU
Premium per person average
$39.23 ($15.68 subsidy, $23.55 herder)
$21.38 ($8.55 subsidy, $12.83 herder)
Payout total $0 $19,947
Payout per person average
$0 $31
1 TLU (Tropical Livestock Unit)= 250 kg. liveweight =10 sheep or goats = 1 head of cattle = 0.7 camel.15% predicted mortality ‘trigger’.Sales in Early 2010, again in early 2011
Conclusions
• Really just getting going on this analysis so preliminary
• Chantarat’s WTP sample has more covariates that merit comparison with game play for 2008
• 2010 repeat has actual purchases, so we can look at both WTP and Game Play predictions in contrast to what happened.
Conclusions
• Major drought currently testing the product’s ability to insure against asset risk.
• Behavioral responses still to be identified:– More livestock with lower risk?– Higher sales from existing herd (higher offtake
rates) if need to self-insure increases herd size?– Collateral / credit constraint impact?