Working Paper No. 1 April 2010 Explaining the Decline in Fertility among Citizens of the G.C.C. Countries: the Case of the U.A.E. Mouawiya Al Awad Carole Chartouni Institute for Social & Economic Research (ISER) Zayed University PO Box 500320, Knowledge Village, Dubai, UAE www.ISER.org [email protected]
Transcript
Working Paper No. 1 April 2010
Explaining the Decline in Fertility among Citizens of the
G.C.C. Countries: the Case of the U.A.E.
Mouawiya Al Awad
Carole Chartouni
Institute for Social & Economic Research (ISER) Zayed University PO Box 500320, Knowledge Village, Dubai, UAE www.ISER.org [email protected]
The Gulf Cooperation Council “G.C.C.” countries experienced noticeable declines in fertility
rates in recent years. From 1970 to 2005, total fertility rates in the G.C.C. dropped from an
average of 6.8 births per woman to less than 3 births per woman. The decreases in fertility many
demographic consequences including changes to the age structure of the population, a reduction
in population growth, and decreasing the proportion of citizens within the total population.
The decline in fertility accompanied other changes in the region. Oil revenues financed
massive investments in infrastructure, health and education programs. As a result, literacy and
educational levels among men and women increased dramatically and child mortality rates
plunged.1
There were also significant changes in the national character of the populations of the
respective G.C.C. countries. G.C.C. Development projects in the region necessitated an
enormous influx of foreign workers and families, especially Asians and Arabs. The large
presence of foreigners in the G.C.C. countries impacted the social and cultural norms of its
citizens, and influenced their consumption patterns. Moreover, the availability of cheap foreign
labor provided an impetus for G.C.C. nationals to pursue higher levels of education to enable
them to better compete in the labor market. Obtaining an acceptable educational degree became
socially, and to a certain degree economically, important for most females, and as a result, their
participation in the labor market steadily increased.2 Growing wealth and changes in
consumption patterns also drove the cost of living up, which in turn caused a delay in marriage
among the youth.
1 Mortality rates for children under 5 declined from 15 to 8 deaths per 1000 between 1990 and 2006 (UN
Stat data). 2 U.A.E. national females’ participation rates increased from 2.6% in 1975 to 27% in 2005 (Al Awad and
Chartouni 2009).
ISER | 5
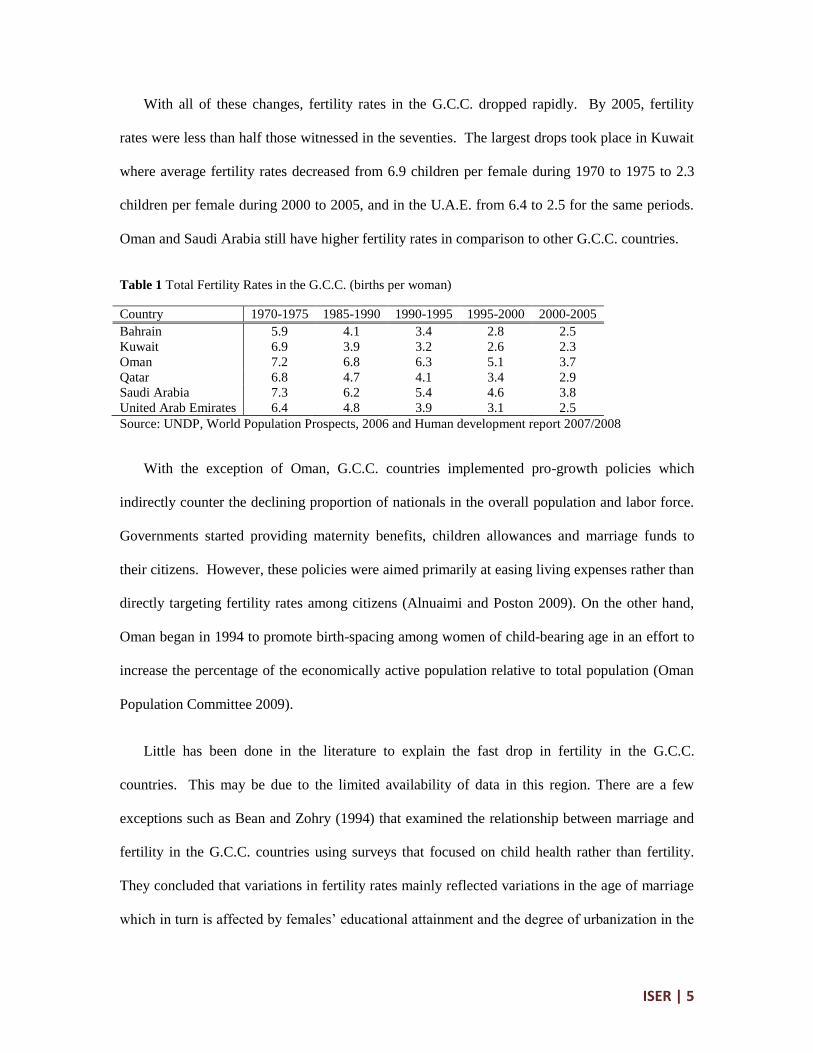
With all of these changes, fertility rates in the G.C.C. dropped rapidly. By 2005, fertility
rates were less than half those witnessed in the seventies. The largest drops took place in Kuwait
where average fertility rates decreased from 6.9 children per female during 1970 to 1975 to 2.3
children per female during 2000 to 2005, and in the U.A.E. from 6.4 to 2.5 for the same periods.
Oman and Saudi Arabia still have higher fertility rates in comparison to other G.C.C. countries.
Table 1 Total Fertility Rates in the G.C.C. (births per woman)
Country 1970-1975 1985-1990 1990-1995 1995-2000 2000-2005
Bahrain 5.9 4.1 3.4 2.8 2.5
Kuwait 6.9 3.9 3.2 2.6 2.3
Oman 7.2 6.8 6.3 5.1 3.7
Qatar 6.8 4.7 4.1 3.4 2.9
Saudi Arabia 7.3 6.2 5.4 4.6 3.8
United Arab Emirates 6.4 4.8 3.9 3.1 2.5
Source: UNDP, World Population Prospects, 2006 and Human development report 2007/2008
With the exception of Oman, G.C.C. countries implemented pro-growth policies which
indirectly counter the declining proportion of nationals in the overall population and labor force.
Governments started providing maternity benefits, children allowances and marriage funds to
their citizens. However, these policies were aimed primarily at easing living expenses rather than
directly targeting fertility rates among citizens (Alnuaimi and Poston 2009). On the other hand,
Oman began in 1994 to promote birth-spacing among women of child-bearing age in an effort to
increase the percentage of the economically active population relative to total population (Oman
Population Committee 2009).
Little has been done in the literature to explain the fast drop in fertility in the G.C.C.
countries. This may be due to the limited availability of data in this region. There are a few
exceptions such as Bean and Zohry (1994) that examined the relationship between marriage and
fertility in the G.C.C. countries using surveys that focused on child health rather than fertility.
They concluded that variations in fertility rates mainly reflected variations in the age of marriage
which in turn is affected by females’ educational attainment and the degree of urbanization in the
ISER | 6
G.C.C.. Alnuaimi and Poston (2009) examined the relationship between polygamy and fertility
among married Emirati women in the U.A.E. during the period of 1998-1999. They used logistic
regression models and found that, contrary to other regions, fertility is positively related to
polygamy in the oil-rich U.A.E.. Abdal (1999) examined the determinants of fertility from a
random sample of birth registrations in Kuwait. Using path analysis, he showed that age at first
marriage is the most relevant predictor of fertility in Kuwait while other variables, such as
education, mother’s working status, religion, place of residence and nationality influenced
fertility through their effect on the age at first marriage. Al-Qudsi (1998) in his study of four
Arab countries, two of which are G.C.C. countries, used a two-step micro-econometric model that
combined a Poisson count function with a Probit binary function to study the fertility-female
labor force participation link. He showed that age at marriage, women’s education, infant
mortality and preferences for male off-springs are all important determinants of fertility in Arab
countries. Moreover, he found that fertility negatively affects labor force participation of Arab
females, while education is positively related to it. He also showed that the age of females is
positively related to labor force participation up to a certain point after which it negatively affects
it. Khraif (2002) studied the determinants of fertility in Saudi Arabia using the demographic
survey of 1999. He found that the age at first marriage and female’s education are the most
important determinants of fertility. On the other hand, a female’s participation in the labor force,
the husband’s educational level and birth control methods are not vital factors of fertility in Saudi
Arabia.
This paper uses the U.A.E. family budget survey conducted in 2008 to investigate the factors
that contributed to the decline of fertility in U.A.E. households. Section two describes the
econometric methodology and the variables used in the study, section three explains the data and
the empirical findings, and finally section four concludes and suggests some policy implications.
ISER | 7
Methodology and Variables Description
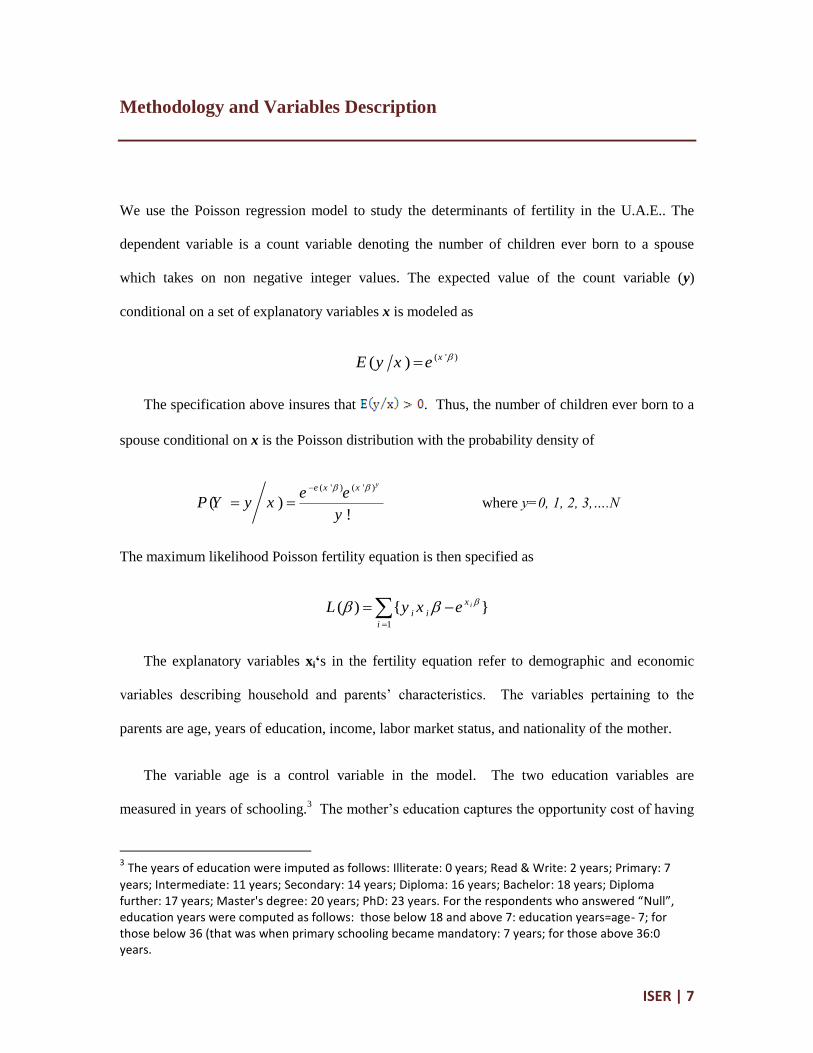
We use the Poisson regression model to study the determinants of fertility in the U.A.E.. The
dependent variable is a count variable denoting the number of children ever born to a spouse
which takes on non negative integer values. The expected value of the count variable (y)
conditional on a set of explanatory variables x is modeled as
( ' )( ) xE y x e
The specification above insures that . Thus, the number of children ever born to a
spouse conditional on x is the Poisson distribution with the probability density of
( ' ) ( ' )
( )!
ye x xe eP Y y x
y
where y=0, 1, 2, 3,….N
The maximum likelihood Poisson fertility equation is then specified as
1
( ) { }ix
i i
i
L y x e
The explanatory variables xi‘s in the fertility equation refer to demographic and economic
variables describing household and parents’ characteristics. The variables pertaining to the
parents are age, years of education, income, labor market status, and nationality of the mother.
The variable age is a control variable in the model. The two education variables are
measured in years of schooling.3 The mother’s education captures the opportunity cost of having
3 The years of education were imputed as follows: Illiterate: 0 years; Read & Write: 2 years; Primary: 7
years; Intermediate: 11 years; Secondary: 14 years; Diploma: 16 years; Bachelor: 18 years; Diploma further: 17 years; Master's degree: 20 years; PhD: 23 years. For the respondents who answered “Null”, education years were computed as follows: those below 18 and above 7: education years=age- 7; for those below 36 (that was when primary schooling became mandatory: 7 years; for those above 36:0 years.
ISER | 8
children, and both the father and mother’s education impact fertility directly by enhancing their
knowledge about the uses of contraceptive methods and the benefits of small-size families.
Moreover, their education indirectly increases the demand for higher quality children which is
associated with a higher spending on children, and as a consequence, with a reduction in the
desired number of children in the family.
The income variable is the father and mother’s annual gross incomes measured in AED. The
use of the family gross income is not realistic in this context as it comes from different members
of the family and thus, it does not demonstrate the link between fertility and the financial
contribution toward children. Income can be either positively or negatively related to fertility
depending on whether the income or substitution effect dominates. The economic theory of
Becker (1960, 1974) suggests that children are similar to consumer durables, like automobiles.
As family income increases, parents demand more children but also better quality children.
Therefore, parents have to take a decision to substitute quality for quantity. The average
spending per child is used to proxy quality in the model.
We assign dummy variables to capture whether the mother or father is working or not. There
is a tradeoff between spending time at home and at work especially for the mother. A non-
working woman would have more time to bear children and conversely we would expect fertility
to decrease with more time devoted by the female to work. We also include a dummy variable
denoting whether the mother is U.A.E. national in order to examine the impact of marriage
between U.A.E. nationals and foreigners on fertility.
As for the household characteristics, they mainly reflect the social class of the family such as
the number of domestic workers working in the household and the number of bedrooms in the
ISER | 9
house, but they may impact fertility by impacting the space or the time available to raise and take
care of children.
We also include two proxies for the age at first birth and the birth intervals between children.
The proxy for the age at first birth of the spouse4 is calculated as the difference between the age
of the mother and the age of her first child. The proxy for the average birth interval among the
children in the family5 is computed by the following ratio:
age of eldest child - age of youngest childbirth interval=
number of children in the household
4 The age at first marriage proxy can only be calculated for families that have at least one child, and as
such the number of observations decreases. 5 The birth interval proxy can only be calculated for families with two or more kids, and as such the
number of observations decreases even more.
ISER | 10
Data and Empirical Results
The data used in this study are from the Household Expenditure Survey (HES) conducted in the
U.A.E. in 2008. The survey contains information on 13,992 households relating to their income
and spending patterns. The data were collected in all of the seven emirates of the U.A.E. and
encompassed both U.A.E. national and non-U.A.E. national households. The survey also
included information on the socio-economic characteristics of all the individuals in the household
such as their age, gender, educational level, labor market status, household size and occupation.
Therefore, a comprehensive data set of 84,733 observations was generated containing information
on children, parents, and other family members of the household. For the purpose of this study,
we restrict the sample to females aged between 15 and 49 and who live in local households6 since
we assume that the childbearing age in the U.A.E. lies within this range. We are thus left with
10,305 individual observations7.
The variable of interest in this paper is the number of children born to every female in the
sample. Due to data limitations, we can only impute the number of children for females who were
declared as:
1. Heads of the households,
2. Spouses,
3. Married daughters of the heads of households who live in a household where there are no
daughter-in-laws living with them, and there are no other married, divorced, or widowed
in that household,
6 A household is defined to be local if the head of the household is a U.A.E. national.
7 We have also excluded all females who were declared as employees of the households (domestic
workers). Moreover, we have eliminated all households in which the difference between the mother’s age and her eldest child is lower than 13 years. This is either a mistake in the reporting of the data or the spouse in the household is not the biological mother of the child.
ISER | 11
4. Daughter-in-law of the heads of households who live in a household where all daughters
of that household are single and they are the only daughter-in-laws in that household, and
5. Single Daughters of the head of households.
Moreover, we can only assign children to their respective mothers in households that contain
one spouse only8. The sample then is reduced to 7437 observations and comprises around 72% of
the original female sample (10,305 observations).
8 The data is arranged in such as way that we cannot discern which spouse has which children.
ISER | 12
Descriptive Results
This section provides some statistics on total and marital fertility rates in the U.A.E. according to
various factors such as females’ age, education, labor market status, and parents’ income.
Table 2 illustrates the substantial drop in fertility as the age cohort to which the female
belongs to decreases. The total fertility rate declines from 5.8 for females in the 45-49 age cohort
to 1.18 for females in the 25-29 age cohort. Fertility rates become close to zero for the youngest
age cohort.
Table 2 Total Fertility and Marital Fertility Rates in the U.A.E. by Females’ Age Groups (births per
woman)
Age Groups TFR MFR
15-19 0.01 0.43
20-24 0.25 1.21
25-29 1.18 2.36
30-34 2.80 3.78
35-39 4.75 5.29
40-44 5.51 5.95
45-49 5.80 6.01
# of Observations 7437 3278
Source: Authors calculations based on U.A.E. Family Budget Survey 2008.
A female’s education and participation in the labor force also impact her fertility by
postponing the age of marriage, and enhancing the knowledge of contraceptive methods and the
benefits of small-size families. It also forces females to adopt a form of birth-spacing strategy in
order to cope with the work responsibilities. Indirectly, education increases the demand for
higher quality children which with higher spending on children. This increase in the cost of
having children reduces the desired number of children in the family.
ISER | 13
Table 3 shows the negative relationship between a female’s education and fertility. The total
fertility rate for women who have at most completed primary schooling is 4.82, while more
educated females have fertility rates below 2. The marital fertility rate also declines from 6.15 to
2.82 as the years of education decrease. The fertility rates in this paper are less than those
reported by Lee and Zohry (1994) for the late eighties who estimated total fertility rates of 8.1
and 4.6 for illiterate and literate U.A.E. women respectively.
Table 3 Total & Marital Fertility Rates in the U.A.E. by Females’ Years of Education (births per woman)
Education of Female in years TFR MFR
0-7 years 4.82 6.15
11 years 1.60 4.87
14 years 1.27 3.27
16-18 years 1.56 3.09
20-23 years 1.33 2.82
# of Observations 7437 3278
Source: Authors calculations based on U.A.E. Family Budget Survey 2008.
Table 4 estimates fertility rates according to female participation in the labor force. Total
fertility rates in the U.A.E. are estimated to be around 1.5 and 3.7 for working and non-working
women respectively. There is a negative relationship between women’s labor force participation
and fertility; however, its direction is not clear. Women who participate in the labor force tend to
have fewer children as they have less time to take care of their offspring. On the other hand, a
reduction in fertility can cause a drop in the overall supply of labor, which in turns increases
wages and encourages further increases in female labor force participation rates.
Table 4 Total Fertility and Marital Fertility Rates in the U.A.E. by Females’ Labor Market Status (births
per woman)
Labor Market Status of Female TFR MFR
Working 1.54 3.12
Not Working 3.74 4.75
Full Time Student 0.03 0.96
# of Observations 7436 3278
Source: Authors calculations based on U.A.E. Family Budget Survey 2008.
ISER | 14
The increase in females’ educational attainment and labor force participation has induced
women to postpone the age of marriage. Early marriages used to be very common in the U.A.E.
However, as individual education, occupation, and wealth in the Gulf countries began to replace
marriage as a method towards achieving a respected social membership (El-Haddad 2003), the
age of marriage began to increase. During 1975, for example, the proportion of women aged
between 15 and 19 years who were married was almost 57%; however, by the year 1995, this
proportion decreased to 8% (Rashad et. al. 2005). Moreover, economic development and rapid
urbanization began to impose costly consumption styles on families (Begader 1993) which forced
young males to also postpone marriage or marry foreign women. Using the HES 2008 dataset,
we estimate the mean age of marriage for females in the U.A.E. to be less than 20 years in 1988,
20.25 years in 1993, 22.8 in 2003, and finally 23.5 in 2008. This current phenomenon of
postponing marriage has led to a decrease in fertility. We can see from table 5 that females who
married at very early ages (13 to 15) have on average 7 children ; whereas, females who married
after the age of 25 have less than 3 children.
Table 5 Total Marital Fertility Rates by the Age of Marriage (births per woman)
Age of Marriage MFR
13-15 6.81
16-20 5.46
21-25 3.85
26-30 3.08
>30 2.44
# of Observations 2633
Source: Authors calculations based on U.A.E. Family Budget Survey 2008.
The increase in the demand of higher quality children as well as females’ work
responsibilities outside of the house can also broaden the birth intervals. Wider intervals reduce
fertility as they decrease the number of years available for conceiving. Table 6 shows that fertility
ISER | 15
in the U.A.E. is not affected by birth intervals of 1 or 2 years. However, when birth intervals
begin to exceed 2 years then fertility levels start to decline9.
Table 6 Total Marital Fertility Rates in the U.A.E. by Birth Intervals (births per woman)
Birth Interval MFR
1 5.18
2 5.71
3 4.64
4 3.88
>5 0.72
# of Observations 2623
Source: Authors calculations based on U.A.E. Family Budget Survey 2008.
The negative impact of the increase in women’s labor force participation on fertility can be
partly mitigated by the presence of babysitters or domestic workers10
. Therefore, one should
expect fertility to rise as the number of domestic workers in the household increases. However,
the employment of domestic workers is a common practice among U.A.E. families, and is not
restricted to households with working women. It is largely an urban culture that resulted from the
sudden increased wealth in these societies (El-Haddad 2003). Indeed, table 7, shows that fertility
rates do not seem to vary with the number of domestic workers. There is though a slight decline
in fertility levels for families who employ 3 or more domestic workers, and a minor increase from
not employing any domestic workers or simply hiring one domestic worker.
9 Lee and Zohry (1994) point out to the possibility that women in the U.A.E. limit fertility later in life, after
a given number of children have been born. This means that birth intervals may be short during early years of marriage and start to widen later on.
10 Although we should take into consideration the cost of foreign household keepers into account as part
of the cost of having children, their actual monetary cost percentage is not important in the U.A.E. family budget and thus their cost is not expected to have direct negative effect on fertility.
ISER | 16
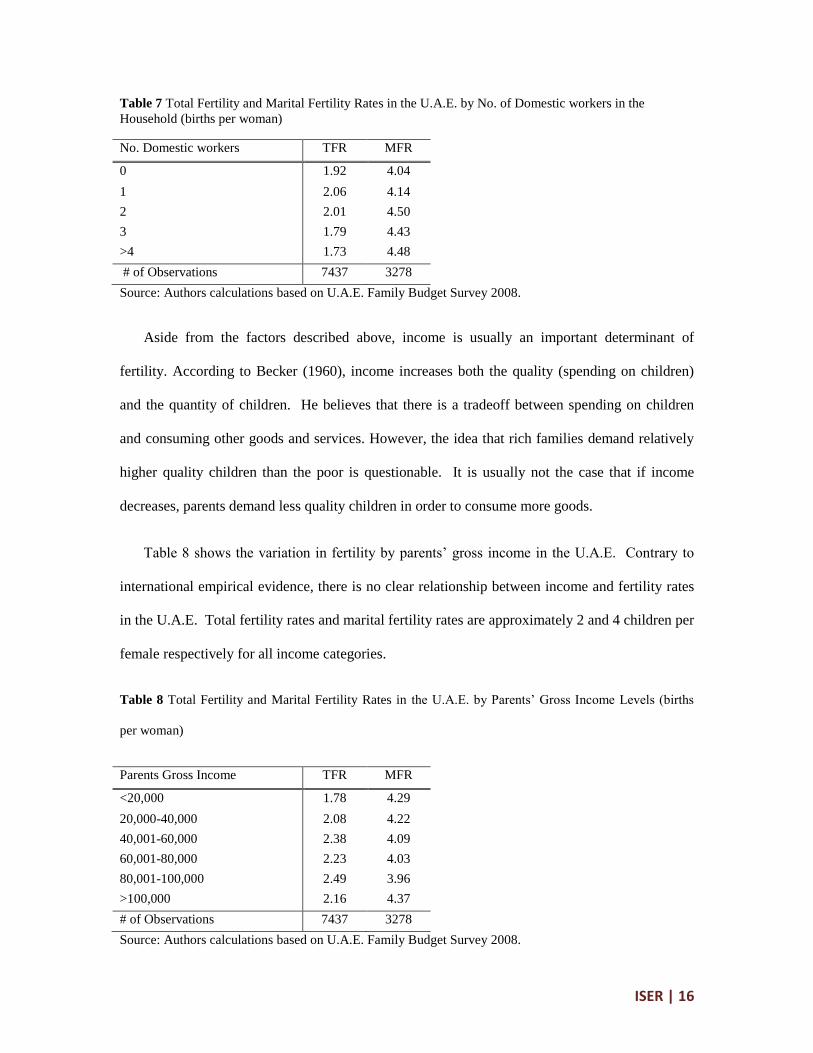
Table 7 Total Fertility and Marital Fertility Rates in the U.A.E. by No. of Domestic workers in the
Household (births per woman)
No. Domestic workers TFR MFR
0 1.92 4.04
1 2.06 4.14
2 2.01 4.50
3 1.79 4.43
>4 1.73 4.48
# of Observations 7437 3278
Source: Authors calculations based on U.A.E. Family Budget Survey 2008.
Aside from the factors described above, income is usually an important determinant of
fertility. According to Becker (1960), income increases both the quality (spending on children)
and the quantity of children. He believes that there is a tradeoff between spending on children
and consuming other goods and services. However, the idea that rich families demand relatively
higher quality children than the poor is questionable. It is usually not the case that if income
decreases, parents demand less quality children in order to consume more goods.
Table 8 shows the variation in fertility by parents’ gross income in the U.A.E. Contrary to
international empirical evidence, there is no clear relationship between income and fertility rates
in the U.A.E. Total fertility rates and marital fertility rates are approximately 2 and 4 children per
female respectively for all income categories.
Table 8 Total Fertility and Marital Fertility Rates in the U.A.E. by Parents’ Gross Income Levels (births
per woman)
Parents Gross Income TFR MFR
<20,000 1.78 4.29
20,000-40,000 2.08 4.22
40,001-60,000 2.38 4.09
60,001-80,000 2.23 4.03
80,001-100,000 2.49 3.96
>100,000 2.16 4.37
# of Observations 7437 3278
Source: Authors calculations based on U.A.E. Family Budget Survey 2008.
ISER | 17
Table 9 depicts the fertility rates across the emirates in the U.A.E. Despite the differences in
the degree of economic development and magnitude of wealth between the emirates, fertility rates
do not seem to vary. Total fertility rates range from 1.7 in Umm Al Quwain to around 2.5 in
Fujeirah, while marital fertility rates range from around 3.9 in Dubai to 5.1 in Fujeirah.
Table 9 Total Fertility and Marital Fertility Rates in the U.A.E. by Emirate (births per woman)
Emirate TFR MFR
Abu Dhabi 2.10 4.00
Dubai 1.90 3.91
Sharjah 1.89 4.14
Ajman 1.97 4.55
Umm Al Quwain 1.73 3.96
Ras Al Khaimah 1.91 4.04
Fujeirah 2.52 5.11
# of Observations 7437 3278
Source: Authors calculations based on U.A.E. Family Budget Survey 2008.
Finally, we look at the effect of polygamy on fertility. In many countries such as the
Cameroon and the Central African Republic, polygamy is inversely related to fertility (Wasao
2001). However, in the U.A.E., this relationship is reversed (Alnuaimi and Poston 2009). Total
and marital fertility rates increase as the number of spouses rise in the household. This result may
be due to the competition that arises among women in polygamous marriages to have more
children so that they can either establish superiority in the household or secure more inheritance
from the household wealth.
Table 10 Total Fertility and Marital Fertility Rates in the U.A.E. by Number of Spouses (births per
woman)
No. Spouses TFR MFR
1 2.15 4.34
2 2.05 3.94
3 2.95 4.87
4 4.06 5.42
# of Observations 6911 3448
Source: Authors calculations based on U.A.E. Family Budget Survey 2008.
ISER | 18
Multivariate Results:
This section estimates three empirical models in order to assess the impact of each of the
previously discussed factors on fertility among U.A.E. households. The first model includes
parents’ age, years of education, income, labor market status and nationality of the mother, in
addition to the number of domestic workers working in the household, the number of bedrooms in
the house, and household children expenditures. The second regression adds a proxy for the age
at first birth of the spouse, and the third regression adds a proxy for the birth interval among the
children in the family.
In the econometric model estimation, we further restrict our sample to female spouses aged
between 15 and 49 years and living in households where polygamy does not exist in order to
obtain independent and identically distributed data. Therefore, we attain a sample size of 2735
observations. Table 11 shows the distribution of households according to the number of children.
Around 50% of the U.A.E. citizen families have 5 or more children and the most frequent number
of children per spouse is 3, 4, and 5.
Table 11 Distribution of the Sample Household According to the Number of Children