U.S. DEPARTMENT OF THE INTERIOR U.S. GEOLOGICAL SURVEY TO ACCOMPANY MAP CP-35 Explanatory Notes for the Natural Hazards Map of the Circum-Pacific Region Pacific Basin Sheet 1:17,000,000 CIRCUM-PACIFIC COUNCIL ENERGY AND MINERAL ill// RESOURCES 1990
Transcript
U.S. DEPARTMENT OF THE INTERIOR U.S. GEOLOGICAL SURVEY
TO ACCOMPANY MAP CP-35
Explanatory Notes for theNatural Hazards Map
of the Circum-Pacific RegionPacific Basin Sheet
1:17,000,000
CIRCUM-PACIFIC COUNCIL
ENERGY AND MINERALill// RESOURCES
1990
1st printing 1990. 2nd printing 1992.
CIRCUM-PACIFIC COUNCIL FOR ENERGY AND MINERAL RESOURCES Michel T. Halbouty, Chairman
CIRCUM-PACIFIC MAP PROJECTJohn A. Reinemund, Director
George Gryc, General ChairmanMaurice J. Terman, Scientific Coordination
EXPLANATORY NOTES FOR THENATURAL HAZARDS MAP
OF THE CIRCUM-PACIFIC REGIONPACIFIC BASIN SHEET
Scale: 1:17,000,000
By
INTRODUCTION
Millington Lockwood, National Oceanic and Atmospheric Administration, Rockville, Maryland 20952, U.S.A.
WEATHER HAZARDS
Joe D. Elms, National Oceanic and Atmospheric Administration, Asheville, North Carolina 28801, U.S.A.
TSUNAMIS
Patricia A. Lockridge, National Geophysical Data Center, National Oceanic and Atmospheric Administration, Boulder, Colorado 80303, U.S.A.
EARTHQUAKES AND LANDSLIDES
George W. Moore, Department of Geosciences, Oregon State University,Corvallis, Oregon 97331, U.S.A.
Stuart P. Nishenko, National Earthquake Information Center, U.S. Geological Survey,Denver, Colorado 80225, U.S.A.
VOLCANIC HAZARDS
Tom Simkin, Museum of Natural History, Smithsonian Institution,Washington, D.C. 20560, U.S.A.
Chris Newhall, U.S. Geological Survey, Reston, Virginia 22092, U.S.A.
1990
Explanatory Notes to Supplement the
NATURAL HAZARDS MAP OF THECIRCUM-PACIFIC REGION
PACIFIC BASIN SHEET
Map Compilers and Principal Contributors
WEATHER HAZARDS
Joe D. Elms, National Oceanic and Atmospheric Administration, Asheville, North Carolina 28801, U.S.A.Australian Bureau of Meteorology
Fiji Meteorological ServiceMauritius Meteorological Service
New Caledonian Meteorological ServiceReunion Meteorological ServiceRoyal Observatory, Hong Kong
U.S. Joint Ice Center, Suitland, MarylandU.S. Joint Typhoon Warning Center, Guam
U.S. National Weather Service
TORNADOES
Miinchener Ruckversicherungs-Gesellschaft, Munchen 40, D-8000, German
TSUNAMIS
Patricia A. Lockridge, National Geophysical Data Center,National Oceanic and Atmospheric Administration, Boulder, Colorado 80303, U.S.A.
Ronald H. Smith, Cooperative Institute for Research in Environmental Sciences,Boulder, Colorado, 80303, U.S.A.
EARTHQUAKE EPICENTERS
Wilbur A. Rinehart, National Geophysical Data Center, National Oceanic and Atmospheric Administration, Boulder, Colorado 80303, U.S.A.
VOLCANIC CENTERS(Data updated through 1991 and reflected on 1992 reprinted map)
Tom Simkin and Lee Siebert, Museum of Natural History, Smithsonian Institution, Washington, D.C. 20560, U.S.A.
TECTONIC ELEMENTS
George W. Moore, Department of Geosciences, Oregon State University, Corvallis, Oregon 97331, U.S.A.
Map compilation coordinated byGeorge Gryc
U.S. Geological SurveyMenlo Park, California 94025, U.S.A.
Explanatory Notes for the Natural Hazards Map of the Circum-Pacific Region
Contents
Page
Introduction 2Circum-Pacific Map Project 2Origin of the Natural Hazards Map 2 Importance of understanding natural hazards 3
Millington LockwoodNational Ocean Service, National Oceanic and Atmospheric Administration
6001 Executive Boulevard, Rockville, Maryland, 20852, USA
Circum-Pacific Map Project
The Circum-Pacific Map Project is a cooperative international effort designed to show the relationship of known energy and mineral resources to the major geologic features of the Pacific Basin and surrounding continental areas. Earth scientists representing some 180 organizations from more than 40 Pacific-region countries are involved in this work.
Six overlapping equal-area regional maps at a scale of 1:10,000,000 form the cartographic base for the project: These include four Circum-Pacific quadrants (Northwest, Southwest, Southeast, and Northeast) and the Antarctic and Arctic Sheets. There is also a Pacific Basin Sheet which covers the entire Pacific region at a scale of 1:17,000,000. Map series include the Base Map Series, Geographic Map Series, Plate-Tectonic Map Series, Geologic Map Series, Geodynamic Map Series, Mineral-Resources Map Series, Energy-Resources Map Series, and Tectonic Map Series. In addition, several individual map sheets on other topics have been issued. Altogether more than 60 map sheets are planned. The maps are prepared cooperatively by the Circum-Pacific Council for Energy and Mineral Resources and the U.S. Geological Survey, and are available from the Branch of Distribution, U.S. Geological Survey, Box 25286, Federal Center, Denver, CO 80225, USA.
The Circum-Pacific Map Project is directed by six panels of geoscientists representing Pacific-region Earth- science organizations, universities, and natural-resource companies. The regional panels correspond to the six basic map areas, and most of the Map Project's decisions are made at annual Panel Chairman's Meetings.
Project coordination and final cartography are carried out through the cooperation of the Office of International Geology of the U.S. Geological Survey (USGS). Project headquarters are located at 345 Middlefield Road (MS 952), Menlo Park, California 94025, USA.
The Circum-Pacific Map Project operates as an activity of the Circum-Pacific Council for Energy and Mineral Resources, a nonprofit organization that promotes cooperation among Circum-Pacific countries in the study of energy and mineral resources of the Pacific Basin.
The Natural Hazards Map is a special sheet on the 1:17,000,000 base prepared in cooperation with the U.S. National Oceanic and Atmospheric Administration (NOAA). It also includes data from die Geographic, Plate- Tectonic, and Geodynamic Maps of the regular series of the Circum-Pacific Map Project.
Origin of the Natural Hazards Map
At the 1984 Panel Chairmen's Meeting of the Map Project it was proposed that a hazard map, including data on earthquakes and volcanic hazards, information from a NOAA tsunami map, landslides, and flood hazards be prepared by the Map Project. The idea was generally accepted by the Panel Chairmen, and it was suggested that a small group of experts with active experience in mapping geologic hazards be impaneled to experiment with depicting information on the l:17,000,000-scale Base Map. A preliminary landslide map that had been presented to the 1980 Panel Chairmen's Meeting was used as a guide to depicting data on die Pacific Basin Sheet. Herbert Meyers of NOAA advised the group that examples of hazards maps covering the entire globe, some at smaller scales than the Circum-Pacific base, had been prepared to depict recurrence rates of certain threshold events. A further suggestion was to use the ocean areas to show limits of polar ice packs, common areas of waterspouts, and typical paths of hurricanes. Following the 1985 Panel Chairmen's Meeting, a group of experts was convened between scientists from the USGS and NOAA to determine the best course of action to follow to prepare a Circum-Pacific Natural Hazards Map. Initial criteria included the general utility of the information, the availability of data for the entire basin, and the ability to portray it at a scale of 1:17,000,000. An initial list of variables was selected, including tectonic elements, typhoons, ice and superstructure icing, and tornadoes. The team of USGS and NOAA scientists oversaw the development of the map, selection and refinement of individual elements, and preparation 6f the descriptive booklet. Data selected were available from NOAA's National Climatic Data Center and National Geophysical Data Center, USGS's National Earthquake Information Center, and the Smithsonian Institution. Individuals, cited on the map, were responsible for the
assembly of data types and the preparation of various chapters within the descriptive booklet. The Natural Hazards Map compilation was coordinated through the Joint USGS-NOAA Office for Mapping and Research. Participants were Millington Lockwood, Irving Perlroth, Curtis Mason and William Stubblefield from NOAA; John Reinemund, Maurice Terman, George Moore and Frank Sidlauskas from the USGS. Frank Sidlauskas was responsible for map cartography.
Importance of understanding natural hazards
Natural Hazards are a significant factor in the lives and economy of many countries within the Circum- Pacific Basin. They are becoming increasingly significant as we increase our knowledge through observation and research. This increase in knowledge combined with expanding population centers within the region has been the major motivational factor behind the requirement to map the occurrences of natural hazards within the area. Moreover, natural-hazard phenomena in the Pacific region are focused to a considerable extent along the Pacific rim where energy and mineral resources and human activity related to resource development are concentrated.
The United Nations passed a resolution by unanimous consent in December 1987, supporting the establishment of the International Decade for Natural Disaster Reduction, to begin in 1990. The focus of the resolution is on prediction, mitigation, dissemination of information and scientific and engineering research. The Circum-Pacific Natural Hazards Map will be a useful tool for those engaged in these activities.
Natural hazards can be highly disruptive to the local economy and livelihood in most areas within the region. Knowledge of these natural hazards, as portrayed on the Natural Hazards Map of the Circum-Pacific Region can assist governments and individuals in planning their activities. This map is designed to stimulate research in and further the monitoring of disastrous events within the basin. Comments on the map should be directed to the Circum-Pacific Map Project headquarters, 345 Middlefield Road (MS 952), Menlo Park, California 94025, USA.
Weather Hazards
Joe D. ElmsNational Climatic Data Center, National Oceanic and Atmospheric Administration, Asheville,
North Carolina 28801, USA
Introduction
Mariners have always held both fascination and respect for the weather, and they often noted facts in their ship logs about the weather they encountered. Over the decades, this process became more organized, with the result that today all major maritime nations actively solicit ships to provide weather observations in a uniform international code. Because of the interest in prior years, today's modem digital data base of surface-marine observations contains over 120-million reports from ships and buoys. In addition to this data, there are substantial holdings of tropical cyclone tracks, numerically modeled wind and wave values, and satellite data observations covering numerous elements.
Since Benjamin Franklin's chart of the Gulf Stream in 1770, British Navy Lieutenant Francis Beaufort's numerical code for wind force and weather conditions in 1805, and Matthew Fontaine Maury's wind and wave navigation charts in the 1840's, maritime nations of the world have been collecting weather information to benefit shipping, fishing, coastal engineering, and commerce. These data are exchanged by international agreement under the auspices of the World Meteorological Organization. Thus, it is possible to produce such maps as this one containing weather hazards.
Tropical Cyclones
Prior to the development of weather satellites in the early 1960's, the detection and tracking of tropical cyclones depended upon ship and land observations supplemented after the 1940's by air reconnaissance and radar reports. In the early period, the late 1800's and early 1900's, the documented historical tracks and intensities were based on rather brief and often widely separated observations in both time and space. Entire storms could be missed if no ship's records reported their existence. With the advent of the satellite, a tropical storm became much less likely to escape detection (unless we lost our "eyes in the sky").
The term "cyclone" refers to any closed circulation in which the wind rotates counterclockwise in the Northern Hemisphere or clockwise in the Southern Hemisphere. The direction of circulation is caused by the Coriolis force derived from the rotation of the Earth. This Coriolis force is weak near the Equator, so most tropical cyclones are found only above 10° latitude. Tropical cyclones derive their energy from the latent heat of condensation of water vapor and usually form in regions where the sea-surface temperature is 80° F (26° C) or warmer. They have a warm core and are thus distinguished from the cold-core subtropical cyclones or extratropical cyclones that form due to large-scale horizontal contrasts of temperature and moisture that are generally associated with frontal systems. Since tropical cyclogenesis requires both warm sea-surface temperature and sufficient Coriolis influence, tropical cyclones have never been observed in the South Atlantic Ocean or in the eastern South Pacific. Figure 1 from the Mariners Worldwide Climatic Guide to Tropical Storms at Sea (Crutcher and Quayle, 1974) shows the source region for tropical cyclones and how they relate to a sea-surface temperature of 80°F or greater during the summer or early fall. ,
Tropical cyclone winds rotate around a central "eye", and the strength of these winds determines the intensity and classification of the cyclone. In the early formative stages, before a closed circulation is established, the area of brewing weather is called a tropical disturbance or easterly wave. If intensification occurs, and a closed circulation develops, then it is classified as a tropical depression, for as long as the maximum sustained winds remain below 34 knots (63 km/hr). When maximum sustained wind speeds reach 34-64 knots (63-119 km/hr) it is classified as a tropical storm and usually given a name. At 64 knots (119 km/hr) or greater, it becomes a hurricane, or in the North Pacific, a typhoon.
Along the path of movement, the strongest winds are found in the right-front quadrant in the Northern Hemisphere and left-front quadrant in the Southern Hemisphere. Once the storm makes landfall or reaches higher latitude, its energy source of warm moist water vapor is interrupted, and the stage is set for its demise, as its wind begins to decline, and barometric pressure begins to increase.
30'
40
' 50
- 6
0-
70-
80
- 90
" 10
0"
110-
12
0"
130-
I
10-
100-
9
0-
80"
70"
30-
20
- 10
- 0-
10
- 20
- 3
0'
40
4
I I
I A
I
I I
I I
I I
I I
I
Mea
n se
a-su
rface
tem
pera
ture
>26
.5°
C (
80°
F)
in S
epte
mbe
r fo
r th
e N
orth
ern
Hem
isph
ere;
M
arch
for
the
Sou
ther
n H
emis
pher
e.
Reg
ions
of
trop
ical
cyc
loge
nesi
s.N
OR
THE
RN
HE
MIS
P H
ERE
SO
U!
HE
RN
HE
M S
PH
ER
E
75I
i I
i I
i I
i I
i I
i I
I I
I I—
i I
i—I—
ItO
- 15
0-
160-
17
0-
180"
17
0-
160*
IS
O*
14O
* 13
0*
120*
11
0*
100*
90
* 80
" 70
- 6
0-
W
40
- 30
- 20
" 10
- O
f 10
' 2
0'
30
' 4
0'4
530
' 4
0'
50'
60'
70
' 80
* -9
0*
1W
11
0-
120*
13
0"
1
1.
Sour
ce r
egio
ns o
f tro
pica
l cy
clon
es (
from
Cru
tche
r an
d Q
uayl
e, 1
974,
ad
apte
d af
ter
Gra
y, 1
967)
.
On average, the greatest number of hurricanes per year is found in the western North Pacific, whereas the greatest density, the number per 5-degree square, is found in the eastern North Pacific.
The presentations on the Natural Hazards Map show the preferred tropical storm tracks (wind speed >. 34 knots) and the probability of having at least one tropical storm in any given year within a given 5-degree square. It should be noted that the preferred tracks are the summation of many individual storms over many years. Variation of individual storms, in speed, intensity and track vary considerably as indicated in Figures 2 and 3 from the 1988 Annual Tropical Cyclone Report published by the Joint Typhoon Warning Center.
Sea Ice
The ice limits presented on the map are based on a weekly analysis produced at the Joint Ice Center (JIC) for the period 1973-1982. These weekly charts were derived from a manual synthesis by JIC personnel from shore-station reports, ship reports, aerial reconnaissance, and satellite data. The greatest input comes from satellites, providing up to 90% of the utilized information in the Arctic and 98% in the Antarctic. These weekly charts are digitized at the National Climatic Data Center (NCDC), where analog data are converted to digital values at predetermined grid points. Data storage is in the World Meteorological Observation Organization's SIGRID (Sea-Ice Grid) format, where the grid points are identified by Earth coordinates and have a resolution of 15 nautical miles or better. These weekly charts continue to be digitized at NCDC in a concerted effort to extend the period of record of the digital data base. Figure 4 is an example of a weekly ice chart for the sector from 95° West longitude westward to 95° East longitude.
From the initial 10-year digital data base, the maximum and minimum ice edges were defined. Other presentations can also be derived, such as the mean ice concentration, mean ice edge, and maximum, mean, and minimum extent of 5/10th or more of ice coverage. These are presented in the three-volume set of the U.S. Navy Sea Ice Climatic Atlas (Commander, Naval Oceanography Command, 1985, 1986).
Superstructure Icing
Superstructure icing can prove to be as serious a problem as sea ice, especially for smaller vessels. This is true because small ships are most vulnerable to a danger of a shift in the center of gravity caused by ice loading. Superstructure icing results from the accumulation of ice on exposed structures (ships, oil derricks, buoys, and so forth) and can occur when the structure encounters weather conditions such as snow, freezing rain, freezing drizzle, or freezing sea spray when the air temperature is below 0° C. In general, the lower the air temperature and the greater the wind speed the greater the danger of superstructure icing.
Fog made up of supercooled droplets has been known on rare occasions to cause extreme superstructure icing, but, in general, fog is not a problem. Snow is generally not a serious problem either, since it does not readily stick to the superstructure, but tends to blow off. The most serious superstructure icing results from sea spray.
The rate and amount of ice accretion on any superstructure exposed to sea spray depends on: (1) wind strength, (2) length of time of droplet transport through cooler air, (3) ambient air temperature, (4) temperature of the structure, (5) initial temperature of the sea spray, and (6) size of the spray droplets. Several nomograms have been developed as guides to icing potential. One developed by Wise and Comiskey (1980) for the Gulf of Alaska, uses wind speed, air temperature, and sea temperature (Figure 5), and one by Sawada (1962) uses air temperature and wind speed (Figure 6), the major factors that influence superstructure icing. Both nomograms produce similar results. Greatest potential for superstucture icing occurs when a ship is heading into the wind at an angle of 15° to 45° to the wind; somewhat less potential when heading directly into the wind; and much less when heading downwind. Therefore, a ship's captain can take steps to lessen the threat to his ship when operating in an area of potential superstructure icing.
Wave Heights
Wave heights have been recorded in a relatively consistent quantitative code since the late 1940's. In 1963, provisions were made to report both sea and swell. Sea waves (or wind waves as they are sometimes called) are generated by local winds, whereas swell waves are those that have moved out of the generating area. Swell- wave direction is reported in today's observation code, but the sea-wave direction has not been reported since 1968, as it is assumed to be the same as the local wind direction. On ships without wind instruments, the sea
E10
0°N
50°
40C
30°
20C
10°
EQ S5
NORT
HW
EST
PACI
FIC
OCE
AN
TRO
PIC
AL
CYCL
ONE
S 01
JAN
198
8-06
SEP
198
8
08 -T
AN
30 MAY
04 JUN
20 JUN
26 JUN
12 JUL
29 JUL
07 AUG
10 AUG
15 AUG
28 AUG
31 AUG
30 AUG
02 SEP
TY ROY
TY SUSAN
TD
TY THAD
TS VANESSA
TY WARREN
TS AGNES
TS BILL
TS CLARA
TY DOYLE
TS ELSIE
TS ELSIE*
TY FABIAN
TS GAY
a =
TY S
USAN
b
a TS
AG
NES
c
= TS
GAY
MAX
IMUM
-SUS
TAIN
ED S
URFA
CE W
IND
64 K
T (3
3M/S
) O
R G
REAT
ER- - - —
— 3
4 TO
63K
T (1
8 TO
32M
/S)
3JK
T (I
7M/S
) O
R LE
SS
TY W
AR
REN
,
160°
W
Figu
re 2
. N
orth
wes
t Pa
cific
Oce
an T
ropi
cal
Cyc
lone
s J
anua
ry-S
epte
mbe
r 19
88 (
from
Joi
nt T
ypho
on W
arni
ng C
ente
r, 1
988)
£100
° N
50°
110
40
00
NO
RTH
WES
T PA
CIF
IC O
CEA
N
TRO
PIC
AL
CY
CLO
NES
07
SK
P 19
88 .
31 D
EC 1
988
14W
TY
01C
TY
QIC
Tt
1SH
TS
16H
TS
17M
TS
18H
TS
19H
TS
20W STY
21H
TY
22H
TY
23H
TY
24H
TY
2SH
TY
26H
TS
HAL
ULEKI
ULEKI
IHMA
JEFF
KIT
LEE
MAMIE
NELSON
ODESSA
PAT
RUBY
SKIP
TESS
VAL
08 SEP
28 AUG
08 SEP
12 SEP
14 SEP
19 SEP
21 SEP
22 SEP
01 OCT
11 OCT
18 OCT
21 OCT
03 NOV
04 NOV
22 DEC
17 SEP
08 SEP
13 SE
P15 SEP
16 SEP
22 SEP
24 SEP
23 SEP
08 OCT
16 OCT
22 OCT
28 OCT
11 NOV
06 NOV
26 DEC
• =
TSJ
EFF
b=
TSK
IT
c =
TS
MA
MIE
d
= TY
OD
ESSA
e
= TY
RU
BY
f =
TY
SK
IP
g= T
STE
SS
h =
TS V
AL
MA
XIM
UM
SU
STA
INED
SU
RFA
CE
WIN
D
64 K
1 (3
3M/S
) O
R G
REA
TER
_ _
_ _
- 3
4 TO
63K
T (1
8 TO
32M
/S)
33K
T (I
7M/S
) O
R L
ESS
TY O
DES
SA
TS J
EFF
y
TY
PAT
^
TS
MA
MIE
STY
NEL
SON
__
I
Figu
re 3
. N
orth
wes
t Pa
cific
Oce
an T
ropi
cal
Cyc
lone
s S
epte
mbe
r-D
ecem
ber
1988
(fr
om J
oint
Typ
hoon
War
ning
Cen
ter,
198
8)
WE
WE
30"£
M'E
W
E 0*
1(TW
2(TW
30"W
40
"W__
__SO
IW
W
65-W
SOUT
HERN
IC
E LI
MIT
Q4
FEB
86
1501
IH
't IK
Tt
IBt
17«
175t
1W
17
5TI
1WW
1S
5TI
lOTW
15
5'
4. Ty
pica
l wee
kly ic
e ch
art f
or th
e se
ctor
from
95°
W w
estw
ard
to 9
5° E
prep
ared
by
the
Join
t Ic
e Ce
nter
.
80 70 60 50 45Wind (Knots)
40 35 30 25
Sot Temperature (°F)O CM ^» «g 00 O O<*> <•> <•> « <*> <» M <0
Figure 5. Superstructure icing-rate nomogram. Follow the diagonal line to the sea temperature from the intersection between the air temperature and the wind speed to obtain icing conditions, classified as follows: light = 0-0.3 in.jhr.; moderate = 0.3-0.8 in./hr.; heavy = 0.8-2 in./hr.; very heavy = >2 in./hr. (adapted from Wise and Comiskey, 1980, using data from Pease and Comiskey, 1985)
10
5-r
10WIND SPEED (KNOTS)
Figure 6. Relationship between surface air temperature, wind speed, and icing on ships. A - light icing, B = moderate icing, and C = heavy icing (Sawada, 1962)
11
waves are often used to estimate the wind direction and speed, hence the wind-wave relationship can be expected to be fairly good.
Wind waves can be extremely complex, with seas being random, irregular, chaotic, and unpredictable even in the short term (Pierson, et al, 1955). Swell waves, on the other hand, are more regular, especially when moving through a region of calm winds. Swells also generally have longer wave periods and are more predictable.
Reported wave heights in ship observations are assumed to be significant wave heights ( H 1/3), which are defined as the average of the highest one-third of the waves in view. The observing procedure is highly subjective, and it is often very difficult for the observer to estimate the heights and periods, especially in confused seas. Because of the difficulty, wave observations are the least commonly observed elements and are subject to various biases. Generally the heights are too low, the periods too short and the sea-swell discrimination poor (Quayle, 1980). A good reference on waves is the newly revised Guide to Wave Analysis and Forecasting by the World Meteorological Organization (1988).
In developing the percent frequency of wintertime wave heights (>_ 6 meters, 20 feet), the data base of ship observations collected by the maritime nations of the world and archived at the National Climatic Data Center was used. In order to utilize the longest period of record possible, the higher of sea or swell was used to conform with the earlier reporting practices (1949-1962). If the heights were equal, the one with the longer period was used, and if only one was reported (sea or swell), then that height was used. Since most observations are collected by ships-of-opportunity, a ship is highly unlikely to be at a given location at the appropriate time to observe and record an extreme event, therefore only percentages above a given threshold can be calculated.
Tornadoes
On a local scale, the tornado is the most violent and destructive of all cyclonic storms. Although rare, the circulation of a tornado can also be anticyclonic (clockwise). Its vortex is normally 100 to 200 meters in diameter, with maximum winds estimated at 400 to 480 km/hr. General direction of movement is with the parent cumulonimbus cloud, which is basically steered by the upper level winds. Across the United States, this 4s most often from southwest to northeast. Typical midwestern tornadoes last a half hour, travel along the ground for 25 km and cut a swath 300 meters wide. On rare occasions they have cut swaths of up to a 2 km wide, stayed on the ground for distances in excess of 300 km, and lasted for over 3 hours.
Tornado activity is most frequently between 20° latitude and 50° latitude worldwide, with the greatest annual frequency occurring in the United States. On occasion, tornadoes do occur north of 50° across Canada, northern Europe, and the Soviet Union. The reason for this concentration within the midlatitudes is that the greatest contrast between air masses occurs here with the resulting unstable atmospheric conditions being favorable for severe thunderstorm and tornado development. Over the United States there are, on average, just under 750 tornadoes each year, while in Australia, where the second highest frequency is reported, the average is about one- fifth the U.S. number. Because of a low population density in many parts of Australia, however, a reliable count is difficult to obtain. A similar problem existed in the U.S. during the early years of documenting such storms. As the population increased and shifted, so did the statistics.
Atmospheric conditions are more often ideal for tornado activity in the midwestern United States than in any other global region because of topography and geographic location. Tornado activity is associated with a very unstable atmosphere, often developing along a sharp discontinuous boundary in the troposphere where cool dry air overrides warm moist air. In the United States the northerly orientation of the Rocky Mountains to the west and the Appalachian Mountains to the east help funnel moisture from the Gulf of Mexico into the central sections of the country. Other regions of the globe that have a good moisture source either have mountains that trend easterly, acting as barriers between the moisture and the cool air, or lack a good source region for cool dry air; both these factors impede tornado development. Tornadoes are also associated with the jet stream, a belt of strong winds in the upper troposphere at an altitude of about 10,000 meters. The jet stream varies from season to season and may even vary significantly from day to day. It results from the dynamics of contrasting temperatures within air masses. At its height above the surface, it is more responsive to the solar cycle and the resulting large scale seasonal changes in temperatures.
Solar heating at the Earth's surface increases the instability of the lower atmosphere leading to a peak in thunderstorms and tornado activity in the late afternoon near the time of maximum heating. Tornadoes are not just confined to land but occasionally occur over water where they are commonly known as waterspouts. Mostly observed over tropical and subtropical waters, waterspouts are typically less destructive than their counterparts over land.
12
Tornado frequencies appearing on the map were reprinted with the permission of the Munich Reinsurance Company which publishes such statistics in support of insurance specialists. Fujita (1987) also published similar global tornado statistics for the period 1930-1985.
In the early 1990's the lead time on tornado warnings should be substantially increased within the United States with the installation of the NEXRAD (Next Generation Weather Radar) system of doppler radars. These are to be located in a quasigeographical grid in order to improve coverage and reduce overlap. Increased lead times for the tornado warnings will be achieved by early identification of storm dynamics, particularly mesocyclones, from which tornadoes typically form, and more precise identification of tornado radar echoes themselves.
Doppler weather radars bounce an electronic signal off particles of water, ice, dust, or even insects floating in the atmosphere, and measure the time it takes the signal to return. This is used to determine the distance and direction of the object from the radar. Since signals reflected from moving objects undergo a change in frequency relative to the speed of an object moving toward or away from the radar antenna (the doppler effect), the radar and associated computer system can provide quantitative information on storm winds and their development and location.
13
Tsunamis
Patricia A. LockridgeNational Geophysical Data Center, National Oceanic and Atmospheric Administration
Boulder, Colorado 80303, USA
Tsunamis, commonly called seismic sea waves, or incorrectly, tidal waves, have been reported since ancient times. The first recorded tsunami occurred off the coast of Syria in 2000 B.C. Since then, tsunamis have been documented extensively, especially in Japan and the Mediterranean, and have been responsible for hundreds of thousands of fatalities and billions of dollars in damage worldwide. Table 1 is a selected listing of destructive 20th Century Pacific Ocean tsunamis.
Although tsunamis are devastating, they are somewhat rare. Major tsunamis occur in the Pacific Ocean region about once per decade and even more rarely in the Atlantic and Indian Oceans. One such major event occurred off the coast of Portugal in 1755. The waves were devastating locally and traveled throughout the Atlantic Ocean basin. Wave heights of as much as 6-8 meters were recorded in the West Indies. This example shows that when tsunamis are generated, their effects may be widespread. However, not every coastal area is at risk from this hazard. To properly understand the tsunami risk, we need to understand the nature of the tsunami itself and how it is generated.
Tsunami Generation
'Tsunami" is a Japanese word meaning "harbor wave." It is a water wave or a series of waves usually caused by an earthquake. A tsunami may be generated when a large mass of earth on the bottom of the ocean drops or rises, thereby displacing the column of water directly above it. This type of movement usually occurs along a tectonic plate boundary: that is, at the edge of a section of the Earth's lithosphere. Areas where the collision of two tectonic plates cause the oceanic plate to dip beneath the continental plate forming deep ocean trenches are called subduction zones. Most earthquakes that generate tsunamis occur offshore in these zones. Such subduction occurs along most of the island arcs and coastal areas of the Pacific, the notable exception being parts of the west coast of the United States and Canada. Movement along the faults there (except in Washington and Oregon) is horizontal with little vertical displacement; therefore few tsunamis are generated. Our knowledge of tsunami generation is still incomplete because the generation phenomena have not been observed nor measured directly. However, studies of tsunami data suggest that the size of a tsunami is directly related to the size of the earthquake, the area and shape of the earthquake rupture zone, the rate of displacement and sense of motion of the ocean floor in the source (epicentral) area, the amount of displacement of the rupture zone, and the depth of the water in the source area.
Tsunami Propagation and the Local Tsunami
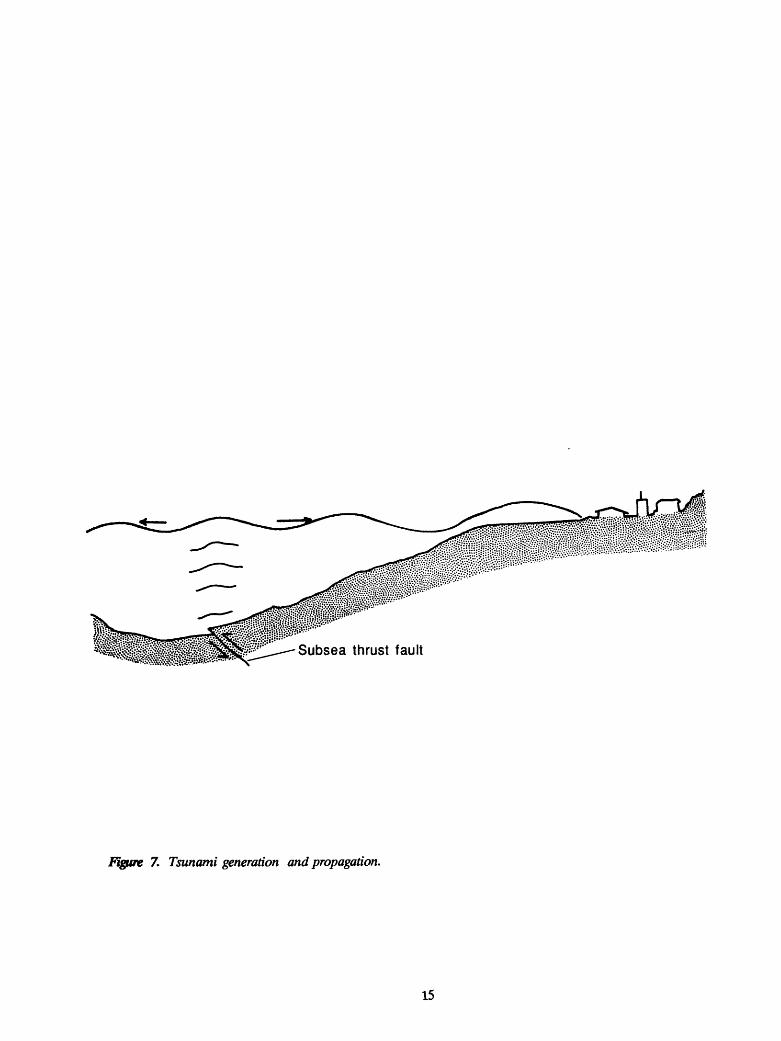
Once the entire column of water has been displaced, the tsunami waves propagate outward from the source at a speed of more than 1,000 km per hour. Because the height of the waves in the open ocean is commonly 1 m or less, and the wavelength is hundreds of kilometers, they pass unnoticed by observers in ships or planes in the region. As the tsunami enters shallow water along coastlines, however, the velocity of its waves reduces and the height of each wave increases. When the waves arrive onshore in the region of the earthquake source, a "local tsunami" is produced (Figure 7).
Large subaerial and submarine landslides may also cause locally destructive waves. Alaska has been the site of several landslide-generated tsunamis including one in 1958 that produced a splash wave that removed trees to a height of 525 m. A tsunami of at least 50 m propagated throughout the bay. The 1964 Prince William Sound earthquake triggered at least nine submarine landslides, which accounted for 71 to 82 of the 106 tsunami fatalities in Alaska. Volcanoes have generated significant tsunamis with death tolls as large as 30,000 from a single event. Roughly one-fourth of the deaths occurring during volcanic eruptions where tsunamis were generated were the result of the tsunami rather than the volcano. A tsunami is an effective transmitter of energy to areas outside the reach of the volcanic eruption. The most efficient methods of tsunami generation by volcanoes include disruption of a part of the volcanic edifice by subsidence, an explosion, a landslide, a glowing
14
Subsea thrust fault
Figure 7. Tsunami generation and propagation.
15
Tabl
e 1
- Des
truct
ive
20th
Cen
tury
Tsu
nam
is
Eve
nt D
ate
Y/M
/D
1902
02
26
1906
09
15
1907
01
04
1907
03
30
1911
06
15
1914
01
11
1917
06
25
1918
08
15
1919
05
07
1921
05
14
1922
11
11
1923
02
03
1923
04
13
1923
09
01
1926
09
17
1927
03
07
1927
11
21
1927
12
01
1928
08
04
1930
12
24
1931
10
03
1932
06
03
1932
06
22
1933
03
02
1933
12
25
1934
02
14
1940
08
02
1943
04
06
1944
12
07
1946
04
01
1946
12
20
1952
03
04
1952
11
04
1953
09
14
1955
04
19
1957
03
09
1958
11
06
1960
05
22
1960
11
20
Epi
cent
er
Dep
t!La
t(-
-S)
13.5
-7.0
1.5
3.0
28
.0-1
2.0
-16
.05
.4-6
.0
0.0
-29
.55
4.0
56
.53
5.3
-11
.635.6
-44
.6-0
.5-8
.3-1
.3
-10
.61
9.8
18
.739.1
12
.81
7.6
44.0
-30
.83
4.0
52
.833.0
42
.25
2.8
-18
.3-3
0.0
51
.54
4.3
-39.5
- 6
.8
Lo
ng
(~ =
W)
-89.5
149.0
97
.01
22
.0130.0
-76.6
-17
1.0
123.0
15
3.0
11
8.1
-70.0
16
1.0
162.6
13
9.5
16
0.0
135.0
- 7
3.0
119.5
121.5
14
4.3
16
1.7
-10
3.0
-10
4.7
144.7
1241
01
19
.01
39
.6-
72
.01
37
.1-1
63
.51
35
.6U
3.9
159.5
178.2
- 7
2.0
-17
5.7
14
8.9
- 74.5
- 8
0.8
(Kilo
n
Sha
llow
Sha
llow
Sha
llow
25 Sha
llow
Sha
llow
50 10 Sha
llow
Sha
llow
Sha
llow
Sha
llow
10 Sha
llow
10 33 30 25 20 45 30 60 30 10
033 93
Mag
nitu
de
Sour
ce L
ocat
ion
8.0
7.5
7.2
8.0
8.3
8.3
7.8
6.2
8.3
8.0
7.2
7.9
7.0
7.3
7.1
6.0
5.8
7.9
7.9
6.9
8.3
7.6
7.0
8.3
8.4
7.8
8.1
8.1
8.3
6.8
7.0
8.3
8.3
8.6
6.8
GUAT
EMAL
A-NI
CARA
GUA
W. SOLOMON
SEA
SU.
SUMATRA
CELEBES
SEA,
IN
DONE
SIA
RYUK
YU T
RENC
HPE
RUSA
MOA
ISLANDS
CELEBES
SEA, IN
DONE
SIA
BISMARCK SE
A, NE
W GU
INEA
MAKASSAR STRAIT,
INDO
NESI
AN. CH
ILE
KAMCHATKA
PENINSULA, USSR
KAMCHATKA
PENINSULA, US
SRTO
KAID
O, JAPAN
SOLOMON
ISLANDS
SW.
HONS
HU IS
LAND
, JA
PAN
S. CH
ILE
CELEBES
SEA, IN
DONE
SIA
FLOR
ES S
EA,
INDO
NESI
AME
LANE
SIA
SOLOMON
ISLANDS
CENTRAL
MEXICO
CENTRAL
MEXICO
SANRIKU, JAPAN
E. SAMAR
ISLA
ND,
PHIL
IPPI
NES
U. LUZON
ISLA
ND,
PHILIPPINES
W. HOKKAIDO IS
LAND
, JA
PAN
N. CENTRAL
CHILE
TOKAIDO, JA
PAN
E. ALEUTIAN ISLANDS
NANK
AIDO
, JA
PAN
SE.
HOKKAIDO IS
LAND
, JA
PAN
KAMC
HATK
A PENINSULA, US
SRFI
JI ISLANDS
N. CENTRAL
CHIL
ECENTRAL
ALEUTIAN ISLANDS
S. KU
RIL
ISLANDS, US
SRS. CH
ILE
PERU
ause
*
E E E E E E E E E E E E E E E E E V E E E E E V E E E E E E E E E&
LE E E E E
Run
-up
(Met
ers)
5.0
1.5
2.8
4.0
2.0
1.0
12.0
7.0 2.5
1.0
9.0
8.0
20
.01
2.1
2.0
11.3
2.8
15.0
10.0
2.5
9.0
2.8
6.0
29
.31.4
1.0
3.0
1.0
8.4
32
.06
.66
.5 18.0
2.0
1.0
16.0
4.0
25
.02.2
Dam
age/
Dea
ths*
MODE
RATE
/185
MODE
RATE
EXTE
NSIV
E/40
0EX
TENS
IVE
MODE
RATE
/6MODERATE
MODERATE
MODE
RATE
/MAN
YMODERATE
MODERATE
EXTE
NSIV
E/>1
00MO
DERA
TE/3
MODERATE
EXTE
NSIV
E/2,
144
MODERATE
EXTENSIVE/>3,000
MODERATE
MINO
R/14
MODE
RATE
/128
EXTE
NSIV
E/5
EXTE
NSIV
E/50
MODE
RATE
/425
MODE
RATE
EXTE
NSIV
E/3,
000
MODERATE/9
MODERATE
EXTENSIVE/7
MODERATE
EXTENSIVE/998
EXTE
NSIV
E/17
8EXTENSIVE/1,997
EXTENSIVE/33
EXTE
NSIV
E/MA
NYMINOR/FEU
EXTENSIVE/4
EXTE
NSIV
E/5
MODERATE
EXTE
NSIV
E/1,
590
MODE
RATE
/13
Tabl
e 1
- Des
truct
ive
20th
Cen
tury
Tsu
nam
is (c
ontin
ued)
Eve
nt D
ate
Y/M
/D
1964
03
28
1965
01
24
1966
10
17
1968
04
0119
68
05
1619
68
08
1419
69 0
2 23
1971
07
26
1975
07
21
1975
10
31
1975
11
29
1976
08
16
1977
08
1919
79
07
1819
79
09
1219
79
12
1219
83
05
26
Epi
cent
erLa
t Lo
ng(.
= S
) (-
= W
)
61.0
-1
47
.7-
2.4
1
26
.0-1
0.7
-
78.8
32.3
1
32
.540.7
1
43
.60.2
1
19
.8-3
.1
11
8.8
-4.9
1
53
.2-6
.6
15
5.0
12.5
1
26
.019.3
-1
55
.06.3
1
24
.0-1
1.0
1
18
.4-8
.5
123.
5-1
.7
13
5.9
1.6
-
79.3
40.4
13
9.1
Dep
th(K
ilom
eter
s)
33 6 40 32 33 23 33 43 49 50 05 Shallo
wS
ha
llow
05 28 15
Mag
nitu
de
Sour
ce L
ocat
ion
8.4
7.6
8.0
7.8
7.9
7.8
7.8
8.0
7.8
7.6
8.0
7.8
8.0
8.1
7.7
7.7
GULF
OF AL
ASKA
-ALA
SKA
PEN.
CERAM
ISLAND,
INDO
NESI
APE
RUSE
IKAI
DO,
JAPA
NJAPAN
TREN
CHBA
NDA
SEA
MAKA
SSAR
STRAIT,
INDONESIA
BISMARCK S
EA,
NEW
GUINEA
SOLOMON
ISLANDS
PHIL
IPPI
NE T
RENCH
HAWAII
MORO G
ULF,
PHILIPPINES
SUND
A ISLANDS
LOMBLEN
ISLAND,
INDO
NESI
AW. IR
IAN,
IN
DONE
SIA
COLO
MBIA
-ECU
ADOR
NOSHIRO, JA
PAN
Caus
e"
E E E E E E E E E E E E E E&L
E E E
Run-
up
(Met
ers)
70.0
4.0
3.0
2.4
5.0
10.0
3.4
2.0
7.2
5.0
10.0
10.0
2.0
5.0
4.5
Dam
age/
Dea
ths*
EXTE
NSIV
E/12
2MO
DERA
TE/7
1MODERATE
MODE
RATE
MODE
RATE
/52
EXTENSIVE/200
EXTE
NSIV
E/60
0MODERATE
MODE
RATE
/200
MODE
RATE
/1MO
DERA
TE/2
MODERATE/5,000
MODE
RATE
/189
EXTENSIVE/540
MODE
RATE
/100
EXTE
NSIV
E/50
0MO
DERA
TE/1
07
Caus
e: E
= Ea
rthqu
ake
V =
Vol
cano
L
= La
ndsli
de
Dam
age
Code
:M
oder
ate
Dam
age
= 10
0 ho
uses
, one
loca
tion
Exten
sive
Dam
age
= 10
00 h
ouse
s, on
e lo
catio
n or
man
y ho
uses
at s
ever
al lo
catio
ns
avalanche, or an earthquake accompanying or preceding the eruption. Roughly one-half of all volcanic tsunamis are generated at calderas or at cones within calderas. Submarine eruptions may also cause minor tsunamis. Tsunamis generated by volcanoes and landslides generally effect only the area within a few tens of kilometers of the origin.
Remote-Source Tsunamis
If the energy produced by the generating disturbance is sufficiently large, such as that released by a major deformation of the Earth's crust in a trench area, the resulting tsunami may cross the open ocean and emerge as a destructive wave many thousands of kilometers from its source. The severity of a tsunami of this type—called a "remote-source" tsunami—decreases slowly with distance. It may be observed and cause damage throughout the Pacific Ocean Basin as did the Chile tsunami of May 1960. The Kamchatka Peninsula, the Aleutian Islands, and the Gulf of Alaska have also experienced earthquakes that generated remote-source tsunamis affecting areas throughout the entire Pacific Basin (Figure 8).
Radiation of a remote-source tsunami from the focus of an earthquake is directional. Thus, tsunamis in Chile have a severe impact on Japan and those in the Gulf of Alaska effect the west coast of North America. Hawaii, which lies in the central Pacific Basin, has experienced tsunamis generated in all parts of the Pacific and is most vulnerable to damage from remote-source tsunamis generated both in the North Pacific and along the coast of South America (Figure 9). Because the speed of the tsunami depends on the depth of the ocean basin, the waves decrease in speed as they reach shallow water. The wave length is shortened, the energy within each wave is crowded into progressively less water, and the height of the wave increases. The tsunami may increase in height from 1 m in the open ocean to more than 30 m during runup on shore. If the tsunami encounters a coastal scarp, the height of its waves increases. Because a long-period wave can bend around obstacles, the tsunami can enter bays and gulfs having the most intricate shapes. Experience has shown that wave heights increase in bays that narrow from the entrance to the head, but decrease in bays that have narrow entrances. Protected shores of islands commonly receive less energy than unprotected coastlines lying in the direct path of an approaching tsunami, and islands in a group may "shadow" one another. Small islands often record reduced runups because the tsunami waves refract around them.
Tsunami Arrival
When the trough of the wave arrives first, the harbor or offshore area may be drained of its water, exposing fish and other sea life and unfamiliar ocean bottom. This phenomenon may be the only warning to residents that a large tsunami is approaching. Fatalities have occurred where people have tried to take advantage of this situation to gather fish or explore the strange landscape-the wave returns to cover the exposed coastline faster than the people can escape. A tsunami wave may break on the beach, appear as flooding, or form a "bore" as it moves up a river or stream. Although an interval of minutes—or perhaps hours—may elapse between the arrival of the first wave and succeeding waves, later waves are often higher than the first. Residents returning too soon to the waterfront, assuming that the worst has past, often become trapped by the waves.
Tsunami Warning Systems
Efforts to combat this geologic hazard include flood insurance, specially engineered construction in areas known to be prone to the hazard, public education, and tsunami-warning systems. The first tsunami-warning system began to operate following the disastrous Aleutian tsunami of April 1, 1946. The systemjias been expanded and improved over the years to provide information on the existence and expected arrival time of a tsunami, but it is not yet capable of providing information on the expected wave height. Many countries located around the perimeter of the Pacific Ocean cooperate with the Pacific Tsunami Warning Center located in Hawaii. In addition, many areas have their own warning centers for protection against local tsunamis. An updated warning system is being implemented that transmits real-time data from shore-based seismic sensors and tsunami sensors using synchronous meteorological satellites. Future additions to the Pacific Tsunami Warning Center may include ocean bottom sensors placed in the travel path of tsunamis to confirm that a tsunami has been generated. Use of these sensors should help to eliminate unnecessary warnings, and to provide scientists with critical data about the wave, undisturbed by shoaling processes.
18
1975-1,3 1868-1
X.. 1867-5 bMi918-5
1877-1 1819-1 1906-1
1960-1,3,44 1837-1
AREAS WHERE l DAMAGE OCCURRED' •
1 HAWAII2 ALASKA __3 WEST COAST4 SAMOA5 CARIBBEAN
20
140 120 100
Figure 8. Epicenters of earthquakes that generated destructive tsunamis in the United States and possessions. Numbers indicate year and area(s) where damage occurred.
19
Figure 9. Source areas of tsunamis recorded in Hawaii, 1900-88.
20
Earthquakes and Landslides
George W. MooreDepartment of Geosciences, Oregon State University
Corvallis, Oregon 97331, USA
and
Stuart P. NishenkoNational Earthquake Information Center, U.S. Geological Survey
Denver, Colorado, 80225, USA
Active Tectonic Plates
The Circum-Pacific region is comprised of 17 large and small tectonic plates that move slowly with respect to each other and to the interior of the Earth (Figure 10). Most of the earthquakes in this region occur along the boundaries of these plates where strain is slowly accumulated over tens to hundreds of years and then suddenly released.
Tectonic plates are about 100 kilometers thick, which is about the width of Lake Erie; this is only a tiny fraction of the radius of the Earth, which is roughly 6,000 km. We infer that the plates slip along on a lubricated layer at depth where the rock is especially pliable. This layer has low strength because of an interrelatioirwithin the Earth between temperature and pressure, two opposing influences on rock pliability. Rock becomes softer as temperature increases with depth, but it also becomes firmer as pressure increases. The two factors vary at different rates, and they interact to cause a maximum pliability or softness at a depth of about 100 km, creating the slippery zone on which the plates can shift.
Plates move at various rates. Their centers move faster than their sides, because they are shells that turn about rotation poles on opposite sides of the curved Earth. The fastest, the Pacific plate, moves at its center somewhat more than 10 centimeters per year toward the northwest. This is about as fast as fingernails grow. The North America plate moves 2 cm/yr toward the southwest, and the Australia-India plate moves 8 cm/yr toward the north.
The absolute movement of the plates translates into relative movement where they interact with one other. Relative plate movement is recognized at three kinds of plate boundaries: spreading axes, where plates move apart; subduction zones, where they converge together; and transform faults, where they slip horizontally past each other. Individual plate boundaries are continuous features.and do not end abruptly unless motion is transferred to another type of plate boundary.
At spreading axes, the divergence of adjacent plates creates "new ground," usually in the form of basaltic lava on the bottom of the ocean. The red-hot lava flows onto the seafloor with little violence, because a thin layer of steam insulates its surface from rapid chilling. Its internal heat, however, which extends to great depth in the oceanic crust and below, has another effect. It produces pliable rock that usually cannot sustain brittle fractures. Therefore, earthquakes at spreading axes are usually small and pose little threat to people.
Since the total surface area of the Earth does not change with time, the new ground created at spreading plate boundaries must be compensated for by destruction of surface area along other boundaries. This happens at subduction zones, where one plate, usually an oceanic plate that stands low at a deep-sea trench, slides beneath another plate and penetrates deeply into the Earth's mantle. Here the relatively narrow zone of contact between the two plates spawns the majority of the world's great earthquakes, those larger than magnitude 7 3/4. In addition, the deepest earthquakes in the world occur at subduction zones. Because the descending plate carries with it cold surficial layers many kilometers thick, and because it moves fast in terms of geologic time, rocks that are capable of brittle fracture, and hence capable of producing earthquakes, are carried to great depth. Many subduction-zone earthquakes emanate from a depth greater than 650 km, more than a tenth of the radius of the Earth.
21
PACIFIC PLATE
figure 10. Plates of the Circum-Pacific region, showing by full arrows the rate of plate movement in centimeters per year with respect to the body of the Earth, and by half arrows the relative movement between adjacent plates at major transform faults. Spreading axes are shown as double lines, transform faults as single lines, and subduction zones as barbed lines with the barbs pointing the way that the downgoing plate moves (after Moore, 1982).
22
Transform faults at the sides of the moving plates, when combined with spreading axes at the trailing edges and subduction zones at the leading edges, complete the geometry of the theory of plate tectonics. The transform faults, of which the San Andreas fault in California is the best known, host earthquakes intermediate in size between those at spreading axes and subduction zones. Because at transform faults the plates predominantly move horizontally, the rocks on each side of the boundary do not change level, and the temperature of the Earth's crust therefore increases normally and rapidly with depth. As a consequence, earthquakes at transform faults cannot be sustained below about 15 km. In general, the largest earthquakes along transform faults are smaller than those at subduction zones because earthquake magnitude is partly dependent on the area of the earthquake rupture surface, which is limited by the truncation at a depth of 15 km for transform faults.
Earthquake Epicenters
Shaking from an earthquake begins at the point in the Earth where the rock begins to rupture. Distant seismographs can easily detect the earthquake and locate this point, the earthquake focus, because the signal of its shaking is received first on a clean seismic record showing a smooth trace. Later, the shaking produced from many sources along the line of breakage that propagates across that earthquake rupture surface creates a large and confused record on the seismograph.
In a great earthquake, where the rupture surface is hundreds of kilometers in length, the line of breakage may take several minutes to reach the most distant point of the fault, even though it moves at the speed of a shock wave. The earthquake lasts an equally long time, which multiplies the damage, because the sustained shaking weakens buildings and prolongs the sliding of earthquake-triggered landslides.
On the Natural Hazards Map of the Circum-Pacific Region, earthquakes are plotted as epicenters. An epicenter is the point on the Earth's surface that lies directly above the earthquake focus. Only shallow-focus earthquakes are plotted, those shallower than a depth of 70 km. Therefore, this includes all earthquakes except those in the deeper parts of subduction zones, which, however, are well suggested on the map by the abundant shallow earthquakes at subduction zones. Earthquakes hundreds of kilometers below the surface have less effect on people near the epicenter than shallow-focus earthquakes of the same size, because they are farther away.
Earthquake magnitude is a measure of the size of an earthquake and is based on the amplitude or needle deflection of seismic waves recorded by a seismograph. Qualitatively, earthquakes may be classified as moderate (M 5-6), strong (M 6-7), major (M 7-7 3/4), and great (more than M 7 3/4) . The most commonly used scale, the Richter magnitude, is based on the logarithm to the base 10 of the amplitude of needle deflection in units of 0.001 millimeter on the record of a Wood-Anderson seismograph at an earthquake distance of 100 km. Examples are: Magnitude 3 = 1 mm amplitude; M 4 = 1 cm; M 5 = 10 cm. Extremely small earthquakes, such as those caused by the dropping of a pin, would have negative magnitude values.
For larger earthquakes, other magnitude scales have been developed to measure the size accurately. None of the magnitude scales should be confused with earthquake intensity, which is a measure of the amount of damage caused by an earthquake at a specific location. A commonly used measure of intensity is the Modified Mercalli Scale, a 12-point rating of the effect of earthquake-related ground shaking on people, buildings and the local landscape. The Modified Mercalli intensities range from I (instrumentally recorded but not felt) to XII (total destruction).
Earthquake energy increases by 30 times for each increase in 1 Richter magnitude. Hence, M 7 = 30 x 30 x 30 = 27,000 times the energy of M 4. An earthquake of M 8.5 has about 10,000 times the energy of the nuclear bomb that destroyed Hiroshima. The largest recorded earthquake, in Chile in 1960, had an energy of about 1026 ergs, or 100,000 times that of the bomb.
Historical Faulting
Although the rupture surfaces of most earthquakes are deep in the Earth, some intersect the land surface and form steps or lines of torn ground. Approximately 110 of these have been plotted on the Natural Hazards Map of the Circum-Pacific Region with the date of the historical faulting.
A clear relationship exists between earthquake magnitude and both the length of the surface rupture and the amount that the ground is offset. Typically, an earthquake of M 6 has a rupture length of 4 km and an offset of 20 cm, whereas an earthquake of M 8 has a length of 300 km and an offset of 10 m (Bonilla and others, 1984).
The plate boundaries, shallow-focus earthquakes, and historical faulting on the Natural Hazards Map roughly define the areas most subject to dangerous earthquakes in the Circum-Pacific Region. Current research in
23
seismology is directed toward specifying when and where large and great earthquakes will occur in the future. By using geologic and historic information, scientists have been able to estimate return or repeat times for certain earthquakes along particular parts of transform and subduction plate boundaries (see Nishenko, 1989, for a review).
Throughout the Circum-Pacific region, the repeat times of great earthquakes range from 20 to more than 200 years. This variability reflects differences in rate of plate motion, age of the plates, and size of fault zones. Given this variability in the return times for great earthquakes, scientists can provide estimates only to within 1 to 2 decades (Figure 11). More precise estimates for the time of a future event require the observation of precursory phenomena, which may be able to narrow the tune windows to months or days.
Long-term forecasts provide important information for disaster mitigation and planning. Protection against earthquakes can be accomplished most effectively by proper planning. Steel and concrete buildings that have been designed according to modern earthquake standards generally will survive even the greatest earthquakes. So will flexible wood-frame homes, particularly when the walls are bolted to the foundation. The greatest danger rests with older nonreinforced brick and masonry structures. People can also protect themselves and their property by not placing heavy objects on high shelves, and by strapping gas furnaces and water heaters to the wall. Fire extinguishers and battery-operated radios and lights are useful in dealing with emergencies from hazards of any sort.
Landslides
Landslide is the general term for masses of rock or soil that move downslope and are prevalent where ground slopes are steep. Landslides are among the most dangerous natural hazards to people, taking hundreds of lives each year throughout the world, and they are the most costly natural hazard, causing a property loss of tens of billions of dollars annually. Many of the most dangerous and costly landslides lie within the zones delineated on the Natural Hazards Map of the Circum-Pacific Region by the plate boundaries, earthquake epicenters, and historical faulting.
Precipitation is the principal triggering agent for landslides, with earthquake shaking, volcanism, artificial excavation, and denudation of hillslope vegetation accounting for the remainder (Brabb and Harrod, 1989). Unregulated human activities, such as overcultivation, deforestation, and spacing dwellings too closely on slopes, are causing ever increasing landslide losses.
Active landslides and dormant ones that may move again can be identified on aerial photographs by their distinctive hummocky topography, head scarps, and bulbous toes. On the ground, they exhibit undrained basins and commonly carry "pistol-grip" trees whose lower trunks bend downslope—and look like a pistol pointed toward the sky—because of the back rotation of the underlying landslide.
In some areas, geologists have prepared landslide-inventory maps. Even more useful are landslide- susceptibility maps, made by correlating data from the inventory maps with data on the slope, rock type, and structure.
Citizens can reduce the public hazard and cost of landsliding by voting the funds for increased landslide- susceptibility mapping, for strong local surface-grading ordinances, and for local land-use planning that restricts development of unstable areas. A wise householder will seek advice before occupying a home on an old landslide, or one that has unstable ground above, or is undercut below. Beware of rock strata dipping parallel with surface slopes, because they are particularly landslide-prone. Also, be alert to neighbors or road builders who may cut a notch into the slope below your property. Finally, when rainfall approaches 250 mm (10 inches) per day, people living on or near steep slopes may wish to move temporarily to safer areas.
24
Delarof Islands
Southeast Guatemala.*
Jama, Ecuador •East New BritainBritain.% North Bougainville
Vankolo Island • South Santo Island \ • Central Tonga
50°
figure 11. Plate-boundary segments in the Circum-Pacific region on which the probability of experiencing an earthquake with a surface-wave magnitude greater than 7.0 during 1989-99 is 50% or more.
25
Volcanic Hazards
Tom SimkinSmithsonian Institution, Washington, D.C. 20560, USA
and
Chris NewhallU.S. Geological Survey, Reston, Virginia 22092, USA
Volcanoes provide our society with important resources, including scenic beauty, but these majestic mountains also present us with a variety of hazards. This map locates all volcanoes believed to have been active in the past 10,000 years, and thus includes most (but probably not all) volcanoes likely to erupt in the near future. One of the most important lessons of volcanology is that the repose time of many sleeping giants is far longer than human record keeping. Indeed, the violent awakening of volcanoes long believed dead has resulted in most of history's greatest volcanic disasters.
Volcanoes
Most of the world's volcanism is concentrated along the margins of the large tectonic plates that make a slowly-moving jigsaw puzzle out of the Earth's surface. Where the plates are pulling apart, lava eruptions are common—producing roughly 3/4 of the new lava reaching the Earth's surface—but nearly all of this is at the midocean ridge crests under at least 1 kilometer of seawater. Little is known about this dominant form of global volcanism, but it poses virtually no immediate threat to the planet's human population. Where the plates are coming together, however, volcanoes are commonly found hi long, linear belts, often forming island chains, like the Aleutians, or capping mountain ranges, like the Cascades. These volcanoes erupt more violently, a consequence of magma formed by the convergence of continental and oceanic plates. They account for nearly 95% of historic eruptions, and an even higher proportion of destructive eruptions. The third major type of volcano, formed over hotspots fixed deep in the Earth and feeding new lava vertically through whatever plate lies above, accounts for only a volumetrically small proportion of the world's volcanism. Hotspot volcanism on oceanic crust can be damaging (but rarely fatal) and that on continental crust can be catastrophic (but is very rare).
Of the world's 541 volcanoes that have erupted in historic time, about 60 are active each year; more than a dozen of these, like Italy's Stromboli, display perennial activity over decades or centuries. Eruptions can show a wide spectrum of violence, however, and their hazards range from the nuisance of light ashfall to the global effects of catastrophic eruptions larger than anything known in the historic record (but abundantly documented in the recent geologic record). Eruptions the size of Mount St. Helens' in 1980 take place somewhere on Earth perhaps once a decade, on the average, and those the size of Krakatau's in 1883, two or three times a century. Eruptions thousands of times larger than Mount St. Helens' are known from the geologic record, devastating huge areas and causing global climatic cooling, but their frequency is not well known. Thus, the specific type of volcano symbol on the accompanying hazard map cannot be used as a guide to relative hazard. Volcanoes that have erupted recently (marked by closed starbursts) are likely to be better known names, but the historic record is so short in many parts of the world that the absence of historic activity (marked by x) at a volcano there gives no assurance that it will not erupt violently in the future.
Hazards
Volcanic hazards are many and varied. Eruptions commonly present multiple hazards, and these may range from nuisance to catastrophe, depending on one's location and the size or type of eruption. Some dangers even linger long after the eruption has ended.
The products of volcanoes—lava, ash, and gas—present the most direct and obvious hazards. Lava flows have caused enormous destruction of property to residents living near or on active volcanoes, but most move slowly
26
enough that human fatalities are avoidable. Only about Vtth of the world's historic eruptions have produced lava flows, and these are concentrated on oceanic islands like Hawaii, Gala'pagos, and R6union, where basaltic hotspot volcanism prevails. Near convergent plate margins, where the more viscous and gas-rich magmas from subduction zones prevail, the explosive eruption of finely fragmented magma produces large quantities of ash. This material may be driven high into the atmosphere and carried tens to hundreds of kilometers downwind, where accumulation can create severe problems, especially where ashfaH is heavy enough to cause roof collapse. A more lethal form of ash deposition is a pyroclastic flow, the hot glowing avalanche of ash and gas that moves down steep volcanic slopes at hurricane speeds, devastating everything in its path. They are known from more than 300 historic eruptions—the best known probably being the 1902 disaster at Mont Pel6e in the West Indies— and have been responsible for more fatalities than any other single volcanic agent.
In addition to being the driving force for explosive volcanism, and a major component of pyroclastic flows, volcanic gas itself has been a killer in some eruptions and contributed to indirect deaths at long distances from erupting volcanoes. Fluorine carried downwind from a major Icelandic eruption in 1783 coated grasses that were then ingested by livestock, and the resulting deaths led to widespread famine and, in turn, to nearly 10,000 human fatalities. Modern communications and emergency-relief procedures would greatly reduce the likelihood of such an indirect volcanic death toll today, but the 1986 disaster in Cameroon, when CO2 of volcanic (but not necessarily eruptive) origin killed 1,700, showed how devastating volcanic gas can be.
Mudflows and debris flows are among the most serious volcanic hazards, and they may occur long after an eruption has ended. Explosive volcanoes produce abundant loose ash deposits and steep slopes—two essential ingredients of mudflows—and often provide the third—a large and relatively instantaneous water supply—through eruption-related downpours, crater lakes, or rapidly melted snowcaps. The resulting slurry of mud and rock is particularly dangerous because of its erosive ability and the momentum that can carry its devastating load far beyond the lower slopes of the volcano. The 1985 tragedy at Colombia's Nevado del Ruiz is only the most recent prominent example of this common, serious volcanic hazard.
Far less common, but equally devastating, are the tsunamis that have accompanied several famous eruptions. These huge waves reached heights of 40 m near Krakatau in 1883, and killed on the order of 34,000 people. The mechanisms producing these waves include submarine faulting (as in caldera collapse), the impact of debris flows (or pyroclastic flows) with water, submarine eruption, or (as seems likely) some combination of the preceding. This hazard must be considered for the many volcanoes on or near a large body of water.
Coping with Volcanic Hazards
In general, a volcano's past is the key to its future. The character, spread, and recurrence frequency of a volcano's past eruptions can be reconstructed from the geologic record of its deposits, supplemented by historical accounts. Pyroclastic deposits on the lower flanks of a volcano (and beyond) offer the most pertinent information, because they can be correlated into a stratigraphic section with age control, and represent explosive eruptions that pose the greatest threat to people living around the volcano. The distribution of each type of deposit can be mapped to show the most hazardous areas, and dated details of the eruptive record can reveal any cyclical patterns, long-term changes in activity, and the approximate probability of an eruption within the next few years or decades. All of this information can be summarized in a hazard map (Figure 12) with an accompanying text, not unlike this text but specific for each volcano.
To be perfectly safe, people should avoid volcanoes entirely, but few want to give up the benefits of living near them. Geophysical monitoring (seismic, geodetic, magnetic, gravity, electrical, thermal), geochemical monitoring (principally of the composition, temperature, and flux of fumarolic gases), visual monitoring, and in some instances, petrologic monitoring of freshly erupted products can indicate a volcano's current state, and thus the degree to which hazard is increased or decreased from the long-term average. Most volcanoes have short lived peaks of hazard just before and during eruptions, separated by long periods of relative quiet and low hazard—distinguishable by monitoring. Occasionally, one can recognize and then watch for precursors of eruptions; more often, precursors of past eruptions are poorly known, and volcanologists must treat each change as a potential eruption precursor and go through a process of interpretation, trial, and error until the behavior and eruption precursors of that volcano are well understood. Then, unless the volcano's behavior changes markedly, people can be given enough warning to move away from the volcano or take other precautions during its most hazardous periods.
People living near volcanoes can reduce their risk substantially if they learn about the hazards they face, avoid building in the most hazardous areas, have up-to-date forecasts, and take practical measures to lower immediate risk (for example, by sweeping airfall ash from rooftops before they collapse, or by moving to high ground and
27
122'
47° -
EXPLANATION Zones of potential hazard
Lava flows, pyroclastic flows, mudflows, floods
Mudflows, floodsFloods
Urban area Community Dam
\ -
Area in which *5-35 cm of
tephra could fall j
Figure 12. Map of the region near Mount Rainier, Washington, showing zones of potential hazards from future eruptions (after Crandall and others, 1979).
28
out of the path of hazardous flows). Unfortunately, mitigating volcanic risk is rarely a political priority until after a volcanic disaster. To prevent such disasters, communities must decide upon acceptable levels of risk and act accordingly, before the next eruption—by regulating land use, developing a forecasting and warning capability, and planning, testing, and being prepared to take emergency measures such as evacuations when needed.
Volcano-Related PublicationsVolcanic-hazards studies cover a wide variety of literature, and events of the past decade have led to many
recent publications. Readers interested in the general field of volcanology might consult the following works, listed in order of increasing depth and technical treatment: Sigurdsson (1987), Decker and Decker (1989), Macdonald (1972), and Williams and McBirney (1979). Recent books by Blong (1984), Latter (1989), and Tilling (1989a) review volcanic hazards at some length, as do shorter booklets by Crandell and others (1984) and Tomblin(1985), and review articles by Walker (1982), Peterson (1986), and Tilling (1989b). A successful international conference devoted to volcanic hazard was held in Japan in 1988, and its proceedings volume (Kagoshima Prefectural Government, 1989) contains much useful information, particularly on the advanced protection and monitoring techniques of that nation. Fisher and Schmincke's text (1984) details pyroclastic processes-the greatest threat from most volcanoes—while the Smithsonian/SEAN book (1989) provides valuable perspective through case histories of a wide variety of recent volcanism. Eruption forecasting has been reviewed by Decker (1986), and the monograph by NewhaJl and Dzurisin (1988) summarizes a wealth of information on precursor events before historic eruptions (and during some false alarms).
References Cited
Blong, R J., 1984, Volcanic hazards: a sourcebook on the effects of eruptions: Academic Press, Sydney, 424 p.
Bonilla, M.G., R.K. Mark, and J J. Lienkaemper, 1984, Statistical relations among earthquake magnitude, surface rupture length, and surface fault displacement: Seismological Society of America Bulletin, v. 74, p. 2379-2441.
Brabb, E.E., and B.L. Harrod, eds., 1989, Landslides: extent and significance: Rotterdam, A. A. Balkema, 385 p.
Commander, Naval Oceanography Command, 1985-1986, Sea ice climatic atlas: Antarctic (v. 1), May 1985, NAVAIR 50-1C-540, 138 p.; Arctic East (v. 2), June 1986, NAVAIR 50-1C-541,154 p.; Arctic West (v. 3), June 1986, NAVAIR 50-1C-542, 154 p.
Crandell, D.R., B. Booth, K. Kusumadinata, D. Shimozuru, G.P.L Walker, and D. Westercamp, 1984, Source book forvolcanic-hazard zonation: UNESCO, Paris, 97 p.
Crandell, D.R., D.R. Mullineaux, and C.D. Miller, 1979, Volcanic-hazards studies in the Cascade Range of the western United States, in P.D. Sheets and D.K. Grayson, eds., Volcanic activity and human ecology: Academic Press, New York, p. 195-219.
Crutcher, H.L., and R.G. Quayle, 1974, Mariners worldwide climatic guide to tropical storms at sea: Naval Weather Service Command, NAVAIR 50-1C-61, 430 p.
Decker, R.W., 1986, Forecasting volcanic eruptions: Annual Review of Earth and Planetary Sciences, v. 14, p. 267-291.
Decker, R.W., and B. Decker, 1989, Volcanoes (Second Edition): W.H. Freeman, New York, 285 p.
Fisher, R.V., and H.-U. Schmincke, 1984, Pyroclastic rocks: Springer-Verlag, Heidelberg, 472 p.
29
Fujita, T.T., 1987, U.S. tornadoes, part 1, 70-year statistics: University of Chicago Press, 105 p.
Gray, W.M., 1967, Global view of the origin of tropical disturbances and storms: Colorado State University, Fort Collins, Atmospheric Sciences Paper 114, 105 p.
Joint Typhoon Warning Center, 1988, Annual tropical cyclone report: U.S. Naval Oceanography Command Center, Joint Typhoon Warning Center, Guam, Mariana Islands, 215 p.
Kagoshima Prefectural Government, 1989, Proceedings of the Kagoshima International Conference on Volcanoes: Kagoshima City, Japan, 923 p.
Latter, J.H., ed., 1989, Volcanic hazards: assessment and monitoring: Springer-Verlag, Heidelberg, 625 p.
Moore, G.W., 1982, Explanatory notes for the plate-tectonic map of the Circum-Pacific region: Tulsa, American Association of Petroleum Geologists, 14 p.
National Hurricane Center, 1982, A compilation of eastern and central North Pacific tropical cyclone data: NOAA Technical Memorandum NWS NHC 16, Miami, Florida, 15 p.
National Hurricane Center, 1984, Frequency and motion of western North Pacific tropical cyclones: NOAA Technical Memorandum NWS NHC 23, Miami, Florida, 71 p.
National Research Council, 1987, Advisory Committee on the International Decade for Natural Hazard Reduction, Confronting Natural Disasters: An International Decade for Natural Hazard Reduction, National Academy Press, Washington, D.C.,
Newhall, C.G., and D. Dzurisin, 1988, Historical unrest at large calderas of the world: U.S. Geological Survey Bulletin 1855, 1108 p.
Nishenko, S.P. 1989, Circum-Pacific seismic potential 1989-1999: U.S. Geological Survey Open-File Report 89- 85 (map) and 89-86 (text), scale 1:33,500,000, 126 p.
Pease, C.H., and A.L. Comiskey, 1985, Vessel icing in Alaskan waters, 1979-1984 data set: U.S. National Oceanic and Atmospheric Administration, Pacific Marine Environmental Laboratory, NOAA Data Report tRL PMEL-14, 16 p.
Peterson, D.W., 1986, Volcanic hazards and public response: Journal of Geophysical Research, v. 93, p. 4161-4170.
Pierson, WJ., Jr., G. Neuman, and R.W. James, 1955, Practical methods for observing and forecasting ocean waves by means of wave spectra and statistics: U.S. Navy Hydrographic Office Publication 603, 304 p.
Quayle, R.G., 1980, Climatic comparisons of estimated and measured winds from ships: Journal of Applied Meteorology, v. 19, p. 142-156.
Sigurdsson, H., 1987, Volcanology, in Encyclopedia of Physical Sciences and Technology. Academic Press, San Diego, v. 14, p. 406-435.
Smithsonian Institution/SEAN, 1989, Global volcanism 1975-1985: Prentice Hall, Englewood Cliffs, and American Geophysical Union, Washington, 657 p.
Swada, T. 1962, Icing and ships and its forecasting: Journal of the Japan Society of Snow and Ice, v. 24, p. 12-14.
30
Tilling, RJ., ed., 1989a, Short course in geology, v. 1, Volcanic Hazards: American Geophysical Union, Washington, 123 p.
Tilling, R J., 1989b, Volcanic hazards and their mitigation: Reviews of Geophysics, v. 27, p. 237-269.
Tomblin, J., 1985, Volcanic emergency management: Office of the United Nations Disaster Relief Coordinator United Nations, New York, 86 p.
UJN. General Assembly, 1987, International Decade for Natural Disaster Reduction, U.N. Resolution 42/169, 42nd Session, New York
Walker, G.PX., 1982, Volcanic hazards: ISR Interdisciplinary Science Review, v. 7, p. 148-157.
Williams, H., and A.R. McBirney, 1979, Volcanology: Freeman, Cooper, San Francisco, 397 p.
Wise, J.L., and A.L. Comiskey, 1980, Superstructure icing in Alaskan Waters: Pacific Marine Environmental Laboratory, Seattle, U.S. National Oceanic and Atmospheric Administration, NOAA Special Report, 30 p.
World Meteorological Organization, Geneva, 1988, Guide to wave analysis and forecasting: Publication 702, 229 p.