Exploration of Resource and Transmission Expansion Decisions in the Western Renewable Energy in the Western Renewable Energy Zone (WREZ) Initiative Andrew Mills, Amol Phadke, and Ryan Wiser Lawrence Berkeley National Laboratory February 2010 Energy Analysis Department 1 This analysis was funded by the U.S. Department of Energy, Office of Electricity Delivery and Energy Reliability, Permitting, Siting and Analysis Division
Transcript
Exploration of Resource and Transmission Expansion Decisions in the Western Renewable Energyin the Western Renewable Energy
Zone (WREZ) InitiativeAndrew Mills, Amol Phadke, and Ryan Wiser
Lawrence Berkeley National Laboratory
February 2010
Energy Analysis Department1
This analysis was funded by the U.S. Department of Energy, Office of Electricity Delivery and Energy Reliability, Permitting, Siting and Analysis Division
Resource and Transmission Expansion Resource and Transmission Expansion Decisions in WREZ: Presentation OutlineDecisions in WREZ: Presentation OutlineDecisions in WREZ: Presentation OutlineDecisions in WREZ: Presentation Outline1. Motivation and Scope2 Summary of Key Findings2. Summary of Key Findings3. Framework for Comparing WREZ Resources
a) Bus-bar Costs
b) Transmission and Line Losses Cost
c) Market Value Adjustment Factors
d) Advantages and Disadvantages of WREZ Model and Framework
4. Resultsa) Impact of Level of Renewable Energy (RE) Demand
b) Base Case: WECC-wide 33% RE Delivered to Each Load Zoneb) Base Case: WECC-wide 33% RE Delivered to Each Load Zone
c) Alternative Scenarios with 33% RE Delivered to Each Load Zone
d) Alternative Scenarios with Tradable Renewable Energy Credits
5 C l i d F t R h
Energy Analysis Department2
5. Conclusions and Future Research
Project OverviewProject Overview
Motivation: The WREZ Initiative identified renewable resource hubs composed of environmentally preferred, high quality resources sufficient to justify building new high-voltage transmission
- Which WREZ renewable resources might be economically attractive for meeting aggressive renewable energy (RE) targets in the West?
- What transmission might need to be built to access those resources? Who should cooperate in developing the transmission?
- What factors contribute to the costs of meeting renewable energy targets?
Scope: Examine at a screening-level the sensitivity of least-cost WREZ resource selection, required transmission expansion, and costs of meeting aggressive Western RE targets to different assumptions and policy decisions
- How do resource selection and transmission expansion decisions change with assumptions and changes in policies?
- What are the important assumptions or factors that should be explicitly
Energy Analysis Department3
What are the important assumptions or factors that should be explicitly considered in more-detailed resource and transmission planning forums?
Summary of Key FindingsSummary of Key Findings• Increasing renewable energy demands increase costs, as less economically
attractive resources are required to meet higher targets• Wind energy is the largest contributor to meeting WECC wide renewable• Wind energy is the largest contributor to meeting WECC-wide renewable
energy demands when only resources from the WREZ resource hubs are considered
• Hydropower, biomass, and geothermal contributions do not change significantly with increasing renewable demand or changes to keysignificantly with increasing renewable demand or changes to key assumptions
• Key uncertainties can shift the balance between wind and solar in the renewable resource portfolio
• The costs of meeting renewable energy targets within WECC are heterogeneous without Renewable Energy Credits (RECs)
• Transmission investment costs are substantial, but are only a fraction of the costs required to meet a 33% renewable energy targetcosts required to meet a 33% renewable energy target
• Long transmission lines can be economically justified in particular cases, but the majority of transmission lines are found to be relatively short
• Transmission expansion needs and overall WECC-wide costs can be d d th h th f REC
Energy Analysis Department4
reduced through the use of RECs
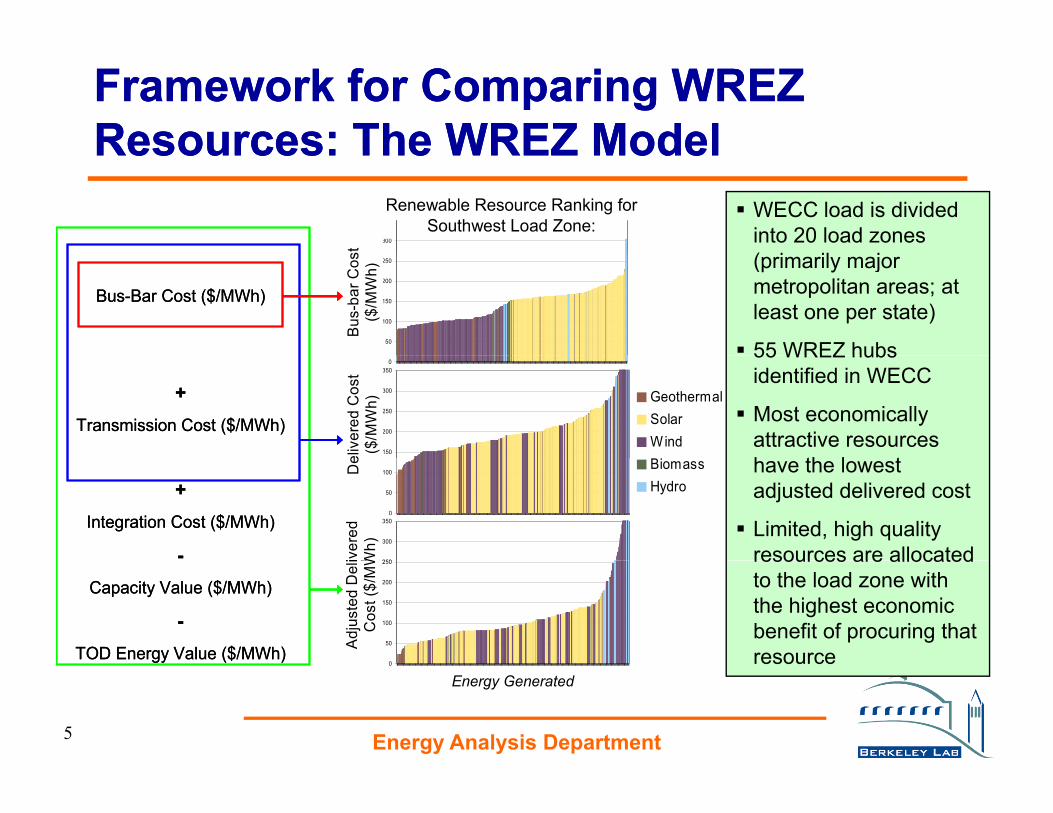
Framework for Comparing WREZ Framework for Comparing WREZ Resources: The WREZ ModelResources: The WREZ ModelResources: The WREZ ModelResources: The WREZ Model
300
350
Renewable Resource Ranking for Southwest Load Zone:
st 300
350
Renewable Resource Ranking for Southwest Load Zone:
st
WECC load is divided into 20 load zones ( i il j
50
100
150
200
250
Bus
-bar
Cos
t
($/M
Wh)
Bus-Bar Cost ($/MWh)
Bus
-bar
Cos
($/M
Wh)
50
100
150
200
250
Bus
-bar
Cos
t
($/M
Wh)
Bus-Bar Cost ($/MWh)
Bus
-bar
Cos
($/M
Wh) (primarily major
metropolitan areas; at least one per state)
55 WREZ hubs0
150
200
250
300
350ve
red
Cos
t
($/M
Wh)
+Transmission Cost ($/MWh)
GeothermalSolarWind
eliv
ered
Cos
t ($
/MW
h)0
150
200
250
300
350ve
red
Cos
t
($/M
Wh)
+Transmission Cost ($/MWh)
GeothermalSolarWind
eliv
ered
Cos
t ($
/MW
h)55 WREZ hubs identified in WECC
Most economically attractive resources h th l t
0
50
100Del
iv (
250
300
350
Cos
t
+Integration Cost ($/MWh)
-
BiomassHydro
iver
ed
Wh)
De
0
50
100Del
iv (
250
300
350
Cos
t
+Integration Cost ($/MWh)
-
BiomassHydro
iver
ed
Wh)
De have the lowest
adjusted delivered cost
Limited, high quality resources are allocated
0
50
100
150
200
250
Adj
uste
d D
eliv
ered
C($
/MW
h)Capacity Value ($/MWh)
-TOD Energy Value ($/MWh) A
djus
ted
Del
iC
ost (
$/M
W
0
50
100
150
200
250
Adj
uste
d D
eliv
ered
C($
/MW
h)Capacity Value ($/MWh)
-TOD Energy Value ($/MWh) A
djus
ted
Del
iC
ost (
$/M
W resources are allocated to the load zone with the highest economic benefit of procuring that resource
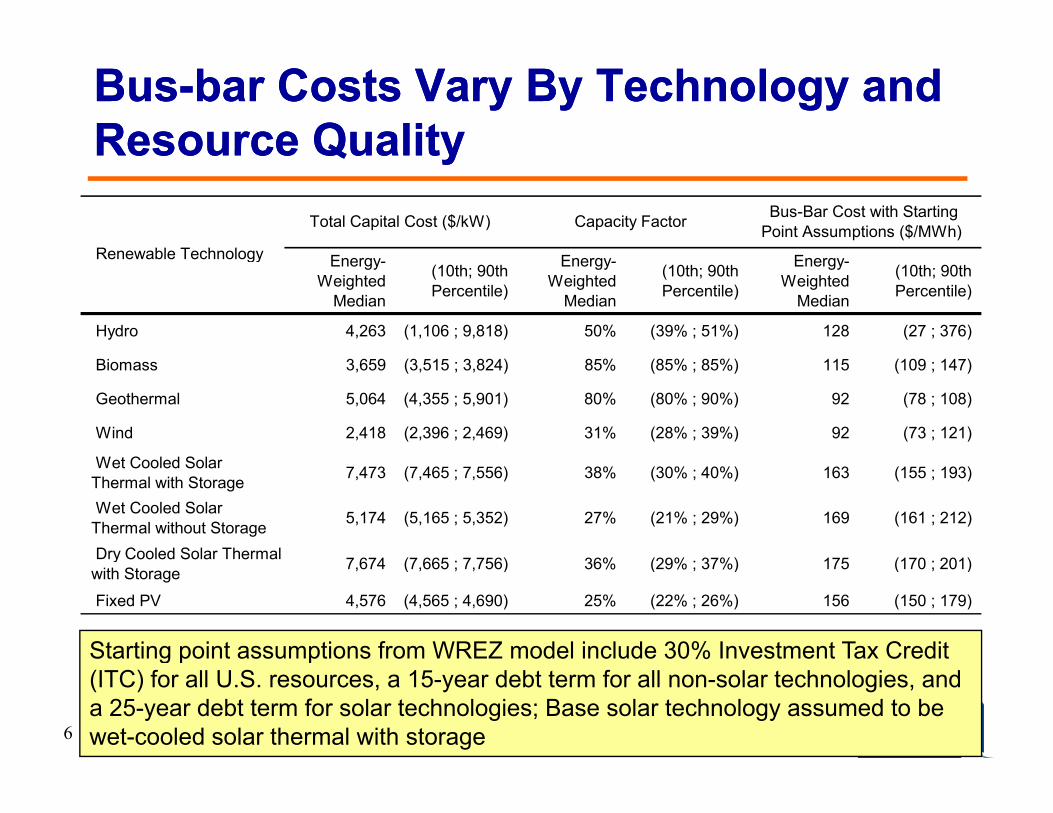
Starting point assumptions from WREZ model include 30% Investment Tax Credit
Energy Analysis Department6
g p p(ITC) for all U.S. resources, a 15-year debt term for all non-solar technologies, and a 25-year debt term for solar technologies; Base solar technology assumed to be wet-cooled solar thermal with storage
Transmission Costs Depend on Transmission Costs Depend on Distance from Resource to Load ZoneDistance from Resource to Load ZoneDistance from Resource to Load ZoneDistance from Resource to Load Zone
All WREZ resources are assumed to require new transmission capacityrequire new transmission capacity
Transmission distance is largely based on following existing rights-of-way
Starting point transmission costs are allocated assuming a pro-rata share of a single circuit 500 kV lineg
Transmission utilization is assumed to equal capacity factor of renewable resourceresource
Transmission losses are 0.7% per 100 miles
Energy Analysis Department7
Transmission cost of 500 kV line total an assumed $1,564/MW-mi
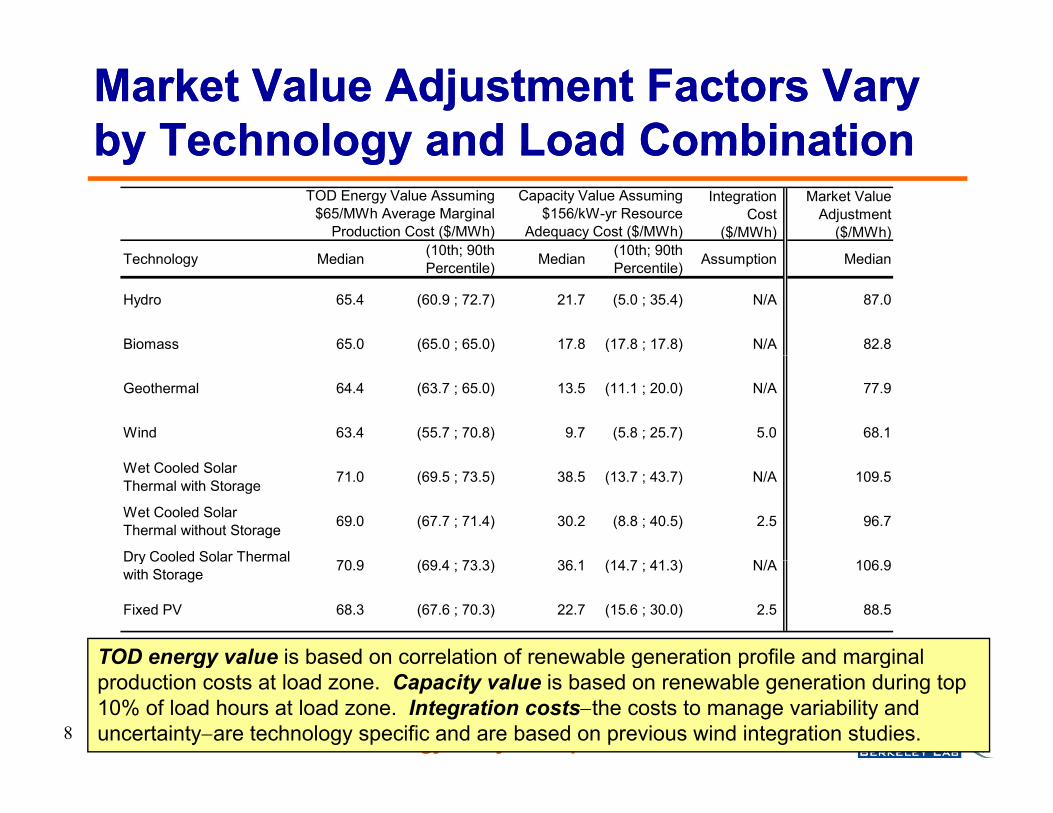
Market Value Adjustment Factors Vary Market Value Adjustment Factors Vary by Technology and Load Combinationby Technology and Load Combinationby Technology and Load Combinationby Technology and Load Combination
Integration Cost
($/MWh)
Market Value Adjustment
($/MWh)(10th; 90th (10th; 90th
TOD Energy Value Assuming $65/MWh Average Marginal
Production Cost ($/MWh)
Capacity Value Assuming $156/kW-yr Resource
Adequacy Cost ($/MWh)
Technology Median (10th; 90th Percentile) Median (10th; 90th
TOD energy value is based on correlation of renewable generation profile and marginal production costs at load zone. Capacity value is based on renewable generation during top 10% of load hours at load zone. Integration coststhe costs to manage variability and uncertaintyare technology specific and are based on previous wind integration studies.
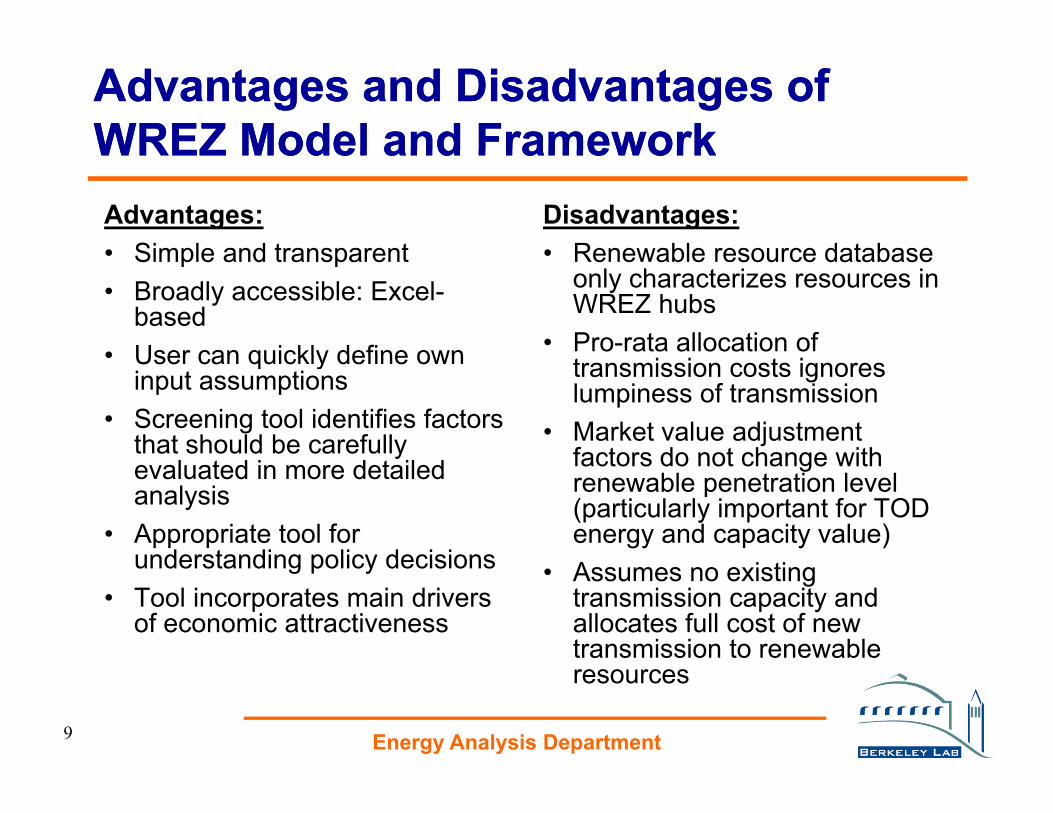
Advantages and Disadvantages of Advantages and Disadvantages of WREZ Model and FrameworkWREZ Model and FrameworkWREZ Model and FrameworkWREZ Model and FrameworkAdvantages:• Simple and transparent
Disadvantages:• Renewable resource database• Simple and transparent
• Broadly accessible: Excel-based
• User can quickly define own
• Renewable resource database only characterizes resources in WREZ hubs
• Pro-rata allocation of • User can quickly define own input assumptions
• Screening tool identifies factors that should be carefully
transmission costs ignores lumpiness of transmission
• Market value adjustment factors do not change withy
evaluated in more detailed analysis
• Appropriate tool for understanding policy decisions
factors do not change with renewable penetration level (particularly important for TOD energy and capacity value)
understanding policy decisions• Tool incorporates main drivers
of economic attractiveness
• Assumes no existing transmission capacity and allocates full cost of new transmission to renewable
Energy Analysis Department9
resources
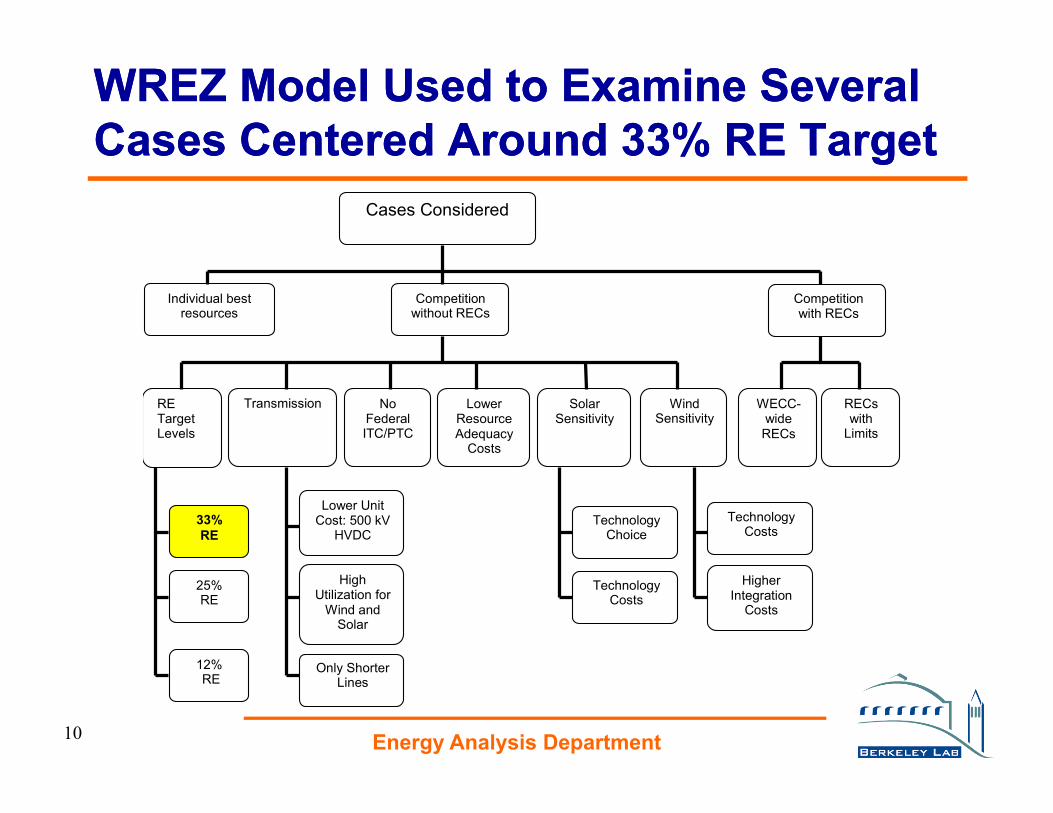
WREZ Model Used to Examine Several WREZ Model Used to Examine Several Cases Centered Around 33% RE TargetCases Centered Around 33% RE TargetCases Centered Around 33% RE TargetCases Centered Around 33% RE Target
Cases Considered
Individual best resources
Competition without RECs
Competition with RECs
Transmission No Federal ITC/PTC
Lower Resource Adequacy
Costs
Solar Sensitivity
WECC-wide
RECs
RECs with
Limits
Wind Sensitivity
RE Target Levels
33% RE
Lower Unit Cost: 500 kV
HVDC Technology
Costs Technology
Choice
25% RE
12%
High Utilization for
Wind and Solar
Higher Integration
Costs
O l Sh t
Technology Costs
Energy Analysis Department10
12% RE
Only Shorter Lines
Resource and Transmission Expansion Resource and Transmission Expansion Decisions in WREZ: Presentation OutlineDecisions in WREZ: Presentation OutlineDecisions in WREZ: Presentation OutlineDecisions in WREZ: Presentation Outline1. Motivation and Scope2 Summary of Key Findings2. Summary of Key Findings3. Framework for Comparing WREZ Resources
a) Bus-bar costs
b) Transmission and Line Losses Cost
c) Market Value Adjustment Factors
d) Advantages and Disadvantages of WREZ Model and Framework
4. Resultsa) Impact of Level of Renewable Energy (RE) Demand
b) Base Case: WECC-wide 33% RE Delivered to Each Load Zoneb) Base Case: WECC-wide 33% RE Delivered to Each Load Zone
c) Alternative Scenarios with 33% RE Delivered to Each Load Zone
d) Alternative Scenarios with Tradable Renewable Energy Credits
5 C l i d F t R h
Energy Analysis Department11
5. Conclusions and Future Research
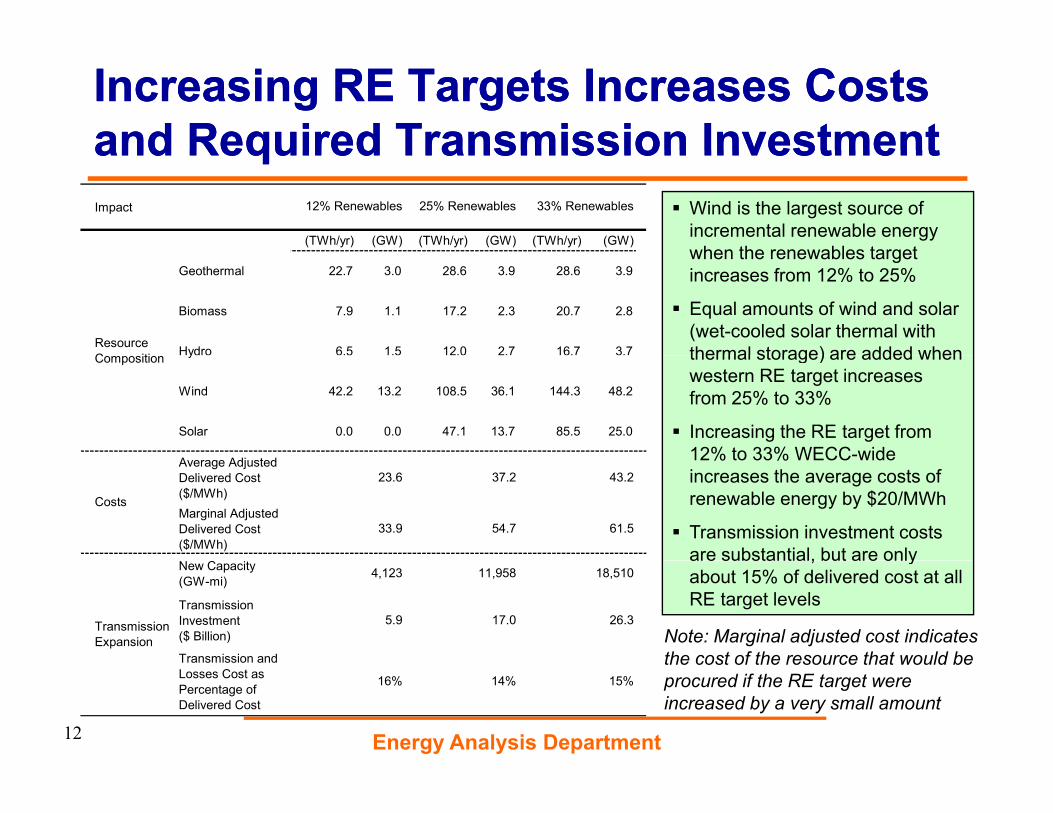
Increasing RE Targets Increases Costs Increasing RE Targets Increases Costs and Required Transmission Investmentand Required Transmission Investmentand Required Transmission Investmentand Required Transmission InvestmentImpact
(TWh/yr) (GW) (TWh/yr) (GW) (TWh/yr) (GW)
33% Renewables12% Renewables 25% Renewables Wind is the largest source of incremental renewable energy when the renewables target
Geothermal 22.7 3.0 28.6 3.9 28.6 3.9
Biomass 7.9 1.1 17.2 2.3 20.7 2.8
Hydro 6.5 1.5 12.0 2.7 16.7 3.7Resource C iti
when the renewables target increases from 12% to 25%
Equal amounts of wind and solar (wet-cooled solar thermal with thermal storage) are added wheny
Wind 42.2 13.2 108.5 36.1 144.3 48.2
Solar 0.0 0.0 47.1 13.7 85.5 25.0
A Adj t d
Composition thermal storage) are added when western RE target increases from 25% to 33%
Increasing the RE target from 12% to 33% WECC-wideAverage Adjusted
12% to 33% WECC wide increases the average costs of renewable energy by $20/MWh
Transmission investment costs are substantial, but are only
New Capacity (GW-mi)
Transmission Investment ($ Billion)
Transmission and
Transmission Expansion
5.9 17.0 26.3
4,123 11,958 18,510are substantial, but are only about 15% of delivered cost at all RE target levels
Note: Marginal adjusted cost indicates the cost of the resource that would be
Energy Analysis Department12
Losses Cost as Percentage of Delivered Cost
15%14%16%the cost of the resource that would be procured if the RE target were increased by a very small amount
Resource and Transmission Expansion Resource and Transmission Expansion Decisions in WREZ: Presentation OutlineDecisions in WREZ: Presentation OutlineDecisions in WREZ: Presentation OutlineDecisions in WREZ: Presentation Outline1. Motivation and Scope2 Summary of Key Findings2. Summary of Key Findings3. Framework for Comparing WREZ Resources
a) Bus-bar costs
b) Transmission and Line Losses Cost
c) Market Value Adjustment Factors
d) Advantages and Disadvantages of WREZ Model and Frameworks
4. Resultsa) Impact of Level of Renewable Energy (RE) Demand
b) Base Case: WECC-wide 33% RE Delivered to Each Load Zoneb) Base Case: WECC-wide 33% RE Delivered to Each Load Zone
c) Alternative Scenarios with 33% RE Delivered to Each Load Zone
d) Alternative Scenarios with Tradable Renewable Energy Credits
5 C l i d F t R h
Energy Analysis Department13
5. Conclusions and Future Research
Wind Is the Largest Contributor to Meeting Wind Is the Largest Contributor to Meeting the 33% RE Target with WREZ Resourcesthe 33% RE Target with WREZ Resourcesthe 33% RE Target with WREZ Resourcesthe 33% RE Target with WREZ Resources
60
yr)
6,000
i)
Hydro Biomass Wind Solar Geothermal GW-mi
30
40
50
Res
ourc
e (T
Wh/
y
3,000
4,000
5,000
Cap
acity
(GW
-m
10
20
rgy
From
Eac
h R
1,000
2,000
,
w T
rans
mis
sion
C
0
Albu
quer
que
Billin
gs
Bois
e
Cal
gary
Cas
per
Den
ver
El P
aso
Las
Vega
s
Los
Ange
les
Phoe
nix
Portl
and
Ren
o
Sacr
amen
to
alt L
ake
City
San
Die
go
co/B
ay A
rea
Seat
tle
Spok
ane
Tucs
on
er, C
anad
a
Ener
- New
A L S Sa
San
Fran
cisc
Vanc
ouve
Nine load zones procure only wind in the Base case
Solar thermal is second largest resource and is
Energy Analysis Department14
particularly important in the Southwest
Transmission expansion driven by Seattle, San Francisco, Calgary, Los Angeles, and Vancouver
High BusHigh Bus--bar Costs of Solar Are Offset bar Costs of Solar Are Offset by High TOD Energy and Capacity Valueby High TOD Energy and Capacity Valueby High TOD Energy and Capacity Valueby High TOD Energy and Capacity Value
dro
mas
s
d ar othe
rmal
d-si
ted
CC
GT
acra
men
to)
Average TOD energy and capacity value of solar
150
200
Wh)
12K
14K
16K
Hyd
Biom
Win
d
Sola
Geo
Load (S
city
(GW
-mi)
Adjusted Delivered Cost
thermal with storage procured in Base case is $34/MWh greater than TOD energy and capacity
50
100
150
iver
ed C
ost (
$/M
W
2K
4K
6K
8K
10K
rans
mis
sion
Cap
ac value of procured wind
Adjusted delivered cost of solar is more sensitive to correlation with loads and
-50
0
Adj
uste
d D
el
0K
2K
New
Tr correlation with loads and
avoided resource adequacy costs than other technologies
-200
-150
-100
Bus-bar Cos t Carbon Cost at $35/tonCO2Transm iss ion and Losses Cos t Energy Value Capacity Value Integration CostGW-m i
Wind provides 49% of the renewable energy but drives 63% of transmission expansion
Energy Analysis Department15
Note: Load-sited CCGT cost assumes $8/MMBTU gas cost
Resource and Transmission Expansion Resource and Transmission Expansion Decisions in WREZ: Presentation OutlineDecisions in WREZ: Presentation OutlineDecisions in WREZ: Presentation OutlineDecisions in WREZ: Presentation Outline1. Motivation and Scope2 Summary of Key Findings2. Summary of Key Findings3. Framework for Comparing WREZ Resources
a) Bus-bar costs
b) Transmission and Line Losses Cost
c) Market Value Adjustment Factors
d) Advantages and Disadvantages of WREZ Model and Framework
4. Resultsa) Impact of Level of Renewable Energy (RE) Demand
b) Base Case: WECC-wide 33% RE Delivered to Each Load Zoneb) Base Case: WECC-wide 33% RE Delivered to Each Load Zone
c) Alternative Scenarios with 33% RE Delivered to Each Load Zone
d) Alternative Scenarios with Tradable Renewable Energy Credits
5 C l i d F t R h
Energy Analysis Department16
5. Conclusions and Future Research
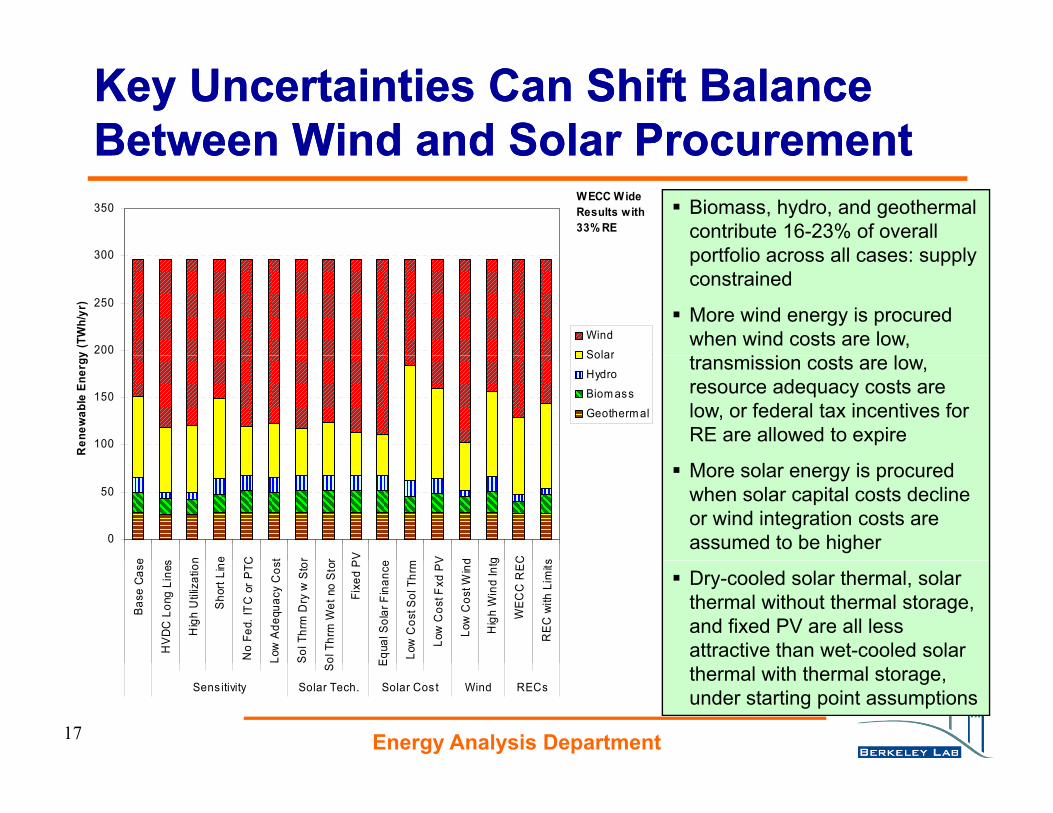
Key Uncertainties Can Shift Balance Key Uncertainties Can Shift Balance Between Wind and Solar ProcurementBetween Wind and Solar ProcurementBetween Wind and Solar ProcurementBetween Wind and Solar Procurement
300
350WECC Wide Results with 33% RE
Biomass, hydro, and geothermal contribute 16-23% of overall portfolio across all cases: supply
200
250
300
y (T
Wh/
yr)
Wind
Solar
portfolio across all cases: supply constrained
More wind energy is procured when wind costs are low,
i i l
100
150
Ren
ewab
le E
nerg
y Solar
Hydro
Biom ass
Geotherm al
transmission costs are low, resource adequacy costs are low, or federal tax incentives for RE are allowed to expire
0
50
e s n e C t r r PV V d g C s
More solar energy is procured when solar capital costs decline or wind integration costs are assumed to be higher
Bas
e C
a se
HV
DC
Lon
g Li
nes
Hig
h U
ti li z
a ti o
n
Sho
rt Li
ne
No
F ed .
ITC
or
PTC
Low
Ade
qua c
y C
o st
Sol
Thr
m D
ry w
St o
r
ol T
h rm
Wet
no
Sto
r
F ixe
d P
Eq u
a l S
olar
Fi n
a nc e
L ow
Co s
t So l
Th r
m
L ow
Cos
t Fxd
PV
Low
Co s
t Win
d
Hig
h W
i nd
Intg
WE
CC
REC
RE
C w
ith L
imi ts
Dry-cooled solar thermal, solar thermal without thermal storage, and fixed PV are all less attractive than wet-cooled solar
Energy Analysis Department17
S E
Sens itivity Solar Tech. Solar Cos t Wind RECsthermal with thermal storage, under starting point assumptions
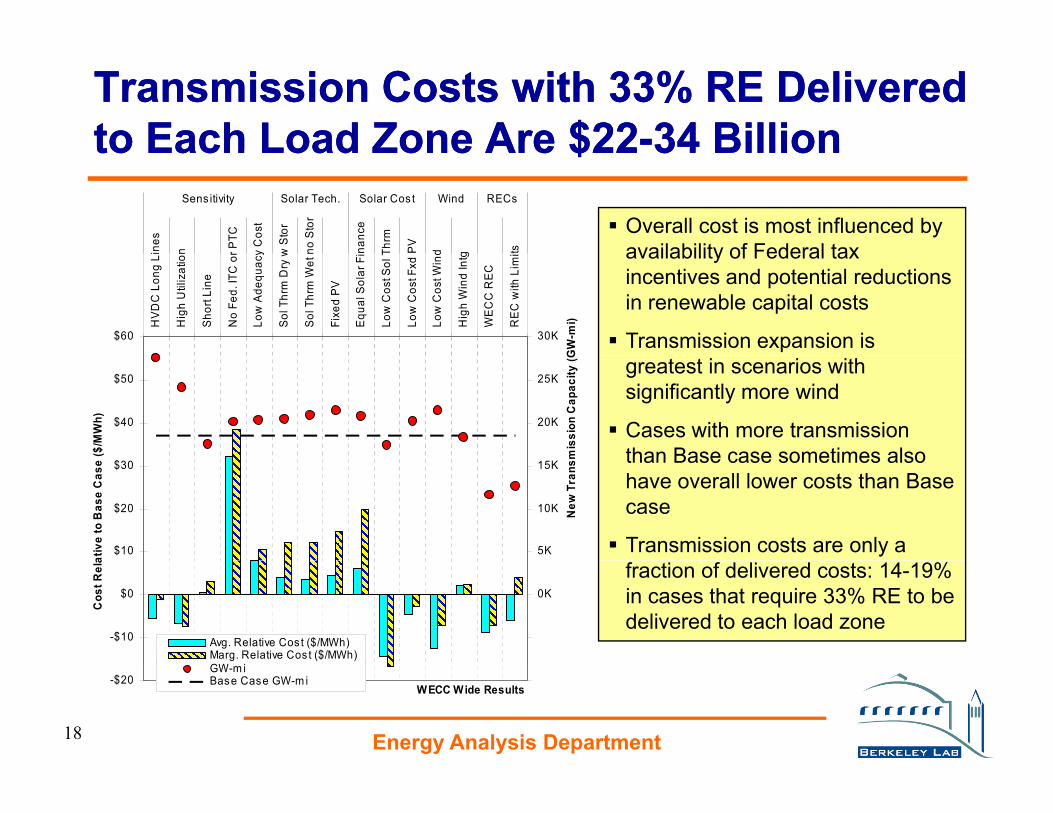
Transmission Costs with 33% RE Delivered Transmission Costs with 33% RE Delivered to Each Load Zone Are $22to Each Load Zone Are $22--34 Billion34 Billionto Each Load Zone Are $22to Each Load Zone Are $22 34 Billion34 Billion
Overall cost is most influenced by availability of Federal taxin
es
n r PTC
y C
ost
w S
tor
no S
tor
nanc
e
Thrm
PV
d g ts
Sens itivity Solar Tech. Solar Cos t Wind RECs
availability of Federal tax incentives and potential reductions in renewable capital costs
Transmission expansion is $60 30K
HV
DC
Lon
g Li
Hig
h U
tiliz
atio
n
Sho
rt Li
ne
No
Fed.
ITC
or
Low
Ade
quac
y
Sol
Thr
m D
ry w
Sol
Thr
m W
et n
Fixe
d P
V
Equ
al S
olar
Fi
Low
Cos
t Sol
T
Low
Cos
t Fxd
Low
Cos
t Win
d
Hig
h W
ind
Intg
WE
CC
RE
C
RE
C w
ith L
imit
GW
-mi)
greatest in scenarios with significantly more wind
Cases with more transmission than Base case sometimes also
$40
$50
($/M
Wh) 20K
25K
mis
sion
Cap
acity
(G
than Base case sometimes also have overall lower costs than Base case
Transmission costs are only a $10
$20
$30
ativ
e to
Bas
e C
ase
5K
10K
15K
New
Tra
nsm
fraction of delivered costs: 14-19% in cases that require 33% RE to be delivered to each load zone
-$10
$0
Cos
t Rel
a
0K
Avg. Relative Cos t ($/MWh)Marg. Relative Cos t ($/MWh)
Energy Analysis Department18
-$20GW-m iBase Case GW-m i
WECC Wide Results
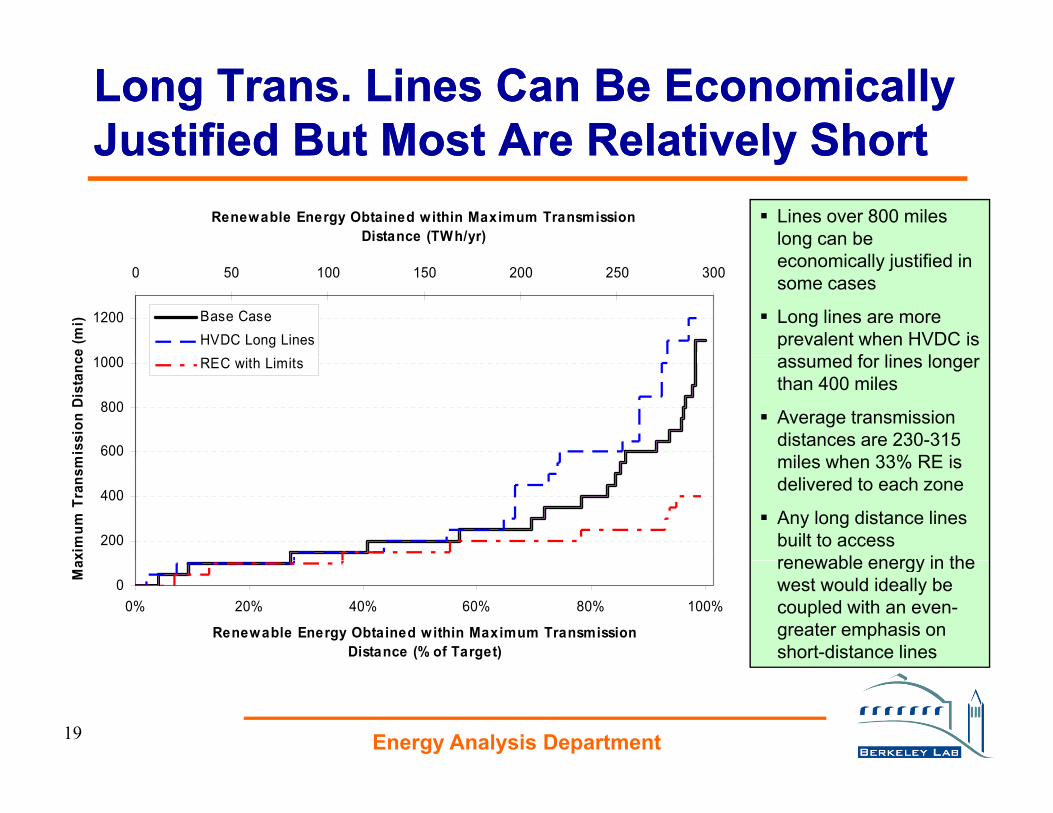
Long Trans. Lines Can Be Economically Long Trans. Lines Can Be Economically Justified But Most Are Relatively ShortJustified But Most Are Relatively ShortJustified But Most Are Relatively ShortJustified But Most Are Relatively Short
Lines over 800 miles long can be
Renewable Energy Obtained within Maximum Transmission Distance (TWh/yr)
economically justified in some cases
Long lines are more prevalent when HVDC is
d f li l
1200
e (m
i)
0 50 100 150 200 250 300
Base CaseHVDC Long Lines
assumed for lines longer than 400 miles
Average transmission distances are 230-315
il h 33% RE i600
800
1000
mis
sion
Dis
tanc
e
REC with Limits
miles when 33% RE is delivered to each zone
Any long distance lines built to access renewable energy in the
200
400
xim
um T
rans
m
renewable energy in the west would ideally be coupled with an even-greater emphasis on short-distance lines
00% 20% 40% 60% 80% 100%
Renewable Energy Obtained within Maximum Transmission Distance (% of Target)
Ma
Energy Analysis Department19
Resource and Transmission Expansion Resource and Transmission Expansion Decisions in WREZ: Presentation OutlineDecisions in WREZ: Presentation OutlineDecisions in WREZ: Presentation OutlineDecisions in WREZ: Presentation Outline1. Motivation and Scope2 Summary of Key Findings2. Summary of Key Findings3. Framework for Comparing WREZ Resources
a) Bus-bar costs
b) Transmission and Line Losses Cost
c) Market Value Adjustment Factors
d) Advantages and Disadvantages of WREZ Model and Framework
4. Resultsa) Impact of Level of Renewable Energy (RE) Demand
b) Base Case: WECC-wide 33% RE Delivered to Each Load Zoneb) Base Case: WECC-wide 33% RE Delivered to Each Load Zone
c) Alternative Scenarios with 33% RE Delivered to Each Load Zone
d) Alternative Scenarios with Tradable Renewable Energy Credits
5 C l i d F t R h
Energy Analysis Department20
5. Conclusions and Future Research
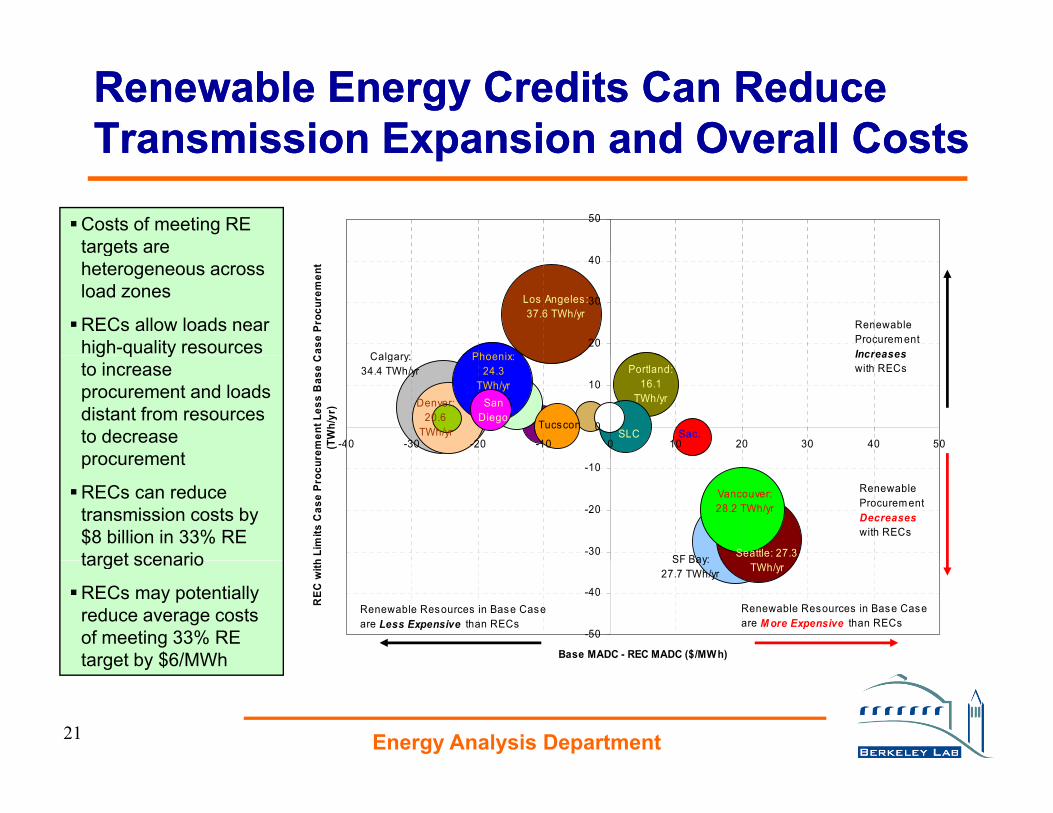
Renewable Energy Credits Can Reduce Renewable Energy Credits Can Reduce Transmission Expansion and Overall CostsTransmission Expansion and Overall CostsTransmission Expansion and Overall CostsTransmission Expansion and Overall Costs
Costs of meeting RE targets are
50
gheterogeneous across load zones
RECs allow loads near high-quality resources 20
30
40
Cas
e Pr
ocur
emen
t
Calgary:
Los Angeles : 37.6 TWh/yr
Renewable Procurem ent IncreasesPhoenix:g q y
to increase procurement and loads distant from resources to decrease procurement
0
10
-40 -30 -20 -10 0 10 20 30 40 50
rem
ent L
ess
Bas
e C
(TW
h/yr
)
Calgary: 34.4 TWh/yr
Denver: 20.6
TWh/yr
Increases with RECs
Phoenix: 24.3
TWh/yrPortland:
16.1 TWh/yr
SLCTucscon
Sac.
SanDiego
procurement
RECs can reduce transmission costs by $8 billion in 33% RE target scenario -30
-20
-10
h Li
mits
Cas
e Pr
ocur
Seattle: 27.3 SF Bay:
Vancouver: 28.2 TWh/yr
Renewable Procurem ent Decreases with RECs
target scenario
RECs may potentially reduce average costs of meeting 33% RE target by $6/MWh
-50
-40
Base MADC - REC MADC ($/MWh)
REC
with TWh/yr
SF Bay: 27.7 TWh/yr
Renewable Resources in Base Case are M ore Expensive than RECs
Renewable Resources in Base Case are Less Expensive than RECs
Energy Analysis Department21
target by $6/MWh
Conclusions Conclusions
• Assumptions and policies that affect bus-bar costs of renewables have the largest impact on resource selection and transmission expansion - Renewable resource capital cost, financing parameters, availability of
incentives, and resource quality need careful consideration
• Bus-bar costs are only one piece of the puzzle: transmission and y p pmarket value assumptions can also be important
• Wind energy is the largest contributor toward a 33% RE target under starting point assumptions, but key uncertainties can shift the balancestarting point assumptions, but key uncertainties can shift the balance between wind and solar in the Southwest
• Transmission investment to meet 33% RE with new WREZ resources estimated at $17-34 billionestimated at $17 34 billion
• Transmission costs are 10-19% of delivered cost of WREZ resources• Availability of tradable RECs should be explicitly considered in more
d t il d t i i l i
Energy Analysis Department22
detailed transmission planning
Future Research Future Research
• Considerable non-WREZ renewable resource potential exists in the West; the adjusted delivered costpotential exists in the West; the adjusted delivered cost of non-WREZ resources should be compared to the adjusted delivered costs of WREZ resources
• Market value adjustment factors will change with penetration levels; more detailed tools should evaluate changes in market value at higher penetration particularlychanges in market value at higher penetration, particularly in identifying the potential role of tradable RECs
• Higher transmission utilization increases windHigher transmission utilization increases wind procurement; detailed analysis should evaluate the costs and benefits of approaches to increasing transmission utilization for wind energy