69
Exploration of Risks and Risk Management in Construction Project Delivery Edgar P. Small, Ph.D. Associate Professor Coordinator – Construction Management Program
| Date post: | 16-Apr-2017 |
| Category: |
Engineering |
| Upload: | mecandpmv |
| View: | 553 times |
| Download: | 3 times |

1
Exploration of Risks and Risk Management in Construction
Project DeliveryEdgar P. Small, Ph.D.Associate ProfessorCoordinator – Construction
Management Program

Background
•Construction is increasingly complex and fraught with risks• Safety• Monetary• Quality• Time • Security• Equipment• Relationship

Workshop Description
• Risks are pervasive throughout the construction process and throughout a traditional project life-cycle. Risks occur in the early phases of life-cycle due to uncertainties with respect to project definition, with respect to client desires and with respect to project feasibility. As the life-cycle progresses, project definition uncertainties are mitigated with clarity provided through the production of plans and specifications. New risks, however, are introduced through the bidding and tendering process and within procurement and construction. What are the drivers which instantiate these risks? How are the risks quantified? How can the risks be mitigated. These and other questions are addressed through this session with the goal of conveying knowledge, understanding and practical tools for management of risks for project participants.

Our Goal Today is to Investigate Risk and Risk Management Alternatives•What types of risk occur through the project life-cycle and why do these risks occur?
•How can these risks be quantified?•How can these risks be mitigated?

Our Outline
•How do you define risk? •Quantitative vs Qualitative Risk•Construction: Background Considerations
• Project life-cycles, Organization for Project Delivery, Contractual Options
•Risk Analysis for Construction Operations• Where does risk fit? PM-BOK recommendations
5

Definitions: What Is Risk?• (Exposure to) the possibility of loss, injury, or other adverse or
unwelcome circumstance; a chance or situation involving such a possibility. [Oxford English Dictionary]
• Side note: Etymology of risk originally from Arabic? رزق
• Risk is an uncertain event or condition that, if it occurs, has an effect on at least one [project] objective..
• The probability of something happening multiplied by the resulting cost or benefit if it does.
• The probability or threat of quantifiable damage, injury, liability, loss, or any other negative occurrence that is caused by external or internal vulnerabilities, and that may be avoided through preemptive action.
• Numerous discipline-specific definitions
6
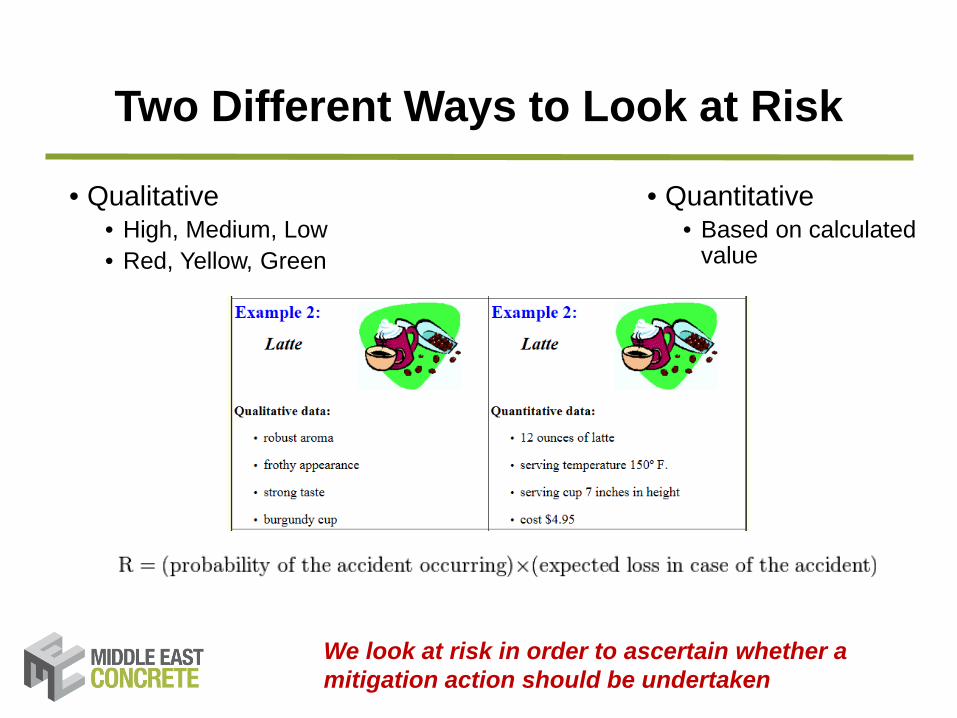
Two Different Ways to Look at Risk
• Qualitative• High, Medium, Low• Red, Yellow, Green
• Quantitative• Based on calculated
value
We look at risk in order to ascertain whether a mitigation action should be undertaken

Construction and Risk: Developing the Background

Why are We Looking At This?
•What are we looking at?• Construction is the 3rd largest industry in DXB• Great diversity of materials, sectors, techniques• Parties involved:
• Owners• Design Firms• Contractors• Consultants

Construction is Unique
• Process of combining and assembling components to create a physical improvement
• Project-based over a defined life-cycle• Prototype Nature (all projects are different)• Intricate – Numerous technologies and materials• Expensive & time-Consuming• Resource Driven• Risky

Project Life Cycle
Begins with the Idea/Need
Concludes with Disposal of Facility
Numerous ways of looking at a project life-cycle but they always start with the idea and end disposal

Project Life-Cycle (From the Owners Perspective)
1. Market Demands/Perceived Needs• Defines Project Requirements• This is where the owner comes up with the idea
2. Conceptual Planning/Feasibility Studies Defines project scope, size, etc. Evaluate whether the project makes sense
3. Preliminary Design & Engineering Defines the configuration, materials Finalizing the type-selection process.

Project Life-Cycle (From the Owners Perspective)
4. Detailed Design & Engineering Details determined. Plans & Specs generated. Finalizes the details
5. Procurement & Construction Materials acquired, facility built Limited opportunity for impacting final costs
6. Startup & Turnover Punch-list items addressed, contract concluded May be significant for complex projects.

Project Life-Cycle (From the Owners Perspective)
7. Operation of Facility Periodic maintenance Life-cycle impacts should be considered when
making the decision early in the life-cycle8. Disposal Demolition or conversion. This is the salvage values.

Project Delivery Structures
•Organization of the Project Participants to Define Responsibilities and Working Relationships
• “Comprehensive process of assigning contractual responsibilities for designing and constructing.”
• Traditional (Design-Bid-Build)• Owner-Builder• Turn-Key (Design-Build and Permutations)• Construction Management
15

Traditional Organization
General Contractor
Architect/ Engineer
Subcontractor
OWNERConceptual, Preliminary, Design, Construction Oversight
Procurement, Construction, Startup
No Contractual Relationship
- Separate Designer
- Single GC w/ Numerous Subs
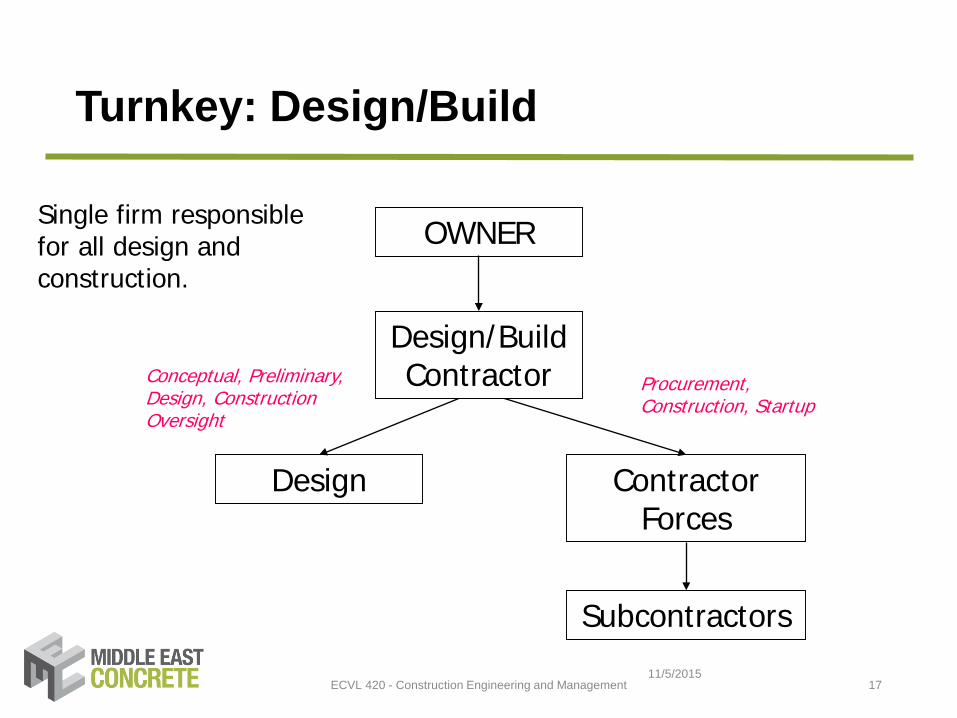
Turnkey: Design/Build
11/5/2015ECVL 420 - Construction Engineering and Management 17
Contractor Forces
Design
Subcontractors
Design/Build ContractorConceptual, Preliminary,
Design, Construction Oversight
Procurement, Construction, Startup
OWNERSingle firm responsible for all design and construction.

Professional CM
ECVL 420 - Construction Engineering and Management 18
Construction Manager
Architect/ Engineer
OWNER
Conceptual, Preliminary, Design
Design Input/Oversight, Procurement, Construction, Startup
Independent Contractors

Look at Time? Does the Selection of the Project Delivery System Introduce Risk?

Risk Depends on the Constraints
If there are no time constraints, there are no risks.
The more pressing the time constraint, the more critical it is to save time.
What about costs? - Traditional has the lowest cost- Design-Build has the highest cost
How does this translate to cost risks?

What Sources of Risk Exist?
• i.e. How does selection of the project delivery system affect the risks and what types of risks are increased/decreased.
• Quantitative Risk: Probability of an effect multiplied by the impact• Qualitative Risk: What is the potential of a significant impact
• What are the objectives of a project? • Success!
• Now, what is success?

Parties Involved at Different Phases
• Depends on the form of project delivery offered.
22
How does the ability to influence costs and the expenditure of costs impact risk?

Economic/Cost Risks and Contractual Forms of Payment
• Cost risks are prevalent for owners and contractors• Cost risks are a function of the type of payment structures
• Lump-sum / Stipulated Sum• Unit-price / Re-measured• Cost-Plus (with various permutations)
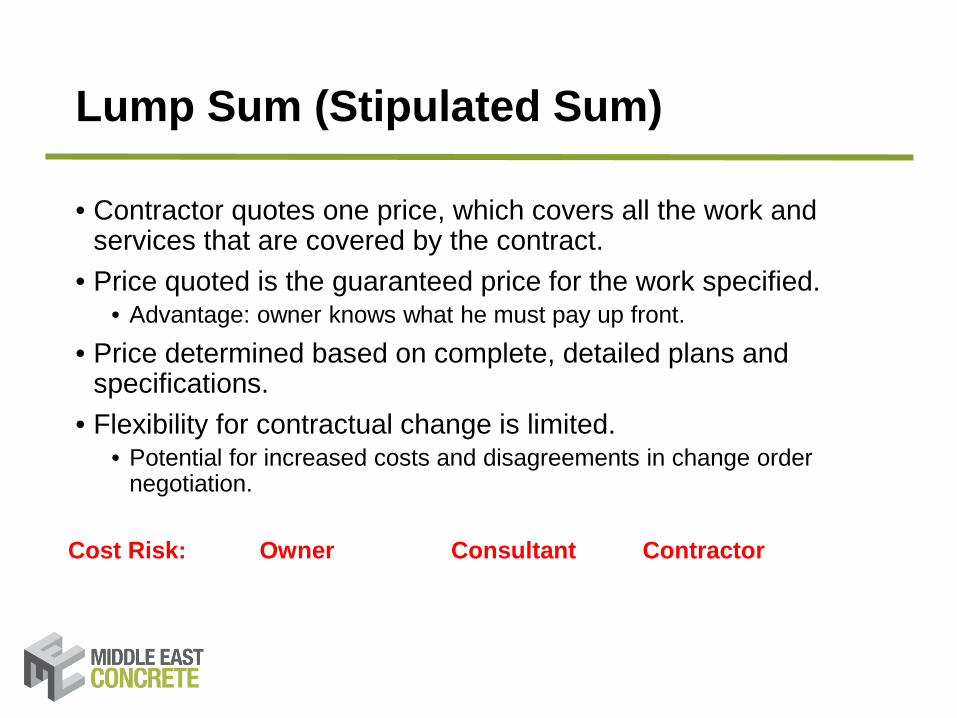
Lump Sum (Stipulated Sum)
• Contractor quotes one price, which covers all the work and services that are covered by the contract.
• Price quoted is the guaranteed price for the work specified. • Advantage: owner knows what he must pay up front.
• Price determined based on complete, detailed plans and specifications.
• Flexibility for contractual change is limited. • Potential for increased costs and disagreements in change order
negotiation.
Cost Risk: Owner Consultant Contractor

Unit Price Contracts• Structured to permit flexibility to accommodate variations in actual
material/work amounts/quantities• Project is broken down into work items that are correlated and
measured by physical measurements• CY of concrete or excavation, # of doors, SF of slab, etc• All work items for payment are predefined as are estimated quantities
(useful for bidding and evaluation)
• Budget determined based on bid quantities• Actual payments based on quantities placed
Cost Risk: Owner Consultant Contractor

Cost Plus Arrangements
• Cost + Percentage• Lucrative but subject to abuse. • Little incentive for contractor to be efficient/economical• Larger the job, higher the fee. • Seldom used
• Cost + Fixed Fee• Cost + Fixed Fee + Profit Sharing Clause• Cost + Sliding Fee• Cost + with Guaranteed Maximum Price
Cost Risk: Owner Consultant Contractor

Let’s Look at This Qualitatively
Contract Form Owner: Risk of Going Over Budget
Contractor: Risk of Losing Profit
Lump-Sum Low High
Re-measured Moderate Low
Cost-Plus High Low
27

So …
• We have decisions that are made through the project life-cycle• Decisions incorporate risks that are seldom qualitatively or
quantitatively evaluated at the early stages• Selection of the project delivery system and the form of contract
directly impact ultimate success• These decisions incur minimal direct costs but have large
impact on the final costs, time, quality, and ultimate success• Risks should be evaluated and/or considered when making these
decisions. • ARE THEY?
28

Move On to Consider Construction: The Most Costly Phase
29

Assume Traditional DBB Structure
• Plan is complete and Contract Documents Available for Bid• Bid process is established.• Contractor prepares an estimate for bidding
• Estimated performed based on knowledge, skills and abilities of estimating team and data collected/available on productivity, costs, practices, etc.
• Bid development includes significant cost risks, competitive risks, predictive risks
• For successful bidder, plan and schedule must be developed to deliver project on-time, within budget at the prescribed quality
• Schedule includes time and cost-associated risks
• Delivery of the project includes numerous other risks• Safety, environmental, market, property, security risks, etc.
30

Best Practices Demand Proactive Risk Management
• Consider PMI – PMBOK Recommendations
11.1 Plan Risk Management11.2 Identify Risks11.3 Perform Qualitative Risk
Analysis11.4 Perform Quantitative Risk
Analysis11.5 Plan Risk Responses11.6 Control Risks

Balance Against Company “Appetite”
•Balance your Risk Strategy Against Organizational Risk Considerations
• Risk appetite – the degree of uncertainty an entity is willing to take in anticipation of a reward.
• Risk tolerance – the degree, amount or volume of risk that an organization will withstand.
• Risk threshold – measure the level of uncertainty or impact at which a stakeholder may have a specific interest. Below that risk threshold, the organization accepts the risk, above it does not tolerate it.
32
Commitment should be made to address risk proactively for success.
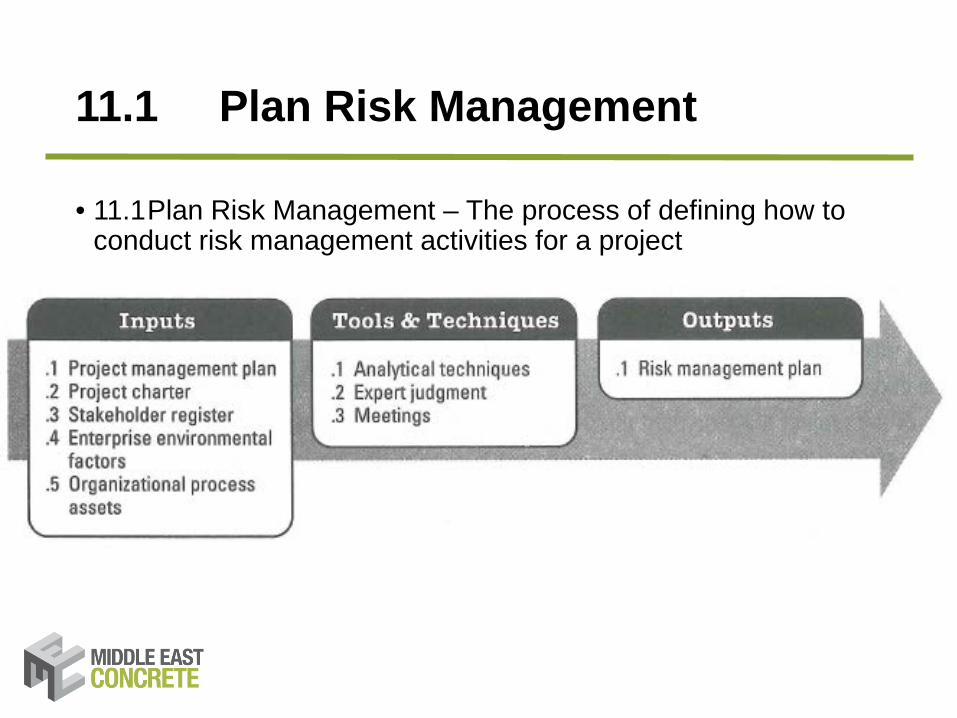
11.1 Plan Risk Management
• 11.1Plan Risk Management – The process of defining how to conduct risk management activities for a project

Plan Risk Management
• Careful and explicit planning enhances the probability of success for other risk management processes.
• Planning is also important to provide sufficient resources and time for risk management activities and to establish an agreed-upon basis for evaluating risks.
• Should begin when a project is conceived and should be completed early during project planning.
• For the contractor in the traditional structure, where is the project conceived? When should this be done? (before or after getting the job)

11.2 Identify Risks
• 11.2Identify Risks – The process of determining which risks may affect the project and documenting their characteristics.

Where are the risks for our project?
• Cost risks:
• Schedule Risks:
• Quality Risks:
36

Identify Risk (cont)
• Risk identification activities may include: project manager, team members, risk management team, customers, subject matter experts, other stakeholders, etc.
• Identifying risks is an iterative process, because new risks may evolve or become known as the project progresses through its life-cycle.
• Frequency of iteration and participation may vary by situation.
• Many tools: SWOT analysis, expert elicitation, cause & effect diagrams, process flow charts, influence diagrams, checklists, etc.

Cause and Effect Diagrams
• Problem statement at head is the starting point and then the problem is traced back to actionable root causes.
• Problem statement typically describe the problem as a gap to be closed or an objective to be achieves.
• Causes of found by looking at the project and examining/asking why until an actionable root cause is identified or reasonable possibilities of each fishbone exhausted.
• Useful in linking the undesirable effects seen as special variations to the assignable cause upon which the project teams should implement corrective actions to eliminate the special variation detected in a control chart.

Cause and Effect Diagrams (Fishbone Diagrams)

Flowcharts (Process Maps)• Display the sequence of steps and the branching possibilities that exist for
a process that transforms one or more inputs into one or more outputs. • Show the activities, decision points, branching loops, parallel paths, and
the overall order of processing by mapping the operational details of procedures that exist within a horizontal chain of a SIPOC model.
• May be useful in understanding and estimating the cost of a process (i.e. impacts) by using the workflow branching logic and associated relative frequencies to estimate expected monetary value.

SIPOC Model w/ Operational Processes

Affinity Diagrams
• Similar to a mind-mapping technique as they are used to generate ideas that can be linked to form organized patterns of thought about a problem.

Process Decision Program Charts (PDPC)• Used to understand a goal in relation to the steps for getting to
the goal. Helps to see the intermediate steps that could derail achievement of the goal (which are hazards)

Interrelationship Digraphs• Adaption of relationship
diagrams. Provide a process for creative problem solving with complex, intertwined logical relationships for up to 50 relevant items.
• Can be developed from data in other charts (fishbone, affinity, tree)

Tree Diagrams (Systematic Diagrams)
• Represent decomposition hierarchies. (WBS, RBS, OBS)• Useful for understanding parent-child relationships• Can be presented either horizontally or vertically• Very useful for establishing expected values.

Matrix Diagrams
• Diagram seeks to show the strength of relationships between factors, causes and objectives that exist between the rows and columns.

Checksheets (Tally Sheets)• May also be used as a checklist when collecting data.• Used to organize facts that will facilitate the effective collection
of useful data about a potential quality problem.
Think about how this could be implemented for control / risk mitigation
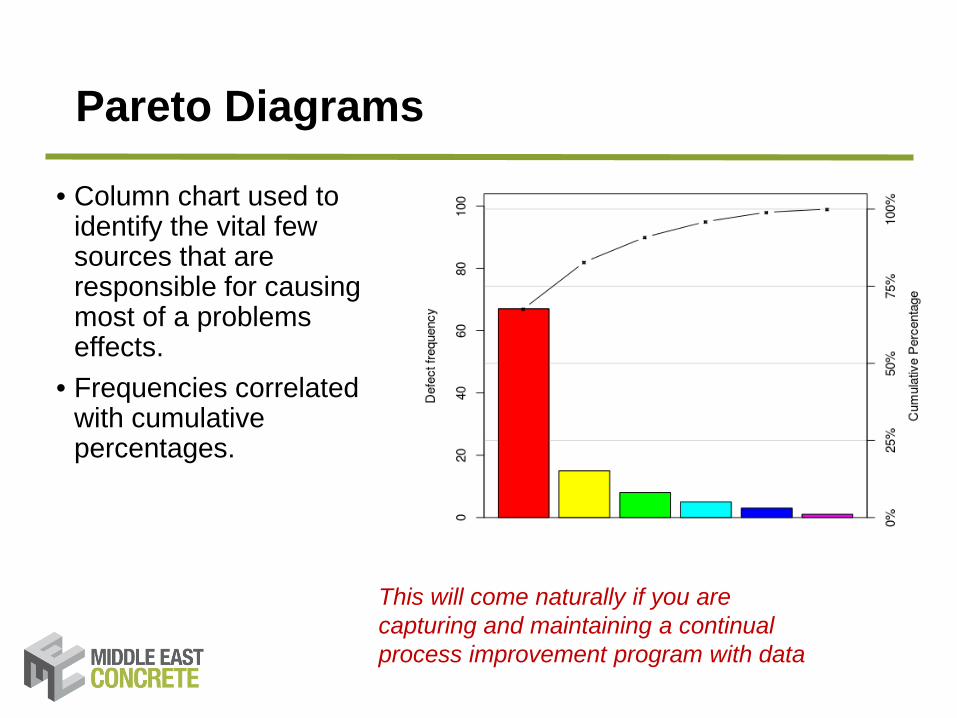
Pareto Diagrams
• Column chart used to identify the vital few sources that are responsible for causing most of a problems effects.
• Frequencies correlated with cumulative percentages.
This will come naturally if you are capturing and maintaining a continual process improvement program with data

Histograms• Special form of a bar chart and are used to describe the
central tendency, dispersion, and shape of a statistical distribution. Doesn’t consider influence of time.
Natural probability distribution
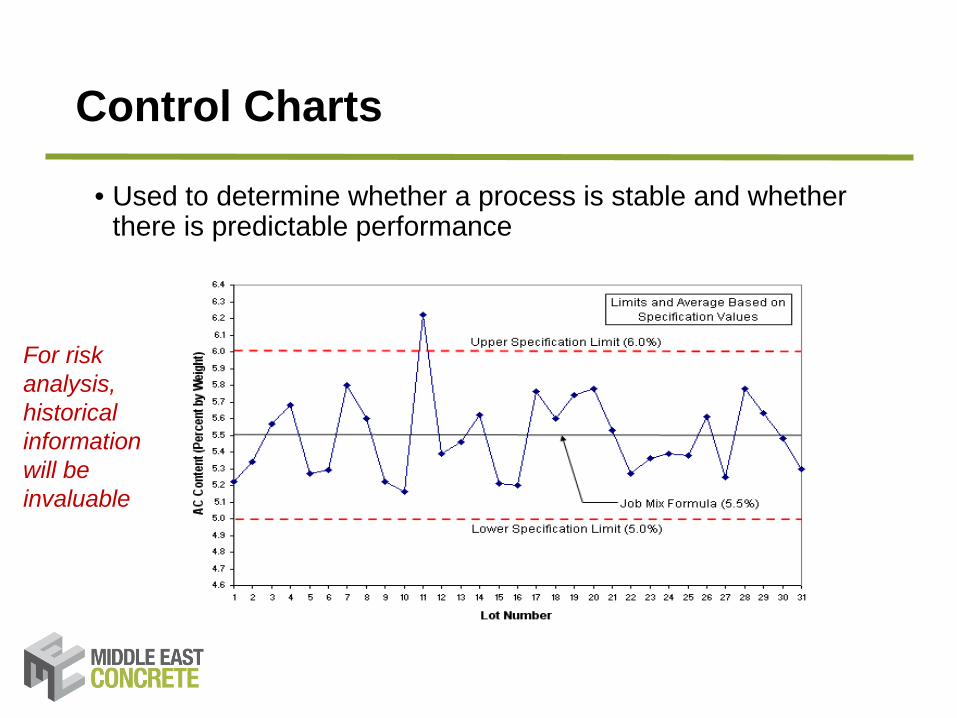
Control Charts
• Used to determine whether a process is stable and whether there is predictable performance
For risk analysis, historical information will be invaluable
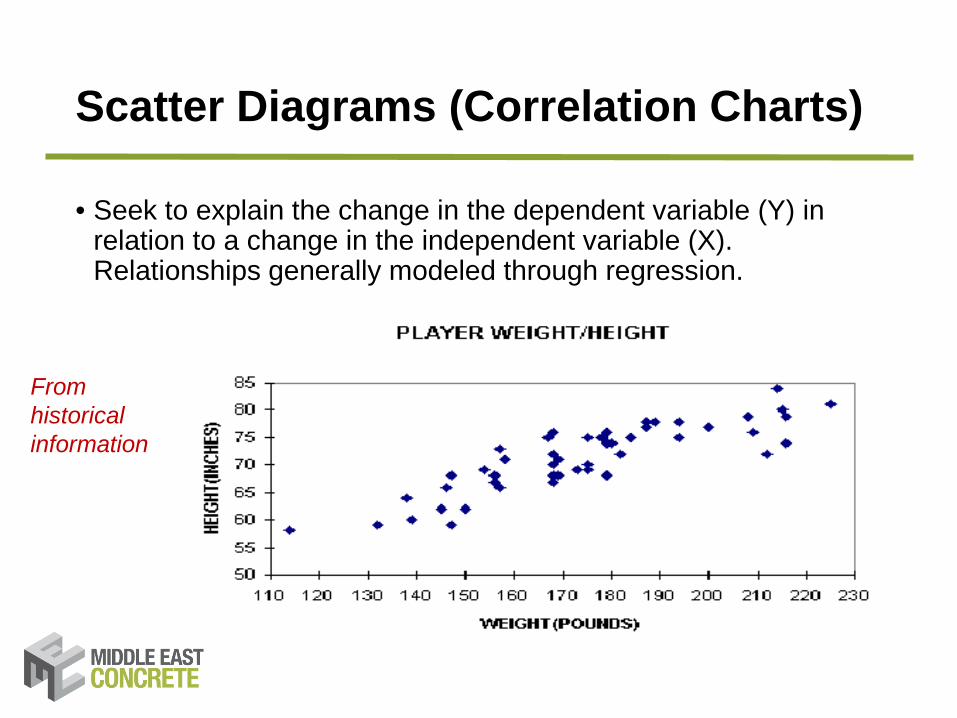
Scatter Diagrams (Correlation Charts)
• Seek to explain the change in the dependent variable (Y) in relation to a change in the independent variable (X). Relationships generally modeled through regression.
From historical information

Assessment of Tools
• Many of these tools have application elsewhere in project management (especially in control)
• Serve as the basis for generating data that can help you make better decisions; therefore, capture this data.
• Adapt the information for risk and couple with the control function to ensure constant diligence and continuing improvement.
52
PLUS, You cannot move to quantitative risk analysis without having data.

11.3 Perform Qualitative Risk Analysis
• 11.3Perform Qualitative Risk Analysis – The process of prioritizing risks for further analysis or action by assessing and combining their probability of occurrence and impact.

Qualitative Risk Analysis
• Assess the priority of identified risks using relative probability or likelihood of occurrence, the corresponding impact on project objectives if the risks occur, as well as other factors, such as time frame for response and the organizations risk tolerance associated with the project constraints of cost, schedule, scope and quality.
• Establishing definitions of the levels of probability and impact helps to remove bias in the analysis.
• Rapid and cost-effective means of establishing priorities and provides the foundation for Quantitative Risk Analysis.

Example
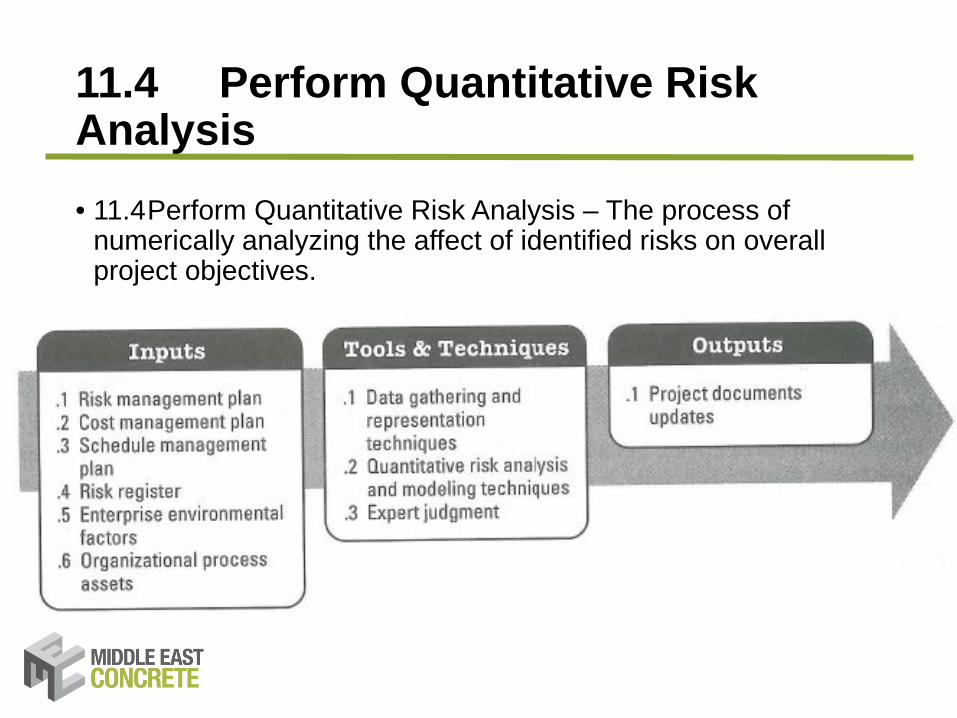
11.4 Perform Quantitative Risk Analysis• 11.4Perform Quantitative Risk Analysis – The process of
numerically analyzing the affect of identified risks on overall project objectives.

Quantitative Risk Analysis
• Follows similar process to qualitative risk analysis.• Difference is in the specific approach and outputs.
Makes use of many techniques discussed plusSWOT analysis

Decision Analysis - Expected Value
Can be used for decision support of mitigation activities

Sensitivity Analysis

Modeling and Simulation

11.5 Plan Risk Responses
• 11.5Plan Risk Responses – The process of developing options and actions to enhance opportunities and to reduce threats to project objectives.
11.6 Control Risks
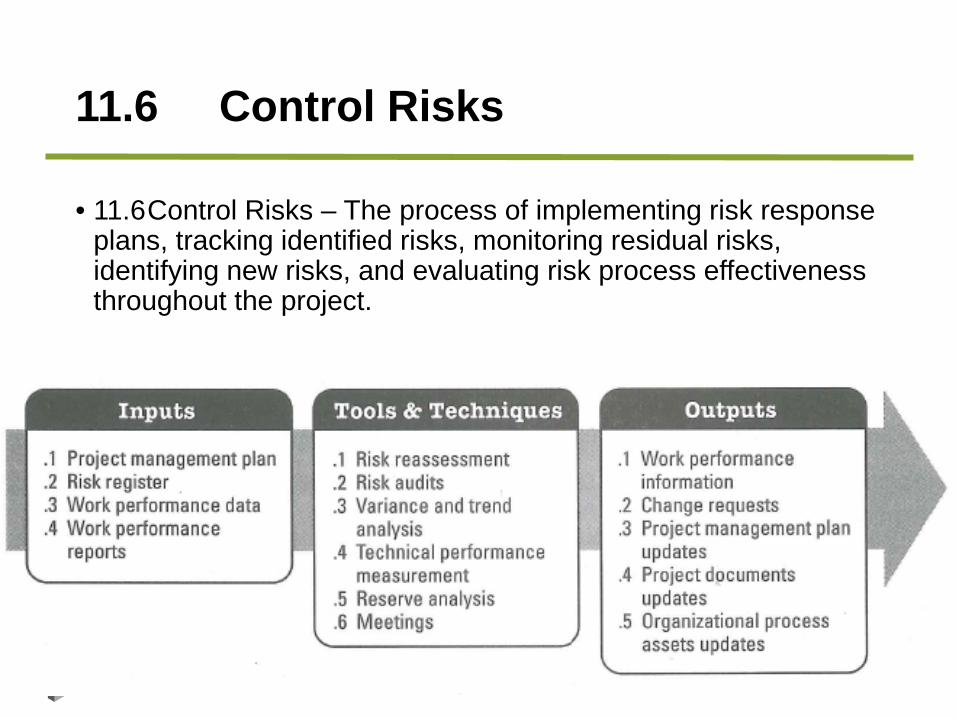
• 11.6Control Risks – The process of implementing risk response plans, tracking identified risks, monitoring residual risks, identifying new risks, and evaluating risk process effectiveness throughout the project.

RECAP: Project Risk Management
• 11.1Plan Risk Management• 11.2Identify Risks• 11.3Perform Qualitative Risk Analysis• 11.4Perform Quantitative Risk Analysis• 11.5Plan Risk Responses• 11.6Control Risks
So, What Do You Think? How Do These Relate To Your Project? How About Your Day-to-Day Work Activities? Where do these occur?

Wrap up

Did we accomplish our goals?
• We touched on the subject but there is SO MUCH MORE!!!• Where do you go from here:
• Continual, life-long learning• Pursuing of graduate education (MSCM)

The Masters of Science in Construction Management• 30 Credit Program (10 classes)• Modeled after the of US programs.• MOHE accredited/SACS accredited• Scholarship programs are available
• 50 percent merit based scholarship• Matching scholarship for company contributions (up to 25%)

TO APPLY
• Application can be submitted online• http://www.aud.edu/Admissions/grad.asp
• For More Information:
Dr. Edgar P. SmallAssociate ProfessorMSCM CoordinatorE-mail: [email protected]: (04) 3183 447
For admissions questions: Sara Sleem ([email protected])Tel: (04) 3183 172

THANK YOU
Are there any questions or comments before we
conclude?
68

69


