EXPLORATIONS INTO THE VISUALIZATION OF POLICY NETWORKS Ulrik Brandes, Patrick Kenis, J ¨ org Raab, Volker Schneider and Dorothea Wagner ABSTRACT Visualization is an important aspect of both exploration and communication of categorical as well as relational data. Graphical displays of policy networks are particularly attractive, since they enable authors to display in a compact way the relevant actors in a network, how they are related to each other, and what the overall structure looks like. Sociograms were early companions of social network analysis, but have received surprisingly little attention during the following decades. Only in the last few years has easy accessibility to quality computing and graphic equipment revived a now rapidly growing interest. In this paper, we analyze the problem of visualizing policy networks. We first argue why network visualization is important and non-trivial. Then we show that current methods are somewhat ad hoc in their attempt to convey information contained in a network. Our main contribution is a systematic approach to network visualization, closely following the general principles of information visualization. It provides a generic formalization which may serve as a guideline for further developments. KEY WORDS • algorithm • network visualization • sociogram 1. Introduction The introduction of the policy network concept has been one of the major innovations in policy analysis in recent years (Kenis and Schneider, 1991; H´ eritier, 1993; B ¨ orzel, 1997). An important method for describing and analyzing them is formal network analysis (Laumann and Knoke, 1987; Pappi et al., 1995). The main purpose of computer programs developed to conduct formal network analysis is to calculate their aggregate measures on centrality, density, etc. However, some of these programs also include an option for graphical presentation of the structure of the networks under study. Graphical displays are particularly attractive since they compactly display the relevant actors in a network and how these relate to each other. There are, of course, very different ways for visualizing the same policy The authors acknowledge two anonymous referees for helping to improve the quality of this article with their useful comments and suggestions. Journal of Theoretical Politics 11(1): 75–106 Copyright g 1999 Sage Publications 0951–6928[1999/01]11:1; 75–106; 006737 London, Thousand Oaks, CA and New Delhi
Transcript
EXPLORATIONS INTO THE VISUALIZATION OFPOLICY NETWORKS
Ulrik Brandes, Patrick Kenis, Jorg Raab, Volker Schneider andDorothea Wagner
ABSTRACT
Visualization is an important aspect of both exploration and communicationof categorical as well as relational data. Graphical displays of policynetworks are particularly attractive, since they enable authors to display in acompact way the relevant actors in a network, how they are related to eachother, and what the overall structure looks like. Sociograms were earlycompanions of social network analysis, but have received surprisingly littleattention during the following decades. Only in the last few years has easyaccessibility to quality computing and graphic equipment revived a nowrapidly growing interest.
In this paper, we analyze the problem of visualizing policy networks. Wefirst argue why network visualization is important and non-trivial. Then weshow that current methods are somewhat ad hoc in their attempt to conveyinformation contained in a network.
Our main contribution is a systematic approach to network visualization,closely following the general principles of information visualization. Itprovides a generic formalization which may serve as a guideline for furtherdevelopments.
KEY WORDS • algorithm • network visualization • sociogram
1. Introduction
The introduction of the policy network concept has been one of the majorinnovations in policy analysis in recent years (Kenis and Schneider, 1991;Heritier, 1993; Borzel, 1997). An important method for describing andanalyzing them is formal network analysis (Laumann and Knoke, 1987;Pappi et al., 1995). The main purpose of computer programs developed toconduct formal network analysis is to calculate their aggregate measures oncentrality, density, etc. However, some of these programs also include anoption for graphical presentation of the structure of the networks understudy. Graphical displays are particularly attractive since they compactlydisplay the relevant actors in a network and how these relate to each other.There are, of course, very different ways for visualizing the same policy
The authors acknowledge two anonymous referees for helping to improve the quality ofthis article with their useful comments and suggestions.
Journal of Theoretical Politics 11(1): 75–106 Copyright g 1999 Sage Publications0951–6928[1999/01]11:1; 75–106; 006737 London, Thousand Oaks, CA and New Delhi
network just as there are different ways of calculating their structuralcharacteristics or different ways of theorizing about them. Although thereis considerably less literature on the problem of network visualizationcompared to the calculation of structural properties or on theorizing aboutpolicy networks, there are at least three reasons why the visualizationaspect is important.
First, the function of network visualization goes far beyond ‘illustration’.Network visualizations can help to improve communication about the datato third parties (such as policy-makers); it can help the researcher toexplore specific properties of certain networks better or facilitate theexploration of differences across several networks; or it could even help todiscover explanations for policies.1
Second, although numerous visualizations of social and policy networkscan be found throughout the literature, systematic accounts of howvisualizations are produced are very rare and, in general, techniques forcreating visual representations of relational data have remained virtuallyunchanged since the study of social networks began (see Section 2.3).
Third, reflecting on the form and shape of visualized policy networkshelps to critically evaluate existing ways of visualizing social networks (seeSections 2.2 and 3) as well as helps towards the development of objectivestandards of graphical excellence (see Section 4).
Ultimately, these contributions could and should be used as startingpoints for the implementation of formal instruments for appropriate visualpresentation of social or policy networks, respectively, i.e. to developautomatic procedures for editing, analyzing, and presenting networks in ascientific way.
2. Network Visualization Reviewed
2.1. The Importance of Network Visualization
Data graphics can do much more than simply substitute for tabulardescriptions: ‘At their best, graphics are instruments for reasoning aboutquantitative information. Often the most effective way to describe,explore, and summarize a set of numbers – even a very large set – is to lookat pictures of those numbers’ (Tufte, 1983: 9). Graphical or visual presenta-tions can not only describe data in different ways, but can also facilitate thecomparison between different sets of data, stimulate scientific innovation,and even stimulate theoretical insights (Klovdahl, 1981; Muller, 1991).
In the case of network studies in general, and policy network analysis in
1. On the basis of a number of historical examples, Tufte concludes: ‘Those who discoveran explanation are often those who construct its representation’ (Tufte, 1997: 9).
76 JOURNAL OF THEORETICAL POLITICS 11(1)
particular, visualization of quantitative data becomes a very importantinstrument. A simple description of relational data by means of tables isextremely limited in its explorative power (even if compared to tabulardescriptions of categorical data).
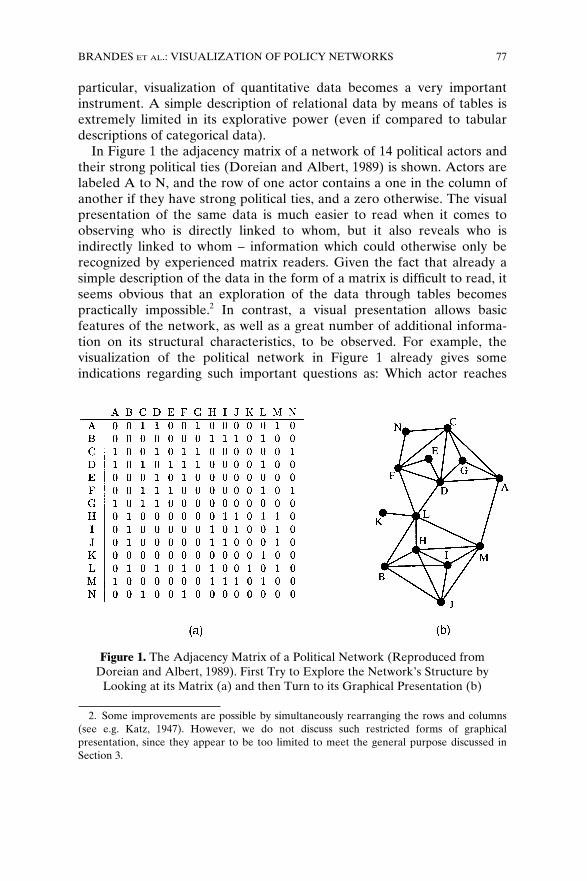
In Figure 1 the adjacency matrix of a network of 14 political actors andtheir strong political ties (Doreian and Albert, 1989) is shown. Actors arelabeled A to N, and the row of one actor contains a one in the column ofanother if they have strong political ties, and a zero otherwise. The visualpresentation of the same data is much easier to read when it comes toobserving who is directly linked to whom, but it also reveals who isindirectly linked to whom – information which could otherwise only berecognized by experienced matrix readers. Given the fact that already asimple description of the data in the form of a matrix is difficult to read, itseems obvious that an exploration of the data through tables becomespractically impossible.2 In contrast, a visual presentation allows basicfeatures of the network, as well as a great number of additional informa-tion on its structural characteristics, to be observed. For example, thevisualization of the political network in Figure 1 already gives someindications regarding such important questions as: Which actor reaches
2. Some improvements are possible by simultaneously rearranging the rows and columns(see e.g. Katz, 1947). However, we do not discuss such restricted forms of graphicalpresentation, since they appear to be too limited to meet the general purpose discussed inSection 3.
Figure 1. The Adjacency Matrix of a Political Network (Reproduced fromDoreian and Albert, 1989). First Try to Explore the Network’s Structure by
Looking at its Matrix (a) and then Turn to its Graphical Presentation (b)
BRANDES ET AL.: VISUALIZATION OF POLICY NETWORKS 77
most other actors? Can every actor be reached by every other actor? Dosome actors only interact with one another? Furthermore, if relationalinformation could be combined with information on attributes of the actorsin a visual display, other insights could be gained: Do actors with over-lapping membership networks share values? Are there common behavioralpatterns? Do actors with similar demographic characteristics interactmore? Do communications between some actors flow in one direction only(hierarchy)?
Assuming that a network is indispensable, a number of questions arise:1. Does the way in which network data are visualized matter?2. What has been developed in this area so far?3. Which principal procedures for visualizing networks have prevailed?4. Are current methods satisfactory?At least partial answers to the first three questions are given in the
following subsections. The fourth question, and its implications, are thesubject of the subsequent sections.
2.2. Relative Effectiveness of Visualizations
When Tufte (1983: 191) states that ‘design is a choice’ he means thegraphics of the same data can look very different, and the quality may vary.Consequently, since visualization has tremendous explorative and com-municative power and is not merely an instrument with which to decoratenumbers, some analysis should be invested into what determines quality ina visualized data matrix.
One problem is that there is little reliable work since not one piece ofliterature is known to us that deals with the quality of network visual-ization, even though there is a proven effect on perception.3 Whilst thereare a number of interesting articles addressing the question of networkvisualization, these concentrate on ‘technological’ innovations to visualizenetworks. Examples include new computers, new printers, specific softwarepackages, specific programming languages, new algorithms, increasedprocessing capabilities of computers enabling color, 3D and movingrepresentations (see, e.g., Klovdahl, 1981; Freeman, 1996, 1997). Althoughthese devices are important components for permitting visualizations, theydo not themselves define quality.4
3. Blythe et al. (1995) conduct a study proving the effect of node positioning on perceptionof network measures. Other studies (Purchase et al., 1995; Purchase, 1997) emphasize apresentation’s general effect on the understanding of network structure. Note that Bertin(1983) does not reason about any particular, but arbitrary kinds of networks.
4. One might even argue that computers have generally led to a decrease in quality (see, forexample, the many examples of computer-produced ‘chartjunk’ graphs presented by Tufte[1983] in contrast to the graph produced by Charles Joseph Mainard in 1869, which may be‘the best statistical graphic ever drawn’ [Tufte 1983: 41]).
78 JOURNAL OF THEORETICAL POLITICS 11(1)
Figure 2 (from Tufte, 1983) clearly shows how the same data can bepresented in very different ways. Not only does the second graph yield amuch calmer view, removing irrelevant information, it also does notgenerate the false impression of a substantial and continuous increase inspending. As Tufte convincingly shows, the first graph deploys severalvisual and statistical tricks – all working in the same direction, to exagger-ate the budget which does not really increase when put in relation topopulation size. This is not the place to uncover the underlying graphicalgimmicks (see Tufte, 1983, 66–9) but rather to illustrate the point that notevery way of visualization is equally useful. Tufte’s principles of graphicalexcellence are the following:
• Graphical excellence is the well-designed presentation of interestingdata – a matter of substance, of statistics, and of design.
• Graphical excellence consists of complex ideas communicated withclarity, precision, and efficiency.
• Graphical excellence is what gives to the viewer the greatest number ofideas in the shortest time with the least ink in the smallest space.
• Graphical excellence is almost always multivariate.• Graphical excellence requires telling the truth about the data.
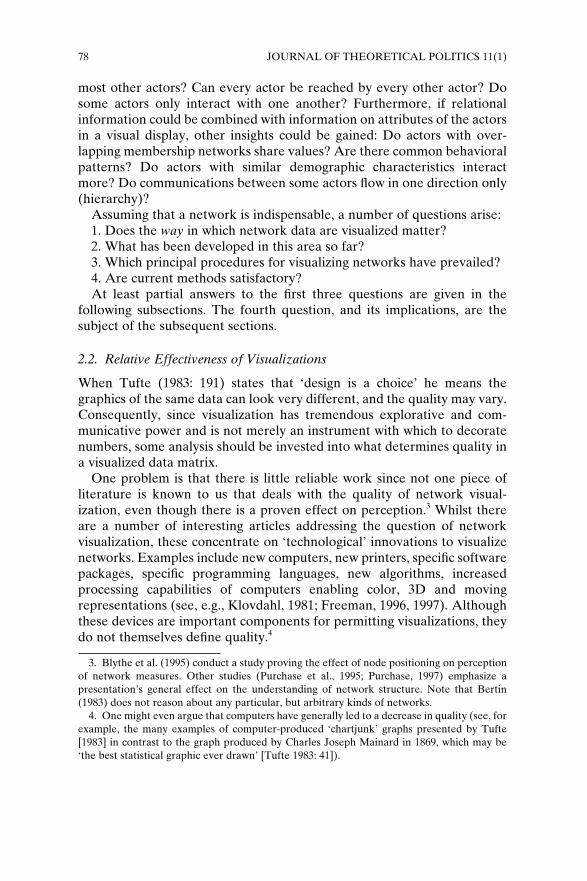
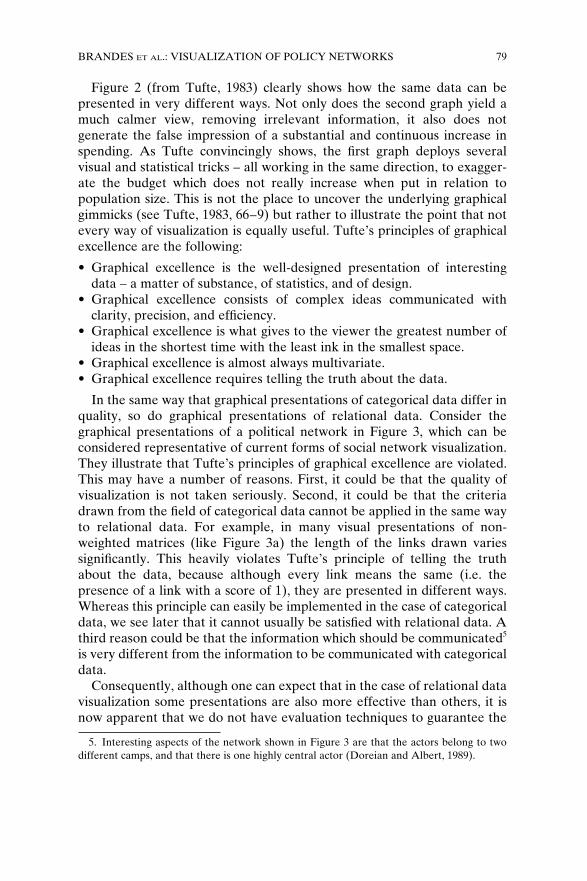
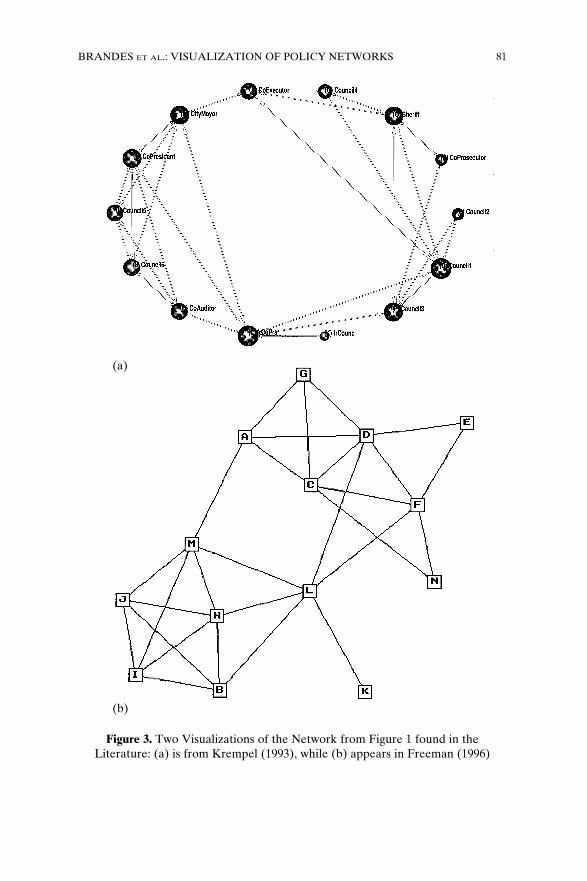
In the same way that graphical presentations of categorical data differ inquality, so do graphical presentations of relational data. Consider thegraphical presentations of a political network in Figure 3, which can beconsidered representative of current forms of social network visualization.They illustrate that Tufte’s principles of graphical excellence are violated.This may have a number of reasons. First, it could be that the quality ofvisualization is not taken seriously. Second, it could be that the criteriadrawn from the field of categorical data cannot be applied in the same wayto relational data. For example, in many visual presentations of non-weighted matrices (like Figure 3a) the length of the links drawn variessignificantly. This heavily violates Tufte’s principle of telling the truthabout the data, because although every link means the same (i.e. thepresence of a link with a score of 1), they are presented in different ways.Whereas this principle can easily be implemented in the case of categoricaldata, we see later that it cannot usually be satisfied with relational data. Athird reason could be that the information which should be communicated5
is very different from the information to be communicated with categoricaldata.
Consequently, although one can expect that in the case of relational datavisualization some presentations are also more effective than others, it isnow apparent that we do not have evaluation techniques to guarantee the
5. Interesting aspects of the network shown in Figure 3 are that the actors belong to twodifferent camps, and that there is one highly central actor (Doreian and Albert, 1989).
BRANDES ET AL.: VISUALIZATION OF POLICY NETWORKS 79
Figure 2. From Chartjunk to Graphical Excellence (Tufte, 1983: 66–8). TwoVersions of New York Total Budget Expenditure and Aid to Localities
80 JOURNAL OF THEORETICAL POLITICS 11(1)
Figure 3. Two Visualizations of the Network from Figure 1 found in theLiterature: (a) is from Krempel (1993), while (b) appears in Freeman (1996)
(a)
(b)
BRANDES ET AL.: VISUALIZATION OF POLICY NETWORKS 81
quality of visualizations. The remainder of this article aims at laying a basefor such a discussion.
2.3. A Short History of Network Visualization
Given the importance of graphical representation for scientific develop-ment, it is astonishing how little attention the subject has received.Klovdahl’s (1981) conceptual article ‘A Note on Images of Networks’ isone of the rare publications about this subject. Although interesting andvery much to the point, it was cited only four times between 1981 and1996.6 The following outline mainly summarizes Klovdahl’s overview onthe history of network visualization.
The sociogram, a visual representation of relational sociological dataused by Moreno in the 1930s, was one of the earliest techniques forformalizing social configurations (see Moreno, 1953) influencing – directlyor indirectly – a number of subdisciplines of the social sciences (socialpsychology, social anthropology, sociology of organization). One of themajor investigations popularizing this approach was the Hawthorne studyin which sociograms were used to describe social relations (Scott, 1991: 18).In the diagrams from this study, actors are represented by circles placed onhorizontal lines indicating their status, and the presence of a relationship ofcertain type is shown by an arrow. The layout of the diagrams seem to beinfluenced by organization charts and electrical wiring plans (see Roethlis-berger and Dickson, 1939: 500ff., or Figure 4 for an example). Althoughthese early forms of graphical representation were a great help in thestructural analysis of society at all levels (from school classes to elitestructures at both local and national levels) and were considered a fruitfulmethod of exploration, there had been very few improvements until thecomputer age opened up a completely new range of visualization possibil-ities. Before the broader introduction of computers, the researcher had todraw the images by hand in a very tiresome and time-intensive trial anderror process until the image was satisfying. Two major types of repre-sentation had been developed at that time for the design of sociograms.First, arrow diagrams were drawn in which the most central actors wereplaced in the middle of the sheet and the researcher tried to reduce thenumber of cross-cutting connections as far as possible to achieve the bestvisual clarity. This idea was extended by Northway (1940), who introduceda variation in which nodes were grouped according to their centrality andthen placed on concentric circles. The less central a node the fartheroutside it is placed (Klovdahl, 1981: 200). Second, from the attempt toreduce the number of cross-cutting connections, a common techniqueconstructed the sociogram around the circumference of a circle, so all links
6. According to the Social Science Citation Index.
82 JOURNAL OF THEORETICAL POLITICS 11(1)
could be drawn inside it. Sometimes, different shapes and descriptors (seeFigure 4) for nodes were used to represent attributes. In the 1960s, the firstthree-dimensional images were drawn (Laumann, 1966).
Since the 1970s a number of computer programs have been written thatautomatically generate visual presentations of relational data sets(Kadushin, 1974; Levin, 1976; Klovdahl, 1986; for more recent develop-ments see Section 3). In general, visualization concepts and techniques co-evolved with the elaboration of the tool of relational analysis in the socialsciences which during the late 1970s and early 1980s had increasingly beencovered under the label ‘social network analysis’. This type of structuralanalysis combines specific mathematical and statistical techniques to com-pute indices for network positions and total network structures with multi-purpose methods like multi-dimensional scaling (MDS) or cluster analysis.Therefore it is no surprise that parallel to the development and applicationof computer programs for sociograms MDS has been used since the 1970sby a number of authors either to visualize the proximity and centrality ofactors on the basis of their path distances or the similarity of theirrelational profiles (for example, Laumann and Knoke, 1987; Laumann andPappi, 1976). Visualization techniques, like the concepts used for theanalysis of policy networks, evolved from social network analysis.
2.4. Principal Procedures in Policy Network Visualization
When applying the term ‘policy network’ in political science, a researchertakes at least one basic assumption for granted: ‘configurational’ structurein policy, politics, and polity matters. Modeling social structures as ‘net-works’ means choosing nodes and links as the basic units of analysis. Inpolicy network or policy processes analysis the nodes generally represent
Figure 4. Historical Example of a Sociogram (Roethlisberger and Dickson, 1939)Copyright g 1939 by the President and Fellows of Harvard College. Reprinted by permission of Harvard
University Press.
BRANDES ET AL.: VISUALIZATION OF POLICY NETWORKS 83
political actors – usually corporate actors (organizations) – but may alsorepresent events or issues in a policy process. Links (edges) may representdifferent types of relations, such as communication, participation, resourceexchange, social and political support, influence reputation, or statusrelations.
If one indeed agrees that these kinds of sociopolitical structures matterby restricting, and likewise enabling, actors in their behavior (Knoke,1990a), the precise description and detailed analysis of such relationalstructures are important steps in political analysis. However, politicalaction and interaction is influenced not only by the actors’ relationshipswith one another but also by their attributes such as legal form, size,organizational type, age of the organization, resources, interests, attitudestowards political issues, tasks, functions, and nationality. Relational analy-sis is therefore often combined with the analysis of categorical data.
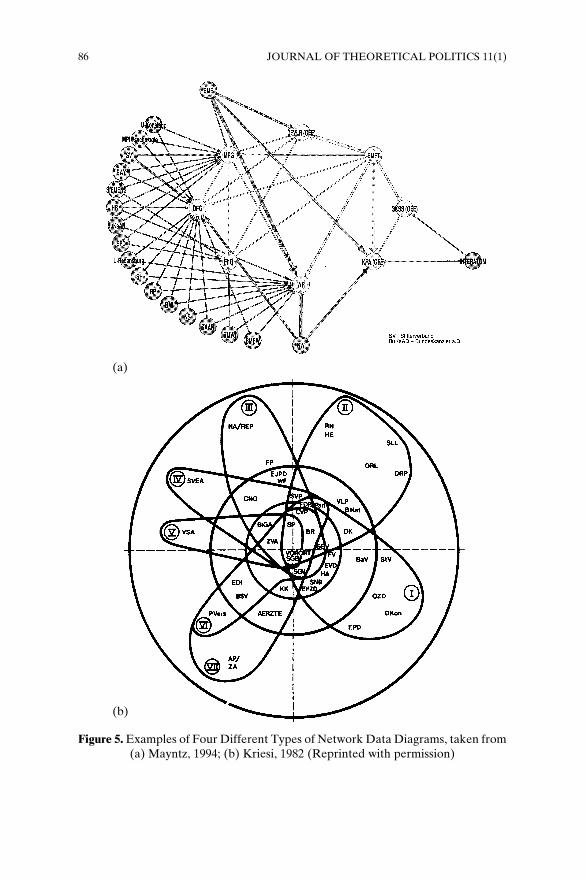
There is a small but growing family of quantitative studies on policynetworks. Most of these use graphical forms – besides matrices and tables –in the presentation of data and analytical results. At least four visualizationmethods are currently in use. One is the sociogram, which is the mostintuitive way of presenting the structural positions of individual actors aswell as their subgroupings in an overall configuration. Since the number ofactors that can be displayed in a sociogram is severely limited, the MDSscattergram is taken as an alternative solution, which displays the actorpositions only in a two- or three-dimensional space without actuallydrawing the lines of their interconnections. Further techniques such as thedendrogram and the Venn diagram are simple ways to represent thehierarchical subgroupings of actors according to some criteria of similarityor dissimilarity in their relational profile or their affiliations in the samenetwork subgroups (e.g. cliques, cores, clans, etc.). The following is a list ofwhat seem to be the four most common methods of visualizing policynetwork data, with citations of policy network studies using them (see alsoFigure 5):
• the sociogram (e.g. Doreian and Albert, 1989; Mayntz, 1993, 1994; Pappi,1995; Pappi et al., 1995; Krempel, 1997);
• the MDS scattergram (e.g. Knoke, 1990b, for an application in inter-national relations; Laumann and Pappi, 1976; Laumann and Knoke,1987; Manigart, 1986; Schneider, 1992, 1993; Schneider and Werle,1991);
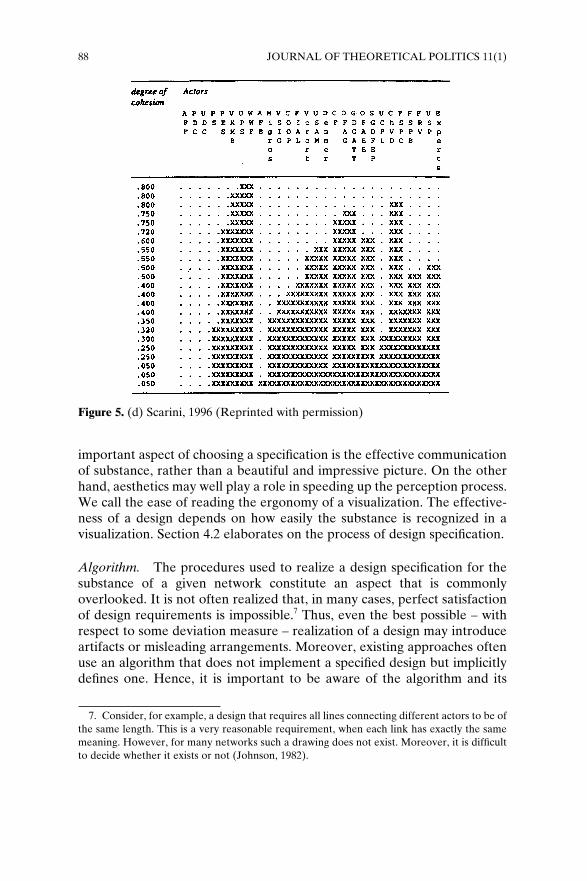
• the dendrogram (e.g. Schneider, 1988; Scarini, 1996); and• the Venn diagram (e.g. Kriesi, 1982).
The small number of examples of publications with images of policynetworks reflects the fact that so far only a few quantitative policy networkstudies have been conducted.
84 JOURNAL OF THEORETICAL POLITICS 11(1)
3. Fundamental Aspects of Visualization and the State of the Art
In the previous sections, it was argued that visualization is an important,non-trivial component of network analysis. Even though a fair amount ofcomputer software is available to facilitate graphical editing, and evenautomatic layout of networks, the state of the art is too heuristic to besatisfactory. This argument is grounded in the long-established principlethat every type of information visualization should be accomplishedaccording to an appropriately defined mapping of data to graphics. Eventhough this may seem a trivial statement, we indicate in this section howcommon methods for visualizing networks disregard some of the con-sequences arising from this principle. A systematic approach to over-coming such limitations is proposed in Section 4.
3.1. The Three Aspects of Information Visualization
Information visualization consists of an appropriate transformation ofinput data to output graphics (Bertin, 1983). That is, relevant informationcontained in the data is to be expressed by honestly generated visual clues.An ideal visualization would, in the simplest way, reveal the information,the whole information, and nothing but the information contained in thedata. We therefore argue that a visualization method is acceptable only if itclearly identifies the relevant information, defines an appropriate mapping,and generates the image accordingly. We refer to these three aspects assubstance, design, and algorithm, respectively.
Substance. The purpose of visualizing networks is the communication ofsubstance, either to the researcher her/himself, or to third parties. Thesubstance of policy network data is specific information about politicalstructures.
Consequently, any network visualization should be concise and preciseabout the information it intends to communicate, and the means it uses todo so. Any ‘open’, i.e. unspecific, presentation of such data either producesa visual puzzle – or a ‘crypto-graphical mystery’ (Tufte, 1983) – or anambiguous picture allowing many interpretations, some of which mighteven convey false information. In Section 4.1, we provide a list of the mostimportant network measures, i.e. the typical substance of a network.
Design. Unlike the way it is commonly understood, design does not meanaesthetics, beauty, or elegance. As the British designer Terence Conran(1996) puts it, design incorporates 98 percent function and 2 percentaesthetics. The design of a visualized network is the specification of how itssubstance is mapped to graphical elements, which implies that the most
BRANDES ET AL.: VISUALIZATION OF POLICY NETWORKS 85
Figure 5. Examples of Four Different Types of Network Data Diagrams, taken from(a) Mayntz, 1994; (b) Kriesi, 1982 (Reprinted with permission)
(a)
(b)
86 JOURNAL OF THEORETICAL POLITICS 11(1)
Figure 5. (c) Laumann and Knoke, 1987 (Reprinted with permission)
BRANDES ET AL.: VISUALIZATION OF POLICY NETWORKS 87
important aspect of choosing a specification is the effective communicationof substance, rather than a beautiful and impressive picture. On the otherhand, aesthetics may well play a role in speeding up the perception process.We call the ease of reading the ergonomy of a visualization. The effective-ness of a design depends on how easily the substance is recognized in avisualization. Section 4.2 elaborates on the process of design specification.
Algorithm. The procedures used to realize a design specification for thesubstance of a given network constitute an aspect that is commonlyoverlooked. It is not often realized that, in many cases, perfect satisfactionof design requirements is impossible.7 Thus, even the best possible – withrespect to some deviation measure – realization of a design may introduceartifacts or misleading arrangements. Moreover, existing approaches oftenuse an algorithm that does not implement a specified design but implicitlydefines one. Hence, it is important to be aware of the algorithm and its
7. Consider, for example, a design that requires all lines connecting different actors to be ofthe same length. This is a very reasonable requirement, when each link has exactly the samemeaning. However, for many networks such a drawing does not exist. Moreover, it is difficultto decide whether it exists or not (Johnson, 1982).
Figure 5. (d) Scarini, 1996 (Reprinted with permission)
88 JOURNAL OF THEORETICAL POLITICS 11(1)
peculiarities which underlie a visualization process. Some more detail isgiven in Section 4.3.
3.2. Current Approaches to Network Visualization
Nowadays, approaches to network visualization try to make use of what isavailable rather than stating what is desired and then asking for toolsimplementing these requirements. Consequently, recent work on visual-ization orients itself towards the applicability and usefulness of existingcomputer software. Here, we argue that the tools commonly used do notproperly identify all three of the aspects previously described.
The tools available for network visualization fall roughly into fourcategories: general purpose graphical editors, two kinds of drawing pro-grams not specifically developed for social networks, and tools andstrategies designed for visualizing social networks. The last category ismost interesting because, from a formal point of view, the substance ofpolicy and social networks are comparable (see Section 4.1).
General purpose graphical editors. They are the least comfortable, yetmost flexible, tools, and are available for virtually every computer plat-form. They provide a rich set of editing functions, but almost no featurestailored to networks. For example, when an actor is moved on the screen,its links are not moved accordingly because the program does not knowabout structural issues. The burden of specifying and implementing graph-ical design is placed on the user. Moreover, ‘manual’ generation of agraphical presentation, even for networks of moderate size, is a tedious, ifnot intractable, task.
Network drawing software from other disciplines. We distinguish two suchcategories. One consists of those programs that draw specific networksthough not social networks, like, for instance, molecule structures.8 Theseprovide means to position the nodes of the network in certain, domain-dependent ways. For example, the atoms and bonds of a molecule arearranged according to underlying energy laws. Obviously, such programsdo not account for the substance of a policy network. And because of that,they clearly do not specify an effective design. Their usefulness is limited tothe fact that they, in general, produce drawings that are pleasing from anergonomic point of view.
The other category consists of general purpose network drawing soft-ware and it contains computer programs that typically are domain inde-pendent graph layout programs – programs that arrange the nodes and
8. See MOVIEMOL (http://chem-www.mps.ohio-state.edu/~lars/moviemol.html) for apopular example.
BRANDES ET AL.: VISUALIZATION OF POLICY NETWORKS 89
links of a network – offering a variety of algorithms for different layoutstyles (GRAPHLET,9
DAVINCI,10 and many others). The design principlesimplemented by these algorithms are usually ergonomic requirements likesmall drawing area, number of line crossings, or number of bends in a line,that apply to any kind of network visualization.11 Again, they do notaccount for the substance of policy networks, and hence make no attemptto specify an effective design for it.
Software and strategies for social networks. This category comprises, forexample, routines for MDS (e.g. Kruskal and Wish, 1978) or spectralpartitioning (e.g. Mohar, 1991; Richards and Seary, 1997), plots in analyt-ical software packages, designated drawing programs for social networks,and the only living tradition of drawing sociograms that could be trackeddown, circle diagrams.
MDS and spectral partitioning are arguably the strategies in networkvisualization for which substance, design, and algorithm are most clearlyidentified. Both produce scattergrams: MDS plots reflect proximity inhigher dimensional data (e.g. path distances) in fewer dimensions, andspectral partitioning plots are produced according to eigenvectors ofcertain network related matrices. Both methods take on a very dis-tinguished interpretation of a network’s substance and therefore eitherthey display one aspect of it or we must assume that all the informationcontained in the network is comprehensible from Euclidean distances,which form the basic information in a scattergram. The stress value(Kruskal and Wish, 1978) of an MDS provides a measure of how well theplot fits the design (‘map proximity to Euclidean distances’).
Drawing programs like KRACKPLOT12 (Krackhardt et al., 1994), PAJEK
13
(Batagelj and Mrvar, 1997), or MULTINET14 are the most advanced tools
available today. Besides actor positioning according to MDS and eigendecomposition, respectively, the first two also include refinements of thewell-known Spring Embedder (Eades, 1984), a heuristic for laying outarbitrary kinds of networks.15 Here, the design is a function of thealgorithm rather than the substance. However, it is interesting to note thatapplying these algorithms seems very reasonable, if the substance isdefined to be proximity in terms of path distances. The implied design is
9. http://www.fmi.uni-passau.de/Graphlet/10. http://www.informatik.uni-bremen.de/~inform/forschung/daVinci/daVinci.html11. For a comprehensive survey on general graph layout see the annotated bibliography of
Di Battista et al. (1994).12. http://www.contrib.andrew.cmu.edu/~krack/13. http://vlado.mat.uni-lj.si/pub/networks/pajek/default.htm14. http://www.sfu.ca./~richards/15. The basic idea is to consider the nodes of the network to be repelling rings. Those
linked are joined by a spring and a positioning with low forces exerted on the rings is sought.
90 JOURNAL OF THEORETICAL POLITICS 11(1)
then similar to the design of MDS with some additional ergonomic criteria,e.g. nodes being distributed more evenly in the layout space. Krempel(1997) uses a similar placement algorithm, but has no generally availabletool to offer.
The idea of circle diagrams is to place the actor nodes on an imaginarycircle, which was assumed to make the pattern of lines more visible (Scott,1991: 149). This clearly defies any definition of substance. It is a designpurely based on a doubtful ergonomic criterion (simplification throughprescribed shape) and has proved confusing (Blythe et al., 1995). Anextension to this design requires placing actors so that the total length ofconnecting lines is kept to a minimum (Krempel, 1993). Even though densesubgraphs then tend to cluster within small arcs, there is no precisedefinition of the substance thus revealed and no indication of whether thisdesign is effective.
In summary, existing methods for policy network visualization do notclearly identify substance, design, and algorithm at the same time. The onlyexceptions are diagrams resulting from designated analytical tools, likeMDS or eigen analysis. However, they disregard ergonomy and have a verylimited definition of a network’s substance. Because the designs of MDSand partitioning methods are combined with ergonomic criteria, springembedder variants seem to point in the right direction. Unfortunately, thesubstance conveyed by their design is only implicitly defined. It might turnout that the ergonomic criteria incorporated (in particular uniform nodedistribution and uniform edge lengths) work well enough in displayingmany interesting aspects of a network (such as symmetry, cohesivesubgroups, brokers). For now, this remains an open question that can onlybe answered by careful analysis of what one wants to show and thesynthesis of an appropriate design to which these procedures can then becompared, as well as by empirical validation. The following sectionprovides a first step towards a sound basis for analysis and judgement.
4. A Formal Approach to Network Visualization
In the previous section, we divided the process of network visualizationinto three major components: substance, design, and algorithm. We nowpropose a framework that is intended to serve as a guideline in producingvisualizations and, even more importantly, tools for automatic visualizationof networks. The framework respects the subdivision in Section 3 andviews graphical presentation as a semiotic system for visual communication(Krampen, 1990). Note that we do not propose a general solution to theproblem of network visualization but a basis for the analysis and compari-son of existing approaches and a starting point for future developments.
BRANDES ET AL.: VISUALIZATION OF POLICY NETWORKS 91
4.1. Network Substance
The different methods and strategies of network visualization are highlycontingent on the general aim of policy network analysis and its specific useof the general ‘network analytic tool box’ (Kenis and Schneider, 1991) forthis purpose. The basic goal in the study of policy networks is the structuraldescription of the actors and the analysis of relational configurations or‘actor constellations’ (Scharpf, 1997) that are involved in the making of(primarily) public policies. A policy study using the network approachshould, first, delineate the set of relevant actors engaged (boundaryspecification) and, second, identify the relations among the actors whichare of particular significance and consequence for the policy outcome.Relevant relations may be the exchange of information and expertise (e.g.legal advice), the signaling of interest positions for coalition building, or themutual support by financial and personal resources. The guiding ideabehind this analytical perspective is that a certain policy may be explainedby the structured interaction within the actor set. Structuring then isunderstood as an emergent effect which restricts as well as enables. For thistask, policy network analysis borrows a number of formal concepts andstatistical measures from the general methodological toolkit of socialnetwork analysis.16
Among the broad spectrum of network analytic methods we maydistinguish between two types of structural analysis which are pursued atthree different levels. On the one hand, there are structural methodsaiming at a detailed description of whether and how the different actors inthe network are connected to each other via direct and/or indirect links ofcommunication, support, or other flows of policy resources. This may becalled the connectedness perspective. The other type of structural analysisis less interested in whether actors are directly or indirectly connected, butmore in the similarity or dissimilarity of the profiles of the relations inwhich an actor is involved. Actors with an identical or nearly identicalprofile are said to have structurally equivalent network positions. Bothtypes of structural analysis may be used to analyse quite different aspects ofthe overall network.
For a structural description at the actor level there is a bunch of methodsmeasuring the relative positioning of actors based on their direct andindirect ties to all other actors in the network. On the basis of graphtheoretical notions (e.g. reachability, path distance, and degree) someconcepts try to assess how central or peripheral in a communicationstructure an actor is. Others rely more on techniques stemming from input–
16. For a comprehensive summary of social network analysis, its levels of analysis and itsmethodological tools see Wassermann and Faust (1994) or Scott (1991).
92 JOURNAL OF THEORETICAL POLITICS 11(1)
output analysis or status measurement in sociometry, to derive conceptsindicating the ‘prestige’ or the ‘prominence’ of an actor in an overall actorconstellation.
At the next level, analysis is focused on the question of how a givennetwork is structurally partitioned into subnetworks or subgroups. Suchdifferentiations are possible from a connectedness perspective as well asfrom a profile perspective. The identification of subgroups based onconnectedness aims to find collections of actors who cluster together morecohesively than others. For instance, it tries to discover whether thenetwork is integrated or whether it is segregated into two or more subsetswhere the subunits have more intensive internal relations. Related ques-tions are: how many such subsets exist and how closely are these actorsconnected to each other in each subset? Operational concepts that arehelpful for this analysis are components, cliques, clans, cores, on the onehand, but also special locational properties such as the position as a ‘bridge’or a ‘broker’ in a network linking the subgroups to each other. In contrast,subgrouping based on profile similarity tries to find ‘blocks’ of structurallyequivalent actors, i.e. actors with identical or highly similar profiles ofrelations. A block then is interpreted as a social position fulfilling specificroles in an overall network. For the identification of these blocks, socialnetwork analysis provides for a still growing spectrum of aggregation anddivision methods (i.e. block modeling or cluster procedures).
At the highest network level, structural analysis tries to discover theoverall characteristics of the complete network structure such as how denseor how centralized it is. For this purpose it uses concepts such as density orcentralization to obtain aggregate measures of the total network that areuseful for comparative analysis.
Since the structure of a given policy network is analysed through specificmeasures of various structural properties, visualization should make theseproperties visible. In order to better understand the possibilities andlimitations of graphical design to convey the relevant information, typicalpolicy network substance is grouped into two main categories with foursubcategories each (see Table 1). These distinctions serve as a guideline forhow visualization can enhance the understanding of complex multi-dimen-sional settings by separating different kinds of information.
The first of the two main categories comprises those measures which aresolely dependent on the presence or absence of network links. They are thenetwork’s syntactical attributes, because they are completely determinedby the underlying network structure. On the other hand, there areproperties which do not depend on the relationships constituting thenetwork. These are the semantic attributes, because they relate elements ofthe abstract graph to their real counterparts. Since they are closely relatedto the actual study, only examples of such attributes can be given.
BRANDES ET AL.: VISUALIZATION OF POLICY NETWORKS 93
The first three subcategories in both columns of Table 1 correspond tothe three levels of interest: actor, group, and network.17 In policy networkanalysis, one is often interested in all three levels of aggregation simultane-ously in order to explore or communicate properties in their context. Mostdesirable visualization techniques therefore combine the associated per-spectives in an information-dense design that allows us to switch betweendetail levels within a single image. In other words, they should allow for thekind of micro/macro reading described in Tufte (1990).
4.2. Graphical Design
The graphical design of network visualization is the specification of how anetwork’s substance would best be represented in graphical form. Inmathematical terms, such specification corresponds, in general, to a con-strained optimization problem, and it is hence the purpose of a design tospecify the constraints and the objective function for this problem. Conse-quently, an algorithm would ideally produce a graphical representation
17. A fourth subcategory is introduced in order to account for properties which apply onlyin special cases. For example, every actor has a centrality score, and every actor belongs tosome group or not, but it need not be shown, for almost every actor, that the actor is not abroker.
Table 1. Principal Substance of a Network
Syntactical Attributes Semantic Attributes
Derived attributes of actors Attributes of actors, e.g.Centrality (undirected networks) size of an organizationPrestige / prominence (undirectednetworks)
age of organization
Structural partitions Attribute partitions, e.g.Cohesive subgroups organizational subunitsStructurally equivalent actors legal form of a policy actorRole-equivalent actors attitudes towards policy issues
Derived network attributes Network attributes, e.g.Size period of data gatheringDensity reliabilityCentralization differentiationInclusivenessCohesiveness
distinct institutional role such as politicalleader
94 JOURNAL OF THEORETICAL POLITICS 11(1)
satisfying all constraints and scoring optimally on the objective function.See Section 4.3 for more details on the algorithmic problem.
The formal model of a policy network is the mathematical notion of agraph. A finite set of vertices represents the actors, while relations betweenactors are modeled by edges. Each edge corresponds to a link between twoactors. Semantic attributes as defined in Section 4.1 correspond to labelsassigned to vertices, edges, or subsets of either, respectively.
A graphical design maps the formal network model to a formal descrip-tion of its graphical presentation. According to graphic designer JacquesBertin (1983; see also Mackinlay, 1986), a graphical presentation consists ofmarks (points, lines, areas, and, possibly, volume objects), i.e. zero- tothree-dimensional objects, for which positional (x-, y-, and, possibly,z-coordinates), retinal (size, shape, orientation, texture, color, brightness,and transparency), and temporal18 (in animation) properties are varied.Krampen (1990) advises restricting the grade of variation to perceivabledifferences.
The fundamental decision in a graphical design specification is the choiceof a representation format. That is, one has to choose what kind of marksare to represent which elements of the network model. From the manyconceivable representations of graphs, arguably the most familiar consistsof points depicting vertices (actors) and lines depicting edges (links).19
Sociograms and scattergrams (where edges are typically omitted) aremembers of the corresponding class of diagrams. Subclasses of thisrepresentation are obtained by globally fixing selected properties. Forinstance, the shape of lines representing edges could be ‘straight’ (straight-line representation) or ‘axis-parallel segments’ (orthogonal representa-tion). If the actor positions are fixed to lie equally spaced on a circle, therepresentation obtained is a circle diagram.
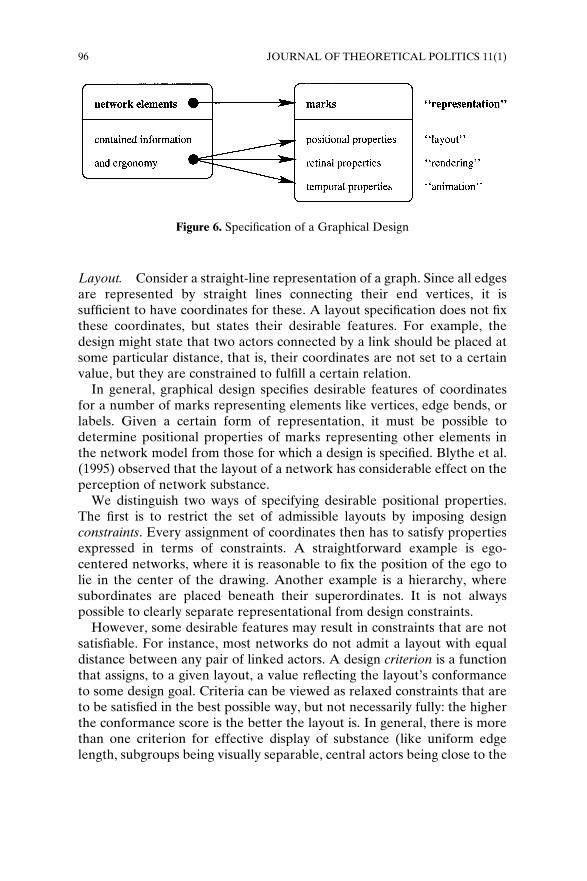
Positional, retinal, and temporal properties of marks need to be specifiedin accordance with the network’s substance. Additionally, ergonomicaspects have to be considered to ease perception. According to therespective classes of properties, we subdivide the design specification intolayout specification (positional properties), rendering specification (retinalproperties), and animation (temporal properties). The structure of a designspecification is summarized in Figure 6.
18. Since we are, in this article, concerned with the classical case of static networks only, wedo not go into detail about temporal properties.
19. Other types of representations are in use, too. Consider, for instance, a hierarchy inwhich each element has exactly one superordinate element. Each element of such hierarchycan be represented by an area containing the areas corresponding to subordinate elements. Asis the case with many other representations, only graphs of certain structures can be visualizedin this way. This representation is called inclusion drawing and is closely related to the Venndiagram.
BRANDES ET AL.: VISUALIZATION OF POLICY NETWORKS 95
Layout. Consider a straight-line representation of a graph. Since all edgesare represented by straight lines connecting their end vertices, it issufficient to have coordinates for these. A layout specification does not fixthese coordinates, but states their desirable features. For example, thedesign might state that two actors connected by a link should be placed atsome particular distance, that is, their coordinates are not set to a certainvalue, but they are constrained to fulfill a certain relation.
In general, graphical design specifies desirable features of coordinatesfor a number of marks representing elements like vertices, edge bends, orlabels. Given a certain form of representation, it must be possible todetermine positional properties of marks representing other elements inthe network model from those for which a design is specified. Blythe et al.(1995) observed that the layout of a network has considerable effect on theperception of network substance.
We distinguish two ways of specifying desirable positional properties.The first is to restrict the set of admissible layouts by imposing designconstraints. Every assignment of coordinates then has to satisfy propertiesexpressed in terms of constraints. A straightforward example is ego-centered networks, where it is reasonable to fix the position of the ego tolie in the center of the drawing. Another example is a hierarchy, wheresubordinates are placed beneath their superordinates. It is not alwayspossible to clearly separate representational from design constraints.
However, some desirable features may result in constraints that are notsatisfiable. For instance, most networks do not admit a layout with equaldistance between any pair of linked actors. A design criterion is a functionthat assigns, to a given layout, a value reflecting the layout’s conformanceto some design goal. Criteria can be viewed as relaxed constraints that areto be satisfied in the best possible way, but not necessarily fully: the higherthe conformance score is the better the layout is. In general, there is morethan one criterion for effective display of substance (like uniform edgelength, subgroups being visually separable, central actors being close to the
Figure 6. Specification of a Graphical Design
96 JOURNAL OF THEORETICAL POLITICS 11(1)
center of the drawing) and ergonomic readability (like uniform vertexdistribution, small total area, small number of edge crossings). Most of thetime imposed criteria conflict, so a perfect layout does not optimize eachcriterion in isolation but rather their combination. In this combination,criteria might be weighted according to their relative importance. Ageneric mathematical model for layout design and generation is given byBrandes and Wagner (1997).
Rendering. In a sociogram, instead of points or circles, one might want tohave names or logos for actors constituting the nodes, line thickness mightbe varied to indicate different strengths of ties, or polygons separatingsubgraphs might be desired in order to distinguish structural subgroups.Such rendering rules do not alter a representation, or positional propertiesof its marks, but only its visual appearance, i.e. retinal properties. We donot go into further detail here, since it seems to us that the issue ofrendering a presentation of relational data does not differ as much from therendering of other data as does its layout. Therefore, most research invisualization of categorical data also applies to the rendering of relationaldata (see e.g. Tufte, 1983).
It seems to be a reasonable rule of thumb that syntactical attributesshould be displayed mostly by positional properties of graphical marks,while semantic attributes should determine the retinal properties. Such adistinction also supports the development of a general tool for networkvisualization, since, in general, it is easier to customize a program’srendering capabilities than its layout features.
4.3. Algorithmic Realization
Given a network model and a graphical design specification, a drawing hasto be generated according to the requirements manifested in the design.The procedure used to generate the drawing is called algorithmic realiza-tion of the design. Since the representation is fixed in the design, thealgorithm has to compute a layout, render, and possibly animate it.
Typically, the rules contained in a rendering specification do not result inconflicting requirements. A reasonable rendering specification should thusnot pose problems in terms of its algorithmic realization.
Quite conversely, almost every layout specification leads to a difficultoptimization problem. A layout generated by the algorithm has to satisfyevery constraint, as well as to optimize the weighted sum of all criteria.Such requirements are often intractable, if the algorithm is to generate anoutput in reasonable time. In this case, approximate solutions are sought.A well known and fairly successful procedure for mostly unconstraineddesigns is simulated annealing (Metropolis et al., 1953). A prominent
BRANDES ET AL.: VISUALIZATION OF POLICY NETWORKS 97
software using this type of algorithm is KRACKPLOT (Krackhardt et al.,1994). When applying simulated annealing, the objective function of adesign is considered to be the energy of a physical system. A probabilisticsequence of layouts that change moderately from one layout to the other isproduced according to some generation scheme that simulates the behaviorof the physical system in a heat bath for slow annealing. Note that differentresults may be produced in different runs of an algorithm. This is obviousfor probabilistic methods like simulated annealing, but it also holds formany deterministic methods that depend on the initial configuration.
We stress again the importance of clearly identifying and distinguishing adesign and its algorithmic realization. For example, Freeman (1996)compares a layout algorithm from the graph drawing community (Kamadaand Kawai, 1989) with an algorithm implemented in KRACKPLOT. He statesthat the spring embedder variant of Kamada and Kawai ‘is based on anassumed ‘‘attraction’’ between adjacent points and a ‘‘repulsion’’ betweennon-adjacent points’ (Freeman, 1996), while the algorithm in KRACKPLOT
‘employs synthetic annealing to minimize the distance of each point fromall the others to which it is adjacent’ (Freeman, 1996). These appear to bequite different approaches because, in the first case, a physical analogy isused to describe the design, while in the second case, some other physicalanalogy is used to describe the applied algorithm. However, both designsare strongly related. And even though different algorithms are employed,both do sufficiently realize the design. It hence comes as no surprise at allthat ‘the arrangement produced [. . .] is quite similar’ (Freeman, 1996).
5. Example
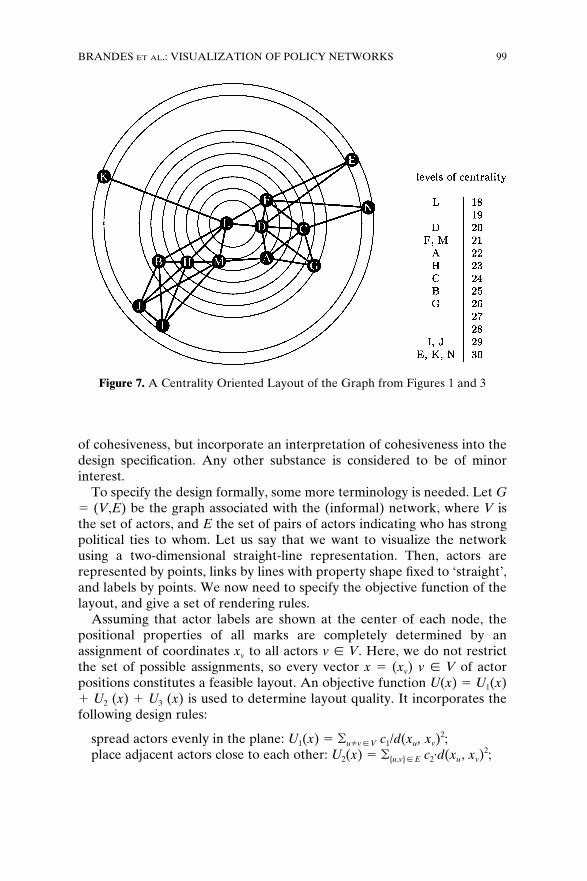
In this section, we use a network analysed by Doreian and Albert (1989) toexemplify some of the issues we have raised in the previous sections (cf.Figures 1 and 3). We therefore point out what is chosen to be the network’ssubstance, devise a design, indicate some algorithmic aspects, and discussthe result shown in Figure 7. Note that the example is set up so that it givesa visualization which is illustrative, but far from excellent.
Doreian and Albert hypothesized that the actors can be partitioned intotwo camps, based on their strong political ties. To visualize their findings,they used an MDS scattergram based on path distances. Hence, for thepurpose of this example, we define the substance of the network to be, onthe first level of aggregation (actor level), the degree of closeness central-ity,20 and on the second level of aggregation (subnetwork level), a partition-ing into cohesive subgroups. Note that we do not employ a formal measure
20. Regarding this interpretation see also Krempel (1993: 10).
98 JOURNAL OF THEORETICAL POLITICS 11(1)
of cohesiveness, but incorporate an interpretation of cohesiveness into thedesign specification. Any other substance is considered to be of minorinterest.
To specify the design formally, some more terminology is needed. Let G5 (V,E) be the graph associated with the (informal) network, where V isthe set of actors, and E the set of pairs of actors indicating who has strongpolitical ties to whom. Let us say that we want to visualize the networkusing a two-dimensional straight-line representation. Then, actors arerepresented by points, links by lines with property shape fixed to ‘straight’,and labels by points. We now need to specify the objective function of thelayout, and give a set of rendering rules.
Assuming that actor labels are shown at the center of each node, thepositional properties of all marks are completely determined by anassignment of coordinates xv to all actors v [ V. Here, we do not restrictthe set of possible assignments, so every vector x 5 (xv) v [ V of actorpositions constitutes a feasible layout. An objective function U(x) 5 U1(x)1 U2 (x) 1 U3 (x) is used to determine layout quality. It incorporates thefollowing design rules:
spread actors evenly in the plane: U1(x) 5 (uÞv [ V c1/d(xu, xv)2;
place adjacent actors close to each other: U2(x) 5 ({u,v} [ E c2·d(xu, xv)2;
Figure 7. A Centrality Oriented Layout of the Graph from Figures 1 and 3
BRANDES ET AL.: VISUALIZATION OF POLICY NETWORKS 99
place actor v with centrality score Cv at distance proportional to Cv 2maxu [ V Cu from the center z of the drawing: U3(x) 5 (v [ V c3 · (d(xv,z) 2c4 · (Cv 2 maxu [ V Cu))2
where c1 and c2 are constants controlling the scale of distances, c3 is aconstant controlling the relative influence of U3(x), and d(xu, xv) denotesthe Euclidean distance between positions xu and xv. Since U(x) attainshigher values for worse layouts, U(x) should be minimized to obtain alayout that conforms to our design specification. Note that we also assignedpoints to centrality levels. They are positioned in the center of the drawing,while their shape is set to ‘circle’, and their size is to reflect the level ofcentrality. In a similar way, a stem-and-leaf diagram of centrality scoreswas integrated to the right. The rendering rules used in this example arereadily observed from Figure 7.
We used an annealing type algorithm to (approximately) minimize U(x),and the built-in rendering capabilities of GRAPHWIN, a graph editorincluded in LEDA
21 (Mehlhorn and Naher, 1997).
Discussion. In the example, a number of important aspects have beenmade obvious. The most important is that one readily observes that theassignment of positions in the layout is a compromise between conflictingdesign goals. The constants have been chosen such that lying close to thecorrect radius is six times as important as lying close to an adjacent actor.Actor positions could be restricted to lie exactly at the correct radius but, inthis case, the goal of uniform edge length (the truth to the data principle)would be violated even more (e.g. actors K and L).22 Due to the number ofaccumulated conflicts, the deviation from their radius is larger for centralactors than for peripheral ones.
Next, we did not include more sophisticated ergonomic criteria likesufficient edge-to-vertex distance or small number of crossings. In theexample there are two links unnecessarily close to actors F and H,respectively. Furthermore, the graph can be drawn with a minimum of onepair of crossing lines (see Figure 1). It has been shown that crossings mighthamper structural understanding (Purchase et al., 1995). On the otherhand, a straight-line representation of a clique of four actors must placeone of them in the middle in order to avoid crossing lines, wronglysuggesting a higher degree of centrality (compare actors A, C, D, and G inFigures 1 and 7).
More elaborate rendering could improve on clarity and the amount of
21. Library of Efficient Datatypes and Algorithms. See http://www.mpi-sb.mpg.de/LEDA/leda.html
22. Observe that the optimal edge length implied by the expressions contributing to U1(x)and U2(x) is 4Îããããc1/c2, i.e. constant over all edges.
100 JOURNAL OF THEORETICAL POLITICS 11(1)
information displayed. For example, seven actors are County Council mem-bers, which is, in the analytical context of this network, relevant informationthat is easily indicated by altering the color property of their marks.
Despite these drawbacks, two easily identified camps are visible, whichhave not been preassigned in the design. Note that it would be easy tosuggest arbitrary grouping by simply moving members of different groupsapart (McGrath et al., 1997). Moreover, the most central actor (L) is clearlyvisible. The fact that one of the most peripheral actors (K) is directly linkedto L results in a very long edge, suggesting that closeness centrality mightnot reflect the intuitive notion of an actor being influential in a politicalnetwork.
6. Conclusion
There is a remarkable discrepancy between, on the one hand, the potentialof visualization techniques in the description, presentation, and explorationof policy networks and, on the other hand, the interest, experience, andtechniques available for producing effective visualizations. Consequently,this article aimed to bridge this discrepancy by arguing that it is worthwhilereflecting about the effective visualization of policy networks. The articlehas illustrated that a number of procedures and associated computerprograms exist which allow for the visualization of policy networks but thatthere is little discussion of their usefulness, nor are hints given by theirusers and producers on the effectiveness of the visualizations.
Consequently, this article has identified three dimensions which help toevaluate the effectiveness of the visualization of policy networks: sub-stance, design, and algorithm. It argues that effective visualization is acombination of providing an algorithmic solution to a substantive problemin such a way that basic design principles are respected. In other wordseach of the dimensions should consider as far as possible the principles setby the other two. In a time in which there is a rapid increase in theavailability of computing power and quality graphic equipment, one canexpect a similar increase in the use of graphical output in both research andcommunication. It is hence important to be able to assess the quality ofgraphical presentations.
A short review reveals that all three dimensions are almost neverconsidered sufficiently. Visualization tools tend to exclusively concentrateon one of them, leading to an uncontrolled determination of the other two.It seems that most of the visualizations of policy networks are, in the firstplace, the result of applying an algorithm which was developed for thecommunication of a very different type of information. As spelled out inthe article, policy networks are, however, phenomena which have to be
BRANDES ET AL.: VISUALIZATION OF POLICY NETWORKS 101
described in very specific terms in order to discover significant and usefulinformation about them.
Since the formal concepts of policy network analysis are well established,the next step is to devise principles for an effective design on the basis ofthis substance. The major problem here is the positioning of actors, i.e. thelayout of the network. It can be expected that most design goals willcontradict each other (as in the centrality/edge length trade-off in Section5). A possible approach is to combine different forms of visualization inorder to ‘triangulate’ different analytical perspectives. Each should providegreater accuracy in the description of selected aspects, while their combina-tion diminishes the risk of being misled by a methodological artifact.23
To come up with specific design principles for the visualization of policynetworks, much more research is needed, drawing on general insights intothe visualization of quantitative information, general semiotic principles,and experimental validations. It is our hope that algorithms for theresulting designs will be able to produce pictures which tell us more thanjust how complicated this world is.
REFERENCES
Batagelj, W. and A. Mrvar (1997) ‘A Package for Analyzing Large Networks’, Paperpresented at Sunbelt XVII, San Diego.
Bertin, J. (1983) Semiology of Graphics: Diagrams, Networks, Maps. Madison, WI: Universityof Wisconsin Press.
Blythe, J., C. McGrath and D. Krackhardt (1995) ‘The Effect of Graph Layout on Inferencefrom Social Network Data’, in F. J. Brandenburg (ed.) Proceedings of the Third Symposiumon Graph Drawing, Lecture Notes in Computer Science Vol. 1027, pp. 40–51. Berlin:Springer.
Borzel, T. A. (1997) Policy Networks. A New Paradigm for European Governance?, EUIWorking Paper RSC 97/19. San Domenico, Florence: European University Institute.
Brandes, U. and D. Wagner (1997) ‘A Framework for Graph Layout’, Paper presented at theSecond Workshop ‘Bits – Bilder – Bedeutung’, Bielefeld.
Conran, T. (1996) Terence Conran on Design. London: Conran Octopus.Di Battista, G., P. Eades, R. Tamassia and I. G. Tollis (1994) ‘Algorithms for Drawing
Graphs: An Annotated Bibliography’, Computational Geometry 4: 235–82.Doreian, P. (1988) ‘Using Multiple Network Analytic Tools for a Single Social Network’,
Social Networks 10: 287–312.Doreian, P. and L. H. Albert (1989) ‘Partitioning Political Actor Networks: Some Quantita-
tive Tools for Analyzing Qualitative Networks’, Journal of Quantitative Anthropology 1:279–91.
Eades, P. (1984) ‘A Heuristic for Graph Drawing’, Congressus Numerantium 42: 149–60.Freeman, L. C. (1996) ‘Visualizing Social Networks’, manuscript; available from http://
carnap.ss.uci.edu/vis.html
23. Triangulation is generally defined as the combination of methodologies in the study ofthe same phenomenon. It stems from a military metaphor pointing to the use of multiplereference points to locate an object’s exact position (Jick, 1979: 602). For an implicit use oftriangulation in network analysis see Doreian (1988).
102 JOURNAL OF THEORETICAL POLITICS 11(1)
Freeman, L. C. (1997) ‘Using Molecular Modeling Software in Social Network Analysis: APracticum’, Manuscript; available from http://eclectic.ss.uci.edu/~lin/chem.html
Heritier, A. (1993) ‘Policy-Netzwerkanalyse als Untersuchungsinstrument im EuropaischenKontext: Folgerungen aus einer empirischen Studie regulativer Politik’, in A. Heritier (ed.)Policy-Analyse, pp. 432–450. PVS-Sonderheft, Opladen: Westdeutscher.
Jick, T. D. (1979) ‘Mixing Qualitative and Quantitative Methods: Triangulation in Action’,Administrative Science Quarterly 24: 602–11.
Johnson, D. S. (1982) ‘The NP-Completeness Column: An Ongoing Guide’, Journal ofAlgorithms 3: 89–99.
Kadushin, C. (1974) The American Intellectual Elite (Computer Program developed byRichard Alba). Boston: Little, Brown.
Katz, L. (1947) ‘On the Matric Analysis of Sociometric Data’, Sociometry 10: 233–41.Kenis, P. and V. Schneider (1991) ‘Policy Networks and Policy Analysis: Scrutinizing a New
Analytical Toolbox’, in B. Marin and R. Mayntz (eds) Policy Networks. Empirical Evidenceand Theoretical Considerations, pp. 25–59. Frankfurt/M.: Campus.
Klovdahl, A. S. (1981) ‘A Note on Images of Networks’, Social Networks 3: 197–214.Klovdahl, A. S. (1986) ‘ViewNet: A New Tool for Network Analysis’, Social Networks 8: 313–
42.Knoke, D., ed. (1990a) Political Networks. The Structural Perspective. Cambridge: Cambridge
University Press.Knoke, D. (1990b) ‘International Relations’ (written with Jodi Burmeister-May), in D.
Knoke, Political Networks. The Structural Perspective, pp. 175–202. Cambridge: CambridgeUniversity Press.
Krackhardt, D., J. Blythe and C. McGrath (1994) ‘KRACKPLOT 3.0: An Improved NetworkDrawing Program’, Connections 17(2): 53–5.
Krampen, M. (1990) ‘Visual Communication and Semiotics’, in W. Koch (ed.) Semiotics in theIndividual Sciences (Part 2), pp. 486–512. Bochum: Brockmeyer.
Krempel, L. (1993) ‘Simple Representations of Complex Networks: Strategies for VisualizingNetwork Structure’, Paper presented at the 3rd European Conference for NetworkAnalysis, Munchen.
Krempel, L. (1997) ‘A Gallery of Social Structures’, Max-Planck-Institut fur Gesellschafts-forschung. Koln; http://www.mpi-fg-koeln.mpg.de/~lk/netvis.html
Kriesi, H. (1982) ‘The Structure of the Swiss Political System’, in Ph. Schmitter and G.Lehmbruch (ed.) Patterns of Corporatist Policy-Making, pp. 133–63. Beverly Hills: Sage.
Kruskal, J. B. and M. Wish (1978) Multidimensional Scaling. Beverly Hills: Sage.Laumann, E. O. (1966) Prestige and Association in an Urban Community. Indianapolis:
Bobbs-Merrill.Laumann, E. O. and D. Knoke (1987) The Organizational State. Social Choices in National
Policy Domains. Madison, WI: University of Wisconsin Press.Laumann, E. O. and F. U. Pappi (1976) Networks of Collective Action: A Perspective on
Community Influence Systems. London: Academic Press.Levin, M. L. (1976) ‘Displaying Sociometric Structures: An Application of Interactive
Computer Graphics for Instruction and Analysis’, Simulation and Games 7: 295–310.McGrath, C., J. Blythe and D. Krackhardt (1997) ‘Seeing Groups in Graph Layouts’,
Manuscript; available from http://www.andrew.cmu.edu/user/cm3t/groups.htmlMackinlay, J. D. (1986) ‘Automating the Design of Graphical Presentations of Relational
Data’, ACM Transactions on Graphics 5(2): 110–41.Manigart, Ph. (1986) Les Relations Inter-Organisationelles dans le Domaine de la Defense
Nationale. Brussels: Centre de Recherche et d’Information Socio-Politiques.Mayntz, R. (1993) ‘Networks, Issues, and Games: Multiorganisational Interactions in the Re-
structuring of a National Research System’, in F. Scharpf (ed.) Games in Hierarchies and
BRANDES ET AL.: VISUALIZATION OF POLICY NETWORKS 103
Networks. Analytical and Empirical Approaches to the Study of Governance Institutions, pp.189–210. Frankfurt/Boulder, CO: Westview/Campus.
Mayntz, R. (1994) Deutsche Forschung im Einigungsprozeß. Die Transformation der Akade-mie der Wissenschaften der DDR 1989 bis 1992, Frankfurt/New York: Campus.
Mehlhorn, K. and S. Naher (1997) LEDA: A Platform for Combinatorial and GeometricComputing, Cambridge: Cambridge University Press.
Metropolis, N., A. W. Rosenbluth, M. N. Rosenbluth, A. H. Teller and E. Teller (1953)‘Equation of State Calculations by Fast Computing Machines’, The Journal of ChemicalPhysics 21(6): 1087–92.
Mohar, B. (1991) ‘The Laplacian Spectrum of Graphs’, in Y. Alavi et al. (eds) Graph Theory,Combinatorics, and Applications, pp. 871–98. New York: Wiley.
Moreno, J. L. (1953) Who Shall Survive: Foundations of Sociometry, Group Psychotherapyand Sociodrama. Beacon, NY: Beacon House.
Muller, K. H. (1991) Symbole, Statistik, Computer, Design. Wien: Holder-Pichler-Tempsky.Northway, M. L. (1940) ‘A Method for Depicting Social Relationships Obtained by Socio-
metric Testing’, Sociometry 3: 144–50.Pappi, F. U. (1995) ‘Macht in Politikfeld-Netzen: Die Beziehungen zwischen arbeits- und
sozialpolitischen Akteuren der Bundesrepublik im internationalen Vergleich’, in K.-H.Reuband et al. (eds) Die deutsche Gesellschaft in vergleichender Perspektive. Festschrift furErwin K. Scheuch zum 65. Geburtstag. Opladen: Westdeutscher.
Pappi, F. U., Th. Konig and D. Knoke (1995) Entscheidungsprozesse in der Arbeits- undSozialpolitik. Der Zugang der Interessengruppen zum Regierungssystem uber Politik-feldnetze. Ein deutsch-amerikanischer Vergleich. Frankfurt/New York: Campus.
Purchase, H. C. (1997) ‘Which Aesthetic has the Greatest Effect on Human Understanding?’,in G. D. Battista (ed.) Proceedings of the Fifth Symposium on Graph Drawing, LectureNotes in Computer Science Vol. 1353, pp. 248–61. Berlin: Springer.
Purchase, H. C., R. F. Cohen and M. James (1995) ‘Validating Graph Drawing Aesthetics’, inF. J. Brandenburg (ed.) Proceedings of the 3rd Symposium on Graph Drawing, LectureNotes in Computer Science 1027, pp. 435–46. Berlin: Springer.
Richards, W. and A. Seary (1997) ‘Introduction to Eigen Analysis of Networks’, Paperpresented at Sunbelt XVII, San Diego; available from http://www.sfu.ca/~richards/wdr97.htm
Roethlisberger, F. J. and W. J. Dickson (1939) Management and the Worker. Cambridge, MA:Harvard University Press.
Scarini, P. (1996) ‘Elaboration of the Swiss Agricultural Policy for the Gatt Negotiations: ANetwork Analysis’, Swiss Journal of Sociology 22(1): 85–115.
Scharpf, F. W. (1997) Games Real Actors Play. Actor-Centered Institutionalism in PolicyResearch. Boulder, CO: Westview.
Schneider, V. (1988) Politiknetzwerke der Chemikalienkontrolle. Eine Analyse einer trans-nationalen Politikentwicklung. Berlin: De Gruyter.
Schneider, V. (1992) ‘The Structure of Policy Networks. A Comparison of the ‘‘ChemicalsControl’’ and ‘‘Telecommunications’’ Policy Domains in Germany’, European Journal ofPolitical Research 21: 109–29.
Schneider, V. (1993) ‘Networks and Games in Large Technical Systems. The Case ofVideotext’, in Scharpf, F. (ed.) Games in Hierarchies and Networks. Analytical andEmpirical Approaches to the Study of Governance Institutions, pp. 251–86. Frankfurt/Boulder, CO: Westview/Campus.
Schneider, V. and R. Werle (1991) ‘Policy Networks in the German TelecommunicationsDomain’, in B. Marin and R. Mayntz (eds) Policy Networks: Empirical Evidence andTheoretical Considerations, pp. 97–136. Frankfurt/Boulder, CO: Campus/Westview.
Scott, J. (1991) Social Network Analysis: A Handbook. London/Newbury Park: Sage.
104 JOURNAL OF THEORETICAL POLITICS 11(1)
Tufte, E. R. (1983) The Visual Display of Quantitative Information. Cheshire, CT: GraphicsPress.
Tufte, E. R. (1990) Envisioning Information. Cheshire, CT: Graphics Press.Wassermann, S. and K. Faust (1994) Social Network Analysis. Methods and Applications.
Cambridge: Cambridge University Press.
ULRIK BRANDES received his Diplom degree in computer science fromthe Rheinisch-Westfalische Technische Hochschule Aachen in 1994 and iscurrently a PhD candidate at the University of Konstanz. Research interestscenter around graph algorithms and visualization. ADDRESS: Faculty ofMathematics and Computer Science, University of Konstanz, 78457 Kon-stanz, Germany.[email: [email protected]]
PATRIK KENIS graduated as Doctor of Political and Social Science in 1989from the European University Institute in Florence. From 1988 to 1994 hewas Researcher and Programme Director at the European Center for SocialScience Welfare Policy Research (institute affiliated to the United Nations)in Vienna. Since 1994 he has been assistant professor at the Faculty of PublicPolicy and Management at the University of Konstanz where he teachespolicy and organization analysis, especially in the areas of health andwelfare. ADDRESS: Faculty of Public Policy and Management, Universityof Konstanz, 78457 Konstanz, Germany.[email: [email protected]]
JORG RAAB is a PhD candidate at the Faculty of Public Policy andManagement at the University of Konstanz. His research focuses oninstitutional coordination of political and economic activity. He is currentlywriting his dissertation on the governance structures of politicized privatiza-tion in East Germany. ADDRESS: Faculty of Public Policy and Manage-ment, University of Konstanz, 78457 Konstanz, Germany.[email: [email protected]]
VOLKER SCHNEIDER studied management, economics, and politicalscience in Mainz, Berlin, and Paris, receiving degrees in business manage-ment, economics, and political science. From 1982 to 1986 he was at theEuropean University Institute in Florence, receiving his PhD there in 1986.From 1986 to 1997 he was research fellow at the Max-Planck-Institut inCologne. Since 1997 he has been full professor of political science at theFaculty of Public Policy and Management at the University of Konstanz. Hisspecial research interests are state and interest group theory, policy analysis,network analysis, and telecommunications policy. ADDRESS: Faculty ofPublic Policy and Management, University of Konstanz, 78457 Konstanz,Germany.[email: [email protected]]
DOROTHEA WAGNER received her Diplom and PhD degrees in mathe-matics from the the Rheinisch-Westfalische Technische Hochschule Aachen
BRANDES ET AL.: VISUALIZATION OF POLICY NETWORKS 105
in 1983 and 1986, respectively. In 1992, she received her Habilitation degreefrom the Department of Mathematics at the Technische Universitat Berlin.Since 1994 she has been a full professor of computer science at theUniversity of Konstanz. Research interests are in the areas of discreteoptimization and graph algorithms, particularly as applied to graph drawing,VLSI design, communication networks, and transportation systems. She is amember of the editorial board of the Journal of Graph Algorithms andApplications. ADDRESS: Faculty of Mathematics and Computer Science,University of Konstanz, 78457 Konstanz, Germany.[email: [email protected]]