26
Explore and Evaluate A guide to research and data for the uninitiated Picture: Niels Heidenreich
| Date post: | 17-Jul-2015 |
| Category: |
Technology |
| Upload: | ben-dressler |
| View: | 165 times |
| Download: | 0 times |

Explore and EvaluateA guide to research and data for the uninitiated
Picture: Niels Heidenreich

What do you know about data?
Qual Quant

Qual Quant
Subjective
ObjectiveLongitudinal
InterdependentFidelity
Significant
p-valueconfidence interval
nalpha normally distribute
correlated ordinal
behavioural
attitudinal self-report

All clear?
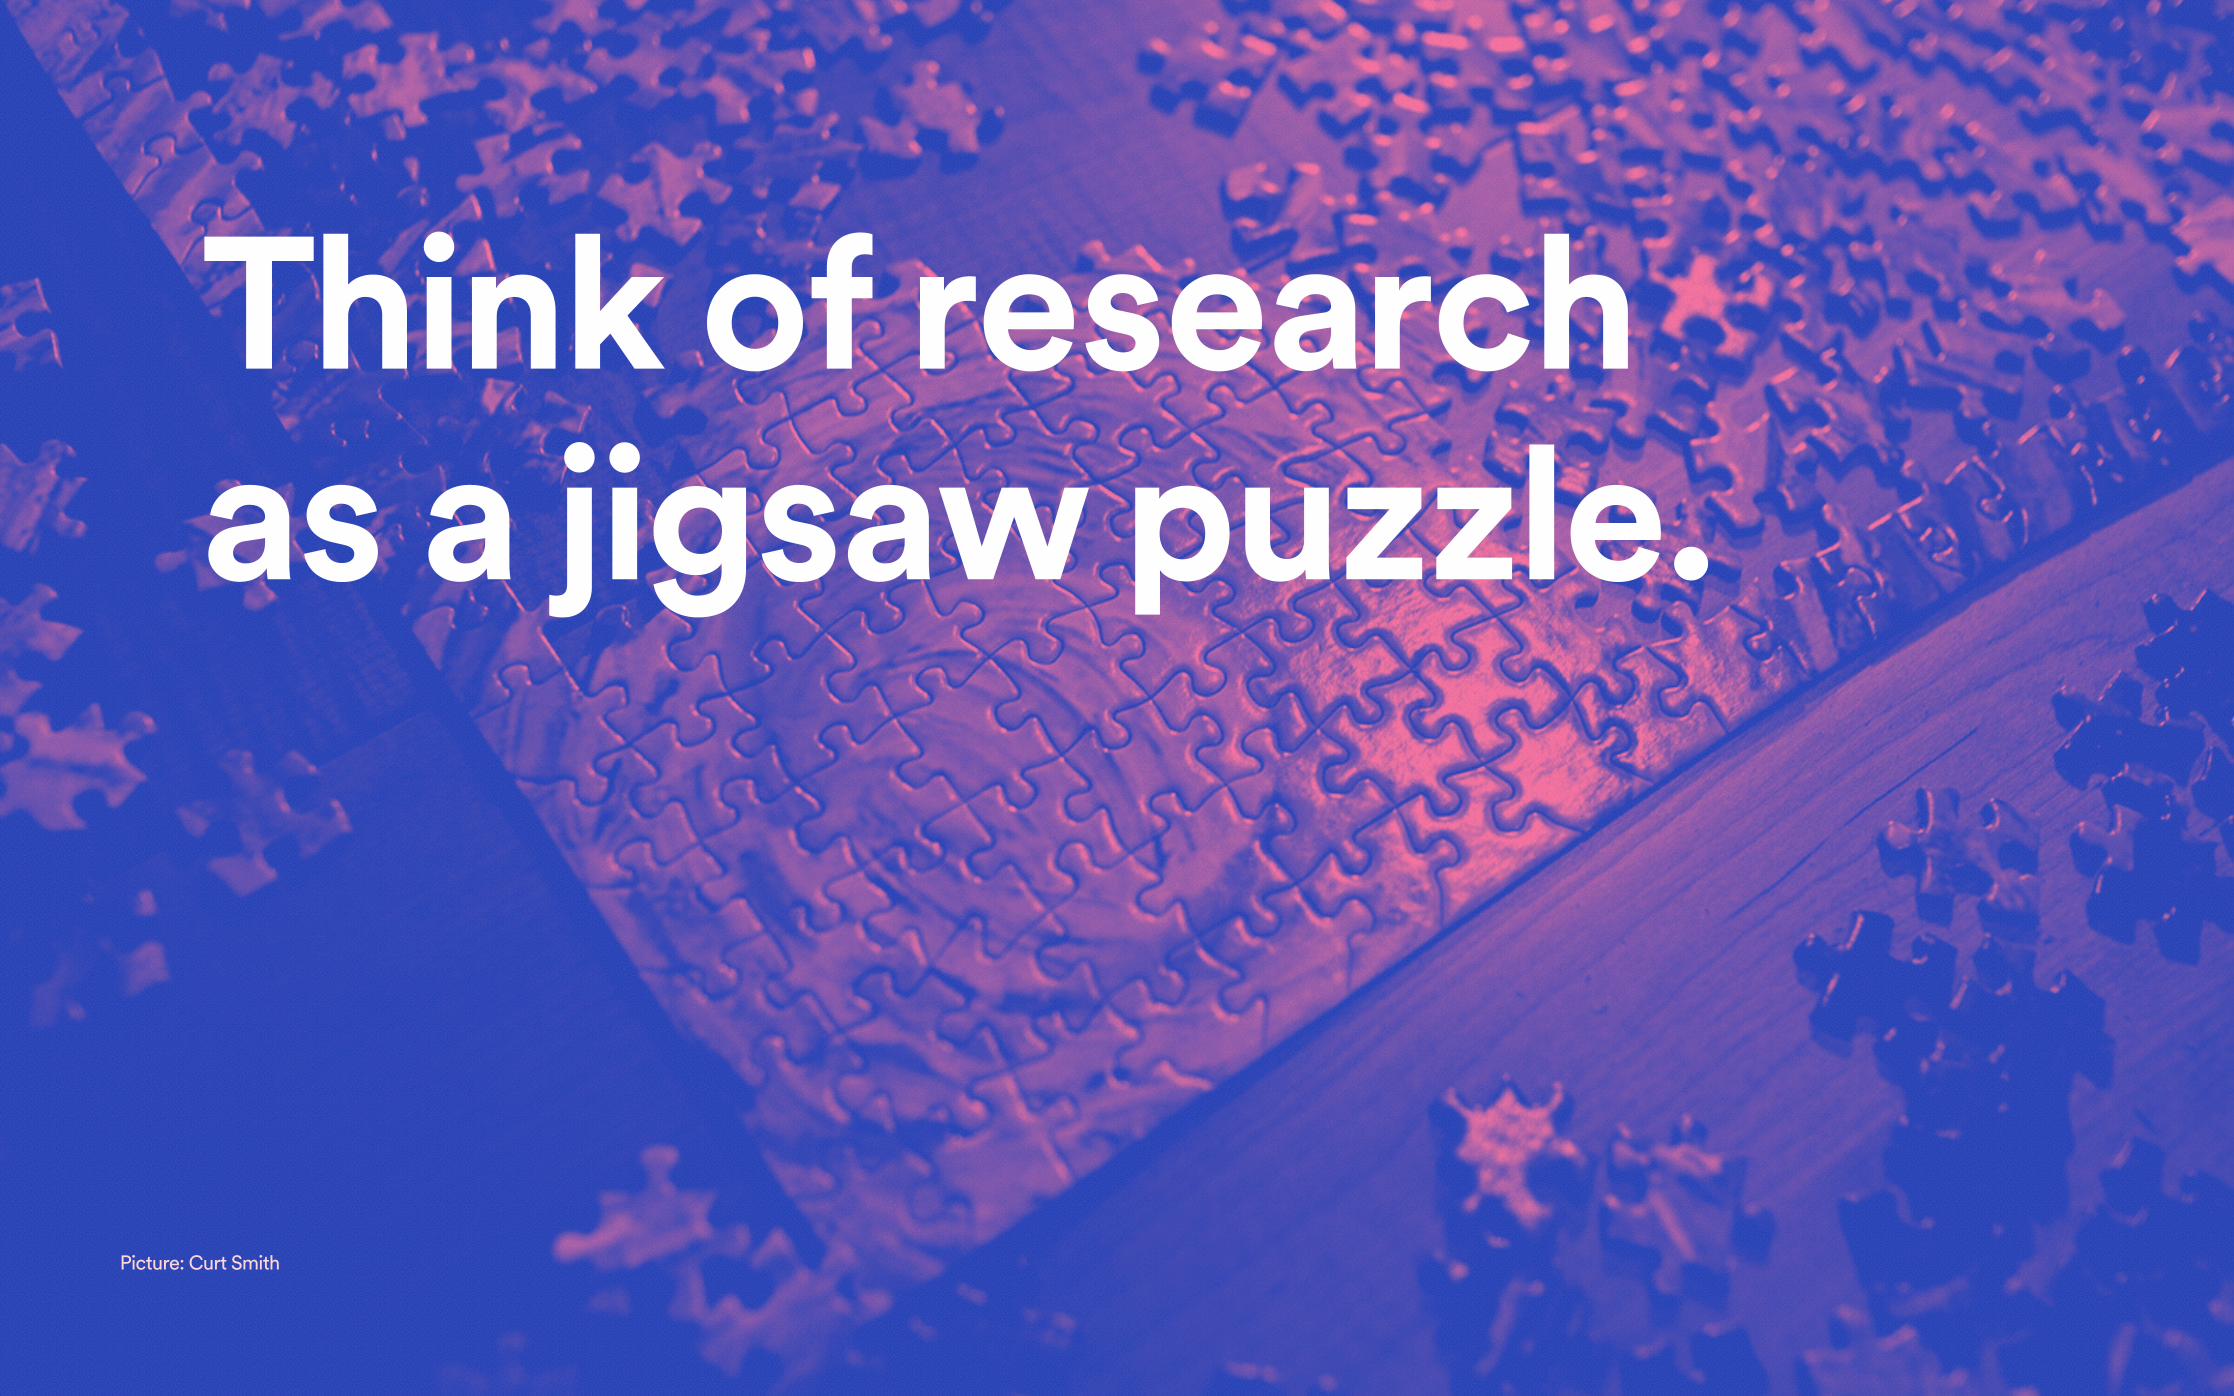
Think of research as a jigsaw puzzle.
Picture: Curt Smith

First you explore the lay of the land.What are the main colours? Where are the corners and edges? What are good distinct starting points?

Then you start evaluating individual piecesIs this the same colour as that? Are those part of the same object? Does that piece fit where I think it fits?

Explore / EvaluateThe one distinction to get right!
Picture: Pablo Ruiz Múzquiz

Exploration research is like a fishing net
Picture: Christian Haugen

Explore
You can go fishing with simple tools or complex machinery
You won’t know exactly what you will get in advance
Your catch will give you ideas about what is under the surface
Throwing the net out repeatedly will have diminishing returns
Missing a fish will have no serious consequences

Checklist
What is it you are exploring? Describe the population and the part of their life that you’re interested in
Are you exploring all sources available to you? From talking to people on the street to digging through usage logs
Is your scope wide enough? Do not restrict the flow of incoming data. Let yourself be surprised.
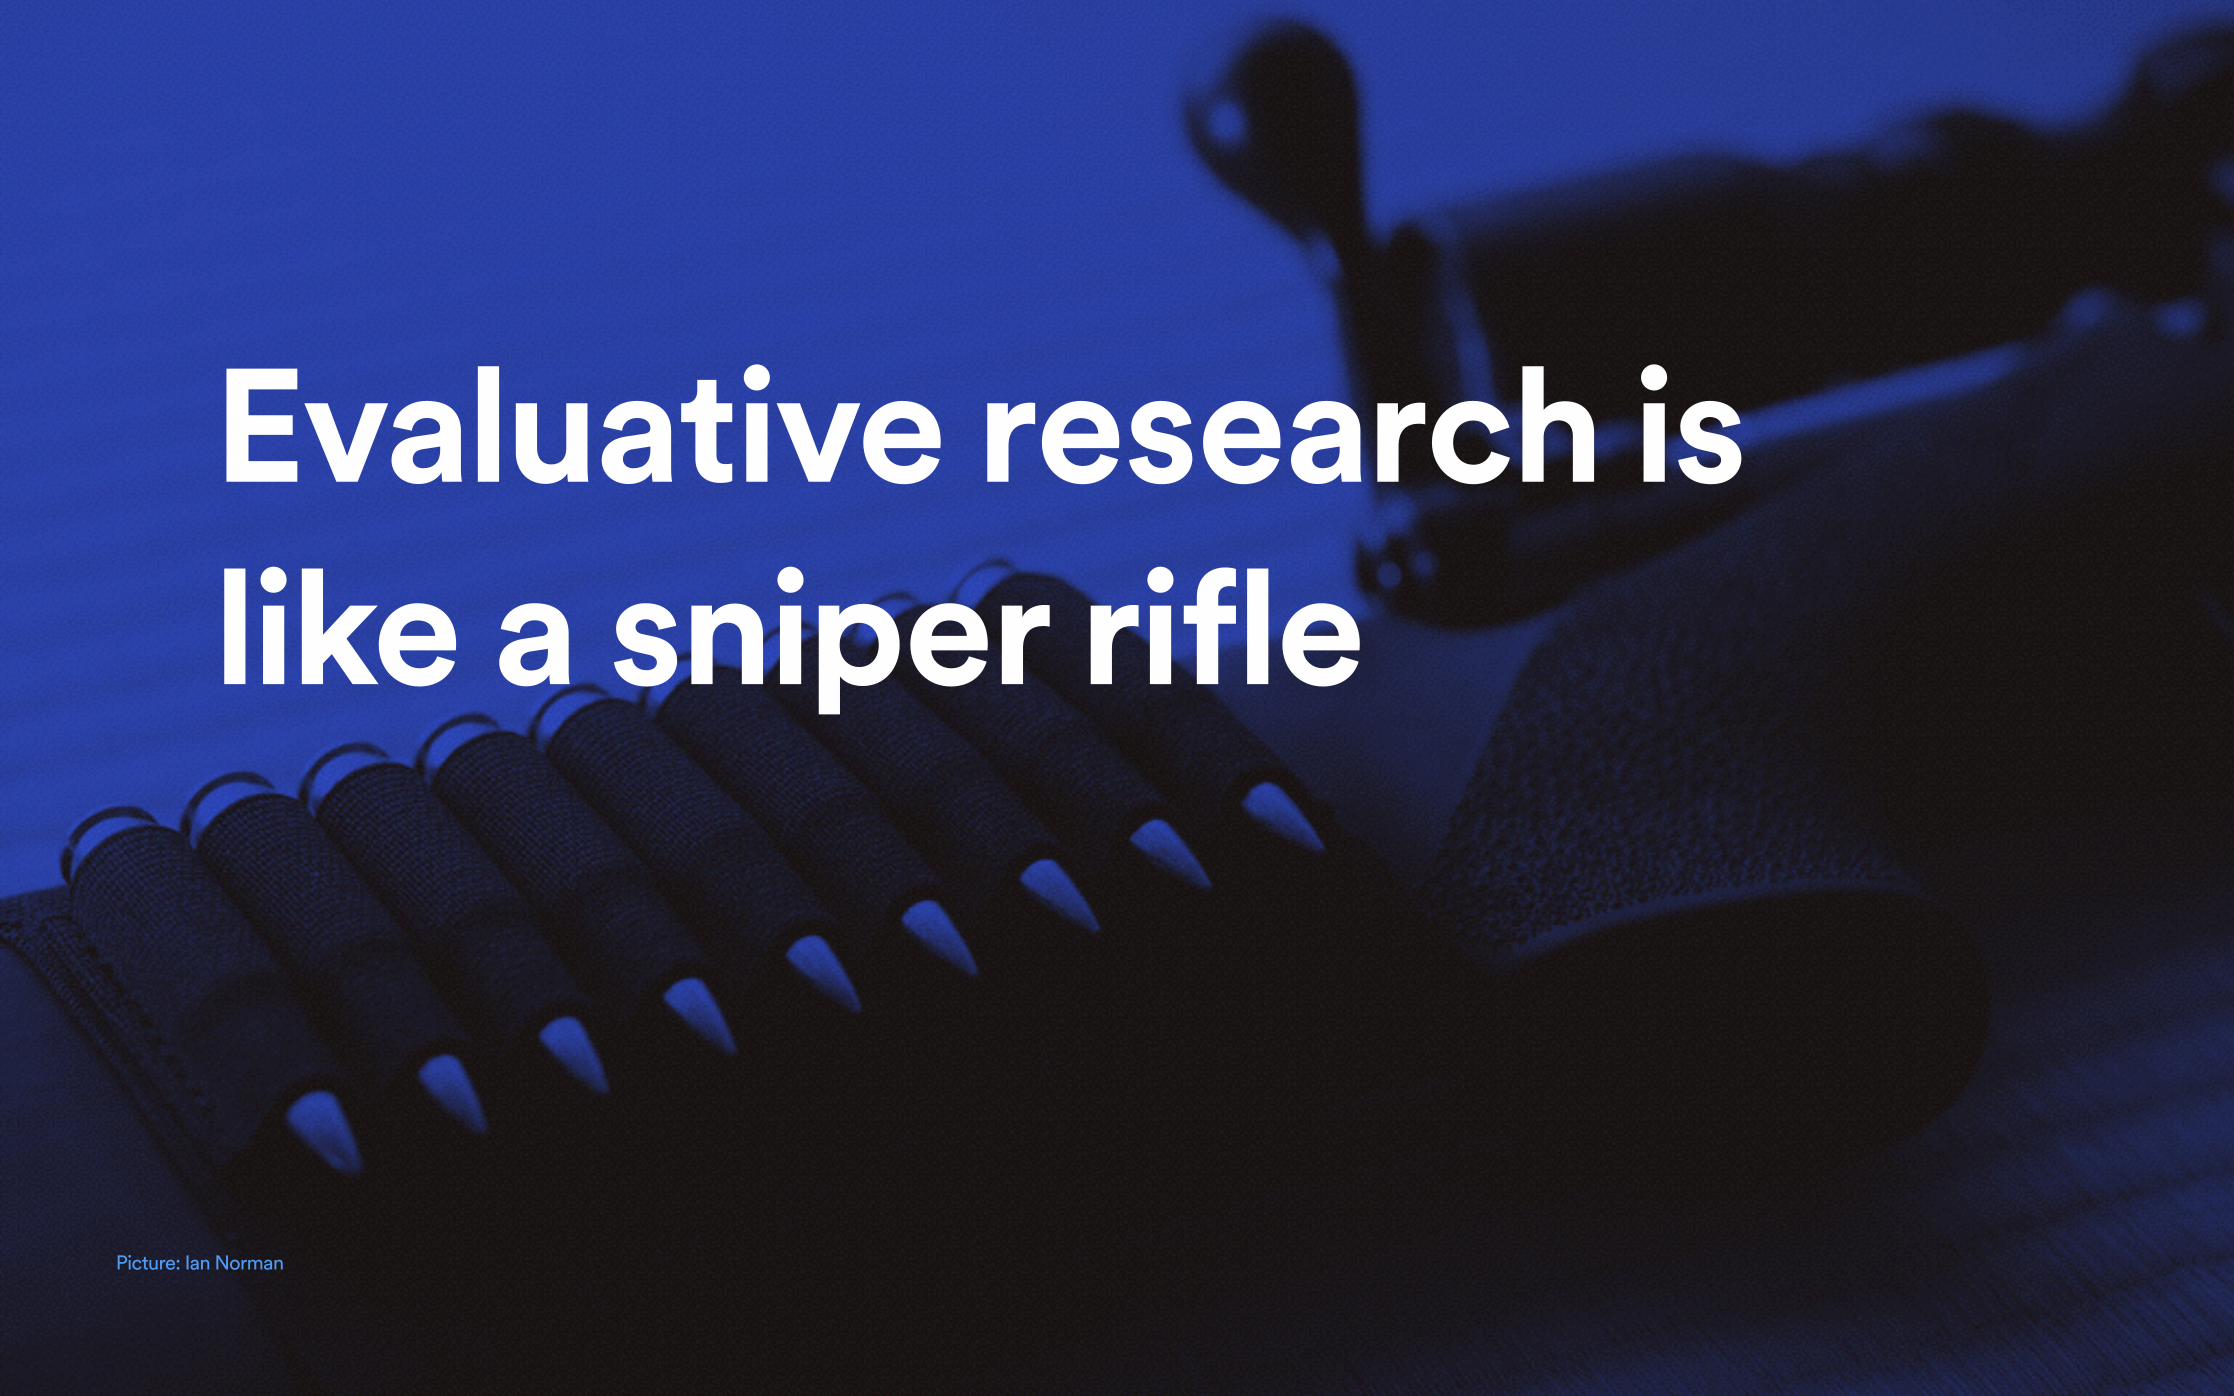
Evaluative research is like a sniper rifle
Picture: Ian Norman
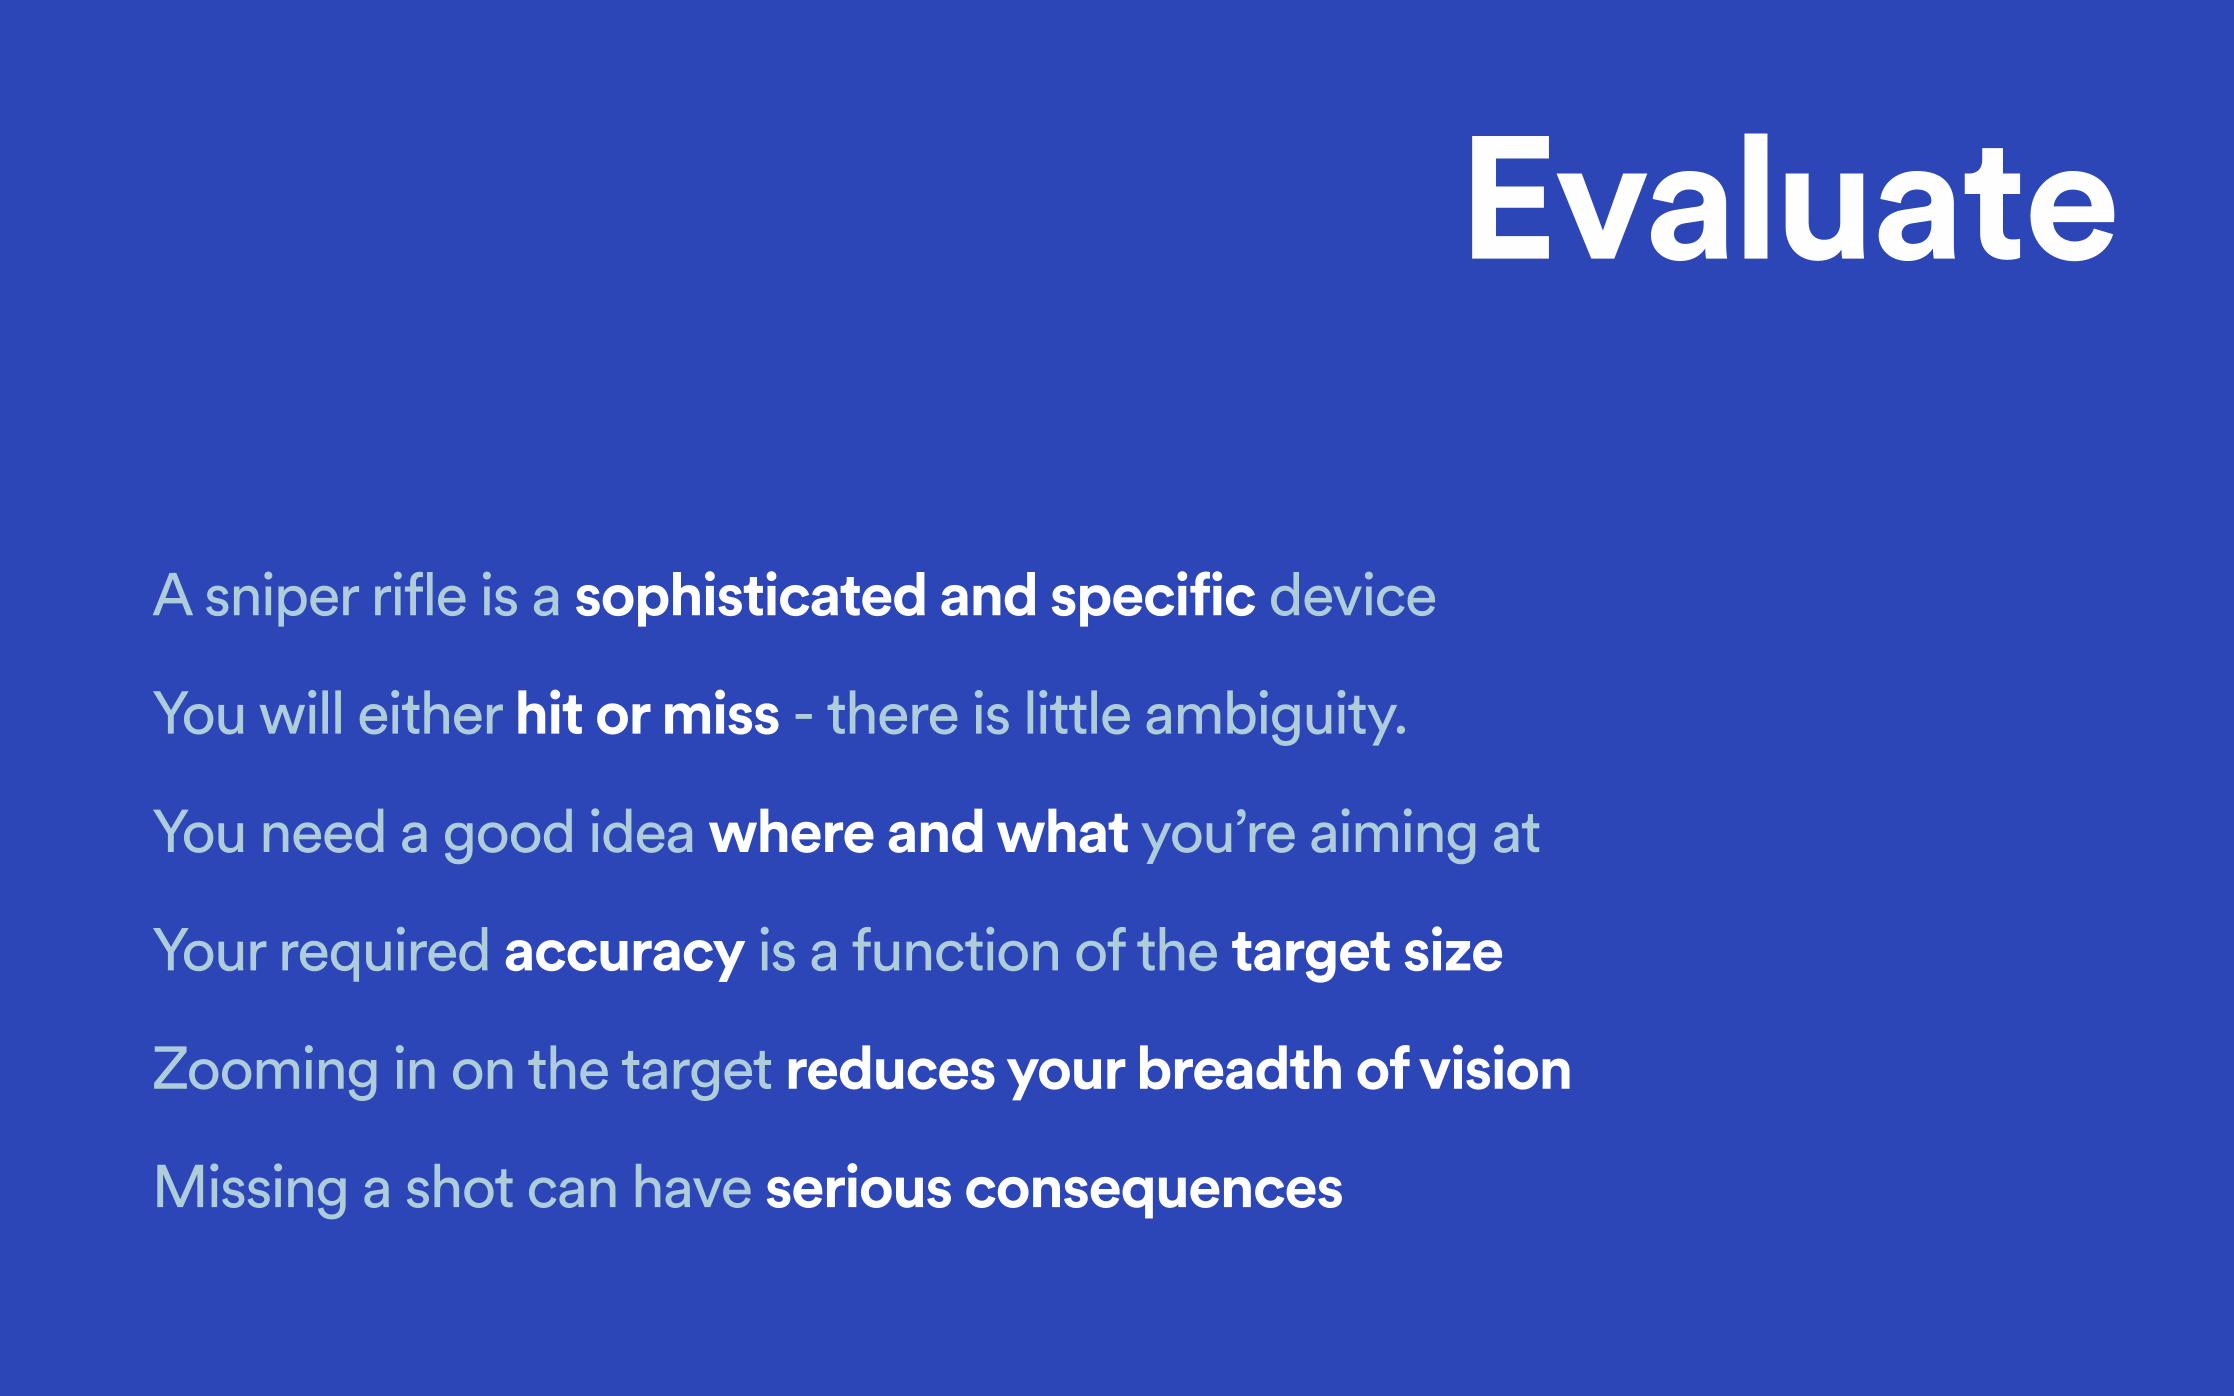
Evaluate
A sniper rifle is a sophisticated and specific device
You will either hit or miss - there is little ambiguity.
You need a good idea where and what you’re aiming at
Your required accuracy is a function of the target size
Zooming in on the target reduces your breadth of vision
Missing a shot can have serious consequences
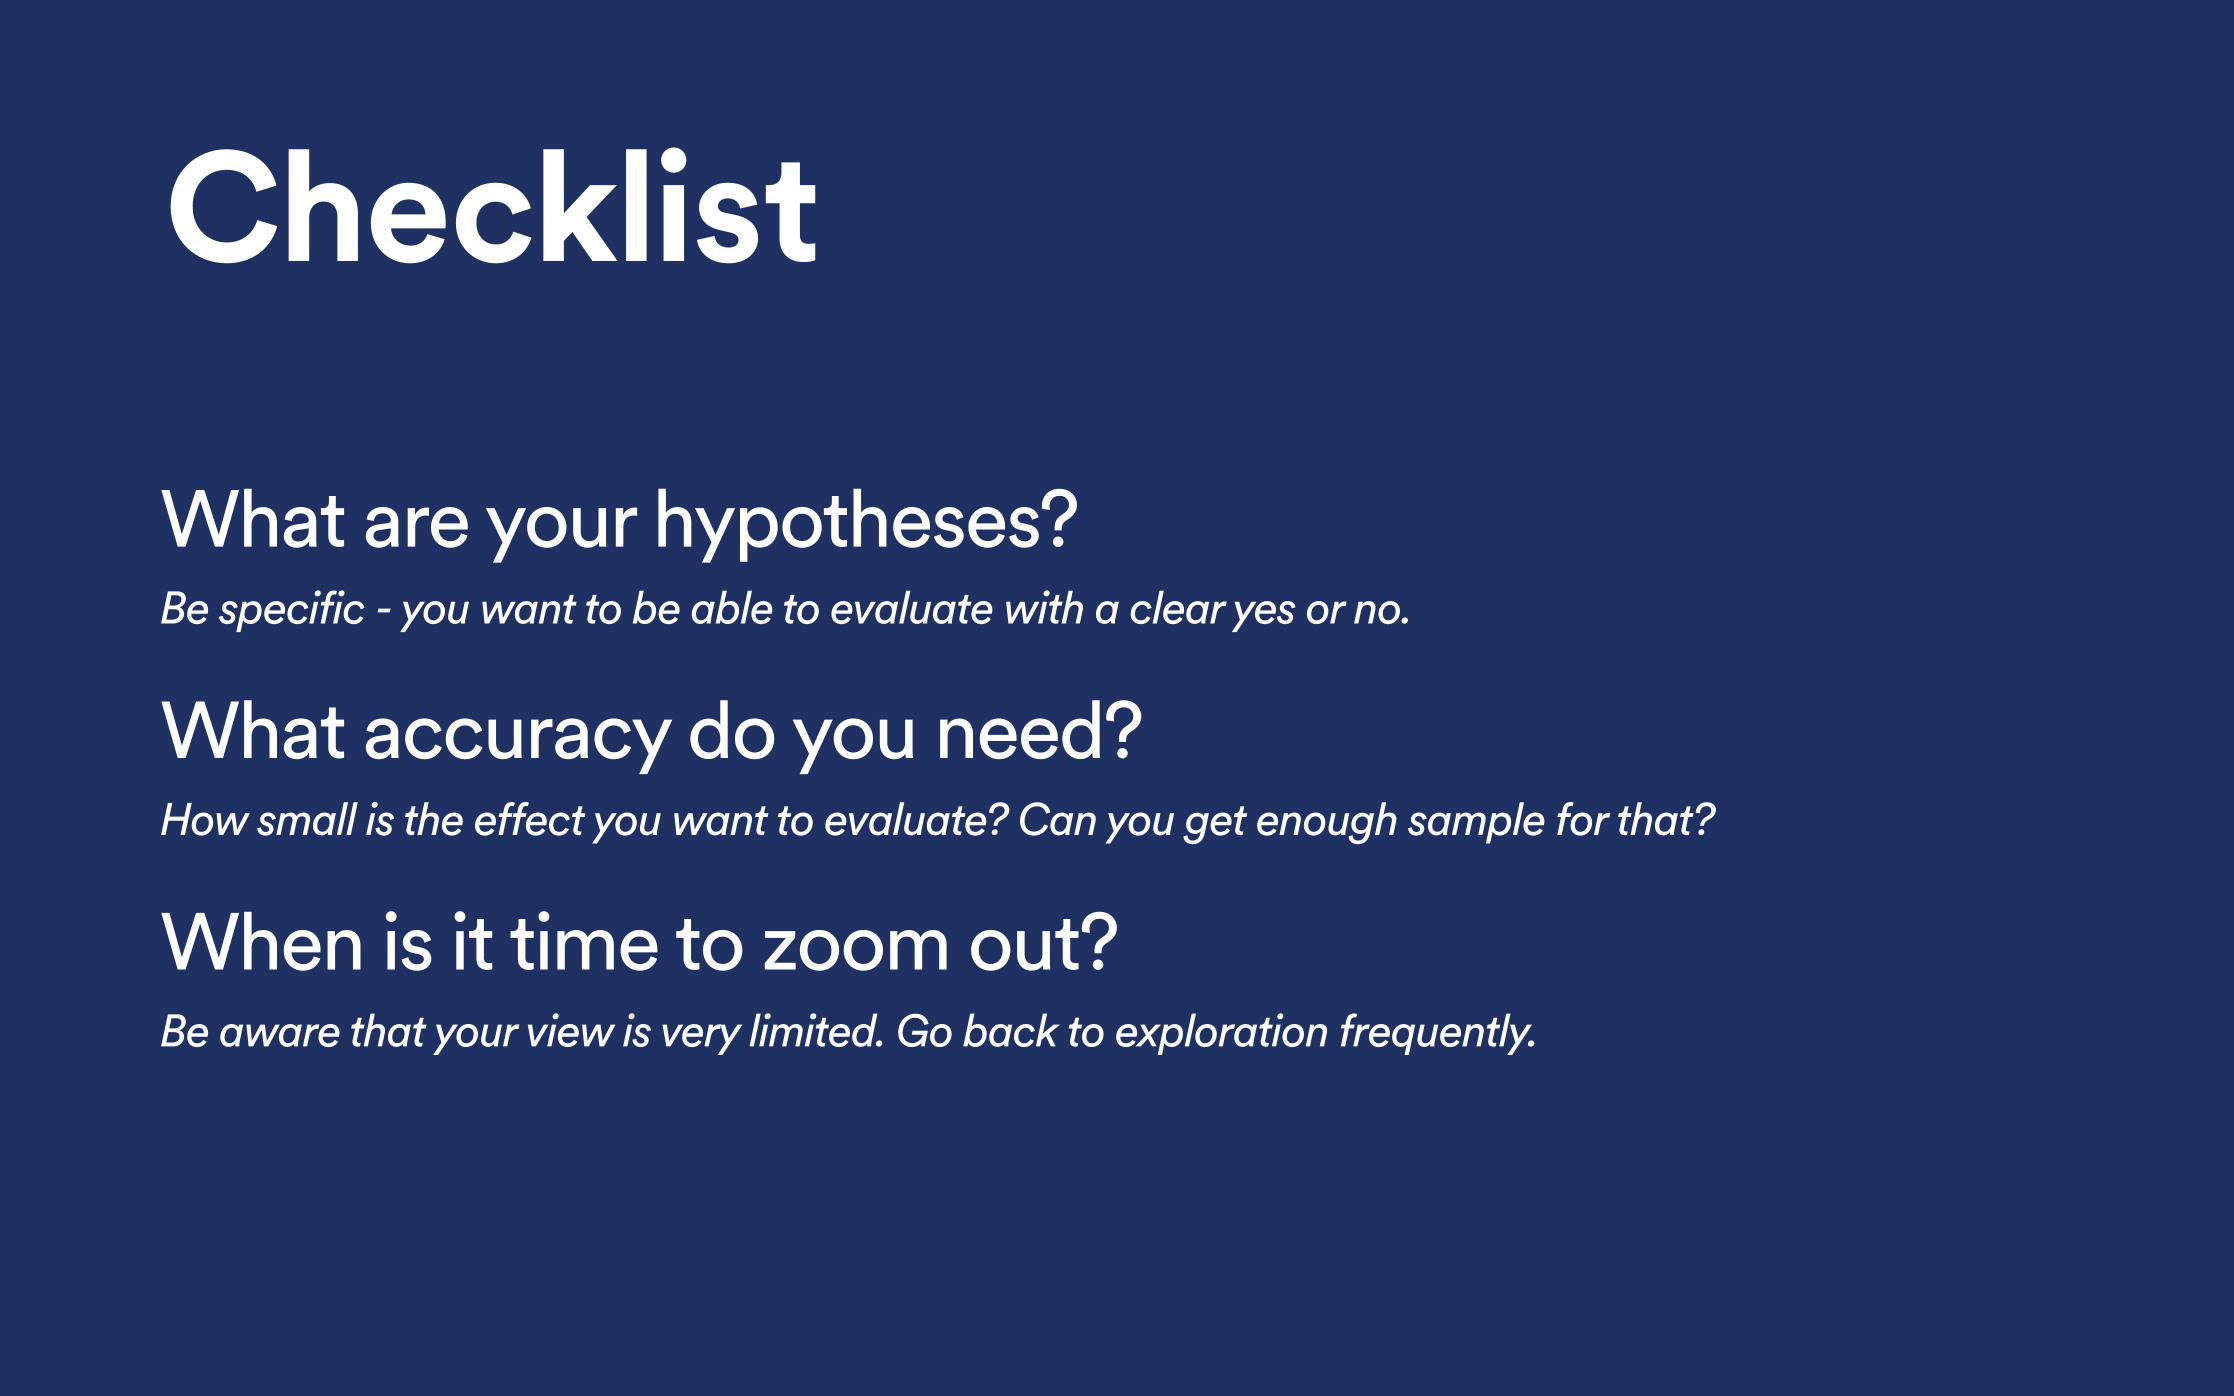
Checklist
What are your hypotheses? Be specific - you want to be able to evaluate with a clear yes or no.
What accuracy do you need? How small is the effect you want to evaluate? Can you get enough sample for that?
When is it time to zoom out? Be aware that your view is very limited. Go back to exploration frequently.

Applying research

ExploreKick off
Time frame depends on
Resources depend on
Deliverables
EvaluateAs early as possible Once you have formed
hypotheses
Size of area to explore, existing knowledge, method used
Whether hypothesis is time based (e.g. retention)
Accessibility of the population and what methods you need to employ
Whether a framework for evaluating hypotheses exists (e.g. AB testing)
Condensation of the signals into themes, potentially hypotheses
Yes/no evaluation of the hypothesis in question
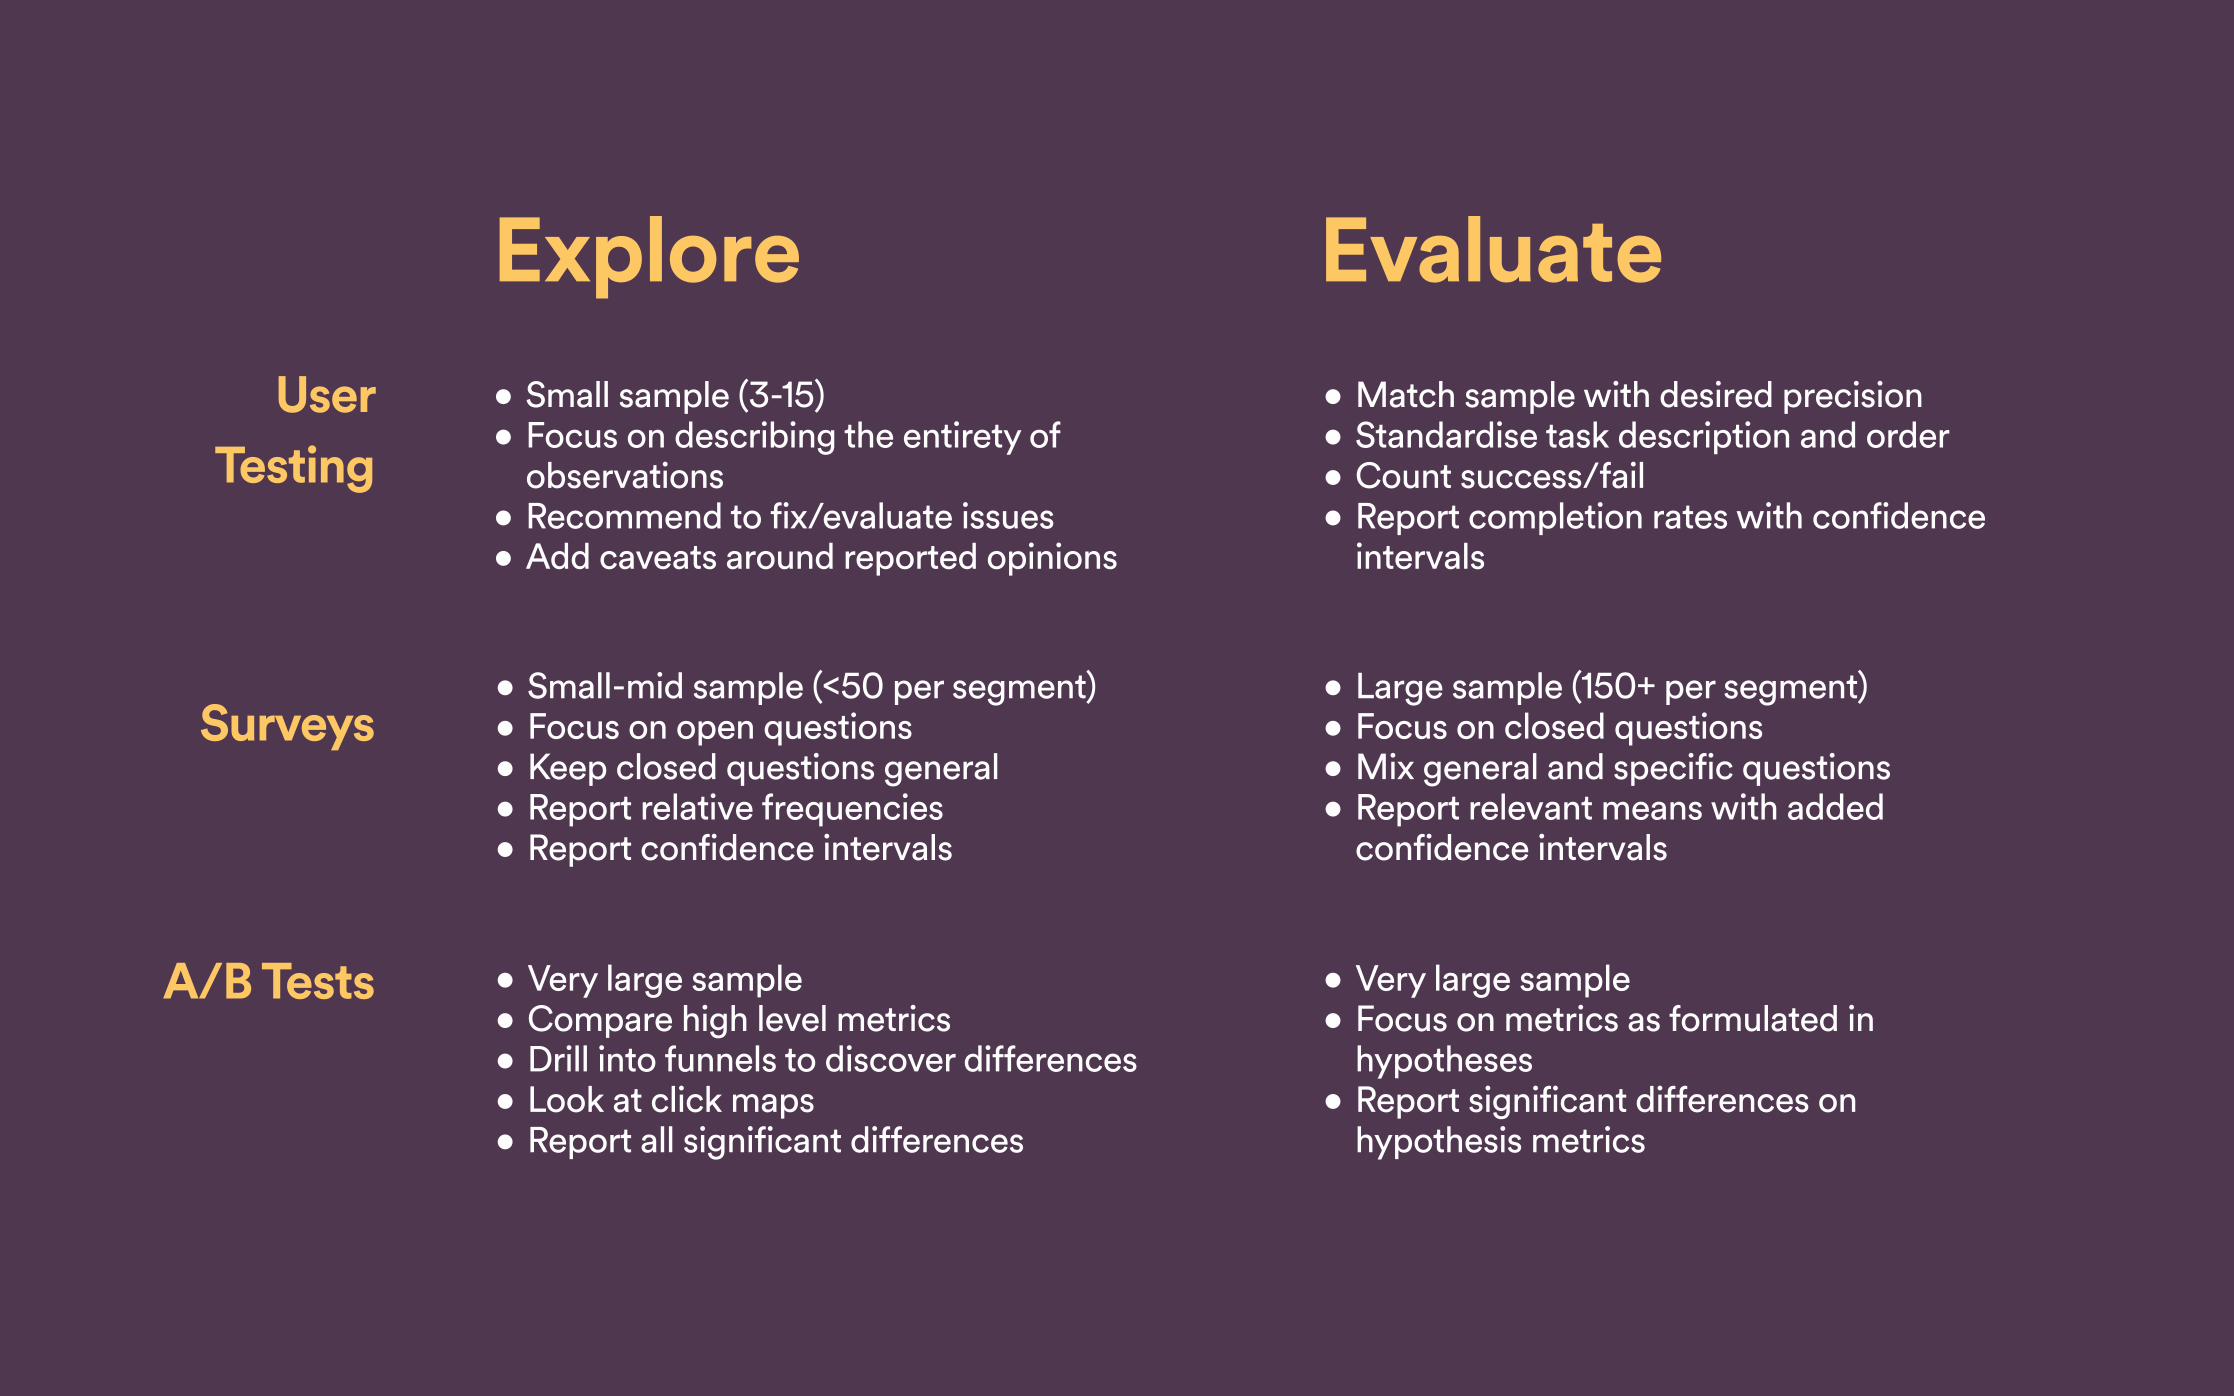
ExploreUser
Testing
Surveys
A/B Tests
Evaluate• Small sample (3-15) • Focus on describing the entirety of
observations • Recommend to fix/evaluate issues • Add caveats around reported opinions
• Match sample with desired precision • Standardise task description and order • Count success/fail • Report completion rates with confidence
intervals
• Small-mid sample (<50 per segment) • Focus on open questions • Keep closed questions general • Report relative frequencies • Report confidence intervals
• Large sample (150+ per segment) • Focus on closed questions • Mix general and specific questions • Report relevant means with added
confidence intervals
• Very large sample • Compare high level metrics • Drill into funnels to discover differences • Look at click maps • Report all significant differences
• Very large sample • Focus on metrics as formulated in
hypotheses • Report significant differences on
hypothesis metrics

Strategy
Picture: Tauno Töhk

1 Continuous delivery
Explore
Evaluate
Hypothesis A/B test
Short, concurrent exploration sprints.
Exploration through user testing and A/B test result analysis to generate hypotheses.
Regular A/B testing (every 2-3 weeks) to validate hypotheses and produce more data to explore.

2 Big bang innovation
Explore
Evaluate
Long, initial exploration phase.
Moving through prototype stage while evaluating and refining functionality and experience.
Build & release as a final evaluation.
Gathering data
Build and test
Form hypotheses

Initial exploration of available data, identify themes to test.
High level evaluation of hypothesis themes.
Break down themes into test waves.
Iterate through themes in parallel.
Next waves informed by test result and concurrent exploration.
3 Iterative redesign
Explore
Evaluate
Explore
Evaluate
Direction
Start evaluating themes
Define themes to take forward
Iterate on MVP tests
Release and iterate

What do you know about data?

What do you know about data?Explore
Evaluate

Thank you.Ben Dressler
Data visualisation: Niels Heidenreich https://www.flickr.com/photos/schoschie/
LHC: Pablo Ruiz Múzquiz https://www.flickr.com/photos/angelaypablo/
Fishing net: Christian Haugen https://www.flickr.com/photos/christianhaugen/3290641932/
Rifle: Ian Norman https://www.flickr.com/photos/inorman/
Roundabout: Tauno Tõhk https://www.flickr.com/photos/toehk/
Puzzle: Curt Smith https://www.flickr.com/photos/curtsm/5295530152/
Picture credits


