44
Exploring India: Mining the opportunities

Exploring India:Mining the opportunities
ContentForeword 1Executive summary 2
1. Introduction 4 1.01. Exploration in the global minerals and mining industry 5
1.02. Indian sector overview 7
2. Mineral exploration in India 10 2.01. Introduction 10
2.02. Status of reconnaissance permits, prospecting licenses and mining leases in India 12
3. Base and precious metals 14 3.01. Zinc and lead 14
3.02. Gold 16
3.03. Silver 18
3.04. Copper 19
3.05. Diamonds 23
3.06. Platinum and palladium 25
4. Regulatory overview 27
5. Other issues and challenges in the Indian mining sector 29
6. Opportunities in the exploration and mining sector 30
7. Recommendations 34
--------------------------------------------------------------------------------------------------------------------------------
Bibliography 38
The trend of a two-speed economic growth witnessed worldwide post the global ������������������� �����persist. Most emerging markets continue to be on the growth path with a few European countries and Asian economies
demonstrating a sign of revival in business ���������������������������������� �������the demand from growing economies in the Asian region is absorbing surplus capacities and supplies from the west.
Minerals and metal prices have been volatile; some ruling high, a few even surpassing their previous peaks witnessed. While the demand boom for minerals is fueled by China, India and similarly growing economies, the metals capacity still in surplus in the developed economies limits the headroom for any rise in metal prices. Margins have therefore gone upstream in the value chain of the mining and metals industry, which has shifted the spotlight to mineral resources once again.
��������������������������������������������������the domestic demand growth for minerals. Despite the country being endowed abundantly in many resources, due to meager investments in exploration and the constrained participation of the private �������� ���������������������������������available for the production of many base metals and precious metals will last only few years, given the enhanced production levels going forward. Exploration activity therefore must pick up rapid pace now. As is the case globally, there are indeed challenges in bringing the mineral resources to market. However, these are surmountable. This will need concerted efforts from all stakeholders
��������������������������������������������makers, mining industry, service and technology providers and host communities. With responsible ������������������������������������������ ���to the socio-economic development of vast mineral-rich districts of India. Policy initiatives, followed by planning and focused execution, are imperative to achieve success. Higher exploration and mining output will provide sustainability to the economy, ���������!�������������������������������������
Ernst & Young India works closely with key stakeholders in the mining and metals sector. The organization’s professionals dedicated to the sector have developed deep insights and provided approaches to address a wide spectrum of issues – strategy, regulatory and tax policy, risk management, mergers and acquisitions, supply chain advisory, process improvement, human ���������������������������������������������� which is so vital to this sector.
We hope this report provides you insight on the mining and exploration scenario for select minerals in India and globally. Given the conference is focusing on mining exploration; our aim is to provide readers with insights into the issues and a portfolio of our recommendations to help them seize the opportunity. We express our deep appreciation to FIMI and other participating organizations of the conference for giving us the opportunity to present this report at the conference.
Anjani K. Agrawal National Leader – Mining & Metals Sector Partner – Advisory Services Ernst & Young India
Foreword
Exploring India: Mining the opportunities
2
Put resources to use: India is well endowed with several mineral resources with high global shares as detailed in this report. However, much of that has remained unexplored/undiscovered due to various reasons or challenges over decades. The time has come to move fast forward and leverage the opportunity of a high economic cycle and rising domestic demand to put some resources to enhance the pipeline of mineral resources.
Align stakeholder goals and sustainability: Recent times have witnessed heightened activism against ������������� ������������������������������� ������������������������!���������"����!�������� ��could be due to historical reasons and is at least partly due to the dichotomy of rich mineral-bearing areas continuing to be economically disadvantaged. Mining and metals companies need to align the host ���� �������������!����������� ����������������through proactive and well-organized social and community development as well as the government’s long-term economic incentives. Mining must become an integral part of the overall eco system.
Identify special mining regions and develop SPVs for projects: Special mining regions should be ��������������������������!� �����������������capacity, resource and infrastructure planning, as well as impact assessment (both environment and social). SPVs can be created for each potential large �������������������������������� ��������������!���handing over for development.
Despite the global economic crisis, the recovery in most emerging markets has been robust and Asian economies have demonstrated resilience with the rapidly growing middle class and rising purchasing power. Urbanization, the need to build infrastructure and the demand for consumer goods are collectively stepping up the demand for metals in emerging countries such as India, which is looking to supplies from the west. Much of this demand is best met from within the country for socio-economic development, alongside managing domestic ���������������������������
Power increasingly shifting toward resource ownership: With a two-speed global economy, ��������������������������������������������!��in the value chain. The balance of economic power is shifting toward mine owners, enhancing their ability to generate higher margins, atleast in the current times, making them even stronger. In this environment, harvesting its own mineral resources makes much economic sense for India.
Global supply chain for most industrial activity begins with mining: With technological ����������������������������������� �������high-tech sectors, which have become indispensible in a modern economy. Securing certain minerals will be of critical importance for the development of the industry or of strategic competitive advantage to build the economy. Long-term planning with a strategic vision is necessary to address such issues.
Executive summary

Exploring India: Mining the opportunities
3
Several other initiatives are recommended such as increasing public-private partnerships, collaborating to build enabling physical infrastructure, sustainable mining, greater transparency in information, speed of decision making, contract mining, attracting �����������������������������������������������������#�� ����������������$��� ���������������collaborative resolution of the “social license to operate” issues.
The Draft MMDR Bill seeks to set right several long pending issues, but may create a few more. Aspects that need attention include balancing risk and rewards ����������%��������������������!��������������(over cycles of commodity prices, mine life cycle, achievement of social development goals in host community, etc.), mobility of mining investments, � ��������!���������������������!�������������capacity building of institutions to plan and deliver programs.
The growth in Indian GDP suggests we will be a US$2 trillion economy in the near future. However, compared with other economies of this size with comparable mining reserves, India has a very large ground to cover. Right policies and, more importantly, the right implementation of these policies, along with good governance and improved communication, could help in harvesting the true mineral potential of India. The opportunity is waiting to be seized.
IPOs were successful, but capital raising can be innovative: Access to capital is no longer a ������������!��������������#������� �����companies. We have seen, in recent times, some of the most successful and historic equity capital raisings in the mining sector in India. However, ����������������������������!�� �������������in Australia, Canada or London AIM. Innovation ���������!����������������!��� �������������explorers. Creating dedicated sources of funds (e.g. Africa Mining Fund) will help proving risk capital for upstream stages of the mining investment cycle such as exploration and pre-development activities ���� �������������������*�� ������������%�exchanges can also be more supportive of listing new companies or JVs for the exploration sector.
Achieve balance in resource nationalism: The government has increasingly tapped into the minerals sector to enhance its revenue stream ������� ������+������������������� ���contribute almost half of the revenues to the exchequer. However, investing back to create this revenue stream has been dismal as can be observed from the negligible exploration budgets of government agencies entrusted with lead roles. This calls for higher allocation for discovering new deposits. Only that will help expand/sustain the taxation base.

Exploring India: Mining the opportunities
4
The global mining industry has experienced many crests and troughs since 2008. After bottoming out in early 2009, the global economy recovered quickly with stimulus packages provided by several governments. Although the economic recovery still appears fragile in nature, the metal prices have steadily improved over the course of 2009 and 2010.
In a rapidly globalizing world, the economics of demand and the supply of minerals have assumed ������������������� �����������������!������!�these minerals. Further, the unequal distribution of mineral resources has created the market for trade.
The growth of the minerals and mining industry in any country largely depends on their thrust on exploration activities.
Commodity prices are typically a function of the economic cycle. Interestingly, the prices for most of the metals have bounced back strongly despite the fact that global industrial production is still not completely out of the woods. The prices for some of the metals such as gold and copper have made a higher base and are trading at their respective all-time highs, indicating that the resource part of a commodity business is experiencing relatively ����������������������
Introduction
Exhibit 1: Commodities price trends
0
100
200
300
400
500
600
700
800
Com
mod
ity p
rice
mov
emen
ts (R
ebas
ed to
100
)
LME aluminum spot (US$/tonne)LME copper spot (US$/tonne)LME zinc spot (US$/tonne)LME lead spot (US$/tonne)
Source: Thomson Datastream
Gold spot (US$/ounce)Silver spot (US$/ounce)Platinum spot (US$/ounce)Palladium spot (US$/ounce)
1.

Exploring India: Mining the opportunities
5
1.01. Exploration in the global minerals and mining industry
The industry reached new heights in mid-2008, with the exploration budget reaching US$12.6 billion. However, in the second half of 2008, the demand !���������������� �������������������������turmoil. The industry resorted to production cuts to arrest the free fall in commodity prices. Almost ������������������������������ ������������
exploration budgets sharply in 2009 in response to the global slowdown. The exploration expenditure !�������<�=>?��������������������@+KQ�X���������in 2009, as compared with US$12.6 billion in 2008, a decline of around 42% y-o-y.
Improved commodities prices and stable market conditions have prompted most global mining companies to increase their exploration budgets, resulting in a 45% y-o-y increase in the global exploration budget to US$10.7 billion in 2010.
Exhibit 2: World exploration expenditure
Source: Metals Economic Group website
2.34 2 1.73 2.193.55
4.9
7.13
9.99
12.6
7.32
10.68
-60
-40
-20
0
20
40
60
80
0
2
4
6
8
10
12
14
2000 2001 2002 2003 2004 2005 2006 2007 2008 2009 2010
US$
(bill
ion)
World expenditure Growth %
The overall global exploration budget is dominated by <\��� ��������� ������!�������������������!�?]^��In 2010, Canada and Australia were the two leading countries in terms of their share in the global exploration expenditure, with Canada’s lead over Australia increasing from about US$220 million in 2009 to US$770 million in 2010. Emerging economies such as China, Brazil and Russia also featured among the leading 10 countries, with a share of 4%, 3% and 4%, respectively, in the global exploration budget. Meanwhile, India’s share in the global exploration budget is almost negligible at less �����\�_^���������������������������������#����������������������������������� ������������� ���������government body, the Geological Survey of India (GSI), which has a very limited budget.
Exhibit 3: Exploration budget for the top ten countries, 2010 (US$7.7 billion, 69% of total)
Source: Metals Economic Group website
19%
12%
8%
6%5%5%4%
4%3%
3%
31% Canada
Australia
United States
Mexico
Peru
Chile
China
Russia
Brazil
Argentina
Other countries
Exploring India: Mining the opportunities
6
Global resources
Nearly all the countries in the world are endowed with some mineral resources. Some countries are abundantly endowed, while in certain others, the �� �������������������`��#j�������������Australia, China and India are the leading producers of minerals. {� Australia has large resources of bauxite, coal,
cobalt, copper, diamond, gold, iron ore, lead, lithium, manganese, nickel, silver, tantalum, uranium and zinc.
{� China has expansive resources of antimony, ���������������������������� ������������graphite, iron ore, magnesium, rare earths, silver, strontium, tin, tungsten and zinc.
{� ���������������������������� ����!��������bauxite, chromium, iron ore, manganese ore, rare earths and mineral salt.
{� |������������������������ ���������� `��#j���������������� ������������� Mongolia, Papua New Guinea, the Philippines and Thailand.
Most of the countries in Africa are endowed with mineral deposits. Countries such as Argentina, Brazil, Chile, Cuba, Jamaica, Tobago and Trinidad ���������������������� ����������}�����America region. In the North America region, the US, Canada and the Mexico are endowed with rich ��������� ����~������������������ ����in the US include copper, gold, iron ore, lime, salt, phosphate rock and zinc.
The countries in the European Union (EU) and the CIS (Commonwealth of Independent States) �������������������������������������������economy and occupy important roles as suppliers ������� ����!���������������@�������������the role of processor and consumer of minerals, depends on the import of the large volume of its mineral requirements, while the consumption of minerals is relatively low in Central Asia. In the CIS region, Kazakhstan, Russia and Ukraine are the leading mineral producing countries. Other mineral producing and processing countries in ������+����������� ���`�����������������������
@���%������`������������������� ������������North America region, viz., the US, Canada and the Mexico are endowed with rich mineral resources.
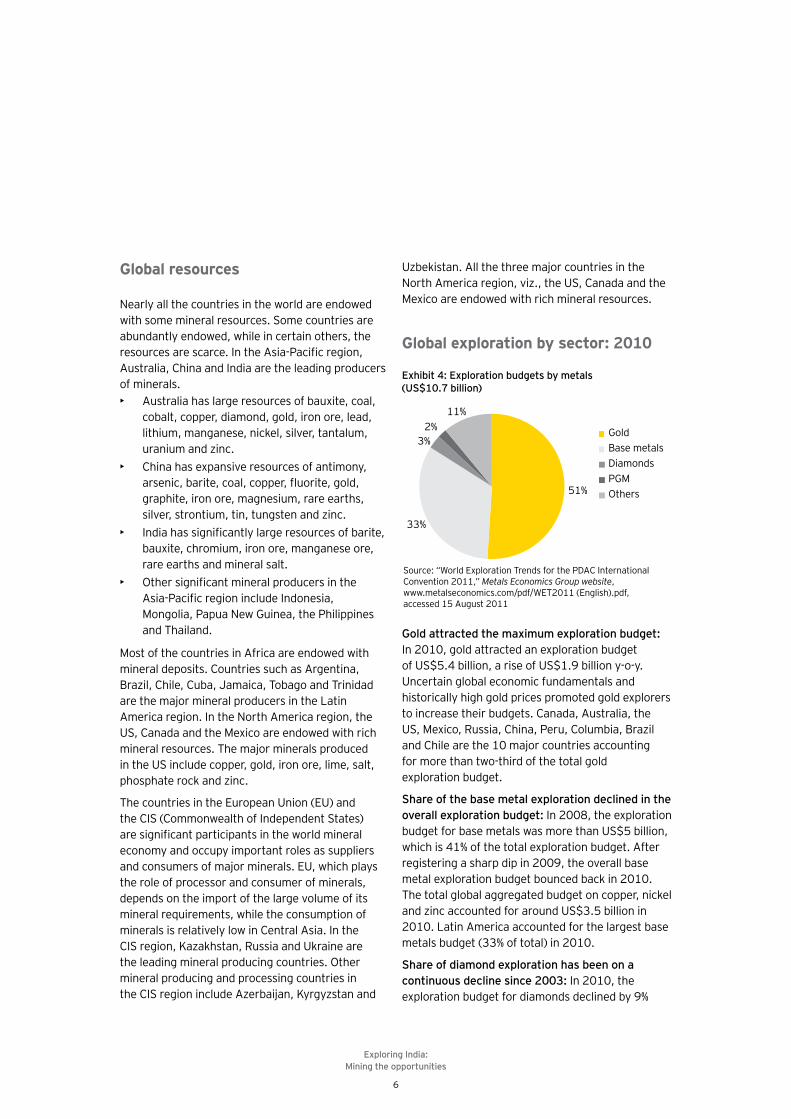
Global exploration by sector: 2010
Gold attracted the maximum exploration budget: In 2010, gold attracted an exploration budget of US$5.4 billion, a rise of US$1.9 billion y-o-y. Uncertain global economic fundamentals and historically high gold prices promoted gold explorers to increase their budgets. Canada, Australia, the US, Mexico, Russia, China, Peru, Columbia, Brazil �����������������<\�������� ��������� ������ for more than two-third of the total gold exploration budget.
Share of the base metal exploration declined in the overall exploration budget: In 2008, the exploration budget for base metals was more than US$5 billion, which is 41% of the total exploration budget. After registering a sharp dip in 2009, the overall base metal exploration budget bounced back in 2010. The total global aggregated budget on copper, nickel and zinc accounted for around US$3.5 billion in 2010. Latin America accounted for the largest base metals budget (33% of total) in 2010.
Share of diamond exploration has been on a continuous decline since 2003: In 2010, the exploration budget for diamonds declined by 9%
Exhibit 4: Exploration budgets by metals (US$10.7 billion)
Source: “World Exploration Trends for the PDAC International Convention 2011,” Metals Economics Group website, www.metalseconomics.com/pdf/WET2011 (English).pdf, accessed 15 August 2011
51%
33%
3%2%
11%
GoldBase metalsDiamondsPGMOthers
Exploring India: Mining the opportunities
7
y-o-y, accounting for only 3% of the worldwide exploration budget. Canada, Russia and South `!������� �������������������������������!��diamond exploration.
PGM exploration budget is mainly focused in Africa: In 2010, the PGM exploration budget increased by 13% y-o-y; however its share in the total exploration budget is on a continuous decline. It slipped below 2% in 2010, as opposed to 6% in 2002 and 2003. Africa and Canada remained the ����������������!��j�"���������������������accounting for more than 80% of the total global exploration budget in the PGM segment.
1.02. Indian sector overview
India produces 87 minerals, which include 4 fuel minerals, 10 metallic, 47 non–metallic, 3 atomic and 23 minor minerals. The country has abundant reserves of key minerals such as iron ore, bauxite, dolomite, gypsum, limestone, mica and adequate reserves of chromite, manganese, zinc and graphite. In fact, India is a leading producer of key minerals such as iron ore and bauxite. Though the industry is largely fragmented, comprising several small scale operational mines, it is still dominated by the public sector, which accounted for 74.5% of the total mineral production in India in FY11. The total value of mineral production (excluding atomic minerals) during 2010–11 is estimated at INR 2,006 billion, an increase of around 11.83% y-o-y.
The total mineral production in India was reported at 2,628 mines during FY11, as compared with 2,999 mines in the previous year. Of these mines, 574 are involved in the extraction of coal and lignite, 608 in metallic minerals and 1,446 in non–metallic ��������� �������`�����j���������� �����account for the highest number of mines in the country (377 and 372 mines, respectively).
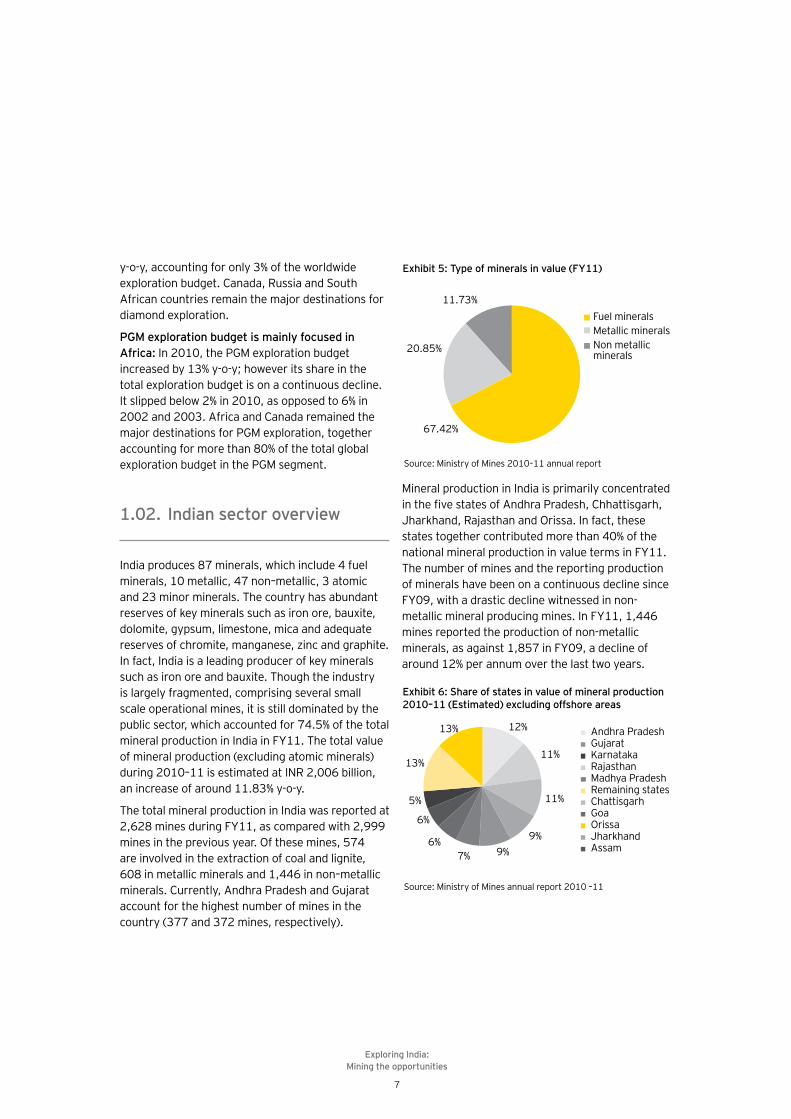
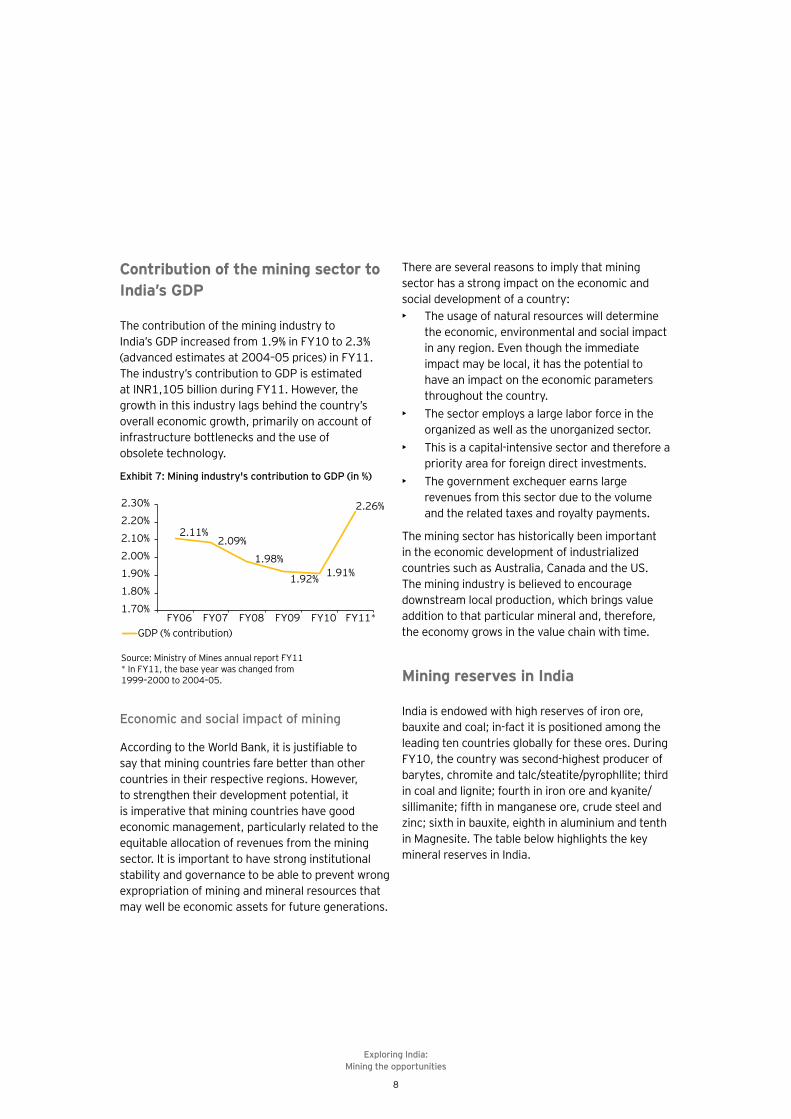
Mineral production in India is primarily concentrated �����������������!�`�����j���������������������%������*������������|�������!����������states together contributed more than 40% of the national mineral production in value terms in FY11. The number of mines and the reporting production of minerals have been on a continuous decline since FY09, with a drastic decline witnessed in non-metallic mineral producing mines. In FY11, 1,446 mines reported the production of non-metallic minerals, as against 1,857 in FY09, a decline of around 12% per annum over the last two years.
Exhibit 5: Type of minerals in value (FY11)
Source: Ministry of Mines 2010–11 annual report
67.42%
20.85%
11.73%Fuel mineralsMetallic mineralsNon metallic minerals
Exhibit 6: Share of states in value of mineral production 2010–11 (Estimated) excluding offshore areas
Source: Ministry of Mines annual report 2010 –11
12%
11%
11%
9%9%7%
6%
6%
5%
13%
13% Andhra Pradesh
Rajasthan
Chattisgarh
Jharkhand
Gujarat
Madhya Pradesh
Goa
Assam
Karnataka
Remaining states
Orissa
Exploring India: Mining the opportunities
8
Contribution of the mining sector to India’s GDP
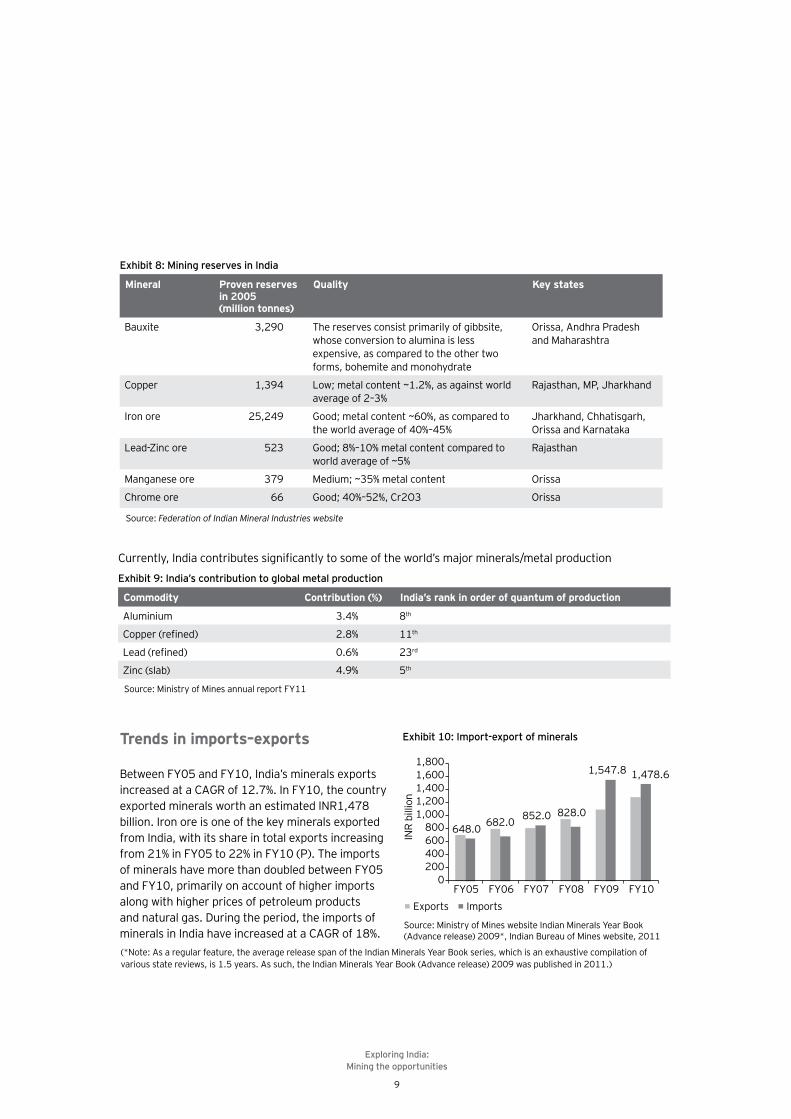
The contribution of the mining industry to India’s GDP increased from 1.9% in FY10 to 2.3% (advanced estimates at 2004–05 prices) in FY11. The industry’s contribution to GDP is estimated at INR1,105 billion during FY11. However, the growth in this industry lags behind the country’s overall economic growth, primarily on account of infrastructure bottlenecks and the use of obsolete technology.
Economic and social impact of mining
`�����������������������%�������� �����������say that mining countries fare better than other countries in their respective regions. However, to strengthen their development potential, it is imperative that mining countries have good economic management, particularly related to the equitable allocation of revenues from the mining sector. It is important to have strong institutional stability and governance to be able to prevent wrong expropriation of mining and mineral resources that may well be economic assets for future generations.
There are several reasons to imply that mining sector has a strong impact on the economic and social development of a country:{� The usage of natural resources will determine
the economic, environmental and social impact in any region. Even though the immediate impact may be local, it has the potential to have an impact on the economic parameters throughout the country.
{� The sector employs a large labor force in the organized as well as the unorganized sector.
{� This is a capital-intensive sector and therefore a priority area for foreign direct investments.
{� The government exchequer earns large revenues from this sector due to the volume and the related taxes and royalty payments.
The mining sector has historically been important in the economic development of industrialized countries such as Australia, Canada and the US. The mining industry is believed to encourage downstream local production, which brings value addition to that particular mineral and, therefore, the economy grows in the value chain with time.
Mining reserves in India
India is endowed with high reserves of iron ore, bauxite and coal; in-fact it is positioned among the leading ten countries globally for these ores. During FY10, the country was second-highest producer of barytes, chromite and talc/steatite/pyrophllite; third in coal and lignite; fourth in iron ore and kyanite/�������������!�������������������� ������������zinc; sixth in bauxite, eighth in aluminium and tenth in Magnesite. The table below highlights the key mineral reserves in India.
Exhibit 7: Mining industry's contribution to GDP (in %)
Source: Ministry of Mines annual report FY11* In FY11, the base year was changed from 1999–2000 to 2004–05.
2.11%2.09%
1.98%
1.92% 1.91%
2.26%
1.70%
1.80%
1.90%
2.00%
2.10%
2.20%
2.30%
FY06 FY07 FY08 FY09 FY10 FY11*GDP (% contribution)
Exploring India: Mining the opportunities
9
Exhibit 8: Mining reserves in India
Mineral Proven reserves in 2005 (million tonnes)
Quality Key states
Bauxite 3,290 The reserves consist primarily of gibbsite, whose conversion to alumina is less expensive, as compared to the other two forms, bohemite and monohydrate
Orissa, Andhra Pradesh and Maharashtra
Copper 1,394 Low; metal content ~1.2%, as against world average of 2–3%
*���������"j�����%����
Iron ore 25,249 Good; metal content ~60%, as compared to the world average of 40%–45%
Jharkhand, Chhatisgarh, Orissa and Karnataka
Lead-Zinc ore 523 Good; 8%–10% metal content compared to world average of ~5%
*�������
Manganese ore 379 Medium; ~35% metal content Orissa
Chrome ore 66 Good; 40%–52%, Cr2O3 Orissa
Source: Federation of Indian Mineral Industries website
Exhibit 9: India’s contribution to global metal production
Commodity Contribution (%) India’s rank in order of quantum of production
Aluminium 3.4% 8th
������������� 2.8% 11th
}����������� 0.6% 23rd
Zinc (slab) 4.9% 5th
Source: Ministry of Mines annual report FY11
� ������������������� �����������������������!����������������������$��������� �����
Trends in imports–exports
Between FY05 and FY10, India’s minerals exports increased at a CAGR of 12.7%. In FY10, the country exported minerals worth an estimated INR1,478 billion. Iron ore is one of the key minerals exported from India, with its share in total exports increasing from 21% in FY05 to 22% in FY10 (P). The imports of minerals have more than doubled between FY05 and FY10, primarily on account of higher imports along with higher prices of petroleum products and natural gas. During the period, the imports of minerals in India have increased at a CAGR of 18%.
Exhibit 10: Import-export of minerals
Source: Ministry of Mines website Indian Minerals Year Book (Advance release) 2009*, Indian Bureau of Mines website, 2011
648.0 682.0 852.0 828.0
1,547.8 1,478.6
0200400600800
1,0001,2001,4001,6001,800
FY05 FY06 FY07 FY08 FY09 FY10
INR
billi
on
Exports Imports
(*Note: As a regular feature, the average release span of the Indian Minerals Year Book series, which is an exhaustive compilation of various state reviews, is 1.5 years. As such, the Indian Minerals Year Book (Advance release) 2009 was published in 2011.)
Exploring India: Mining the opportunities
10
2.01. Introduction
During the last few years, mineral exploration has picked up momentum in the country on account of various favorable policy measures taken by the Government of India. The National Mineral Policy 2008 has laid special emphasis on regulations in minerals, survey and exploration and strategies for mineral development in the country. This policy initiative may encourage heightened involvement of private sector companies in the survey and exploration of minerals in India in the future.
The Geological Survey of India (GSI), Atomic Minerals Directorate for Exploration and Research
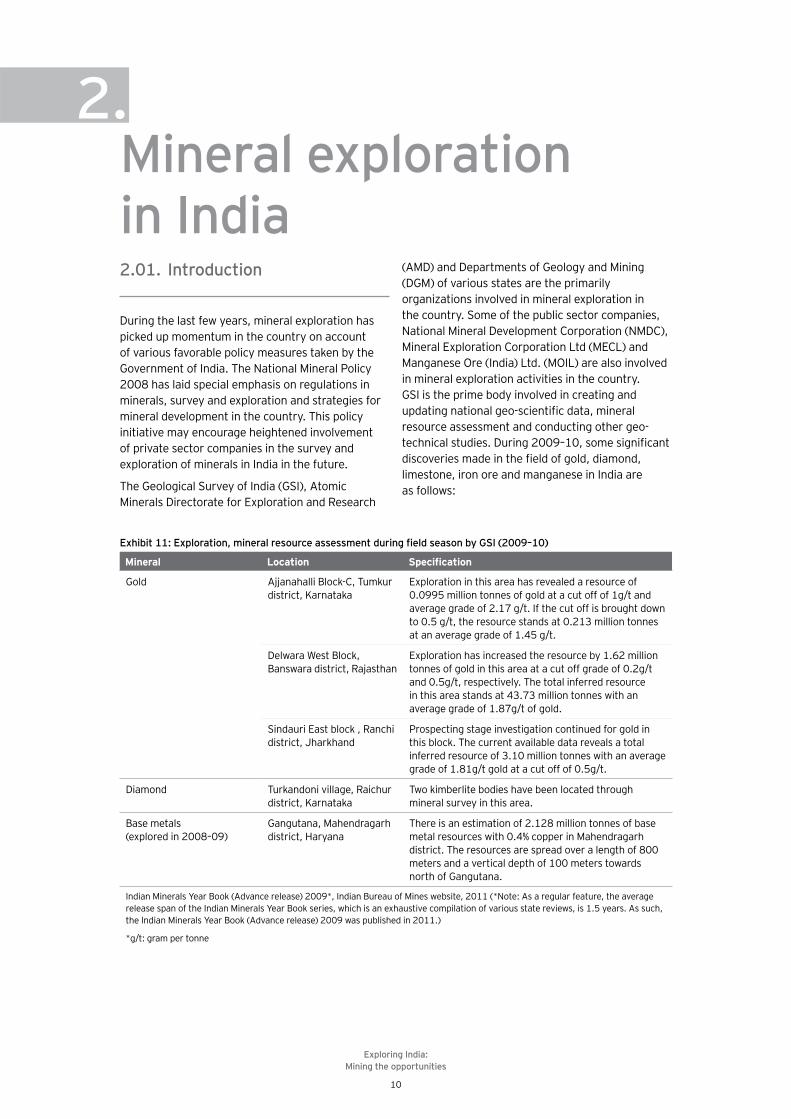
(AMD) and Departments of Geology and Mining (DGM) of various states are the primarily organizations involved in mineral exploration in the country. Some of the public sector companies, National Mineral Development Corporation (NMDC), Mineral Exploration Corporation Ltd (MECL) and Manganese Ore (India) Ltd. (MOIL) are also involved in mineral exploration activities in the country. GSI is the prime body involved in creating and ��������������������#����������������������resource assessment and conducting other geo-����������� ������ �����\\]�<\�������������������������������������������!����������������limestone, iron ore and manganese in India are as follows:
Mineral exploration in India
2.
������������� ���� �������������� �������������������������������� �����������!!"#!&
Mineral Location ����������
Gold `���������������%#���~ �% �district, Karnataka
Exploration in this area has revealed a resource of 0.0995 million tonnes of gold at a cut off of 1g/t and average grade of 2.17 g/t. If the cut off is brought down to 0.5 g/t, the resource stands at 0.213 million tonnes at an average grade of 1.45 g/t.
Delwara West Block, ���������������*�������
Exploration has increased the resource by 1.62 million tonnes of gold in this area at a cut off grade of 0.2g/t and 0.5g/t, respectively. The total inferred resource in this area stands at 43.73 million tonnes with an average grade of 1.87g/t of gold.
Sindauri East block , Ranchi district, Jharkhand
Prospecting stage investigation continued for gold in this block. The current available data reveals a total inferred resource of 3.10 million tonnes with an average grade of 1.81g/t gold at a cut off of 0.5g/t.
Diamond Turkandoni village, Raichur district, Karnataka
Two kimberlite bodies have been located through mineral survey in this area.
Base metals (explored in 2008–09)
Gangutana, Mahendragarh district, Haryana
There is an estimation of 2.128 million tonnes of base metal resources with 0.4% copper in Mahendragarh district. The resources are spread over a length of 800 meters and a vertical depth of 100 meters towards north of Gangutana.
Indian Minerals Year Book (Advance release) 2009*, Indian Bureau of Mines website, 2011 (*Note: As a regular feature, the average release span of the Indian Minerals Year Book series, which is an exhaustive compilation of various state reviews, is 1.5 years. As such, the Indian Minerals Year Book (Advance release) 2009 was published in 2011.)
*g/t: gram per tonne

Exploring India: Mining the opportunities
11
India has advanced in the last few years in providing the mining leases for some of these minerals.
Exhibit 12: Current status of mining leases in IndiaMineral State Number of
mining leases Production (April 2009–March 2010)
Unit Quantity
Gold ore Karnataka 7 Tonnes 512,533
Jharkhand 1 Tonnes 5,066
Andhra Pradesh 1 -
Copper ore Madhya Pradesh 2 Tonnes 1,932,965
*������� 5 Tonnes 907,388
Jharkhand 4 Tonnes 387,314
Sikkim 3 - -
� ���� 1 - -
Karnataka 1 - -
Diamond Madhya Pradesh 2 Carats 16,810
Lead and zinc *������� 7 Tonnes 7,101,972
Madhya Pradesh 2 Tonnes -
Orissa 1 - -
Source: Ministry of mines annual report FY11
j���������������������*���������������� ��number of leases for copper, lead and zinc ore exploration.

Exploring India: Mining the opportunities
12
2.02. Status of reconnaissance permits, prospecting licenses and mining leases in India
*�� ��������������������*+�&
The Government of India approved 19 RPs in 2008–09, covering an area of more than 40,000 square kilometers. The maximum number of RPs has ���������������*���������Q���!�����������"������Pradesh (4), Andhra Pradesh (3), Karnataka (3), Chhattisgarh (1) and Jharkhand (1). The maximum concessions provided during the year were in the ������!������ ����������������������
Exhibit 13: Area granted under RPs in 2008–09 (40,052 square kilometers)
Source: “Advance release- Indian minerals year book 2009,” Indian Bureau of Mines website
21%
3%5%
12%
19%
40% Andhra Pradesh
Chhattisgarh
Jharkhand
Karnataka
Madhya Pradesh
Rajasthan
+� ���������/���������+/�&
During 2008–09, PLs were executed only in two �������*������������`�����j������| ���!�����������������j}����� �����*������������ �����!��seven, while Andhra Pradesh accounted for one ��������~�������������� ����j}��������������� �� ���������������!���<�X>Q����������������FY07 to 6,036 ha in FY08 to 426 ha during 2008–09. All the prospecting licenses executed were in the private sector. The minerals covered included limestone, wollastonite, china clay, soapstone and associated minerals.
;��������������;/�&
By the end of FY09, there were 9,415 MLs in force in 23 Indian states, covering an area of 491,445 ha. Out of the total, 8,915 (95%) MLs, with an area of 3,46,111 ha (70%), are in the private sector and the remaining 500 (5%) leases, with an area of 1,45,334 ha (30%), are in the public sector. These leases covered 59 metallic and non-metallic minerals, excluding lignite, coal, petroleum, natural gas, atomic minerals and minor minerals. The maximum mining lease area �������������*����������<^���!�����������|���(14%) and Karnataka (12%). While 10 states accounted for around 92% of the total mining lease area, the other 13 states accounted for the remaining 8%.
Exhibit 14: Area granted under PLs in 2008–09(426 ha)
Source: “Advance release- Indian minerals year book 2009,” Indian Bureau of Mines website
44%
56%Andhra PradeshRajasthan
In metallic minerals, some leases were awarded for copper, gold, lead and zinc but there were no leases for the silver and platinum group of metals during 2008–09. Almost 95% of the MLs provided during the period were awarded to private sector players and the remaining 5% went to the public sector, with central government undertakings and state government undertakings getting 2% and 3%, respectively.
Exhibit 15: Number of mining leases till 31 March 2009 (9,415)
Source: “Advance release- Indian minerals year book 2009,” Indian Bureau of Mines website
21%
14%
12%11%
8%
6%
28% Rajasthan
Orissa
Karnataka
Andhra Pradesh
Jharkhand
Goa
Others

Exploring India: Mining the opportunities
13
Mineral exploration has not witnessed tremendous growth in India
Till now, the exploration sector in India has not grown in line with the growth of minerals and metals demand in the country. The complexities arise out of the need to obtain clearances from a number of different authorities under different statutes and ������������%������������������"������������is a considerable overlap between the relative roles of the states vis-à-vis the Center. For example, the states levy their own cess over and above royalties imposed by the Central Act and Rules.
“Security of tenure” is a key hurdle that has led to the slow growth of exploration in India. There was no security of tenure from the RP to PL stage. Moreover, a preferential right for conversion from one form of concession to the next one does not guarantee an exclusive or absolute right to prospect or mine any mineral deposit found within the area covered under by the RP or PL. The current draft of the proposed mining law, MMDR Bill, deals with most of these issues.
Exhibit 16: Exploration sector: Focus in new draft MMDR Bill
Issues Hoda committee recommendations Position in draft law
Exploration licenses Move from current two-tier (RP and PL) to three-tier systems of RL, LAPL* and PL
Draft law includes provision for three-tier system.
Reconnaissance license Adopt ‘open sky’ policy of granting non-exclusive RPs without any preferential or automatic right to a PL
Incorporated in current draft, currently under debate
Duration of concessions Total period of exploration under RP/PL or RP/LAPL should be 8 years
Duration for LAPL and PL are in line with the recommendations
Size of area Maximum area: RL-10k sq. km; PL-500 sq.km; LAPL-10000 sq.km, ML-100 sq. km
Draft mining law adopts the size of area recommended
Transferability of licenses Greater transparency can be achieved by stating that a RL/PL/LAPL/ML has the �����������!������������������ �������entity. There should be a single license approving authority
The draft legislation has a separate section outlining transfer of licenses with procedures and approving Agencies
Value addition In case there are multiple applicants for a license, preference should be given to an applicant who proposes to set up an industry based on the mineral
Instead of giving direct preference, the draft legislation recommends to review applicants based on weighted criteria including value addition and end-use of mineral
Royalties Set up a study group to work out detailed rates of royalty, dead rent, and other levies on the basis of recommendations. Move to ad-valorem rates of royalties.
Set up a National Mineral Royalty Commission to review existing rates of royalties, guidelines for calculation of ad-valorem rates and recommend revisions.
Source: “National Mineral Policy,” Planning Commission, December 2006; “National Mineral Policy, 2008,” Ministry of Mines website.
*LAPL: Large Area Prospecting License
Exploring India: Mining the opportunities
14
3.01. Zinc and lead
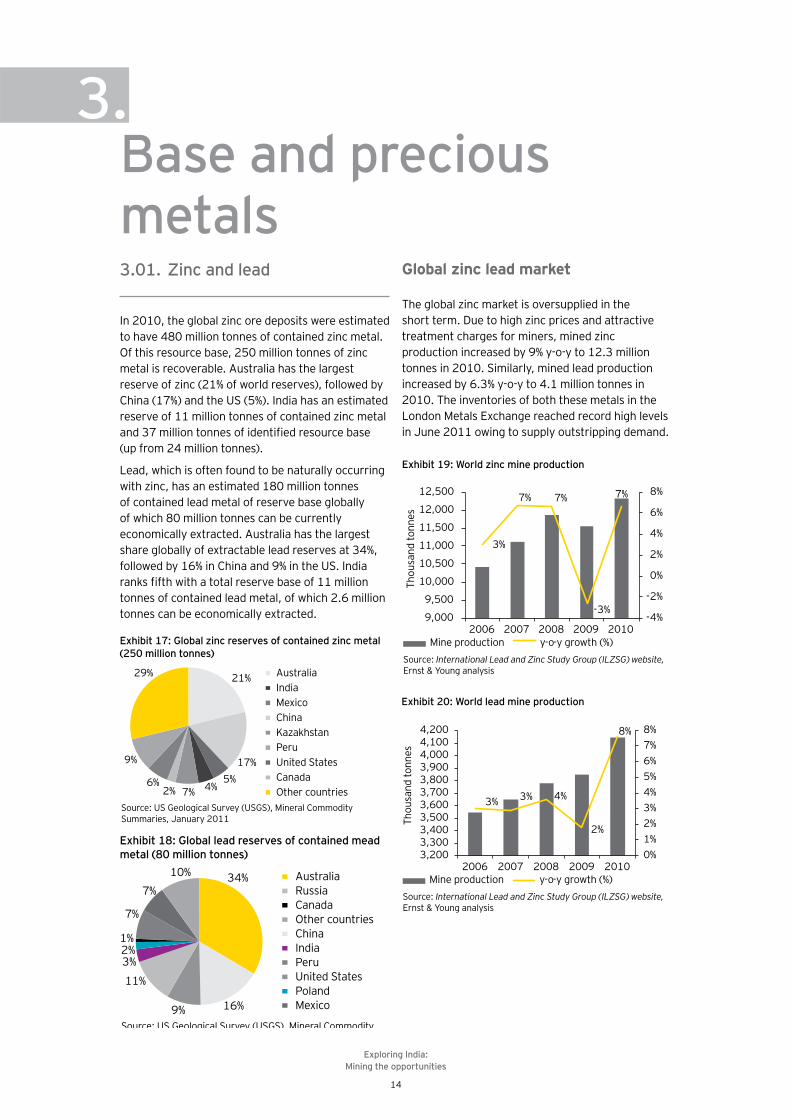
In 2010, the global zinc ore deposits were estimated to have 480 million tonnes of contained zinc metal. Of this resource base, 250 million tonnes of zinc metal is recoverable. Australia has the largest reserve of zinc (21% of world reserves), followed by China (17%) and the US (5%). India has an estimated reserve of 11 million tonnes of contained zinc metal ����XQ����������������!������������� ������� (up from 24 million tonnes).
Lead, which is often found to be naturally occurring with zinc, has an estimated 180 million tonnes of contained lead metal of reserve base globally of which 80 million tonnes can be currently economically extracted. Australia has the largest share globally of extractable lead reserves at 34%, followed by 16% in China and 9% in the US. India ��%��!��������������������������!�<<���������tonnes of contained lead metal, of which 2.6 million tonnes can be economically extracted.
Global zinc lead market
The global zinc market is oversupplied in the short term. Due to high zinc prices and attractive treatment charges for miners, mined zinc production increased by 9% y-o-y to 12.3 million tonnes in 2010. Similarly, mined lead production increased by 6.3% y-o-y to 4.1 million tonnes in 2010. The inventories of both these metals in the London Metals Exchange reached record high levels in June 2011 owing to supply outstripping demand.
Base and precious metals
3.
Exhibit 17: Global zinc reserves of contained zinc metal (250 million tonnes)
Source: US Geological Survey (USGS), Mineral Commodity Summaries, January 2011
21%
17%5%
4%7%2%6%
9%
29% Australia
China
United States
India
Kazakhstan
Canada
Mexico
Peru
Other countries
Exhibit 18: Global lead reserves of contained mead metal (80 million tonnes)
Source: US Geological Survey (USGS), Mineral Commodity
34%
16%9%
11%
3%2%1%
7%
7%10% Australia
China
United States
Russia
India
Poland
Canada
Peru
Mexico
Other countries
Exhibit 19: World zinc mine production
Source: International Lead and Zinc Study Group (ILZSG) website, Ernst & Young analysis
3%
7% 7%
-3%
7%
-4%
-2%
0%
2%
4%
6%
8%
9,000
9,500
10,000
10,500
11,000
11,500
12,000
12,500
2006 2007 2008 2009 2010
Thou
sand
tonn
es
Mine production y-o-y growth (%)
Exhibit 20: World lead mine production
Source: International Lead and Zinc Study Group (ILZSG) website, Ernst & Young analysis
Mine production y-o-y growth (%)
3% 3% 4%
2%
8%
0%1%2%3%4%5%6%7%8%
3,2003,3003,4003,5003,6003,7003,8003,9004,0004,1004,200
2006 2007 2008 2009 2010
Thou
sand
tonn
es

Exploring India: Mining the opportunities
15
Zinc and lead in India
During 2007–2010, zinc production in India increased at a CAGR of 17% to 613,964 tonnes per annum in 2010. Concurrently, the primary lead production in India decreased in the past three years and stood at 51,000 tonnes in 2010, as against 58,000 tonnes in 2008. The decline is mainly due to the lack of lead ore reserves, which are typically mined as a co–product of zinc.
*������������ ���!�������������!����������� �� ��in India. Hindustan Zinc accounts for almost 94% of zinc output, while Binani Zinc contributes the remaining. Hindustan Zinc in the only producer of lead in India.
�������������� ���!��������������������������accounts for almost 50% of the metal’s usage. India is currently a net exporter of zinc and continues to �����������������������������������������%�of low per capita zinc consumption at 0.45kg, as compared to the global average of 1.8kg per capita.
Between FY08 and FY10, the apparent zinc consumption in India increased at a CAGR of 9.3%. The demand for the metal remained largely resilient, even during the global economic crisis and declined only marginally by 3.4% y-o-y in FY09 before rebounding by 23% y-o-y to 534,000 tonnes in FY10.
Lead is mainly used in making batteries in India, which accounts for nearly 90% of the metal’s usage. Between FY08 and FY10, the apparent consumption of lead in India increased by 11%. This was driven by the demand from battery manufacturing. India remains a net importer of the metal.
Zinc exploration and development
Hindustan Zinc has led the growth story of ��������������������������������� �������������������������������������������� ������resulting in the addition of 185 million tonnes of resources between April 2005 and April 2011. Its Rampura Agucha mine is one of the lowest cost zinc producers globally. As on 1 April 2011, the country’s ��������������#������� ������?Q<���������������containing 37 million tonnes of zinc and 11 million tonnes of lead metal as worked out below.
GSI carried out the exploration for lead and zinc � �����\\=�\]�������������������!�*���������Himachal Pradesh, Madhya Pradesh and Meghalaya. Similarly, MECL conducted the exploration for lead ���������������������� �����`������������!�*����������"��*��������������� �������������������� ������������*���������
In addition, Pebble Creek Mining Ltd. (PCML) of ������������� ��������������������`%�������������@����%������j�"}�����<\\^��!�����`%����������through a subsidiary.
Exhibit 21: Total zinc production in India
Source: Hindustan Zinc annual reports; Binani Zinc annual reports
348,
316
426,
323
551,
724
578,
412
712,
000
32,624 31,904 30,443 35,552
30,905
100,000 0
200,000 300,000 400,000 500,000 600,000 700,000 800,000
FY07 FY08 FY09 FY10 FY11Zinc
pro
duct
ion
(in to
nnes
)
Hindustan Zinc Ltd. Binani Zinc Ltd.
CAGR 14%
Exhibit 22: Apparent zinc consumption
Source: “Metals,” Ministry of Mines websitehttp://mines.nic.in/writereaddata%5CContentlinks%5C2fbc8760128a42838437e664ec215e30.pdf, accessed 18 Aug 2011
0
100,000
200,000
300,000
400,000
500,000
600,000
700,000
FY08 FY09 FY10
Tonn
es
CAGR of 7%

Exploring India: Mining the opportunities
16
In India, the production of gold decreased at a CAGR of 2.5% from 3.1 tonnes in 2005 to 2.8 tonnes in 2010. However, in 2009, production increased by 3.7% y-o-y. Over the last few years, production has been stagnant due to the lack of adequate investments in the sector. Regulatory policies acted as resistance to investments from private and foreign companies that impacted the exploration and mining of gold reserves.
3.02. Gold
As of 2010, the total global reserves of gold are estimated to be around 51,000 tonnes. Australia has the largest reserves (14%), followed by South Africa (12%) and Russia (10%). India has around 67 tonnes of gold reserves, accounting for only 0.1% of global reserves.
The global production of gold increased marginally from 2,460 tonnes in 2006 to 2,500 tonnes in 2010. In 2010, China was the largest producer of gold (345 tonnes), followed by Australia (255 tonnes) and the US (230 tonnes).
In 2010, production increased by 2% y-o-y due to �����������������!�������������������������of existing mines. For instance, production at Boddington mines in Australia increased by 7 tonnes.
Exhibit 24: Estimated global gold reserves, 2010 (51,000 tonnes)
Source: U.S. Geological Survey, Mineral Commodity Summaries, January 2011
14%
12%
10%
6%7%6%
45%
0%
AustraliaSouth AfricaRussiaUSAChileIndonesiaOthersIndia
Exhibit 26: Global gold production trends
Source: US Geological Survey (USGS)
2,460
2,380
2,260
2,4502,500
-6-4-202
Percentage
46810
2,1002,1502,2002,2502,3002,3502,4002,4502,5002,550
2006 2007 2008 2009 2010
Tonn
es
Tonnes y-o-y growth
Exhibit 25: Global gold mine production, 2010 (2,500 tonnes)
Source: U.S. Geological Survey, Mineral Commodity Summaries, January 2011
14%
10%
9%
7%
8%5%
47%
China
Australia
United States
Russia
South Africa
Indonesia
Others
Exhibit 27: India gold production trends
Source: Indian Minerals Year Book (Advance release) 2009*, Indian Bureau of Mines website, 2011
3,100
2,400
3,0002,700 2,800
-30
-20
-10
0
10
20
30
0500
1,0001,5002,0002,5003,0003,500
2005 2006 2007 2008 2009
PercentageKilo
gram
s
Kilograms y-o-y growth
Exhibit 28: Share of world gold demand (2010; 3,242 tonnes)
44%
9%11%
9%
17%
7%3%
Source: The Yellow book, September 2010, Virtual Metals
Jewellery consumptionLegal tender coinsElectronicsOther end usesETFsCentral bank purchasesDehedging

Exploring India: Mining the opportunities
17
Major gold producers in India
=� Kolar Gold Limited Kolar Gold is primarily focused on mining activities in the Kolar Gold Greenstone Belt, near Bangalore. The company has been granted licenses to explore 32 known mineralized prospects, covering 568 square kilometers in Andhra Pradesh, Karnataka and Tamil Nadu. `���������������������������������������������revive the Kolar Gold Fields.
=� Deccan Gold Mines Limited DGML is engaged in gold exploration and mining in the Karnataka, Andhra Pradesh and *���������~��������������������������� ������of gold has not begun in any of the sites.
=� Hutti Gold Mines Company Ltd HGML is the only producer of primary gold in India. The company is undertaking the mining of gold deposits in Karnataka and operates one facility each in Raichur and Chitradurga. In addition, it has an operating mine in Tumkur. The Raichur unit is fully integrated, with a production capacity of 550,000 tonnes per annum.
With gold prices ruling at historically high levels, it may induce and support the re-opening of closed operations.
The global consumption of gold increased at a CAGR of 2.7% during the period 2006–10, from 3,424 tonnes to 3,812 tonnes. Consumption has been steadily increasing over the past few years, except in 2009 when consumption was impacted due to the global economic downturn. In 2010, almost half of ������������ �������!������������~����������������������������� ������������������������������������� �����������������������by rising demand in the electronics industry. In addition, global investors were attracted to physical gold and gold ETFs due to lack of investment opportunities in other asset classes.
The consumption of gold in India increased at a CAGR of 7.5% from 722 tonnes in 2006 to 963 tonnes in 2010. After declining in 2008 and 2009 due to higher gold prices, consumption recovered again in 2010.
Jewellery consumptionLegal tender coinsElectronicsOther end usesETFsCentral bank purchasesDehedging
Exhibit 29: Share of Indian gold demand (2010, 298 tonnes)
Source: The Yellow book, September 2010, Virtual Metals
73%
26%
1%
Exhibit 30: Global gold consumption trends
Source: World Gold Council
Tonn
es
Tonnes y-o-y growth
3,424
3,562
3,811.60
3,493.40
3,812.20
-10-8-6-4-20246810
3,2003,3003,4003,5003,6003,7003,8003,900
2006 2007 2008 2009 2010
Percentage
Exhibit 31: India gold consumption trends
Source: World Gold Council
Tonnes y-o-y growth
721.9 769.2 712.60578.50
963.10
-30-20-1001020304050607080
0200400600800
1,0001,200
2006 2007 2008 2009 2010
PercentageTonn
es
Exploring India: Mining the opportunities
18
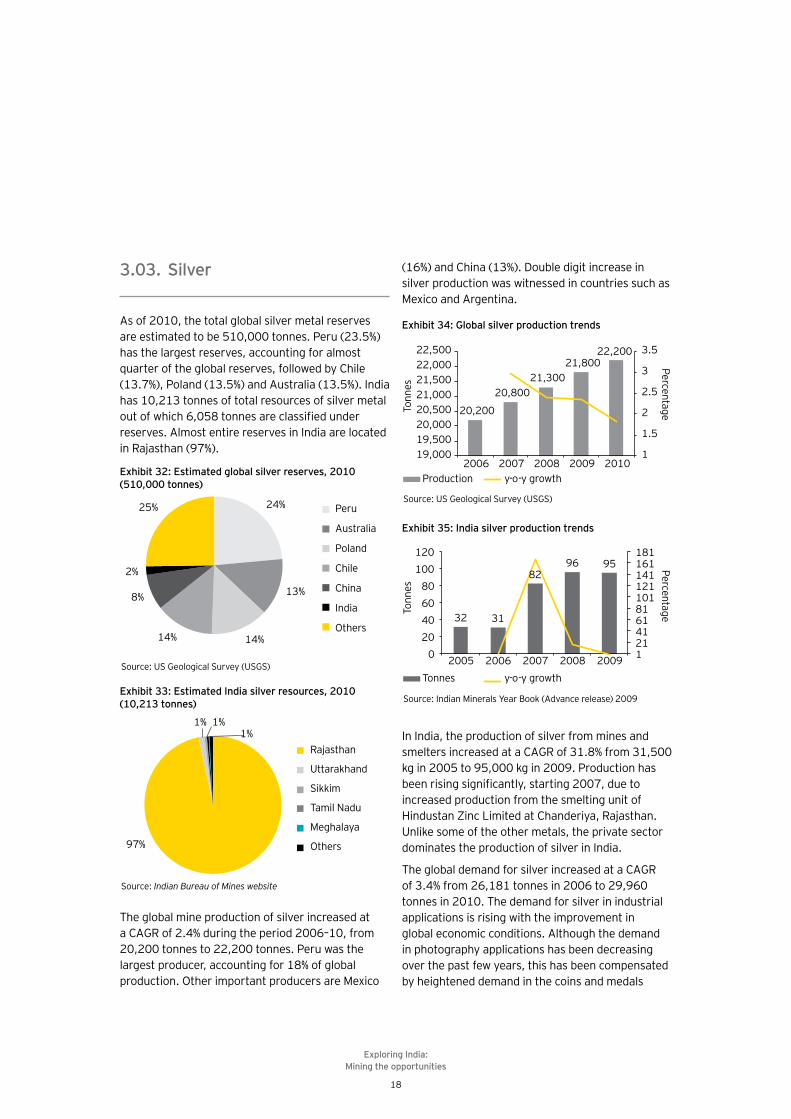
(16%) and China (13%). Double digit increase in silver production was witnessed in countries such as Mexico and Argentina.
In India, the production of silver from mines and smelters increased at a CAGR of 31.8% from 31,500 kg in 2005 to 95,000 kg in 2009. Production has �������������������������������\\Q��� �����increased production from the smelting unit of ���� ���������}���������������������*���������Unlike some of the other metals, the private sector dominates the production of silver in India.
The global demand for silver increased at a CAGR of 3.4% from 26,181 tonnes in 2006 to 29,960 tonnes in 2010. The demand for silver in industrial applications is rising with the improvement in global economic conditions. Although the demand in photography applications has been decreasing over the past few years, this has been compensated by heightened demand in the coins and medals
3.03. Silver
As of 2010, the total global silver metal reserves are estimated to be 510,000 tonnes. Peru (23.5%) has the largest reserves, accounting for almost quarter of the global reserves, followed by Chile (13.7%), Poland (13.5%) and Australia (13.5%). India has 10,213 tonnes of total resources of silver metal � ���!�������?�\_=������������������ ����reserves. Almost entire reserves in India are located ���*���������]Q^���
The global mine production of silver increased at a CAGR of 2.4% during the period 2006–10, from 20,200 tonnes to 22,200 tonnes. Peru was the largest producer, accounting for 18% of global production. Other important producers are Mexico
Exhibit 33: Estimated India silver resources, 2010 (10,213 tonnes)
Source: Indian Bureau of Mines website
97%
1% 1%1%
Rajasthan
Uttarakhand
Sikkim
Tamil Nadu
Meghalaya
Others
Exhibit 32: Estimated global silver reserves, 2010 (510,000 tonnes)
Source: US Geological Survey (USGS)
24%
13%
14%14%
8%
2%
25% Peru
Australia
Poland
Chile
China
India
Others
Exhibit 34: Global silver production trends
Source: US Geological Survey (USGS)
Production y-o-y growth
PercentageTonn
es20,200
20,80021,300
21,80022,200
1
1.5
2
2.5
3
3.5
19,00019,50020,00020,50021,00021,50022,00022,500
2006 2007 2008 2009 2010
2006
Exhibit 35: India silver production trends
Source: Indian Minerals Year Book (Advance release) 2009
Tonnes y-o-y growth
PercentageTonn
es
32 31
8296 95
121416181101121141161181
020406080
100120
2005 2007 2008 2009

Exploring India: Mining the opportunities
19
3.04. Copper
India has estimated copper ore resources of 1.39 billion tonnes with 26.5% falling under the proved and probable category, while the balance 73.5% feature under the feasibility, pre-feasibility, measured, indicated and inferred categories.
*����������������������� ����!�������������India, followed by Madhya Pradesh and Jharkhand. In fact, these three states account for around 93% of the total copper ore reserves with Andhra j������� ��������������������%���"���������Meghalaya, Orissa, Sikkim, Tamil Nadu, Uttarakhand and West Bengal accounting for the remaining 7%.
segment. In fact, the demand for silver in the coins and medals segment increased at a CAGR of 26.3% during 2006–2010.
India is the largest importer and consumer of silver globally; consuming around 3,000 tonnes per annum. Demand is increasing as many consumers shift from gold to silver, driven by spike in gold prices. This is increasing the demand for silver �������������!������������������������������������demand from rural consumers, which account for 60% of India’s imports, remains high.
Major silver producers
=� Hindustan Zinc Limited HZL is the largest producer of the silver in India. It produces silver from its mine located in �����������*�����������������������!���its 179-tonnes Chanderiya smelting complex in *��������
Exhibit 36: Global silver demand trends
Source: World Silver Survey 2011, http://www.silverinstitute.org/supply_demand.php
Silver demand y-o-y growth
PercentageTonn
es
26,18125,71325,642
26,144
29,960
-4-20246810121416
23,00024,00025,00026,00027,00028,00029,00030,00031,000
2006 2007 2008 2009 2010
Exhibit 37: World mines reserves (630 million tonnes)
Source: Mineral commodity summaries, US Geological Survey website, January 2011; Ministry of mines annual report FY11
6%13%
1%
24%
5%5%14%
5%
3%
25%United StatesAustraliaCanadaChileChinaIndonesiaPeruRussiaZambiaOther countries
Exhibit 38: Resources in India (1.39 billion tonnes)
Source: Indian Minerals Year Book (Advance release) 2009
48%
29%
16%
7%Rajasthan
Madhya Pradesh
Jharkhand
Others
Exploring India: Mining the opportunities
20
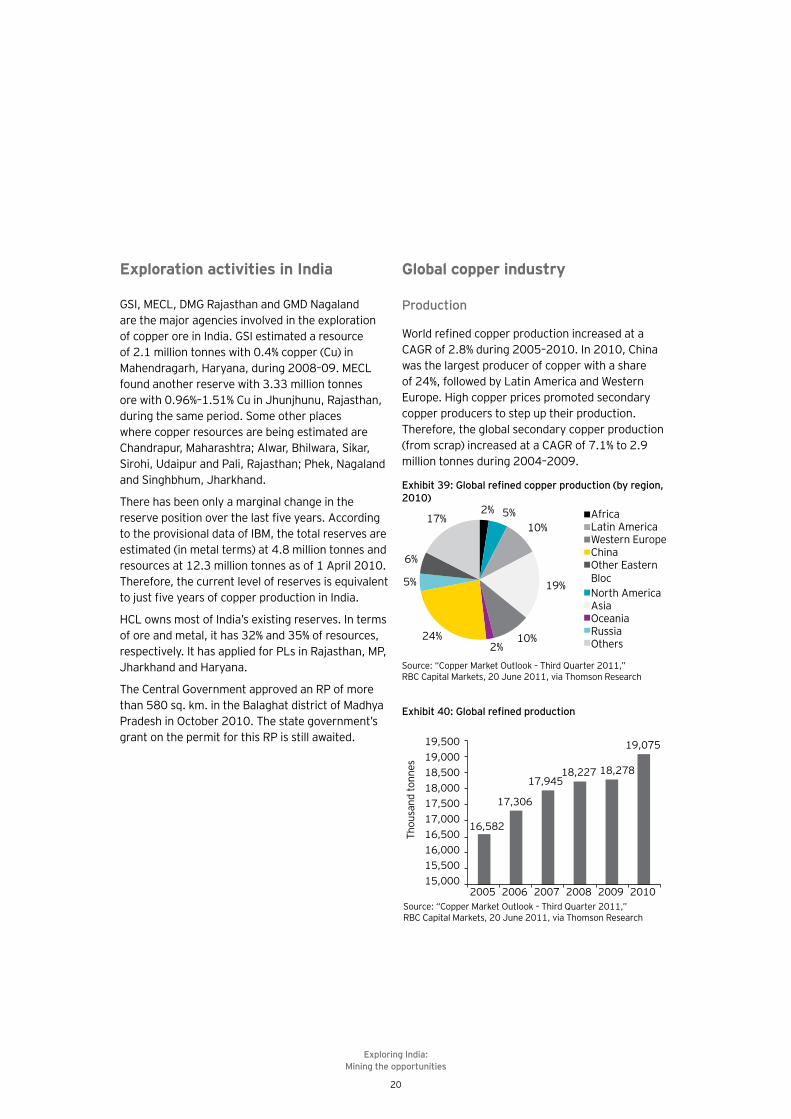
Exploration activities in India
�+���"��}���"��*�������������"����������������������������������������������������������of copper ore in India. GSI estimated a resource of 2.1 million tonnes with 0.4% copper (Cu) in Mahendragarh, Haryana, during 2008–09. MECL found another reserve with 3.33 million tonnes ��������\�]?^�<�_<^�� ������ ��� � ��*���������during the same period. Some other places where copper resources are being estimated are Chandrapur, Maharashtra; Alwar, Bhilwara, Sikar, +������@���� �����j�����*���������j��%�����������and Singhbhum, Jharkhand.
There has been only a marginal change in the ����������������������������������`��������to the provisional data of IBM, the total reserves are estimated (in metal terms) at 4.8 million tonnes and resources at 12.3 million tonnes as of 1 April 2010. Therefore, the current level of reserves is equivalent ���� �����������!���������� ����������������
HCL owns most of India’s existing reserves. In terms of ore and metal, it has 32% and 35% of resources, ��������������������������!��j}����*���������"j��Jharkhand and Haryana.
The Central Government approved an RP of more than 580 sq. km. in the Balaghat district of Madhya Pradesh in October 2010. The state government’s grant on the permit for this RP is still awaited.
��������>!��� ������������� ����� �
Source: “Copper Market Outlook – Third Quarter 2011,” RBC Capital Markets, 20 June 2011, via Thomson Research
16,582
17,306
17,94518,227 18,278
19,075
15,00015,50016,00016,50017,00017,50018,00018,50019,00019,500
2005 2006 2007 2008 2009 2010
Thou
sand
tonn
es
��������?"��� ������������ ������� ����� ���������� ���2010)
Source: “Copper Market Outlook – Third Quarter 2011,” RBC Capital Markets, 20 June 2011, via Thomson Research
2% 5%10%
19%
10%2%
24%
5%
6%
17% Africa
North America
Latin America
Asia
Western Europe
Oceania
China
Russia
Other Eastern Bloc
Others
Global copper industry
Production
�������������������� �������������������CAGR of 2.8% during 2005–2010. In 2010, China was the largest producer of copper with a share of 24%, followed by Latin America and Western Europe. High copper prices promoted secondary copper producers to step up their production. Therefore, the global secondary copper production (from scrap) increased at a CAGR of 7.1% to 2.9 million tonnes during 2004–2009.

Exploring India: Mining the opportunities
21
Consumption
The global demand for copper increased by 8.2% in 2010 after a marginal decline of 0.9% in 2009. ����������������������������������!���������
copper consumption during the last few years. It witnessed a growth of 7.9% in copper consumption in 2010, even after registering a rise of 32.3% in 2009.
��������>��� ������������ ������ ������� ���������� ����!!&��"@?������ ��� ����&
Source: “Copper Market Outlook – Third Quarter 2011,” RBC Capital Markets, 20 June 2011, via Thomson Research
2% 8%5%
23%
21%1%
35%
5%AfricaUSALatin AmericaAsia totalWestern EuropeOceaniaChinaOthers
��������>���� ������������ ������ ������� ���������������!!"
Source: “Copper Market Outlook – Third Quarter 2011,” RBC Capital Markets, 20 June 2011, via Thomson Research
33%
33%
13%
13%
8% Construction
Electronic products
Industrial Machinery
Transport
Consumer products
Indian copper industry
The per capita consumption in India stands at �� ���\�_�%�������������������������������������world average of 2.7 kg and China’s 5.4 kg. Copper consumption in any country increases in line with the rise in income; however, the elasticity of demand
for copper is much higher in developing countries than in developed countries. Considering that India may witness a GDP growth of more than 7% for the next few years to come, copper demand is expected to grow at a much faster clip, which compounded the resource shortage in the country.
Exhibit 43: Per capita copper consumption
Source: “The Indian Copper Industry,” ICRA Management Consultancy Services Limited, August 2010, via Thomson Research
1.5
10.7
15.9
10.6
18.3
0.2
11.8
1.3 1.9 2.55.4 5.5
13.6
6.9
19.2
0.5
8.9
3.31.7 2.7
0
5
10
15
20
25
China US Germany Japan Korea India Italy Russia Brazil World
Kilo
gram
s
2000 2009
Exploring India: Mining the opportunities
22
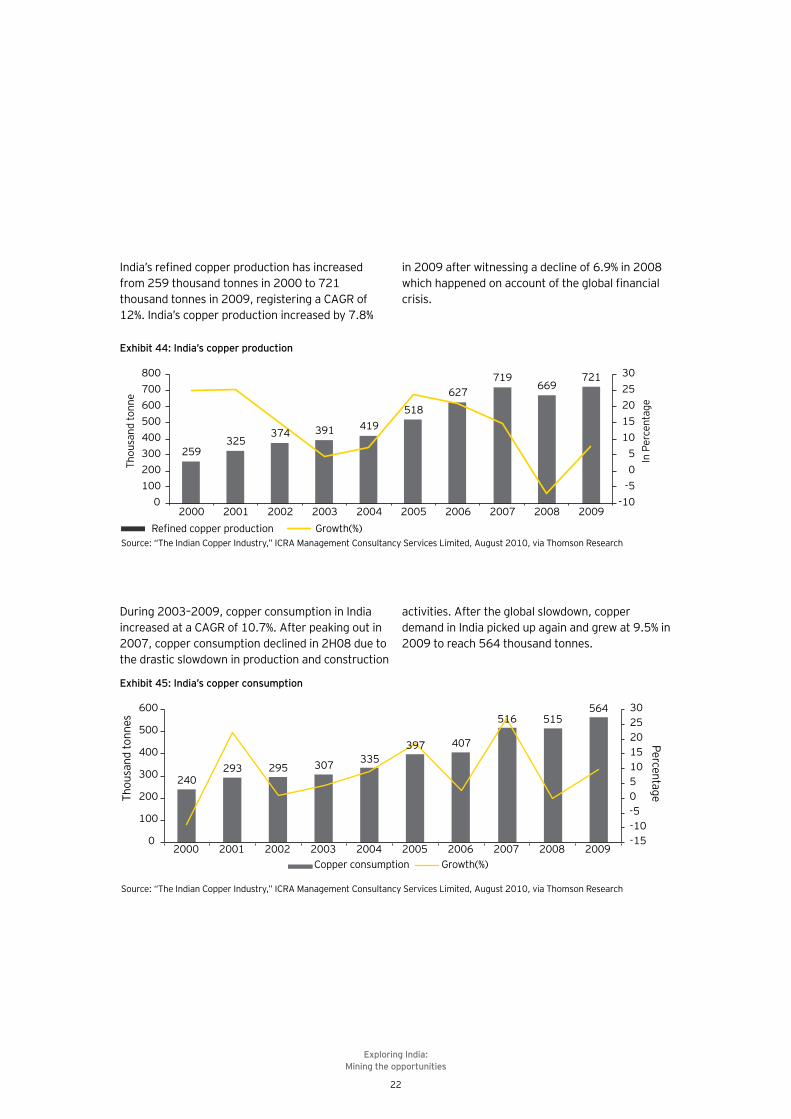
During 2003–2009, copper consumption in India increased at a CAGR of 10.7%. After peaking out in 2007, copper consumption declined in 2H08 due to the drastic slowdown in production and construction
activities. After the global slowdown, copper demand in India picked up again and grew at 9.5% in 2009 to reach 564 thousand tonnes.
���������������������� �����������������from 259 thousand tonnes in 2000 to 721 thousand tonnes in 2009, registering a CAGR of 12%. India’s copper production increased by 7.8%
in 2009 after witnessing a decline of 6.9% in 2008 ���������������������� ����!���������������������crisis.
Exhibit 45: India’s copper consumption
Source: “The Indian Copper Industry,” ICRA Management Consultancy Services Limited, August 2010, via Thomson Research
240293 295 307 335
397 407
516 515564
-15-10-5051015202530
0
100
200
300
400
500
600
2000 2001 2002 2003 2004 2005 2006 2007 2008 2009
PercentageThou
sand
tonn
es
Copper consumption Growth(%)
Exhibit 44: India’s copper production
Source: “The Indian Copper Industry,” ICRA Management Consultancy Services Limited, August 2010, via Thomson Research
259325
374 391 419518
627719
669721
-10-505
1015202530
0100200300400500600700800
2000 2001 2002 2003 2004 2005 2006 2007 2008 2009
In P
erce
ntag
e
Thou
sand
tonn
e
*��������������� ����� Growth(%)

Exploring India: Mining the opportunities
23
3.05. Diamonds
The world’s total diamond reserve base is estimated to be 1,300 million carats, of which 580 million carats of reserves are economically extractable. Congo has the largest reserve base of 350 million carats, followed by Botswana and Australia (230 million carats each) and other African countries. India currently has a resource base of 31.6 million carats, which includes the newly discovered Bunder deposit in Madhya Pradesh.
The world diamond production was 133.12 million carats in 2010, valued at US$12 billion, with the African continent contributing around 50% of the production. Botswana was the leading producer by value in 2010 at US$2.59 billion for 22 million carats, while Russia was the top producer by volume at 34.86 million carats valued at US$2.38 billion.
Major players
=� Sterlite Industries: +��������������������group manufacturing copper, zinc and aluminum. In India, the company has its copper facilities at Tuticorin, Tamil Nadu, which comprises a 400,000-tonnes-per-annum copper smelter with a 205,000-tonnes copper �������
=� Hindalco Industries: Hindalco manufactures aluminium and copper products. Till 2010, the company had a copper smelting capacity �!�_\\�\\\������������� ��������������������� �����������!�� ������������������������largest copper smelters at a single location.
=� J���������Q �����/����JQ/&�HCL, a public sector undertaking, is engaged in mining ��������������������������������������������manufacturing downstream products. Having a smelting capacity of 49,500 tonnes per annum, ������������� ���!� � ���������������������������*����������"�����%�����������j�������"������j�����������������������������������������%����������~������������j�������"������������������������vertically integrated primary copper producer in India, which has its own captive mines.
Exhibit 46: Country wise diamond value by US$
Rank Country Value (billion US$)
1 Botswana 2.59
2 Russia 2.38
3 Canada 2.3
4 South Africa 1.8
Exhibit 47: Country wise diamond value in carats
Rank Country Value (billion US$)
1 Russia 34.85
2 Botswana 22
3 DRC* 20
4 South Africa 13.6
5 Canada 11.8
6 Australia 9.97
Source: “Global diamond production rises 10.8% in 2010,” DNA - Daily News & Analysis, 5 August 2011, via Factiva, © 2011 Diligent Media Corporation Ltd.
* DRC: Democratic Republic of Congo

Exploring India: Mining the opportunities
24
India’s production of diamonds is currently negligible at a meager 0.04% of the global production. NDMC is the only organized producer of diamond in India.
������������������������ ��!����������processing, which involves the cutting and polishing of diamonds. The country imports diamonds in the rough form and exports them ��������������!����!���� ��������������������India continues to be the dominant player in the
global cutting and polishing industry with an 800,000-strong workforce, followed by China with around 25,000 people employed. The Indian ������������������������������ �����expected to exceed US$31 billion in 2010–11.
The value added to imports (the value of polished diamond exported the less value of imported rough diamond) was 136% in 2010–11, as ����������>X^�����\\Q�\=���������������increasing margins in the business.
Exhibit 48: Diamond import export in India
Source: Gem and Jewellery Export Promotion Council of India (GJEP)
9,065 8,408 9,583 9,797 7,960 9,04811,93012,293 10,817
13,232 14,204 14,80518,244
28,252
0
5,000
10,000
15,000
20,000
25,000
30,000
2005 2006 2007 2008 2009 2010 2011 (E)
US$
mill
ion
Rough diamond imports (in US$ million) Polished diamond exports (in US$ million)
Diamond exploration in India
There are new and diverse opportunities for accelerated exploration with robust demand for rough diamonds in the diamond processing industry in India. The efforts to increase the local production by discovering new diamond resources, at least to some extent, are ongoing.
Broadly, India has three diamond provinces: Central Indian, East Indian and South Indian provinces. The !�����������������������������������������������areas for diamond exploration:
{� Granite-greenstone terrain of Andhra Pradesh ����������%������������������
{� Bastar Craton in Maharashtra{� Chhattisgarh{� Panna and Bunder Diamond Belt and its
surrounding Bundelkhand Granite terrain in Madhya Pradesh and Uttar Pradesh
GSI continued exploration activities for the search of kimberlite (the source rock of diamond) in Andhra Pradesh, Madhya Pradesh, Chhattisgarh and Orissa. The Directorate of Geology, Orissa, has explored areas in the Nuapada district.
Exploring India: Mining the opportunities
25
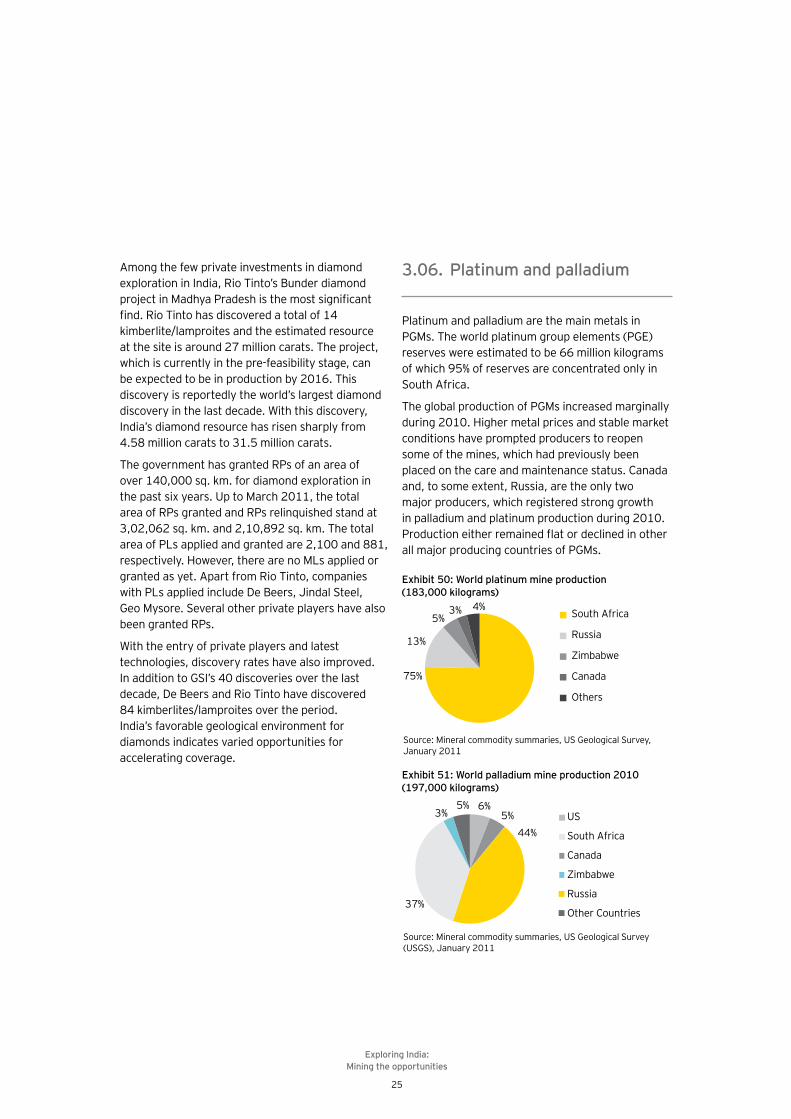
3.06. Platinum and palladium
Platinum and palladium are the main metals in PGMs. The world platinum group elements (PGE) reserves were estimated to be 66 million kilograms of which 95% of reserves are concentrated only in South Africa.
The global production of PGMs increased marginally during 2010. Higher metal prices and stable market conditions have prompted producers to reopen some of the mines, which had previously been placed on the care and maintenance status. Canada and, to some extent, Russia, are the only two �������� �����������������������������in palladium and platinum production during 2010. j�� ������������������������������������������������������� ������� ������!�j�"�
Exhibit 50: World platinum mine production (183,000 kilograms)
Source: Mineral commodity summaries, US Geological Survey, January 2011
75%
13%
5%3% 4%
South Africa
Russia
Zimbabwe
Canada
Others
Exhibit 51: World palladium mine production 2010 (197,000 kilograms)
Source: Mineral commodity summaries, US Geological Survey (USGS), January 2011
6%5%
44%
37%
3%5%
US
Canada
Russia
South Africa
Zimbabwe
Other Countries
Among the few private investments in diamond exploration in India, Rio Tinto’s Bunder diamond ����������"������j������������������������������*���~��������������������������!�<>�kimberlite/lamproites and the estimated resource ��������������� ����Q���������������~�����������which is currently in the pre-feasibility stage, can be expected to be in production by 2016. This discovery is reportedly the world’s largest diamond discovery in the last decade. With this discovery, India’s diamond resource has risen sharply from 4.58 million carats to 31.5 million carats.
The government has granted RPs of an area of over 140,000 sq. km. for diamond exploration in the past six years. Up to March 2011, the total area of RPs granted and RPs relinquished stand at 3,02,062 sq. km. and 2,10,892 sq. km. The total area of PLs applied and granted are 2,100 and 881, respectively. However, there are no MLs applied or granted as yet. Apart from Rio Tinto, companies with PLs applied include De Beers, Jindal Steel, Geo Mysore. Several other private players have also been granted RPs.
With the entry of private players and latest technologies, discovery rates have also improved. In addition to GSI’s 40 discoveries over the last decade, De Beers and Rio Tinto have discovered 84 kimberlites/lamproites over the period. India’s favorable geological environment for diamonds indicates varied opportunities for accelerating coverage.

Exploring India: Mining the opportunities
26
India currently does not mine PGM and imports to meet its domestic demand for the metals. The demand for platinum in India is mainly driven ��������������������~����������!������������was expected to reach 15 tonnes by the end of 2010–11, as against 10 tonnes in 2008–09. As regulations governing automobile emissions become stricter in India, the demand for platinum, palladium and rhodium, used as a catalyst in controlling the toxicity of emissions from automobiles, is expected to rise.
PGE exploration in India
In India, the platinum groups of elements (PGE) have been traced in parts of the Sukinda and Nuasahi sectors of Orissa and Sittampundi in Tamil Nadu. The entire resources of PGMs estimated so far are at 15 tonnes, located in the Nilgiri, Boula-Nuasahi and Sukinda areas in Orissa. About 54% reserves are in the pre-feasibility category and the remaining 46% in inferred category.
GSI, state DGMs and private entrepreneurs have pursued an extensive PGE exploration in Orissa, Karnataka, Tamil Nadu, Kerala, Madhya Pradesh, Uttar Pradesh, Manipur and Nagaland. The following ���������������������������������{� Baula–Nausahi in Orissa{� Hanumalpur in Karnataka{� Sittampudi and Mettuppalaiyam in Tamil Nadu
|!����������������������������������� ��#Nausahi prospect is the most promising with an estimated PGE resource of 11 million tonnes.

Exploring India: Mining the opportunities
27
The National Mineral Policy of 2003 paved the way for foreign companies to invest up in mining industry in India.
In Mines and Minerals (Regulation and Development) Act (MMRDA) Amendment 1999, reconnaissance permits were introduced and FDI cap was increased from 50% to 100% for all minerals except diamonds. Subsequently, FDI in the diamond industry also increased to 100%.
The policy uses certain mining legislations such as MMDRA, 1957, and the Mines Act, 1952,
together with rules and regulations framed under them. The MMDR Act contains two set of rules viz., Mineral Concession Rules, 1960 (MCR), and Mineral Conservation and Development * ����<]==��"��*����������������������������(state governments are free to deal with mineral concessions related to minor minerals) and enable the Indian Bureau of Mines (IBM) to monitor and regulate mining activity in the country, respectively.
Regulatory overview4.
Exhibit 52: Legislation framework governing mining in India
Mining legislations
Mines and Minerals(Development and
Regulation) Act, 1957
MineralConcessionRules, 1960
MineralConservation and
DevelopmentRules, 1988
State MinorMineral
Concession Rules
Source: Federation of Indian Mineral Industries
MinesAct, 1952
Mines Rules1955
Offshore Areas Mineral(Development and
Regulation) Act 2002

Exploring India: Mining the opportunities
28
~����%���������������� ��������!������� and transparent, the government formed the “Hoda Committee,” which had come up with several recommendations.
The synopsis of the Hoda Committee recommendations for the new mineral policy is as follows:{� ”Open sky” policy at the initial stages, i.e., at
the stage of RPs, thereby removing exclusivity{� +���������������!���*j����j}������ ������
discretion by government bodies{� Flexibility in interim tenures{� ������������������!�������������!����������{� +�� �����!���� ���������� �������������
preferential treatment{� Timely clearance of mineral concessions{� Value addition requirement to be given
preference, but not an absolute requirement{� Changes in royalty structure to ad valorem{� +��������������!���������������������������
requirement{� Setting up a mineral development fund (MDF)
The recommendations of the Hoda Committee and the National Mineral Policy are in the process of getting implemented. The government ����������������!������������������������legislations for the effective implementation of these recommendations.
While the above proposals are broadly adequate to address the various regulatory and procedural challenges that the Indian mining industry is facing, the key issue is whether there is political and bureaucratic will and discipline to implement the same in true spirit.
The new National Mineral Policy of 2008 aims to achieve multiple goals such as large-scale prospecting with optimal mining and attracting investments with the latest technology.
However there were various challenges faced by the industry under the NMP 2003 policy:=� Smaller size for PLs and MLs: The size of PL
��������������������_����%���������������"}��������<\����%��
=� No adherence to time-limits: The time limit between the application and the grant of permission ranged from 6 months to 3 years upwards.
=� X ���[��������������� In India, public sector companies have always been given priority in the allocation of licenses. The 1993 NMP did ���� ��������������������������������������!��private companies, which restricted the entry of global mining players in the country.
=� X ������������� ������ ��\� ������government: The policy offered no tax incentives on exploration expenditure and was not encouraging for companies to get listed to raise funds for exploration.
=� Lack of exploration: GSI was stretched thin due to its scarce resources and, therefore, barring coal and iron ore, the rest of the minerals remained largely underexplored.
=� Ambiguity in laws: There is a considerable overlap between the relative roles of the states vis-à-vis the Center.
=� Procedural complexities: A large number of clearances (not available at a single window) at both the central and the state level need to be taken under the MMDR Act, MCR, MCDR, Forest (Conservation) Act, Environment (Protection) Act, etc., before a ML can be executed.
{� Security of tenure: There was no security of tenure from the RP to PL stage. Moreover, a preferential right for conversion from one form of concession to the next one did not guarantee an exclusive or absolute right to prospect or mine any mineral deposit found within the area covered under by the RP or PL.
Exploring India: Mining the opportunities
29
Apart from environmental and regulatory issues and delays in grant of concessions, the Indian mining industry faces some other challenges: =� Lack of adequate investments
~������������������������������������investments despite the liberalization of this sector for private and foreign investments. It may be mentioned that apart from the right policy initiatives, the challenges associated with land acquisition, onsite infrastructure development and transportation systems are acting as a deterrent to investments in this ������`������������������������ !�������research on mining resources, primarily due to inadequate funds with the agencies entrusted with exploration activities.
=� Inadequate database on mineral concessions Industry sources believe that there is inadequate information dissemination about areas available for different types of mineral concessions in India. Such inadequacy in the information base also acts as a deterrent for potential investors.
=� Poor taxation regime The current taxation regime in the mining �������������������� !�������!��������������participation in the industry, including FDI, particularly in upstream exploration activities.
=� Resistance from communities "���������!������������!�����������community to extract minerals from the mines in their vicinity and, as the areas go deeper, this further accentuates. Often, the lack of good understanding and trust, responsible leadership and communication about the socio-economic impact of the investment are the prime reasons !�� ������������~�����������������%�������������������������� ���������������to the host communities on matters of land acquisition, forest rights, sustainable development, etc.
=� Poor infrastructure Poor infrastructure further mars the growth of the industry. Mining operations require the development of infrastructure in and around remote locations where the mineral reserves are located. To promote mining around a certain mineral belt, it is important to have adequate infrastructure facilities. Countries such as Australia and South Africa appear better placed in terms of infrastructure availability as compared to India.
=� Lack of local risk capital market Exploration is a capital intensive and risky business and therefore, there is always a requirement for new companies to raise funds !�����������������! � ���������������������Currently, India does not have a local capital market where the exploration companies can raise money for their needs.
=� Under investment by states in geosciences: �+�����������������������������������������responsible for exploration in India. Till yet, the contribution from state agencies had been minimal. The central government and the respective state governments in India have different legislature and policies to deal with different minerals, which further slows down the exploration process in respective states.
The Fraser Institute, an independent Canadian research organization, conducts an annual survey of mining companies to assess how public policy affects exploration investment. They prepare ��j������j����������������jj�������������������maximum score of 100), which is a report card on the attractiveness of the governments’ mining policies. In the Fraser Institute’s 2010–11 survey, Alberta, Canada, topped with a PPI score of 90.4. India was ranked low at 74 (PPI of only 10.6) out of 79 provinces/countries, indicative of the need ������������������������ ������!�� �����improvement.
Other issues and challenges in the Indian mining sector
5.
Exploring India: Mining the opportunities
30
The Indian landscape is geologically very rich in mineral content, being the part of erstwhile Gondwana landmass; it has rich reserves in variety of minerals such as iron ore, coal and many other non-ferrous metals. It is estimated that the country holds abundant reserves of key minerals such as iron ore, bauxite, dolomite, gypsum, limestone, mica
and adequate reserves of chromite, manganese, zinc and graphite. Potential areas of exploration venture include gold, diamond, copper, lead– zinc, nickel, cobalt, molybdenum, lithium, tin, tungsten, silver, platinum group of metals and other rare metals, chromite, manganese ore and fertilizer minerals.
Opportunities in the exploration and mining sector
6.
Exhibit 53: India — status of reserves of select minerals
Mineral Abundant Adequate ������� Scarce
Metallic minerals �\��� ��&�
Iron ore Chromite (metallic), Manganese
Chromite (refractory)
Nickel, Tungsten, Cobalt, Molybdenum
Metallic minerals �� ��\��� ��&�
Bauxite (metallurgical)
Zinc Bauxite (chemical grade), Copper, Lead
Antimony, Gold, Platinum group of minerals
Industrial minerals Dolomite, Gypsum, Limestone, Mica
Graphite Apatite, Rock-Phosphate, Kyanite
Sulphur, Potash
Precious stones - - - Diamond, Emerald, Sapphire, Ruby
Source: “Indian mineral sector and its export potential,” Occasional paper no. 122, EXIM bank of India

Exploring India: Mining the opportunities
31
The Indian mining industry also has a bright future because the rapidly growing economy propels the domestic demand, which requires mining outputs to grow. The various policy reforms taken by the government seek to stimulate both foreign investment and the expansion of the country’s private sector. The lack of a detailed exploration program in the past has made the case of mining exploration an essential element in the growth of ������ �����~���!������������������������
on how the achievement of potential can be accelerated in an enabling environment to fuel and sustain India’s long-term growth story.
Certain countries have been able to achieve good progress in leveraging the mining industry with the adoption of appropriate policies. Exhibit 54 gives a comparative insight of the respective progress updates of India and Australia in the same time span.
The total mineral potential area in India covers 5.75 lakh sq. km., of which an area of only 75,000 sq. km. has been explored in detail so
far. The exploration scenario of certain important minerals has been given below:
Exhibit 54: Progress in achieving potential — India vs. Australia
Commodity India — 1980 India — 2008 Australia — 1980 Australia — 2008
Iron Ore reserve �J�������&
11 billion tonnes 14 billion tonnes 15 billion tonnes 50 billion tonnes
Diamond reserve "��������� 2.6 million carats �"���������
0 230 million carats
Gold reserve 55 metric tonnes 325 metric tonnes 400 metric tonnes 6000 metric tonnes
Bauxite reserve 2.5 billion tonnes 2.6 billion tonnes 3 billion dry tonnes 9 billion dry tonnes
Source: Federation of Indian Mineral Industries website
Exhibit 55: Exploration opportunities in India
Geological environment
(In sq.km.)
Area covered by prospecting and
future opportunities
Gold: 1,12,000 Base metal: 1,82,000 Diamond and Gemstone: 3,00,000
�\^����X\^��!��������������������������������������������!��prospecting and exploration in virgin areas
Iron ore: 4,000 Manganese ore: 4,600 Chromite ore: 2,500
������������������������������������!�����������������]\^�����������!��hematite ore, 80% for manganese ore and 40% for chromite ore
Resource assessment carried out in the early eighties
Most areas covered under lease or forest; free areas may be taken up
Platinum Group of elements: 8,000 <^�����^����������������������������� �������� ������������
Coal: 48,500 70% explored up to 900 meters depth
Lignite: 9,300 40% explored between the depth of 300 meters and 500 meters
Source: Federation of Indian Mineral Industries website

Exploring India: Mining the opportunities
32
The comparison of reserves-to-production (r/p ratio) of various minerals in India against the r/p ratio across different countries (reference Exhibit _?����������_Q������������������ ���������opportunities in India.
Zinc and lead: The r/p ratio of zinc and lead in India �=�_�������������������������������������������of 20.5. In India, the demand for zinc and lead has increased at a CAGR of 7% and 11% respectively in between FY08 and FY10. Though, India is producing more than its domestic requirement currently, it is imperative that it ramps up the exploration and prospecting of zinc and lead for its future growing needs.
Copper:��������������������������������imported copper concentrate, there has not been �������������������������������������������for the last few years. Comparing India’s r/p ratio of India with countries such as Australia, the US and Canada indicates the urgent requirement of investment in copper exploration.
Gold: The yellow metal is one of the least prospected and explored in India, despite India being one of the largest consumers of gold in the world. Only around 20%–30% of the potential area with possibility of gold reserve has been prospected. There are certain areas in the country, which are still untouched and require investments for prospecting and exploration.
Diamonds: Exploration and prospecting have �������������� !������������ �������� ������encouraging. Only around 20% of the potential area is explored in case of precious metals. The lower than average r/p ratio indicates the requirement of exploration and prospecting.
+���������� ��� \���������+�;&�These are one of the most virgin and untapped minerals in India. Out of the total potential area, only around 1%–2% of the area is prospected. While the world average r/p ratio is 173, only 7.7 tonnes of resources have been indicated in the pre-feasibility stage in India.
��������]^�������#������[��_� _�� ����� ������ � \�������������������
Mineral Production* Proved reserves*
R/P ratio Total resources* Proved reserves/total resource ratio
Gold (Kg) 2,214 66,920 30.23 490,810 0.14
Diamond (carats) 71,381 605,577 8.48 4,581,913 0.13
Silver metal (tonnes)
95** 2,283 24.03 10,213 0.22
Zinc and lead metal (‘000 tonnes)
794 6,766 8.52 31,467 0.22
PGM (tonnes) - - - 7.7 (pre-feasibility)
-
Copper metal (‘000 tonnes)
721** 1,644 2.28 11,418 0.14
Source: Ministry of Mines, annual report FY11; Indian Minerals Year Book (Advance release) 2009, “The Indian Copper Industry,” ICRA Management Consultancy Services Limited, August 2010, via Thomson Research, Ernst and Young analysis* Production numbers are estimated of 2010–11; Reserves and resources are as on April 2005 as per National Mineral Inventory**Silver and copper production numbers are of 2009

Exploring India: Mining the opportunities
33
Some of the indicative directions in which efforts are further required are as follows:
To achieve most out of these opportunities in the mining and metal sector, there is a need for expertise �����������������������������!�������������������������������������~��������������������opportunities for suppliers of technology, skills and capital.
Exhibit 57: Global comparison of R/P ratio
Mineral South Africa Australia Canada US World average
Gold 31.58 28.63 11 13.04 20.4
{��� ����������& 23.3 8.64 - - 10.55
Silver - 41 10 19.53 22.97
Zinc and lead 6 (only lead) 38.64 9.1 16.96 20.5
PGM 298.57 - 20.81 59.60 173.68
Copper - 89 16.7 31.3 38.9
Source: Mineral commodity summaries, US Geological Survey, January 2011
Exhibit 58: Various minerals in India and their potential investment areas
Commodity Current state Future needs Opportunities
Copper {� Growing demand{� Large market{� Skilled manpower
{� Exploration for new deposits{� ��������������������������
and smelting facilities
{� �����������������
Lead {� Catering to 70% demand{� Skilled manpower
{� Environment friendly technologies
{� Exploration and primary/secondary production
Zinc {� +��!� !������{� Modern mining methods
{� Environment friendly technologies
{� Exploration and primary/secondary production
Gold {� Limited resources of economically viable grade
{� Skilled manpower{� Advanced mining
technologies for deeper depth mining
{� Increased exploration in Archean green stone belts/laterites
{� Mining of low grade ores/tailing dumps
{� Improved technology
{� Advanced exploration ��������}�����������mining,
{� ��� �������������bioleaching, smelting ����������
Diamond {� Expertise in cutting and polishing
{� Increased exploration and mining
{� Intensive exploration and mining
{� Upgrading
Source: Federation of Indian Mineral Industries website

Exploring India: Mining the opportunities
34
Since the last few years, the mining sector has been a key contributor to India’s GDP. While the ���������������������j�������������������approximately 2% during the last 15 years, the sector’s base has grown in line with the GDP growth of the country. The Indian mining sector has performed reasonably well in the last few years and the same has been captured in the volume ����������������!������!�����������������companies listed on the Indian bourses, namely Coal India, NMDC (National Mineral Development Corporation) and Sesa Goa.
During 2010, Coal India, the world’s largest coal company, raised more than INR150 billion through an IPO, for its future expansion plans. It was the largest and one of the most successful IPOs in the Indian capital market history and is the largest Indian company by market-cap today. In addition, other mining companies such as MOIL (Manganese Ore India Ltd) and NMDC have also successfully raised capital to accelerate their future expansion ������"���������������������������������� �����������������*���~������������������������� ������������������������%��������������������������������������������"�����#����states such as Orissa have witnessed GSDP grow at a faster pace, riding on the mining boom. However, there is a need to increase exploration and expand focus on minerals beyond coal and iron ore.
Up until now, both the lack of funds and relatively stringent mining policies have restricted the growth of the Indian exploration industry. However, “resource nationalism,” which is picking up across the globe, may actually turn out be a silver lining for the domestic exploration industry. India is largely unexplored and, therefore, it offers good opportunities for mining exploration companies to set up their facilities and be a part of the Indian growth story for the next decade. To reveal the actual value of the underlying minerals, all the stakeholders in the Indian mining sector need to consider, inter alia, the following:
Changes required in mining exploration modelsThe mining exploration model in the country needs to be changed. For several decades, GSI ������������������������������������������%����into exploration issues at the national level. As a result, India has till now explored only 2%–3% of the mineral reserves as against almost 100% geophysical and geochemical surveys in countries such as Australia. Basically, the Central Government and the respective state governments in India have different legislature and policies to deal with for different minerals. It is time for state governments to proactively plan and equip themselves with technologies to establish the mineral reserves in their respective states.
Increase funds allocated to the exploration agenciesThere is an urgent need to increase the funds allocated to Indian exploration agencies such as GSI and MECL. An investment of US$1 in exploration is estimated to give a return of around US$15. While in Canada, more than US$2 billion was invested for mineral exploration during 2010, the corresponding �� ��!�������������������@+K�����������~���increase in budget will help these agencies to strengthen their exploration base, which will bring more reserves into the public domain, further boosting investment in the extraction sector in India.
Frequent assessment of mining reserves in the countryThere is not much clarity about the exact quantum, quality and location of resources/reserves. While GSI, Mineral Exploration Corporation, National Remote Sensing Agency, Indian Bureau of Mines and National Geophysical Research Institute maintain geological databases, there is a need to assess and update data more frequently for a more recent and comprehensive picture of our mineable resources.
Recommendations7.

Exploring India: Mining the opportunities
35
Based on the capital raisings by mining companies globally, the exchanges can be broadly ranked as follows:
TSX – TSV (Toronto, Canada) 61%
LSE and AIM (London, UK) 26%
ASX (Australia) 9%
JSE – Alt (Johannesburg, South Africa) 3%
NYSE (New York, US) 1%
Although TSX has more listings, LSE and AIM have been catching up and have been particularly attractive for companies in the emerging markets. Despite more listings, LSE and AIM have greater market capitalization than TSX-TSV due to the larger mining companies in London.
JSE and Alt are not commonly used as there is little �����������!�� ������������������������������!�the mining sector dominating the market.
In terms of the right market to list and raise money !������������������������������ ����������������feast” as investor fashion dictates which exchange ��� ������������������������������������ or metals.
For these companies, AIM, ASX and TSX-V offer the combination of market knowledge and access to capital. As the resource companies evolve and grow into mid-cap mining companies, there is an opportunity to migrate the listing onto the main boards of LSE and TSX, or remain as listed on ASX.
Promote contract miningIn the last few years, India has largely focused only on coal and iron ore mining in the country. Currently, most of the mines under operation are the open cast mines as the country lacks technology and expertise required for underground mining. There is a need to attract foreign players in the form of ���������� ���������"�|���������������������other mineral resources, especially the underground ���������������������������������������������������� ���������������������������� �� ������������prices, moving exchange rates and increasing mining
Promote risk capital marketsThe establishment of a local risk capital market in ������!��! ���������������������������� ������the key to unlock the untapped potential of the country’s vast natural resources. The move will help encourage global mining companies to enter India’s resource exploration sector, as it will improve access to capital and also spread the risk involved in exploration undertakings.
��������������������������!�� �����������������#����������������������������������� ����miners who have traditionally taken up grassroots �������������������������!!����!�� ���� miners are usually constrained by the lack of adequate capital.
Indian capital markets have borne the brunt of a downtime in the last few months. However, even during the heydays of the Indian markets, the acceptability of mining exploration and resource companies was highly circumspect. There is hardly any pure exploration or mining player listed on BSE or NSE other than a handful of PSU companies.
Capital is a key ingredient for the progress and development of these mid-cap exploration and mining resource companies and in the current economic backdrop and state of Indian equity markets, the access to both debt and equity capital in India for these companies is rather limited.
Drawing a parallel from the oil and gas industry, �����!������ ����������!��������������had successful equity offerings and listings in overseas markets, particularly the AIM. Even an Indian mining company, Kolar Gold, successfully raised capital on AIM. We therefore believe some �!������������� ��������������������understanding, appreciation and deeper and more stable pools of capital for natural resources companies and therefore can provide better fund ����������� ������!��� �������������������������������!����������+�����!������� ��������� �����}������������������������������ ����������!������������������������������������~����tend to be very attractive for companies with global aspirations.
Exploring India: Mining the opportunities
36
Improve logistics and supply chain managementMining infrastructure development requires long-term planning with a special focus from the government. India ���������������������������������� ��������������mines, plants, railways and ports. To achieve this, the government can work with metal and mining companies on sharing models to achieve economies of scale.
Promote transparency in mining operations According to the Fraser Institute 2010–11 Survey, India is ranked very low on the “attractiveness of the government mining policies” and that is the reason ���������!���������������������������!����!���committing large capital to the Indian mining industry. India needs to present a more transparent picture of mineral tenement information, close to a real-time basis, for potential investors. A separate agency should report the progress and status of every mining lease provided in the country. It should be ensured that every ���������������������������������������������������at a particular interval and information is reported from the start of mining operations right to the mine-closing operations.
Minerals taxation reforms"������������� ����� �������������` ����������the US have successfully used tax policy initiatives to attract investors in mineral exploration business. As taxation reforms are under way in India, it is an opportunity for us to reform the minerals taxation system to include incentives/concessions to undertake exploration. The government should be investing in the development of the mining sector to expand the tax base, which creates a sustainable revenue stream for its ����������������������������
India is the only mining country, which does not allow the entire expenditure incurred on exploration and allows only that exploration expenditure, which is incurred four years prior to the year of commercial production. Considering an exploration period, including the mine construction period of approximately 8–10 years, such a restriction needs to be removed
costs, as a mine owner can choose a contract, ��������������������������������� ���������������the contract at a very short notice. Recently, some contract mining agreements have taken place in the coal sector, but such agreements need to be expanded aggressively to minerals such as diamond, gold and base metals.
Australia, the hub of contract mining activities, is at a much advanced stage in the exploration of these minerals. While giving lucrative contract mining propositions to the contract mining companies in Australia is a good way to proceed further in the ���������������������������������� ������� ��� ����������������������!�������������������������JVs will not only equip Indian players with foreign technologies, especially in underground mining, but will also help Indian workers to learn about the operations of heavy mining equipment.
Increase attractiveness of inbound mining servicesTo achieve sustainable growth in Indian mining sector, the government needs to promote the mining services in the region. It is essential to attract consulting geologists and exploration specialists as well as install assay laboratories. It will not only accelerate the minerals exploration process in the country, but will also help in reaching out to unexplored minerals.
Develop special purpose vehicles (SPVs)~������������������!�������������������companies in India are land acquisition, forest and environmental clearances. A nodal agency, in coordination with the Government of India and ����������������������������+j��!�������������������� ���~���+j������������������������clearances and link resources before inviting ���������������������������� �����%��������������The premium from the bidding can be partially used to develop local communities and create enabling infrastructure facilities for mining operations. The new MMDR act provides a base to facilitate the development of these SPVs.

Exploring India: Mining the opportunities
37
Choose strategic alliances ������������������ �����!���������������������������������� ��������� �������������������by choosing strategic alliances as an approach to partnership building in the mining sector in developing economies such as India. A co-operative model is evolving for sharing resources, capital and getting things done.
Build it togetherAs mining goes into new frontiers, farther and deeper, it is imperative to secure water, energy, technology inputs and build transportation and other infrastructure to get the minerals to market ��������������~����� ������ ���������!�������!�alliances between miners, infrastructure players, ����������������� ������� ����������������������� �������!�� �� ������������!������������������������������� ������������������%#�����equations for all partners.
Judicious resource nationalismThere is a perceptible wave of resource nationalism across developed and emerging countries �����������������!�����!��������������� ����boom in commodity prices has induced many governments to target the mining and metals sector for increasing their revenues. This has taken many forms. We recommend stakeholders in India should try and maximize value from natural resources by using regimes, which are predictable, prospective and sustainable in the long term. Policy frameworks, solely tailored to leading class deposits, may not help develop marginal deposits.
On the other hand, this may present an opportunity for India to keep its policy on mining relatively competitive, amid this environment, such that its mining sector attracts differentially higher interest from global investors.
immediately. Currently, even the expenditure incurred in the last four years is allowed as a deduction by spreading it over a period of 10 years. The advanced mining economies give an ��������������������������������������������������!�production. Such an option is given to the oil and gas industry as well under production sharing contracts.
A potential approach should include building in incentives via offsets for miners to construct water, energy or social infrastructure, which is not only �������������� ������ �����������������������the community.
Raise risk capital for exploration business The Government of India can also consider the launch of exploration bonds in lines of infrastructure bonds to create a central cash reserve, which can only be used for mining exploration in the country. All new companies or JVs formed in the exploration sector should be given some relaxation to get listed on the country’s stock exchanges. This ����������� � ����������!��������������������well as the exploration companies. For example, �!����������������������������������������������������������������������������������������� |it can be easily done through exchanges. It will not only heighten the interest of investors in the Indian exploration business, but will also enable the local public to understand the true value of underlying minerals.
Kolar Gold Mines recently got listed on AIM and has �����! ���!������������������������������� ���further exploration for new resources. It provides a new window or avenue to exploration companies, which are planning to enter India, but cannot ����������������������������������������!��������!�their operations.
In addition, further reforms such as allowing accelerated depreciation on exploration equipment and providing deemed taxation regime for mining service providers (as available to oil and gas service providers) will also promote mineral exploration in the country.

Exploring India: Mining the opportunities
38
{� “World Exploration Trends for the PDAC International Convention 2011,” Metals Economics Group website, www.metalseconomics.com/pdf/WET2011 (English).pdf, accessed 15 August 2011
{� Ministry of Mines annual report FY11{� Ministry of Mines annual report FY10{� “Mining Survey 2010–11,” Fraser Institute website,
http://www.fraserinstitute.org/uploadedFiles/fraser-ca/Content/research-news/research/publications/mining-survey-2010-2011.pdf, accessed 10 August 2011
{� “Global Exploration Trends: Implications for Investment in Latin Am,” Metals Economics Group website, http://www.metalseconomics.com/pdf/CESCO%20Exploration%20Forum%202008.pdf, accessed 10 August 2011
{� “World exploration trends 2011,” Metals Economic Group, http://www.metalseconomics.com/sites/��!� ��$���$ �����$j�¢$����\<<���������!��accessed 11 August 2011
{� �"������������"����`������������!������������Survey of India,” Press Information Bureau website, Government of India, http://pib.nic.in/newsite/erelease.aspx?relid=73274, accessed 11 August 2011
{� ������������+ �����!�������������������������achievements,” Steelguru website, http://www.����� ����$!~�j�¢$���j�¢$"��<"�@X$����������¥+ ���¥�!¥�����¥��������¥���¥����¥achievements.html, accessed 11 August 2011
{� “Overview of Mining and Mineral Industry in India,” International Institute for Environment and Development website, http://pubs.iied.org/pdfs/G00615.pdf, accessed 14 August 2011
{� “Mining and development,” World Bank website, http://siteresources.worldbank.org/INTOGMC/Resources/treasureortrouble.pdf, accessed 15 August 2011
{� “Good Governance and Transparency in the mining sector,” Geco Projects website, http://www.�������������$��!$���� ����¥ ����\>\=���!��accessed 16 August 2011
{� “Contribution of Informal Sector and Informal Employment in Indian Economy,“ Ministry of Statistics and Programme Implementation (MOSPI) website, http://www.mospi.gov.in/aloke_baskaran_7th.htm, accessed 17 August 2011
{� “A Guide to Investment in India’s Mineral Industry,” Federation of Indian Mineral Industries, http://www.fedmin.com/html/guidetoinvest.pdf, accessed 15 August 2011
{� Mineral Commodities Summaries 2011, U.S. Geological Survey
{� “Global diamond production rises 10.8% in 2010,” DNA - Daily News & Analysis, 5 August 2011, via Factiva, © 2011. Diligent Media Corporation Ltd.
{� Gem and Jewellery Export Promotion Council of India ����j�������������������������������<Q�` � ��2011
{� �j����� ������������������ ������������ �� ����Standard via Factiva, 14 March 2010
{� “Indian Bureau of Mines Yearbook 2009,” Indian Bureau of Mines Website, http://ibm.nic.in/imyb2009.htm, Advance release 2011, accessed 13 August 2011
{� World Silver Survey 2011, http://www.silverinstitute.org/supply_demand.php
�� International Lead and Zinc Study Group (ILZSG) website, www.ilzsg.org
{� Hindustan zinc annual report FY11{� Hindustan zinc annual report FY10{� Hindustan zinc annual report FY09{� Hindustan zinc annual report FY08{� Hindustan zinc annual report FY07{� Binani zinc annual report FY11{� Binani zinc annual report FY10{� Binani zinc annual report FY09{� Binani zinc annual report FY08{� Binani zinc annual report FY07{� “Metals,” Ministry of Mines, http://mines.nic.in/writer
eaddata%5CContentlinks%5C2fbc8760128a42838437e664ec215e30.pdf, accessed on 18 Aug 2011
Bibliography

Exploring India: Mining the opportunities
39
{� “Gold demand trends,” World Gold Council, November 2010
{� “Yellow Book,” Virtual Metal Group website, http://www.virtualmetals.co.uk/pdf/ABNYB0810.pdf, accessed 18 August 2011
{� Deccan Gold Mines 2010 annual report{� “A Precious Metals Chain,” Money Today, 1 May
2011, via Factiva, © 2011 Living Media India Ltd{� �*����!��������� ������������������������ The
Economic Times, 24 February 2011, via Factiva, © 2011 The Times of India Group. All rights reserved.
{� Gold demand trends 2007, World Gold Council{� Gold demand trends 2008, World Gold Council{� Gold demand trends 2009, World Gold Council{� Gold demand trends 2010, World Gold Council{� “Copper Market Outlook – Third Quarter 2011,”
RBC Capital Markets, 20 June 2011, via Thomson Research
{� “The Indian Copper Industry,” ICRA Management Consultancy Services Limited, August 2010, via Thomson Research
{� “Indian mineral sector and its export potential,” Occasional paper no. 122, EXIM bank of India
{� “National Mineral Policy,” Planning Commission website, December 2006
{� “Centre wants States to change mining exploration models,” Financial Chronicle, 24 June 2011, via Factiva
{� ��������������������#��� ���������������������explorationists,” Mineweb, 11 August 2011, via Factiva
{� “Global diamond production rises 10.8% in 2010,” DNA - Daily News & Analysis, 5 August 2011, via Factiva, © 2011. Diligent Media Corporation Ltd.
Exploring India: Mining the opportunities
40
Notes

Exploring India: Mining the opportunities
41
Notes

With a strong outlook in the sector, the global mining and metals industry is focused on future ��������� ��������������� ������������ ��������������!�������������!����������������optimization. The sector is also faced with the increased challenge of changing expectations in the maintenance of its social license to operate and meeting government revenue expectations.
Ernst & Young’s Global Mining & Metals Center brings together a worldwide team of professionals to help you achieve your potential – a team with deep technical experience in providing assurance, tax, transactions and advisory services to the mining and metals sector.
The Center is where people and ideas come together to help mining and metals companies meet the issues of today and anticipate those of tomorrow. Ultimately it enables us to help you meet your goals and compete more effectively. It’s how Ernst & Young makes a difference.
Ernst & Young’s Global Mining & Metals Center
Area contacts
Global Mining & Metals LeaderMike ElliottTel: +61 2 9248 [email protected]
OceaniaScott GrimleyTel: +61 3 9655 [email protected]
ChinaPeter MarkeyTel: +86 21 2228 2616 [email protected]
JapanKentaro NakamichiTel: + 81 3 5401 6407%��������%������¨���������
Europe, Middle East, India and Africa LeaderMick BardellaTel: +44 20 795 [email protected]
AfricaAdrian MacartneyTel: +27 11 772 [email protected]
Commonwealth ofIndependent StatesEvgeni KhrustalevTel: +7 495 648 [email protected]
France and LuxemburgChristian MionTel: +33 1 46 93 65 [email protected]
IndiaAnjani AgrawalTel: +91 982 061 4141�������������¨���������
United Kingdom & IrelandLee DownhamTel: +44 20 7951 [email protected]
Americas and United States LeaderAndy MillerTel: +1 314 290 [email protected]
CanadaTom WhelanTel: +1 604 891 [email protected]
South America and Brazil LeaderCarlos AssisTel: +55 21 2109 [email protected]
Service line contacts
Global Advisory LeaderPaul MitchellTel: +86 21 [email protected]
Global Assurance LeaderTom WhelanTel: +1 604 891 [email protected]
Global IFRS LeaderTracey WaringTel: +44 20 7980 [email protected]
Global Tax LeaderAndy MillerTel: +1 314 290 [email protected]
Global Transactions LeaderLee DownhamTel: +44 20 7951 [email protected]
About Ernst & Young
Ernst & Young is a global leader in assurance, tax, transaction and advisory services. Worldwide, our 141,000 people are united by our shared values and an unwavering commitment to quality. We make a difference by helping our people, our clients and our wider communities achieve their potential.
Ernst & Young refers to the global organization of member firms of Ernst & Young Global Limited, each of which is a separate legal entity. Ernst & Young Global Limited, a UK company limited by guarantee, does not provide services to clients. For more information about our organization, please visit www.ey.com
© 2011 EYGM Limited. All Rights Reserved.
OC00000136
This publication contains information in summary form and is therefore intended for general guidance only. It is not intended to be a substitute for detailed research or the exercise of ��!�������� ����������������ª�"�}�������������������member of the global Ernst & Young organization can accept any responsibility for loss occasioned to any person acting or refraining from action as a result of any material in this publication. On any specific matter, reference should be made to the appropriate advisor.
www.ey.com/miningmetals
Ernst & Young Pvt. Ltd.Assurance | Tax | Transactions | Advisory


