Exploring risk factors of non-adherence to immunosuppressive medication in kidney transplant recipients: improving methodology & reorienting research goals Inauguraldissertation zur Erlangung der Würde eines Doktors der Philosophie vorgelegt der Philosophisch-Naturwissenschaftliche Fakultät der Universität Basel von Kris Denhaerynck aus Waregem, Belgien Basel, 2006
Transcript
Exploring risk factors of non-adherence to immunosuppressive medication in
kidney transplant recipients: improving methodology & reorienting research goals
Inauguraldissertation
zur
Erlangung der Würde eines Doktors der Philosophie vorgelegt der
Philosophisch-Naturwissenschaftliche Fakultät der Universität Basel
von
Kris Denhaerynck
aus Waregem, Belgien
Basel, 2006
Dissertation committee:
Faculty responsible: Prof. Dr. M. Tanner, Swiss Tropical Institute, Basel Thesis advisor: Prof. Dr. S. De Geest, Institute of Nursing Science,
University of Basel Co-referee: Prof. Dr. M. T. Nolen, School of Nursing, Johns Hopkins University External expert: Prof. Dr. K. Dracup, School of Nursing, University of California at
San Fransisco Genehmigt von der Philosophisch-Naturwissenschaftlichen Fakultät auf Antrag von Prof. Dr. M. Tanner, Prof. Dr. S. De Geest, Prof. Dr. M. T. Nolen, und Prof. Dr. K. Dracup. Basel, den 04.07.2006
Prof. Dr. Wirz
Table of contents
TABLE OF CONTENTS
ACKNOWLEDGEMENTS 5 1. INTRODUCTION 7
1.1. ADHERENCE 7 1.2. ADHERENCE IN TRANSPLANTATION 7 1.3. MEASUREMENT OF NON-ADHERENCE 8 1.4. OUTLINE OF THE RESEARCH PROGRAM 9
2. PREVALENCE, CONSEQUENCES, AND DETERMINANTS OF NON-ADHERENCE IN ADULT RENAL TRANSPLANT PATIENTS, A LITERATURE REVIEW 13
2.1. INTRODUCTION 14 2.2. THE BEHAVIORAL DIMENSION OF KIDNEY TRANSPLANTATION 14 2.3. PREVALENCE OF NON-ADHERENCE 15 2.4. CONSEQUENCES OF NON-ADHERENCE 15
2.5. DETERMINANTS OF NON-ADHERENCE 25 2.5.1. Socio-economic factors 26 2.5.2. Patient-related factors 26 2.5.3. Condition- or disease-related factors 26 2.5.4. Therapy- or treatment-related factors 27 2.5.5. Health care system- and health care team-related factors 27
2.6. RECOMMENDATIONS FOR FUTURE RESEARCH 35 2.7. CONCLUSION 35
3. IS ELECTRONIC MEDICATION MONITORING THE GOLD STANDARD FOR ADHERENCE MEASUREMENT? A TEST OF ITS ASSUMPTIONS 41
4. PREVALENCE AND RISK FACTORS OF NON-ADHERENCE WITH IMMUNOSUPPRESSIVE MEDICATION IN KIDNEY TRANSPLANT PATIENTS 59
4.1. INTRODUCTION 60 4.2. METHODOLOGY 61
4.2.1. Design, sample and setting 61 4.2.2. Variables and measurement 61 4.2.3. Data collection 64 4.2.4. Statistical analysis 64
4.3. RESULTS 65 4.3.1. Sample characteristics 65 4.3.2. Prevalence of (non-)adherence 66 4.3.3. Risk factors of (non-)adherence 66
4.4. DISCUSSION 70
Table of contents
5. NON-ADHERENCE WITH IMMUNOSUPPRESSIVE DRUGS IS HIGHER IN NORTH AMERICAN COMPARED TO EUROPEAN RENAL TRANSPLANT PATIENTS 77
5.1. INTRODUCTION 78 5.2. METHODOLOGY 79
5.2.1. Design and sample 79 5.2.2. Variables and measurement methods 80 5.2.3. Data collection 80 5.2.4. Data analysis 81
5.3. RESULTS 81 5.3.1. Demographic and clinical characteristics in European and U.S. samples 81 5.3.2. Non-adherence in European compared to U.S. patients 81 5.3.3. Comparison of non-adherence among European renal transplant patients 83
5.4. DISCUSSION 84 5.5. LIMITATIONS OF THE STUDY 85 5.6. CONCLUSION 87
6. GRAND DISCUSSION 91 6.1. MAIN CONSIDERATIONS 91 6.2. INTERVENTION RESEARCH 96 6.3. ELECTRONIC MEDICATION MONITORING 96 6.4. FINAL SUMMARY 97
7. APPENDIX 1: VALIDATION OF THE RANDOM-EFFECTS MODEL 101 7.1. OVERDISPERSION 101 7.2. SERIAL DEPENDENCY 101
8. EXECUTIVE SUMMARY 103 8.1. BACKGROUND AND AIM OF THE RESEARCH PROGRAM 103 8.2. METHODS 103
8.2.1. Prevalence and risk factors of non-adherence 103 8.2.2. Validation of EM assessment 104
8.3. RESULTS 104 8.4. CONCLUSIONS 105
9. CURRICULUM VITAE 106 10. LIST OF PUBLICATIONS 107
10.1. PEER REVIEWED 107 10.2. SUBMITTED 107 10.3. CHAPTERS 108 10.4. ABSTRACTS PUBLISHED IN INTERNATIONAL LITERATURE 108
Lau-out
Acknowledgements
5
ACKNOWLEDGEMENTS
I would like to express my gratitude to the many people who supported me in completing this dissertation. My gratitude goes in the first place to my supervisor, Prof. Dr. Sabina De Geest. I could not have imagined a better advisor and mentor for my PhD. We already fruitfully collaborated since my days as a Master’s student at the K.U.Leuven in Belgium. This collaboration reaches a provisional height with the finalization of this dissertation. I also thank Prof. Dr. Marcel Tanner of the Swiss Tropical Institute for accepting me as a doctoral student in the PhD program of epidemiology. I am also indebted to Prof. Dr. Marie Nolan of Johns Hopkins University (Baltimore, USA) and Prof. Dr. Kathy Dracup of UCSF (San Francisco, USA) for their willingness to be part of my dissertation committee. This work would not have been possible without the most valued collaboration with the Renal Transplant Program of the University Hospital of Basel and the Kantonsspital of Aarau. I therefore thank wholeheartedly Prof Dr. J. Steiger, Prof. Dr. Andreas Bock, Dr. Michael Dickenmann, Nicole Thannberger, Suzanne Köfer, and Dr. Stefan Schaub and other team members for their support during my dissertation. Thanks also to the Swiss National Science Foundation who funded the SMART study of which this dissertation is a part. Special expressions of appreciation go to the members of our Leuven-Basel Compliance Research Group led by Prof. Dr. S. De Geest. Sincere thanks to Petra Schäfer-Keller, Dr. Fabienne Dobbels, Ariane Desmyttere, and Gerda Drent, for the stimulating discussions of my research findings and their peer support over the past years. Sincere gratitude also goes to Dr. Jim Young of the BICE who advised me on statistical issues while he was in Basel or afterwards from New Zealand. I am also indebted to Prof. Dr. I. Abraham of Matrix45 for his help in editing the final sections of my dissertation. Ein besonderer Dank gilt den vielen Kollegen und Kolleginnen des Instituts für Pflegewissenschaft der Universität Basel und der Abteilung Klinische Pflegewissenschaft des Universitätsspitals Basel. Die Zusammenarbeit mit ihnen hat mir viel Freude bereitet. Ich hoffe dass meinen Umzug von Leuven nach Basel dem Institut von Nutzen gewesen ist und in die Zukunft noch immer sein wird. Denn die Entwicklung der Pflegewissenschaft an der Universität Basel liegt mir am Herzen. Ik wens ook mijn vroegere collega’s aan de universiteit van Leuven met wie ik nauw heb samengewerkt en samenwerk welgemeend te bedanken: Prof. Dr. Bernadette Dierckx de Casterlé, Prof. Dr. Koen Milisen, Prof. Dr. Philip Moons, Els Steeman, Prof. Dr. Geert Verbeke, Prof. Dr. Emmanuel Lesaffre, Stephen Fieuws, Dr. Irina Cleemput en Prof. Dr. Frank Buntinx. De kansen, ondersteuning en inspiratie die ik van de Leuvens collega’s heb gekregen als assistent aan de KU-Leuven hebben me een stabiele basis gegeven om aan dit doctoraat te beginnen. Dank ook aan de overige Leuvense collega’s waarmee ik nauwe collegiale banden heb die ik steeds zeer op prijs heb gesteld. ‘k Zoe uak nog willen min liefke (x) en min familie bedanken vaneigen, plus min zuster omda ze mij g’holpen ee mee den ipmok van deesten bouk. ’t En zal veur de achterblijvers wel nie altijd gemakkelijk geweest zin da ‘k ip nen blauwe moandag al min ne kiër min teetebose gepakt ee en ‘t angezet benne noar ’t land van melk en ziëm (of koas en chokla, gelijk da je ‘t wilt). M’ en zin nog nie van alkoar vervrend en me ‘n goan dat uak nie loaten gebeuren.
6
“In general, the benefits of proven medical therapies are available only to patients who actually use them.”
Richard Kravitz
Introduction
7
1. INTRODUCTION
1.1. Adherence
Chronic diseases, defined as diseases with a long, indefinite duration and little prospect of immediate change, are considered to be a major future health care challenge 1. Having a chronic disease often implies life-long therapy in order to prevent or delay progression of the disease. Obviously, the effectiveness of therapies depends on patients’ level of adherence. Adherence to the therapy is therefore a cornerstone requirement of successful chronic illness management 2.
Adherence (also called compliance or concordance) can be defined as « the extent to which a person’s behaviour – taking medication, following a diet, and/or executing lifestyle changes, corresponds with agreed recommendations from a health care provider » 3. It « is a behavioral process, strongly influenced by the environment in which the patient lives, including the health care practices and systems. Adherence assumes that a patient has the knowledge, motivation, skills and resources required to follow the recommendations of a health care professional.» 4
1.2. Adherence in transplantation
Solid organ transplant recipients are chronically ill patients, because the transplantation did not fully eliminate the need for medical treatment. Recipients have to adhere to a life long medication regimen that prevents the immune system from rejecting the transplant and manages emerging co-morbidities 5 6 7. Reduceing the risk for rejection requires a high degree of adherence to the prescribed immunosuppressive. However, despite the dangers related to imperfect adherence, previous research has shown that a substantial proportion of solid organ recipients fail to take their immunosuppressives as prescribed. An estimated 20 to 25% of the adult heart, liver and renal transplant patients are non-adherent to their immunosuppressive therapy 7. Non-adherence is expected to cause 20% to 90% of late acute rejections and 16% to 23% of graft losses in solid organ transplant recipients 7. Furthermore, the non-adherence problem is expected to be one of the causes for yet unexplained but observed stagnation in long-term kidney graft survival 8. Economic consequences are a higher cost per quality adjusted life year 9.
Improving outcomes in solid organ transplantation is considered to be one of the main goals in transplant research and clinical management of transplant patients for the upcoming years 10. A possible strategy to reach that goal is to enhance adherence in patients. A prerequisite to enhancing adherence is that patients at risk for non-adherence can be identified, which implies that studies are needed that unveil risk factors of adherence behavior. Risk factors for non-adherence are manifold. In 2003, the WHO published a taxonomy of risk factors of non-adherence (see figure) 3. Risk factors in this model can be socio-economic, therapy-, patient-, condition-, and health care system- or health care worker-related. Adherence research has primarily focused on socio-economic, patient-, condition- and treatment-related factors. The WHO framework aims at directing attention to risk factors from all adherence-determining dimensions including health care related factors 3. As the main aim of this research program is to investigate risk factors for non-adherence to immunosuppressive drugs
Introduction
8
in kidney transplant patients, the WHO model will be used as a guiding framework in this dissertation.
Fig. 3. WHO framework: the five dimensions of non-adherence
1.3. Measurement of non-adherence
A prerequisite for quantitatively investigating adherence behavior is that adherence can be assessed in a valid way. Unbiased methods are needed that capture non-adherence in its sub-clinical stage (i.e. before recurrent rejections or graft loss suggest non-adherent behavior). Several measurement methods exist, recently concisely discussed in a review article published in the New England Journal of Medicine 11. Measurement methods relevant for solid organ transplantation can be divided into two groups: direct or indirect measures.
Direct measures, i.e. observation of medication intake and biological assay of drug levels or drug metabolites in the blood or urine, permit examining actual drug ingestion 11 12. Observation is a very labor-intensive method, not feasible in non-clinical settings, and thus not very common in transplantation research. Blood assay on the other hand is used more frequently in routine clinical practice to assess levels of immunosuppressive. A disadvantage of assay is that it does not capture intake dynamics and that “white coat-compliance”, referring to patients taking their medication before a clinic visit in which a blood sample will be taken, may bias the results.
Indirect measures do not prove actual intake of the medication; rather, they estimate how much patients could have ingested based on information coming from patient self-reports or diaries, collateral reports from family members or clinicians, rates of prescription refills, pill counts, or electronic monitoring (EM). The advantage of most of these indirect methods (except for EM) is that they are relatively easy to use, often at the expense of a lower sensitivity or validity 11 12. This, however, does not apply to EM 13 14. EM is a technologically advanced method, which relies on microprocessor equipped pill packages or bottles that register their opening times to assess adherence behavior. EM is today’s most sensitive adherence measure 15. It measures adherence
Introduction
9
with great resolution, and unveils not only the taking dimension but also the temporal dynamics of medication taking. For research purposes, EM became the assessment method of choice over the last years. This does not mean, however, that EM is the perfect method. Despite its nice diagnostic properties, many researchers are reluctant to declare EM the gold standard method in adherence research, as EM’s alleged superiority has not really been thoroughly substantiated in research yet 11. In an recent editorial contribution elaborating on the validity of non-adherence measurement methods, DiMatteo, an authority in the area of adherence, therefore included EM among the methods that need to be scrutinized in future research: “To obtain a firmer grip on the best measurement methodologies, it will be necessary to compile and assess the value, appropriateness, reliability, and validity of a wide range of possible measurement strategies. […] Our findings about the prevalence, correlates, and consequences of nonadherence will always be tied to the methods we use, so we must understand them better.” “Research is needed that carefully examines measurement and methodology issues, including numerous adherence measurement strategies such as […] electronic monitoring.” 16
Because the main study of this dissertation will use EM as a measurement method for non-adherence, we will comply with DiMatteo’s call by including a section on validity of EM measurement.
1.4. Outline of the research program
This dissertation consists of four chapters, of which the first two prepare the reader for the two main risk factor studies described in the last two chapters.
The literature review presented in chapter one summarizes the evidence on the prevalence, determinants, clinical and economic consequences of non-adherence with immunosuppressive drugs in renal transplant patients. A literature search, which yielded 38 articles was used to calculate 1) weighted mean prevalences of non-adherence and 2) weighted mean prevalences of rejection episodes or graft losses that can be attributed to non-adherence. In addition, economic consequences of non-adherence will be reviewed. Investigated risk factors of non-adherence will be summarized using the WHO framework, and suggestions are made for further research.
Chapter two summarizes existing knowledge about the validity of electronic medication monitoring. A framework systematizing sources of bias in EM assessment is presented. The framework discerns internal and external assumptions underlying unbiased EM measurement. Internal validity assumptions presuppose (1) correct functioning of the EM equipment, (2) correspondance between EM-bottle openings and actual intake of the prescribed doses, and (3) absense of influence of EM on a patient’s normal adherence behavior. External validity refers to EM biasing the representativeness of the sample. The four validity assumptions were tested using data from the Supporting Medication Adherence in Renal Transplantation (SMART) study, which included 250 adult renal transplant patients whose adherence to immunosuppressive drugs was measured over a 3-month period by EM 17.
Chapter three is a prospective study assessing prevalence and risk factors of non-adherence, using SMART study data. Adherence was measured by EM in 250 adult renal transplant patients. A number of selected socio-economic, therapy-, patient-, condition- and health care team-related risk factors were explored for association to
Introduction
10
non-adherence. Longitudinal analysis techniques were used that allowed including time-varying covariables and fitting multivariable models.
Chapter four addresses an underinvestigated area in risk factor research, i.e. health care team-related risk factors. More specifically, the study explored the relationship between the health care system and prevalence of self-reported non-adherence with immunosuppressives by focusing on variations in non-adherence prevalences between European and North American renal transplant patients. The study used methods of meta-analysis on individual patient data, combining three independent cross-sectional studies of comparable methodology that included patients from the US (N=1563) 18, the Netherlands (N=85), Belgium (N=187) 19 and Switzerland (n=342) 17.
Reference list 1. Innovative Care for Chronic Conditions: Building Blocks for Action. Geneva: World Health
Organization, 2002. 2. DiMatteo MR, Giordani PJ, Lepper HS, Croghan TW. Patient adherence and medical
treatment outcomes: a meta-analysis. Med Care 2002;40(9):794-811. 3. Sabaté E. Adherence to long-term therapies: Evidence for action. Geneva: World Health
Organisation, 2003. 4. Miller NH, Hill M, Kottke T, Ockene IS. The multilevel compliance challenge:
recommendations for a call to action. A statement for healthcare professionals. Circulation 1997;95(4):1085-90.
5. De Geest S, Dobbels F, Fluri C, Paris W, Troosters T. Adherence to the therapeutic regimen in heart, lung, and heart-lung transplant recipients. J Cardiovasc Nurs 2005;20(5 Suppl):S88-98.
6. Denhaerynck K, Abraham I, Gourley G, Drent G, De Vleeschouwer P, Papajcik D, et al. Validity testing of the Long-Term Medication Behavior Self-Efficacy Scale. J Nurs Meas 2003;11(3):267-82.
7. Desmyttere A, Dobbels F, Cleemput I, De Geest S. Noncompliance with immunosuppressive regimen in organ transplantation: is it worth worrying about? Acta Gastroenterol Belg 2005;68(3):347-52.
8. Rosenberger J, Geckova AM, van Dijk JP, Nagyova I, Roland R, van den Heuvel WJ, et al. Prevalence and characteristics of noncompliant behaviour and its risk factors in kidney transplant recipients. Transpl Int 2005;18(9):1072-8.
9. Cleemput I, Kesteloot K, Vanrenterghem Y, De Geest S. The economic implications of non-adherence after renal transplantation. Pharmacoeconomics 2004;22(18):1217-34.
10. Pascual M, Theruvath T, Kawai T, Tolkoff-Rubin N, Cosimi AB. Strategies to improve long-term outcomes after renal transplantation. N Engl J Med 2002;346(8):580-90.
11. Osterberg L, Blaschke T. Adherence to medication. N Engl J Med 2005;353(5):487-97. 12. De Geest S, Abraham I, Dunbar-Jacob J. Measuring transplant patients' compliance with
immunosuppressive therapy. West J Nurs Res 1996;18(5):595-605. 13. Burke LE. Electronic measurement. In: Burke LE, Ockene IS, editors. Compliance in Healthcare and Research. Armonk: Futura Publishing Co., 2001:117-138.
14. Dunbar-Jacob. Electronic Methods in Assessing Adherence to Medical Regimens. In: Krantz D, Braun A, editors. Technology and Methods in Behavioral Medicine, 1998:95-113.
15. Liu H, Golin CE, Miller LG, Hays RD, Beck CK, Sanandaji S, et al. A comparison study of multiple measures of adherence to HIV protease inhibitors. Ann Intern Med 2001;134(10):968-77.
16. DiMatteo MR, Haskard KB. Further challenges in adherence research: measurements, methodologies, and mental health care. Med Care 2006;44(4):297-9.
17. De Geest S, Schäfer P, Denhaerynck K, Bock A, Steiger J. Supporting medication adherence in renal transplantation (SMART): a randomized controlled trial to improve adherence with the immunosuppressive regimen. Transplant International 2005;18(S.1):183.
Introduction
11
18. Greenstein S, Siegal B. Compliance and noncompliance in patients with a functioning renal transplant: a multicenter study. Transplantation 1998;66(12):1718-26.
19. Moons P, Vanrenterghem Y, Van Hooff JP, Squifflet JP, Margodt D, Mullens M, et al. Health-related quality of life and symptom experience in tacrolimus-based regimens after renal transplantation: a multicentre study. Transpl Int 2003;16(9):653-64.
Literature review: prevalence, consequences and determinants
13
2. PREVALENCE, CONSEQUENCES, AND DETERMINANTS OF NON-ADHERENCE IN ADULT RENAL TRANSPLANT PATIENTS, A LITERATURE REVIEW
Kris Denhaerynck, Fabienne Dobbels, Irina Cleemput, Ariane Desmyttere, Petra Schäfer-Keller, Stefan Schaub, Sabina De Geest Published in: Transplant International 2005; 18(10):1121-1133.
Literature review: prevalence, consequences and determinants
14
2.1. Introduction
Despite the introduction of powerful immunosuppressive agents and a continuous decrease of acute rejection episodes over the last decades, recent data show that long-term renal allograft survival only marginally improved. Indeed, graft survival in first transplants only increased by a mere 5 months between 1988 and 1995 1. In addition, overall graft survival remained at the same level between 1995 and 2000 2. This suggests that current therapeutic interventions do not efficiently prevent the development of chronic allograft nephropathy, which accounts for 40-50% of late allograft losses 3. Chronic allograft nephropathy is the consequence of any immunological (i.e. clinical or subclinical allograft rejection) or non-immunological injury (e.g. calcineurin-inhibitor nephrotoxicity, hypertension, infections) to the renal allograft. The immunosuppressive therapy, which should be adapted to the needs of every patient, balances the risks for rejection and over-immunosuppression.
Non-adherence with the immunosuppressive therapy is a behavioral factor that also needs to be scrutinized. Although non-adherence is regarded as one of the major causes of late renal allograft failure 4, due to variability in exposure of the kidney to immunosuppressives 5-9, or simply by a discontinuation of drug intake 10 11, it only receives limited attention when discussing the etiology of graft loss in the literature 3 12
13. Understanding the behavioral dimension of transplant patients’ management in view of prevalence, consequences and determinants of non-adherence with immunosuppressive drugs is a prerequisite for targeting non-adherence as a potential modifiable risk factor for poor outcome. The goal of this literature review is therefore to summarize the existing evidence on non-adherence with the immunosuppressive therapy in adult renal transplant recipients, more specifically to summarize and discuss: 1) measurement methods for assessing non-adherence, 2) prevalence, 3) clinical as well as economical consequences, and 4) determinants of non-adherence.
2.2. The behavioral dimension of kidney transplantation
The therapeutic regimen of renal transplant recipients consists of medication taking, infection prevention, smoking cessation, clinic visit attendance, and of following guidelines concerning alcohol intake, diet and exercise. “Adherence”, a key component of the behavioral dimension of transplant patient’s therapeutic regimen, also called “compliance” or “concordance”, refers to “the extent to which a person’s behaviour – taking medication, following a diet, and/or executing lifestyle changes, corresponds with the agreed recommendations from a health care provider” 14.
Adherence with the immunosuppressive regimen can be measured by various direct and indirect methods. Direct methods refer to observation and assay of medications or medication by-products. Indirect methods include self-report, pill count, prescription refills, collateral report, clinical outcome, and electronic monitoring (EM). EM refers to a pill bottle that contains a microprocessor fitted cap to save the date and time of each opening 15. Despite the fact that the registration of a pill box opening does not prove ingestion, EM shows superior sensitivity compared to other methods, as shown in cross-validation studies 16. Moreover, EM allows assessing non-adherence as a continuous variable in a multidimensional manner (i.e. the taking and timing dimension of medication taking). Self-report often results in underreporting of non-adherence 16
17. Assay, despite being a direct method, only allows determining medication intake over a limited time period, depending on the half-life of the drug. Also, “white coat
Literature review: prevalence, consequences and determinants
15
adherence”, referring to patient’s correct intake in the light of a pending clinic visit, might further distort interpretation of therapeutic blood levels 18.
We screened abstracts from the database of Medline, Cinahl and Psycinfo (1988-2004) for English, Dutch, French or German studies focusing on prevalence, determinants and consequences of non-adherence with immunosuppressive drugs in non-pediatric renal transplant patients, using the following keywords: (kidney or renal) and transplan* and (adheren* or complian* or nonadheren* or noncomplian*). The Medline search yielded 569 abstracts, of which 34 focused on prevalence and/or consequences and/or determinants of nonadherence. Exploration of the reference lists yielded another four articles. The Cinahl and Psycinfo databases did not provide extra studies.
2.3. Prevalence of non-adherence
Seventeen studies reported on prevalence of non-adherence with immunosuppressive drugs in kidney transplantation (Table 1). The prevalences of non-adherence varied widely, ranging from 2% to 67%, depending on the used operational definitions, case finding and measurement methods. A weighted mean prevalence, calculated over all studies that measured non-adherence by self-report, was 27.7% (n=10). One study, the only one measuring non-adherence by medical chart review, found a very low non-adherence prevalence of 2%. Given the higher prevalences in other studies, chart review seems to lack sensitivity in capturing non-adherence 19. The fact that non-adherence is not assessed as a standard clinical parameter in most transplant programs may explain this low percentage.
Two studies provided electronically monitored period prevalence estimates of non-adherence, using adherence parameters that express the taking and timing dimension of non-adherence 20 21. Although no clinical meaningful cut-off to classify patients in adherers and non-adherers in the renal transplant population has been developed so far, these studies considered patients as being non-adherent if they had taken less than 90% of the prescribed doses, resulting in a 26% 21 and 20% 20 non-adherence prevalence. Future studies should define cut-off values, indicating which level of non-adherence results in late acute rejection or graft loss. Research in the heart transplant population already showed that minor deviations from dosing schedule were associated with late acute rejections (> 1 year after transplantation) 22.
This evidence about the prevalence of non-adherence with immunosuppressive regimen in renal transplantation indicates the widespread nature of the problem. To better understand the relevance of non-adherence, its relation with poor outcomes (e.g. acute rejection episodes and allograft loss) needs to be explored.
2.4. Consequences of non-adherence
Consequences of non-adherence can be categorized in clinical and economic consequences. Clinical consequences can be examined by assessing the effect of subclinical non-adherence on clinical outcomes, or by retrospectively looking for causes of acute rejections or graft losses.
Table 1: Studies estimating the prevalence of non-adherence with immunosuppressive medication in renal transplant recipients
Study Description of the Sample N Non-adherence conceptualization and measurement Prevalence of non-adherence
Butler et al. 2004 21 RTX recipients > 18 years old, ≥ 6 months post-transplant; on Pred; UK
60 Electronic monitoring during 6 weeks 1) Missed at least 20% of the prescribed doses 2) Missed at least 10% of the prescribed doses
1) 12% 2) 26%
Ghods et al. 2003 24 RTX recipients > 1 year post-transplant; 95% on CyA (+ sometimes MMF), 5% are on AZA/Pred; Iran
267 Self-report: missing ≥ 3 doses per month 21=7.9%
Vasquez et al. 2003 25 Adult RTX recipients with functioning graft; on CyA and MMF; US
95 1) Self-report: missed dose since the last visit or in the week prior to receipt of the study survey 2) Assay: 3 successive CyA < 50 ng/ ml or FK < 5ng/ml in the absence of CNI metabolism affecting drugs, or absorption problems
1) 44=46.3% 2) 16=16.8% Total: 52=55%
Nevins et al. 2001 20 Newly transplanted RTX recipients, transplanted between 1993 and 1995; on AZA; US
134 Electronic monitoring during 6 months after discharge 1) Average percentage of correctly dosed days 2) Percentage taking less than 90% of the prescribed doses
1) 88.1% 2) 20%
Butkus et al. 2001 26 RTX recipients, RTX between 1992 and 1997; US 128 Not stated 11=9% Chisholm et al. 2000 66RTX recipients > 18 years old, 8-12 months post-
transplant, receiving immunosuppressives at no cost, RTX between 1997 and 1998; patients on CNI; US
18 Refill record count: non-adherence if < 80% of prescribed medication refilled
12=66.7%
Teixeira de Barros et al. 2000 56
RTX recipients transplanted between 1995-1997; Portugal
113 Six 4-monthly self-report evaluations in 2 years period: admission ≥ 2 evaluations to having skipped a dose or to having deviated >2.5 hours from the prescribed dosage schedule
18=16.8%
Raiz et al. 1999 57 RTX recipients > 18 years old, first transplants, with functioning graft > 12 months post-transplant; transplanted between 1985 and 1994; US
357 Self-report: not taking medications like instructed less than once a week or more
32.5%
Greenstein & Siegal 1998 58
RTX recipients >18 years old, with functioning graft; on CNI; 56 centers in the US
1402 Self-report: having missed ≥ 1 doses of immunosuppressive medication in the previous 4 weeks
314=22.4%
Study Description of the Sample N Non-adherence conceptualization and measurement Prevalence of non-adherence
Siegal & Greenstein 1997 59
RTX recipients > 18 years old, with functioning graft, on CyA, 5 centers, US
519 Self-report: having missed ≥ 1 doses of immunosuppressive medication in the previous 4 weeks
69=18%
De Geest et al. 1995 31
RTX recipients > 18 years old, at least 1 year post-transplant, Dutch speaking; on CyA; Belgium
148 Self-report 22.3%
Frazier et al. 1994 61 RTX recipients, transplanted between 1987 & 1990; US
241 Self-report: 11 items scale measuring medication non-adherence, defined as missing a dose at least “sometimes”
45%
Sketris et al. 1994 60 RTX recipients on CyA; sampled from 2 centers in Canada
361 Self-report: admission of at least one of the criteria: - taking a smaller or larger dose > once per week - taking > 2 hours before/after the indicated time > once per week - not taking a dose > once per month
65%
Kalil et al. 1992 19 RTX recipients > 1st year post-transplant, transplanted between 1976-1982; on AZA/Pred; US
202 Medication non-adherence reported in the medical chart 4=2%
Butkus et al. 1992 34 1st cadaveric RTX recipients, transplanted between 1985-1991; on CyA; US
100 Composite measure: ≥ 3 consecutive missed clinic visits, immeasurable blood CyA on 2 consecutive visits in the absence of another explanation, or leaving hospital against advice
10=10%
Rovelli et al. 1989 51 RTX recipients > 3 months post-transplant, experiencing no rejection < 3 m; transplanted between 1971-1984; US
260 Medical record report of: 1. Appointment non-adherence 2. Medication non-adherence: admission of patients/family
47=18%
Same inclusion criteria, but transplanted after 1984. Patients also received adherence enhancing education before transplantation
196 Medical record report of: 1. Appointment non-adherence 2. Medication non-adherence: admission of patients/family
30=15%
Didlake et al. 1988 49 RTX recipients, RTX between 1982-1986; on CyA; US
185 Self-report: omitting ≥ 1 dose per month 36=19.5%
Literature review: prevalence, consequences and determinants
18
2.4.1. Clinical consequences
Fifteen studies examined the association between subclinical non-adherence and clinical outcome 19 20 23-34. Three prospective cohort studies 20 23 32, one of which measured non-adherence electronically 20, demonstrated that non-adherence is a risk factor for late acute rejection and late graft loss (Table 2). These studies only took into account acute rejection and graft loss events if occurring after 3 months 20 32 or 1 year post-transplant 23. Ten retrospective cohort studies, admittedly a weaker design, further confirmed the relationship between (late) acute rejection 24 25 29-31, graft loss/graft survival 19 26 28-30 34, patient survival 31, and graft dysfunction (defined as serum creatinine being ≥ 5mg/dl) 24. Two retrospective studies focusing on the relationship between non-adherence and chronic allograft nephropathy failed to find a direct link 31 35. However, it is worth noting that acute allograft rejection is the major risk factor for developing chronic allograft nephropathy 36 37. Given that non-adherence substantially contributes to late acute rejection 37, an indirect link between non-adherence and chronic allograft nephropathy can be suggested.
Eighteen studies estimated the contribution of non-adherence in the etiology of graft losses and acute rejections, attributing up to 64% of the graft failures 27 28 34 38-49 and 80% of the late acute rejections to non-adherence 50 51, depending on case finding and measurement methods. Averaging these percentages by a weighted mean over the publications that met the methodological requirement of having formally assessed non-adherence, resulted in an estimated contribution of non-adherence to graft losses of 16.3% for graft losses (n=8), and to late acute rejections of 19.9% (n=3) (Table 3).
These percentages probably underestimate the contribution of non-adherence in poor clinical outcome, as assessment of non-adherence in clinical practice rarely occurs in a routine and standardized way. Illustrative in this regard are the results of a study in a single heart transplant center that initially reported to the “United Network for Organ Sharing” database that non-adherence was the etiological factor in 2% of graft losses. Detailed reevaluation revealed that actually 13% of the graft losses were related to non-adherence 52. Given the contribution of non-adherence to the development of acute rejection and graft loss, it should be worthwhile to integrate a routine and standardized measurement of non-adherence in transplant registries or large outcome studies. Currently, categories such as “acute rejection” or “chronic allograft nephropathy” mask non-adherence, resulting in underreporting of non-adherence as an important contributor to poor outcome 28.
Also, since most studies assessing the relationship between non-adherence and outcome include patients on older immunosuppressants (e.g. azathioprine, cyclosporine), priority should be given in future research to assess if the found associations also apply for newer immunosuppressive regimens (e.g. tacrolimus, sirolimus, mycophenolate).
Table 2: Studies testing the clinical consequences of non-adherence with immunosuppressive medication in renal transplant recipients
Study Description of the sample N Design Non-adherence concept-ualization and measurement
Outcome Analysis Results: consequences of non-adherence
Vlaminck et al. 2004 23
RTX recipients that were > 18 years, at least 1 year post- transplant, Dutch speaking; Belgium; on CyA
146 Prospective cohort study
Self-reported NA measured at inclusion, defined as having regular dose omissions in the past 1 year
Late acute rejection (biopsy proven)
Cox regression controlling for other influences
Rejection-free time is shorter in non-adherent than in adherent recipients (p=0.04)
Graft function Mixed model
A significantly higher increase in serum creatinine in adherent patients after RTX (p<.001)
Ghods et al. 2003 24
RTX recipients > 1 year post-transplant (data gathering in 2001-2002); 95% on CyA, 5% on AZA/Pred; Iran
267 Retrospective cohort study
Self-report: missing ≥ 3 doses per month. If nonconsecutive: minor NA, if consecutive: major NA
Late acute rejection Not mentioned
Higher number of acute rejections in non-adherers (p<.001)
Graft dysfunction (serum creatinine ≥ 5mg/dl)
Not mentioned
More graft dysfunction in non-adherers (p<.01)
Vasquez et al. 2003 25
Adult RTX recipients with functioning graft; on CyA & MMF; US
95 Retrospective cohort study
1. Self-report: a missed a dose since the last visit or in the week prior to receipt of the study survey 2. Assay: 3 successive CyA blood levels < 50 ng/ ml or FK < 5ng/ml in absence of CNI metabolism affecting drugs, or absorption problems
Acute rejection Logistic regression
More chance on experiencing acute rejection if non-adherent (p<.001)
Butkus et al. 2001 26
RTX recipients; transplanted between 1992 and 1997, US
128 Retrospective cohort study
No operationalization given Graft survival Kaplan Meier
Shorter survival in grafts of non-adherent recipients (p<.0001)
Nevins et al. 2001
RTX recipients, > 90 days after transplantation
134 Prospective cohort study
Electronic monitoring Late acute rejection (clinical diagnosis or
Kaplan Meier
Rejection-free survival is longer in adherent patients
Study Description of the sample N Design Non-adherence concept-ualization and measurement
Outcome Analysis Results: consequences of non-adherence
20 discharge, independent medication management; 1993-1995; on AZA; US
biopsy proven)
(p=.006)
Graft survival (all deaths counted as graft loss)
Kaplan Meier
More graft loss in non-adherent patients (p<.002)
Patient survival / Death occurred to infrequently to perform tests
Papajcik et al. 1999 35
1. RTX with functioning graft ≥1y post transplant, with biopsy confirmed chronic rejection; transplanted between 1987-1994 2. Matched group without chronic rejection
77 + 49
Case-control study
Missing ≥ 1 of the following tasks ≥ 5 times per year for ≥ 2 consecutive years: 1. Having lab tests done 2. Attending follow-up appointments 3. Taking immunosuppressives
Chronic rejection Chi²-test No adherence-difference found between the chronic rejection (12% AH) and the non-chronic rejection group (23% AH) (p=.11)
Late graft survival Kaplan Meier
No significant difference found (p=.31)
Isaacs et al. 1999 27
RTX living related donor transplants between 1988-1994; multi-center study on a registry of all patients in the US
10865 Retrospective cohort study
No operationalization given Graft survival Cox-regression
No significant relationship found
Gaston et al. 1999 28
Kidney & kidney-pancreas transplantation with graft loss due to chronic rejection beyond 6 months transplanted between 1992 & 1995, on CyA
1150 Retrospective cohort study
Two of the following criteria: 1) admission of non-adherence by the patient, documented in medical record; 2) Failure to keep scheduled appointments; 3) Undetectable CyA levels on > 1 occasion (if no instruction to withhold CyA)
Late graft loss Not mentioned
Graft loss occurred earlier in NA patients with chronic rejection (p<.05)
Rudman 1999 29
RTX recipients that did not loose the graft in the first 2
374 Retrospective cohort study
1. Non-adherence = 3 missed calls in a row, in which the
Graft loss
Correlation Positive significant relationship of NA with graft
Study Description of the sample N Design Non-adherence concept-ualization and measurement
Outcome Analysis Results: consequences of non-adherence
months posttransplant; data gathering
patient should transfer the lab data results
loss (no probability mentioned)
restricted to 12 months; US 2. Collateral report by 4 staff members
Rejection Correlation Positive significant relationship of NA with the number of rejection episodes (no probability mentioned) If graft loss occurred, 44% were NA pre-transplant vs. 13% adherent (p <.01)
Douglas et al. 1996 30
RTX recipients that were >18 years at transplantation, without rejection due to technical failure or rejection <3 months, that survived >3 months; transplanted between 1986-1988; US
126 Retrospective cohort study
Non-adherence if documented in the pre-transplant evaluation chart (appointment non-adherence, use of illicit drugs, …)
Late graft loss
Chi²-test
If graft loss occurred: 44% were NA post-transplant vs. 17% adherent (p<.01)
A mean of 1.43 rejections if adherent pre-transplant; and 1.65 rejections if not adherent (not significant)
Late rejection (Biopsy proven)
F-test
A mean of 1.03 rejections if adherent post-transplant, and 1.93 rejections if not adherent (p<.0001)
De Geest et al. 1995 31
RTX recipients that were > 18 years, at least 1 year post-transplant, Dutch
148 Retrospective cohort study
Self-report Late acute rejection Mann Whitney U
More rejection in non-adherers (p=.003)
speaking; Belgium; on CyA Chronic rejection No significant difference (p=.70)
5y patient survivival Kaplan Meier
Longer patient survival if adherent (p=.03)
5y graft survival No significant difference Hilbrands et al. 1995 32
Adult 1st or 2nd RTX recipients > 3m post-RTX, cadaveric grafts, no psychiatric
113 Prospective cohort study
Pill-count: the sum of the monthly assessed, but dichotomized% of prescribed
Late acute rejection (Biopsy proven in 81%)
Mann-Whitney U
More underconsumption of medication in patients experiencing rejection
Study Description of the sample N Design Non-adherence concept-ualization and measurement
Outcome Analysis Results: consequences of non-adherence
disease, no alcohol abuse, knowledge of Dutch; Study was part of a trial comparing CyA with AZA+Pred
medications taken (p<.01)
Pirsch et al. 1996 33
RTX recipients with 1st cadaveric grafts, transplanted between 1986 & 1992; on AZA/Pred of CyA; multi-center UNOS data base; US
589 Retrospective cohort study
No operationalization given Rejection (clinical signs & biopsy)
Cox regression
Not significant
Butkus et al. 1992 34
1st cadaveric RTX between 1985-1991; on CyA; US
100 Retrospective cohort study
≥ 3 consecutive missed clinic visits, immeasurable blood CyA on 2 consecutive visits in the absence of another explanation, leaving hospital against advice
Graft survival Not mentioned
Degree of adherence significantly related to graft survival (no probability mentioned)
Kalil et al. 1992 19
RTX surviving the 1st year, transplanted between 1976-1982; on AZA/Pred; US
202 Retrospective cohort study
- NA reported in the medical chart - The dichotomized percentage of prescribed creatinine-level
Late graft survival Kaplan Meier
Better graft survival in adherent patients (p<.01)
measurements the patient transferred to the center.
Patient survival Kaplan Meier
No significant difference
Abbreviations: AZA = azathioprine; CyA = cyclosporine; CNI = calcineurin inhibitor; FK = tacrolimus; MMF = mycophenolate mofetil; NA = non-adherent Pred = prednison; RTX = renal transplant
Table 3: Studies estimating the contribution of non-adherence with immunosuppressive medication on late acute rejection or graft loss
Author Description of the sample (all consist of patients experiencing graft loss)
N Non-adherence conceptualization & measurement
Outcome Estimated % poor outcomes due to non-adherence
Michelon 2002 et al. 38
RTX recipients; RTX between 1977-1999; on AZA/Pred, AZA/Pred/CyA, MMF/CyA/Pred, Fk/AZA/Pred; Brazil
1027 Patient admitted that non-adherence was the cause of the graft dysfunction
Graft loss 47/448 = 10.5%
Matas 2002 et al. 39
RTX recipients; RTX in the 1990s, on CyA, AZA/MMF & Pred; US
534 Non-adherence was mentioned in the medical file Graft loss 11.7%
Michelon 1999 et al. 41
RTX recipients; RTX between 1977 and 1991; on AZA/ Pred&AZA/ Pred/ CyA; Brazil
1027 Patient or relative admitted that non-adherence was the cause of the graft loss when coming back on dialysis
Graft loss 48/385 = 12.5%
Gaston 1999 et al. 28
Kidney & Kidney-pancreas transplantation with graft loss due to chronic rejection beyond 6 months; transplanted between 1992 & 1995; on CyA; US
1005 Two of the following criteria: - admission of non-adherence by the patient, documented in the medical record - failure to keep scheduled appointments in outpatient transplant clinic - undetectable CyA levels on > 1 occasion in the absence of physician instruction to withhold CyA
Graft loss 64/184 = 34.8%
Garcia 1997 et al. 42
RTX recipients, > 6 months post-transplant, RTX between 1977-1995. Patients received education about importance of adherence after 1991; Brazil
562 When coming back on dialysis, the patient or a 1st degree relative admitted that regular medication intake was not rule
Graft loss 24/139= 17.2%
Reinke et al 1994 50
RTX recipients with impaired graft function ≥ 2 year post-transplant; on CyA/pred, AZA/Pred, CyA/AZA, or triple therapy; Germany
432 Assay of CyA & sometimes AZA Late acute rejection
4/157=2.5%
Kiley 1993 et al. 46
RTX recipients, RTX between 1985-1987; on CyA; US
105 Repeated CyA assays < 30 ng/ml in the absence of factors likely to affect the CyA levels
Graft loss 9/14 = 64.3%
Butkus 1992 et al. 34
First cadaveric kidney transplant recipients; RTX between 1985-1991; on CyA; US
100 ≥ 3 consecutive missed clinic visits; immeasurable blood CyA on 2 consecutive visits (in the absence of another explanation); or leaving hospital against medical advice
Graft loss 10/46 = 21.7%
Author Description of the sample (all consist of patients experiencing graft loss)
N Non-adherence conceptualization & measurement
Outcome Estimated % poor outcomes due to non-adherence
Hong 1992 et al. 47
RTX recipients > 1y post-transplant; RTX between 1983-1989; on CyA & tapering Pred; US
654 Self-admission or non-adherence, failure to attend 2 consecutive visits, or CyA level below 25 ng/ml that normalizes after CyA administration in the hospital
Graft loss 15/83 = 18.1%
Didlake 1988 et al. 49
RTX recipients; RTX between 1982-1986; on CyA; US
531 Initial CyA blood levels < 25ng/ml and rose upon in-hospital administration of the prescribed dose
Graft loss 15/126 = 11.9%
Rovelli et al. 1989 51
RTX recipients, > 3 months post-transplant, experiencing no rejection < 3 m; transplanted between 1971-1984; US
260 Medical record report of: 1. Appointment non-adherence 2. Medication non-adherence: admission of patients/family
Late acute rejection
36/74=48.6%
Same criteria, but transplanted after 1984. Patients also received adherence enhancing education before transplantation; US
196 Medical record report of: 1. Appointment non-adherence 2. Medication non-adherence: admission of patients/family
Literature review: prevalence, consequences and determinants
25
2.4.2. Economic consequences
Economic consequences of non-adherence have rarely been examined according to the best available standards for economic evaluation 53. One study estimated that the additional hospital cost associated with non-adherence amounts to 900$ per patient per year 54. This figure, however, incompletely reflects the actual costs, as non-adherence not only impacts upon hospital costs but also on other cost categories, such as ambulatory care costs, nursing home care costs, productivity losses and patients' and their family's out-of-pocket expenses. To grasp the full economic impact of non-adherence, it is necessary to consider both costs and outcomes in a cost-effectiveness or cost-utility analysis. Non-adherence after renal transplantation may have two opposite consequences that make it difficult to determine a priori what its consequences will be on the cost-effectiveness of renal transplantation. On the cost side, non-adherence may entail additional costs due to the occurrence and consequent treatment of late acute rejection or graft loss. However, adherent patients may experience more negative side effects related to immunosuppressive medication intake that also require additional treatment. The balance between the costs of adherence and non-adherence then becomes blurred. On the outcome side, non-adherence – if deliberate – may increase patients' life satisfaction, for instance through the experience of less side effects and more flexibility in medication intake. This quality of life improvement may (partly) offset the quality of life loss associated with increased morbidity. Again, the net effect is unclear. Only one cost-utility study has assessed the economic consequences of non-adherence in a renal transplant population. Cleemput et al. 55 found that because non-adherent patients have a lower life expectancy, their lifetime treatment costs are lower (a dead patient is the cheapest patient). Lifetime costs for adherent patients were estimated to be 38 180 € higher than for non-adherent patients. As for the outcomes, non-adherent patients had a worse outcome than adherent patients in terms of both life expectancy and quality adjusted life expectancy. Both outcomes were summarised in a single outcome measure: Quality Adjusted Life Years (QALYs). Adherent patients gained approximately 1.108 QALYs more after RTX than non-adherent patients 55. This implies that the incremental cost-effectiveness of adherence relative to non-adherence after RTX was 35 021 €/QALY. The incremental cost-effectiveness ratio will ultimately determine the relative cost-effectiveness of adherence-enhancing interventions 55. For an adherence enhancing intervention to be cost-effective, it is important that its cost-effectiveness ratio, added to the cost-effectiveness ratio of adherence relative to non-adherence does not exceed the societal willingness to pay for a QALY.
2.5. Determinants of non-adherence
Non-adherence can be considered as a phenomenon that emerges from the interplay of numerous influential factors, categorized into five groups: 1) socio-economic factors, 2) patient related factors, 3) condition or disease related factors, 4) therapy or treatment related factors, and 5) health care system and health care team related factors 14. Determinants from all categories except for health care system and health care team related factors have to a certain extent been studied in kidney transplant patients 19 21 23-25 27 29-31 34 35 51 56-61. The following section discusses the findings of these studies. Table 4 summarizes the evidence from all performed prospective cohort studies 21 23 56.
Literature review: prevalence, consequences and determinants
26
2.5.1. Socio-economic factors
Socio-economic variables have been explored most often. Almost every study included the variable age, showing that non-adherence is nearly consistently associated with being younger 21 24 30 35 51 57-61. Studies failing to confirm this finding mostly lack a significant subsample of adolescents 23 25 31 51. One could therefore hypothesize that the found linear association between non-adherence and younger age mainly depends on the presence of (non-adherent) adolescents at the lower end of the age spectrum. Without adolescents, non-adherence might remain quite stable over the life course, at least before major cognitive, sensory and functional impairment appear when becoming older. Facing the aging transplant population, increasing attention needs to be given to potential age related risk factors. Further socio-economic factors related to higher non-adherence with immunosuppressive therapy in renal transplantation are social network variables 21 24 31 56 57 61. Non-adherence is associated with living alone 21
31, being unmarried 31 56 61, or perceiving low social support 62. Analyses investigating the factor education remain inconclusive 19 21 24 25 31 35 57 58 60 61, as some studies did not find any relation with non-adherence 19 21 25 31 35 57, while others found a positive 24 62, or a negative one 58 60 61. Likewise, socio-economic class 21 24 61 and gender 21 23-25 31 35 51 57
58 60 61 were not consistently related to non-adherence. In general, it can be stated that socio-economic factors alone, except for younger age and social isolation, show a limited association with non-adherence, in line with evidence from other chronic patient populations 14.
2.5.2. Patient-related factors
Patient related factors refer to the resources, knowledge, attitudes, beliefs perceptions and expectancies of the patient 14. Patient related factors found to be associated with non-adherence with immunosuppressive therapy in renal transplantation are: low self-efficacy with medication intake 31, high levels of anxiety and hostility 60, and an external locus of control 57 60. External locus of control refers to patient’s perception that the evolution of the disease is particularly a matter of chance. Furthermore, health beliefs about the illness or the medication regimen such as believing that the immunosuppressive drugs are not needed to keep the kidney, or that intake of drugs may be delayed, have been found to be related to non-adherence 21 58. Knowledge about the regimen was positively related to non-adherence in two 25 31 out of three studies 25 31 56. One study investigated the predictive value of pre-transplant non-adherence on post-transplant non-adherence, finding also a significant positive relationship 30, in line with the evidence showing that past behavior very well predicts future behavior. Although a lot of studies investigated patient related correlates of non-adherence in renal transplant, few findings were mutually corroborated. Aside from replicating results, future research could focus on exploring new possible determinants, such as busyness and routine in someone’s life style, or engaging in health behaviors (e.g. vaccination).
2.5.3. Condition- or disease-related factors
The condition or disease related variables depression 61 and dependency on nicotine 24 or on illegal drugs 19 24 showed a positive relationship with non-adherence, whereas having diabetes was related to less medication non-adherence 58, perhaps due to the long-time adoption of adequate health behavior.
Literature review: prevalence, consequences and determinants
27
2.5.4. Therapy- or treatment-related factors
Therapy or treatment related factors such as time on dialysis, or being retransplanted were not associated with non-adherence 23 25 29 58 61. Three studies 59-61 out of 8 23 25 31
57-60 found more non-adherence in patients with a longer post-transplant status, confirming the evidence that duration of the regimen is associated with non-adherence. Other treatment related factors were the number of medications, a factor referring to the complexity of the medication regimen 25, and patients’ subjective experiences of the symptoms related to side effects of medication (e.g. excessive hair growth, moon face) 58 60 63. Two studies 21 58 out of six 21 24 35 51 58 60 detected more non-adherence in recipients of a living donor graft, compared to cadaveric grafts. Future research could focus on the effect of the use of medication reminders (e.g. a pill organizer), changes in the medication regimen, pre-emptive transplantation, or the number of medication intakes per day on non-adherence.
2.5.5. Health care system- and health care team-related factors
The last category of determinants of non-adherence, health care system and health care team related factors has been studied far less, indicating a bias in the literature. Two studies investigated the effect of the insurance status on non-adherence 34 58, one of which found more non-adherence in blacks who were not privately insured 34. Another study tested and detected self-reported differences between European and US renal transplant patients 64. One study found non-adherence differences in the included centers 67. The lack of evidence about health care system and health care team related factors shows that the patient is implicitly seen as defaulter. As a consequence, opportunities for improving adherence through optimizing the health care system or training the health care worker remain hidden 14 65. Future research should therefore focus on issues such as the communication style, knowledge, and skills of the health care worker, on time constraints during clinical consultations, and on organization of the follow-up care.
Some general remarks should be made about the studies examining determinants of non-adherence with immunosuppressive medication in renal transplant patients, more specifically about the used data analysis methods. Unlike the studies investigating the clinical consequences of non-adherence, determinant studies often do not mention the used statistical test. If they do, few report on the distributional properties of the adopted non-adherence operationalization. This lack of statistical background information for model validation jeopardizes the credibility of the presented results, because tests are performed requiring normally distributed data; yet, non-adherence measurements are in many cases highly skewed. Another statistical issue concerns the fact that many studies only report statistical significant findings, although a large amount of not mentioned candidate determinants have been tested. Even if studies report all the results, no study controlled for multiple testing. As a consequence, a significant proportion of the reported statistically significant findings were happening accidentally.
Table 4: Studies testing determinants of non-adherence with immunosuppressive medication in renal transplant patients
Study Description of the sample
N Design Adherence measurement
Determinants assessed Analysis Results: factors that were related to non-adherence
Weng et al. 2005 67
RTX recipients with cadaver kidney, > 18 years; US
278 Pro-spective cohort study
One year of electronic monitoring. Cut off not mentioned
Socio-economic: age, gender, marital & employment status, education, income, ethnicity Therapy related: diagnosis, HLA matching, initial hospital length of stay, delayed graft functioning, in-hospital rejection, previous RTX, immunosuppression, intake frequency, pre-emptive RTX Patient-related: transplant stress questionnaire, social support appraisal scale, center for epidemiologic research depression scale, multidimensional health locus of control scale, medical outcomes study short form health survey, medication side effects scale System factor: transplant center
Stepwise logistic regression
Transplant center (p=.003), intake frequency (.003)
Butler et al. 2004 21
RTX recipients > 18 years, ≥ 6 months post-transplant, with functioning graft; UK
60 Pro-spective cohort study
Six week of electronic monitoring of Pred. Non-adherence is defined as taking < 20% of the prescribed doses
Chi²-test & Mann-Whitney U
More NA if younger age (p=.01), living alone (p=.02), having a living donor graft (p=.01), having a lower belief in the need for immunosuppressives (p<.01), scoring lower on the BMQ-benefits subscale (p<.01), having negative emotions linked to the transplant (p<.05)
Socio-economic: age, gender, marital & employment status, education, social class, ethnicity, social support (Significant Others Scale) Therapy related: number of RTXs, graft type, time since RTX, number of rejections, HLA match, time on dialysis, donor diabetes or hypertension, duration of past RTXs Condition related: disease severity, past medical details, functional health status (SF-36), depression (revised Clinical Interview Schedule)
Stepwise logistic
Significant more NA in living donor transplants, patients
Study Description of the sample
N Design Adherence measurement
Determinants assessed Analysis Results: factors that were related to non-adherence
Patient-related: expectation about the RTX, illness perceptions (Illness Perception Questionnaire-6 subscales); medication beliefs (Beliefs about Medicines Questionnaire - 5 subscales)
regression having a low belief in the need for immunosuppression
Vlaminck et al. 2004 23
RTX recipients > 18 years old, ≥ 1 year post-transplant, Dutch speaking; on CyA; Belgium
146 Pro-spective cohort study
Self-reported NA measured at inclusion, defined as having regular dose omissions in the past 1 year
Socio-economic: age, gender Therapy related: donor age, time after RTX, serum creatinine 1 year post-transplant, serum creatinine at inclusion, delayed graft function, number of acute rejections in 1st year post transplant, number of transplantations, number of HLA mismatches Patient related: perceived social support
Unknown More NA if no perceived social support (p=0.028)
Ghods et al. 2003 24
RTX recipients > 1 year post-transplant; 95% on CyA (+sometimes MMF), 5% on AZA/Pred; Iran
267 Cross-sectional
Self-report: missing ≥ 3 doses per month. If non-consecutive: minor NA, if consecutive: major NA
Socio-economic: age, gender, marital status, education, socio-economic class Therapy related: graft type, number of RTXs, time since transplant, immunosuppressive regimen Condition related: opiate addiction, smoking, psychiatric disorders
Unknown More NA if younger (12-70y) (p<.05), lower educated (p<.05), lower socio-economic class (p<.005), heavy smoking, opiate addiction or psychiatric disorders (p<.05)
Vasquez 2003 25
Adult RTX recipients with functioning graft; on CyA, Fk, Pred; US
95 Retro-spective cohort study
Composite measure: Missed a dose since last visit or in week prior to survey receipt + 3 successive CyA levels < 50 ng/ml or FK < 5 ng/ml in absence of CNI metabolism affecting drugs, or absorption problems
Socio-economic: age, sex, race, socio-economic status, education, patients’ source of funding Therapy related: number of medications, number of visits to the center. Patient related: knowledge about the immunosuppressives (multiple choice questions)
Logistic regression
Simple regression: More NA if lack of knowledge, higher number of medications taken (p<.05), lower number of visits to the center (p<.05) Multiple regression: Lack of knowledge (p<.0001)
Study Description of the sample
N Design Adherence measurement
Determinants assessed Analysis Results: factors that were related to non-adherence
Teixeira de Barros et al. 2000 56
RTX recipients; transplanted between 1995-1997; Portugal
113 Pro-spective cohort study
A self-reported dose omission or intake deviation of > 2,5h in ≥ two 4-monthly evaluations over 2y
Socio-economic: race, employment status, place of residence, marital status,... Therapy related: symptom experience: (Transplant Symptom Occurrence and Symptom Distress Scale) Patient related: knowledge (self-developed questionnaire)
Unknown More NA if a higher level of symptom occurrence (p=.00006) and symptom distress (p=.00029), if being single (p=.009)
Isaacs 1999 et al. 27
RTX recipients with living related donor grafts; transplanted between 1988-1994; multi-center study of all patients in the US
10865
Retro-spective cohort study
Not stated Socio-economic: race (African, Native & Asian Americans, Whites, Hispanics)
Unknown NA differences among ethnic groups (p<.003). NA highest among Asian Americans, lowest among Hispanics
Raiz et al. 1999 57
RTX recipients >18 years old, first transplant, with functioning graft; >12 months post-transplant; RTX between 1985-1994; US
308 Cross-sectional
Self-report: admission of dose omissions
Socio-economic: age, education level, gender, marital status, Medicaid status (indication of income), race, difficulties with paying immunosuppressives Transplant related: years since RTX, number of medications Condition related: health status (8 subscales from the Medical Outcomes Study - Short Form 36) Patient related: intrusiveness of illness or treatment on life domains (Illness Intrusiveness Rating Scale); locus of control (3 subscales: Health Locus of Control scale); perceived social support (3 subscales: Social Support Appraisal Scale); ever having felt bothered by any aspect of the RTX at the center
Multiple regression
More NA if younger age, perceiving more limitations due to pain, if believing that chance controls health outcomes (= a locus of control subscale), if having felt bothered by any part of the RTX experience (all probability values <.05)
Papajcik et 1) RTX with 77 + Case- Missing ≥ 1 of the Socio-economic: age, gender, race, t-test, More NA in younger patients,
Study Description of the sample
N Design Adherence measurement
Determinants assessed Analysis Results: factors that were related to non-adherence
al. 1999 35 functioning graft ≥ 1y post-transplant, with biopsy confirmed chronic rejection; transplanted between 1987-1994 2) Matched group without chronic rejection
49 control study
following tasks ≥ 5x / year for ≥ 2 consecutive years: 1. Having lab tests done 2. Attending follow-up appointments 3. Taking immunosuppressants
education, having work Therapy related: graft type Condition related: functional status, Patient related: degree of happiness, live events, self-care behaviors
Chi²-test/Fisher exact test
and in men
Rudman 1999 29
RTX recipients that did not loose the graft in the first 2 months posttransplant; data gathering restricted to 12 months; US
374 Retro-spective cohort study
1. Non-adherence = 3 missed calls in a row, in which the patient transfers his lab data 2. Collateral report by 4 staff members
Therapy related: number of transplants received
Correlation A positive significant relationship of NA
Greenstein & Siegal 1998 58
RTX recipients > 18 years old, with functioning graft; on CNI; 56 centers (US)
1402 Cross-sectional study
Self-report: having missed ≥ 1 immunosuppressant in the past 4 weeks
Socio-economic: age, gender, ethnic group, country of origin, education, employment status Condition related: diabetes Therapy related: graft type, time since transplant, number of transplants, 6 questions about dialysis, 8 symptom frequency related to side effects questions, Patient related: health beliefs and 4 questions about the importance of post-transplant drugs Health care system: insurance status
Simple logistic regression
More NA if younger age, having had at least some college education, if employed, having white collar occupation, if RTX with a living related donor graft, if longer time since RTX, not diabetic (p<.001), born outside the US, reporting infections (symptoms scale) (p<.05) More NA if a lower belief - that the drugs are needed to keep the kidney, - that the drugs should never be delayed, - that the drugs are needed
Study Description of the sample
N Design Adherence measurement
Determinants assessed Analysis Results: factors that were related to non-adherence even if kidney is functioning - that the drugs stay active > 24h (p<.001)
Multiple logistic regression
More NA if: younger age, having white collar occupation (p<.05), longer time since RTX (p<.001), lower belief that drugs should never be delayed (p<.05), that drugs are needed even if the kidney is functioning well, or that drugs stay active >24h (p<.001)
Siegal & Greenstein 1997 59
Non-adherent RTX recipients > 18y, with functioning graft; on CyA; 5 centers in the US
96 Cross-sectional
Self-report: frequency of forgetting immunosuppressive medication in the last 4 weeks.
Regression analysis
Related to NA: younger age, longer time since transplant, if indicating not to take medications when away from home
Douglas et al. 1996 30
RTX recipients > 18 years at RTX, without rejection due to technical failure or rejection <3 months, that survived >3 months; transplanted between 1986-1988; US
126 Retro-spective cohort study
Composite measure: documented non-adherence in the post-transplant medical chart (appointment NA, NA with medications, …)
Patient related: documented non-adherence in the pre-transplant evaluation chart (appointment non-adherence, non-adherence with medications, use of illicit drugs, …)
Spearman’s rho
Non-adherence before the transplantation is related to non-adherence after the transplantation (rho=.33; p<.01)
De Geest et al. 1995 31
RTX recipients > 18 years old, ≥ 1 year post-transplant, Dutch speaking; on CyA;
148 Retro-spective cohort study
Self-report Socio-economic: age, gender, years of education, marital status, living alone Therapy related: time since transplantation, symptom experience
t-test, Mann-Whitney U, Chi²-test
More NA: if unmarried or single (p=.028), if lower self-efficacy (p=.048), if lower self-care agency (p=.025), if
Study Description of the sample
N Design Adherence measurement
Determinants assessed Analysis Results: factors that were related to non-adherence
Belgium (Modified Transplant Symptom Occurrence and Symptom Distress Scale) Patient related: self-efficacy (Long-Term Medication Behavior Self-efficacy Scale); self-care agency (Appraisal of Self-Care Agency Scale); knowledge of the regimen: self-developed instrument
less situational-operational knowledge (p=.02)
Sketris et al. 1994 60
RTX recipients taking CyA; 2 centers in Canada
361 Cross-sectional
Self-report: 1) taking a smaller or larger dose >1/week, 2) dose taking > 2 hours before of after indicated time >1/week; or 3 ) omitting a dose >1/month
Socio-economic: age, gender, educationCondition related: perception of health Therapy related: time since transplant, graft type, number of rejection episodes, symptom frequency, immunosuppression dosage per body weight, delivery method, once/twice daily regimen, time since last visit, number of medications
ANOVA & Chi²-test
More NA in adolescents, higher educated patients, patients with more medication, with more side-effects, over 1 year transplanted, that experienced more rejection episodes (all p’s <.05)
Frazier et al. 1994 61
RTX recipients, transplanted between 1987 & 1990
241 Cross-sectional
Self-report: total score of an 11 item scale (5 points) assessing non-adherence with medications
Socio-economic: age, gender, marital status, income Condition related: depressive symptoms (Beck Depression Inventory), insulin dependence Therapy related: number of transplants, time since transplant Patient related: anxiety & hostility (Brief Symptom Inventory); transplant-related stress-issues; locus of control (Multidimensional Health Locus of Control Scale), social support (Inventory of Socially Supportive Behaviors), coping (Coping Strategies Inventory)
Correlation analysis
More NA in women, unmarried, younger, higher income recipients (p<.01). Also in patients previously transplanted (p<.01), with higher anxiety, hostility (<.001), depression (p<.01), stress (p<.001), patients believing that their health outcomes were due to chance (p<.05), and patients using avoidance coping (p<.01)
Butkus et 1st cadaveric RTX 100 Retro- Composite measure: Socio-economic: ethnicity, … Unknown More NA in blacks compared
Study Description of the sample
N Design Adherence measurement
Determinants assessed Analysis Results: factors that were related to non-adherence
al. 1992 34 between 1985-1991; on CyA; US
spective cohort study
≥ 3 consecutive missed clinic visits, immeasurable blood CyA on 2 consecutive visits without another explanation; leaving hospital against advice
Health system related: private insurance to whites, in patients without private insurance (but only within the group of blacks) (p<.05)
Kalil et al. 1992 19
RTX surviving the 1st year; transplanted between 1976-1982; on AZA/Pred; US
202 Retro-spective cohort study
Composite measure: - NA reported in the medical chart - The percentage of prescribed creatinine-level measurements the patient transferred to the center.
Socio-economic: age, family income, education: years of education, race, distance to the transplant center (within or further than 50 miles) Condition related: chemical dependency
Unknown NA higher in patients living outside the metropolitan area (p<.01)
Rovelli et al. 1989 51
RTX recipients > 3 months post-transplant, experiencing no rejection < 3 months; RTX between 1971-1984; US
260 Retro-spective cohort study
Composite measure: 1. Appointment NA 2. Medication NA: admission of patients/family
Socio-economic: age, gender, ethnic group Therapy related: graft type
Unknown More NA in patients <20y compared to > 40y (p=.0001). Ethnic group differences (p=.0001): more NA in Hispanics and blacks
Same inclusion criteria, but RTX after 1984. Patients received adherence enhancing education before RTX
196 Pro-spective cohort study
Same measurement method
Socio-economic: age, gender, ethnic group Therapy related: graft type
Unknown Ethnic group differences (p=.0001): more NA in Hispanics and blacks
Abbreviations: AZA = azathioprine; CyA = cyclosporine; CNI = calcineurin inhibitor; FK = tacrolimus; MMF = mycophenolate mofetil; NA = non-adherence; Pred = prednison; RTX = renal transplant
Literature review: prevalence, consequences and determinants
35
2.6. Recommendations for future research
This literature review provides the basis for recommendations for future research:
1. Few studies in this literature review use the sensitive method of EM for measuring non-adherence with the immunosuppressive regimen. Future studies assessing prevalence, determinants and consequences of non-adherence should use EM as a prime measurement method, preferably combined with self-report, assay or collateral report. This triangulation of methods should provide a good basis for a reliable measurement. In addition, studies should state the adopted measurement method and accompanying operational definition of non-adherence.
2. The statistical analysis methods could be enhanced in many studies. The applied statistical tests should be specified, and should not violate underlying assumptions, as is often the case now. Moreover, too many studies have considerable multiple testing problems, not only because p-values are not adapted, but also because many studies only report their significant results, and hence, do not mention all variables tested.
3. In view of the exploration of determinants of non-adherence, research should expand to also assessing health care team and health care system related factors, as studies so far have been disproportionally focusing on primarily patient, socio-economic and treatment related factors. Moreover, the use of qualitative research or statistical techniques modeling the interplay of different variables (e.g. path analytic methods) could further enhance the understanding of the different factors influencing non-adherence.
4. Transplant registries and large outcome studies should include non-adherence as a relevant parameter to further assess the impact of non-adherence on outcome on a population basis. To examine the clinical consequences of non-adherence, prospective cohort studies need to be set up that test the effect of non-adherence under the newer immunosuppressive regimens. Sound economical evaluations exploring the economic consequences of non-adherence are needed, as the evidence base in this regard is limited to one study. These studies should take into account both costs and outcomes to allow cost-effectiveness or cost-utility analyses.
5. This review did not include intervention studies, due to the fact that this research area still has to be developed. Intervention programs that target modifiable determinants of non-adherence, embedded in a chronic disease management program, should be tested in with randomized controlled methodology.
2.7. Conclusion
Non-adherence with the immunosuppressive regimen in renal transplantation is a common phenomenon with serious consequences. A deeper understanding of the dynamics underlying non-adherence could be achieved by further exploring its determinants. Emphasis should thereby be put on system factors, as these may offer still unknown possibilities to support patients in reaching a higher adherence level.
Literature review: prevalence, consequences and determinants
36
Reference list 1. Meier-Kriesche HU, Schold JD, Kaplan B. Long-term renal allograft survival: have we made
significant progress or is it time to rethink our analytic and therapeutic strategies? Am J Transplant 2004;4(8):1289-95.
2. Meier-Kriesche HU, Schold JD, Srinivas TR, Kaplan B. Lack of improvement in renal allograft survival despite a marked decrease in acute rejection rates over the most recent era. Am J Transplant 2004;4(3):378-83.
3. Pascual M, Theruvath T, Kawai T, Tolkoff-Rubin N, Cosimi AB. Strategies to improve long-term outcomes after renal transplantation. N Engl J Med 2002;346(8):580-90.
4. Nevins TE, Matas AJ. Medication noncompliance: another iceberg's tip. Transplantation 2004;77(5):776-8.
5. Flechner SM. Minimizing calcineurin inhibitor drugs in renal transplantation. Transplant Proc 2003;35(3 Suppl):118S-121S.
6. Kahan BD, Welsh M, Schoenberg L, Rutzky LP, Katz SM, Urbauer DL, et al. Variable oral absorption of cyclosporine. A biopharmaceutical risk factor for chronic renal allograft rejection. Transplantation 1996;62(5):599-606.
7. Waiser J, Slowinski T, Brinker-Paschke A, Budde K, Schreiber M, Bohler T, et al. Impact of the variability of cyclosporin A trough levels on long-term renal allograft function. Nephrol Dial Transplant 2002;17(7):1310-7.
8. Stoves J, Newstead CG. Variability of cyclosporine exposure and its relevance to chronic allograft nephropathy: a case-control study. Transplantation 2002;74(12):1794-7.
9. He X, Johnston A. Variable cyclosporine exposure: a risk factor for chronic allograft nephropathy and graft loss? Transplant Proc 2004;36(5):1321-6.
10. Owens ML, Maxwell JG, Goodnight J, Wolcott MW. Discontinuance of immunosuppression in renal transplant patients. Arch Surg 1975;110(12):1450-1.
11. Uehling DT, Hussey JL, Weinstein AB, Wank R, Bach FH. Cessation of immunosuppression after renal transplantation. Surgery 1976;79(3):278-82.
12. Schratzberger G, Mayer G. Chronic allograft failure: a disease we don't understand and can't cure? Nephrol Dial Transplant 2002;17(8):1384-90.
13. Kreis HA, Ponticelli C. Causes of late renal allograft loss: chronic allograft dysfunction, death, and other factors. Transplantation 2001;71(11 Suppl):SS5-9.
14. Sabaté E. Adherence to long-term therapies: Evidence for action. Geneva: World Health Organisation, 2003.
15. Dunbar-Jacob J, Sereika S, Rohay JM, Burke LE. Electronic methods in assessing adherence to medical regimens. In: Krantz D, Baum A, editors. Technology and methods in behavioral medicine. Mahwah, NJ: Lawrence Erlbaum Associates, 1998:95-113.
16. Liu H, Golin CE, Miller LG, Hays RD, Beck CK, Sanandaji S, et al. A comparison study of multiple measures of adherence to HIV protease inhibitors. Ann Intern Med 2001;134(10):968-77.
17. De Geest S, Abraham I, Dunbar-Jacob J. Measuring transplant patients' compliance with immunosuppressive therapy. West J Nurs Res 1996;18(5):595-605.
18. Cramer JA, Scheyer RD, Mattson RH. Compliance declines between clinic visits. Arch Intern Med 1990;150(7):1509-10.
19. Kalil RS, Heim-Duthoy KL, Kasiske BL. Patients with a low income have reduced renal allograft survival. Am J Kidney Dis 1992;20(1):63-9.
20. Nevins TE, Kruse L, Skeans MA, Thomas W. The natural history of azathioprine compliance after renal transplantation. Kidney Int 2001;60(4):1565-70.
21. Butler JA, Peveler RC, Roderick P, Smith PW, Horne R, Mason JC. Modifiable risk factors for non-adherence to immunosuppressants in renal transplant recipients: a cross-sectional study. Nephrol Dial Transplant 2004;19(12):3144-9.
22. De Geest S, Abraham I, Moons P, Vandeputte M, Van Cleemput J, Evers G, et al. Late acute rejection and subclinical noncompliance with cyclosporine therapy in heart transplant recipients. J Heart Lung Transplant 1998;17(9):854-63.
Literature review: prevalence, consequences and determinants
37
23. Vlaminck H, Maes B, Evers G, Verbeke G, Lerut E, Van Damme B, et al. Prospective study on late consequences of subclinical non-compliance with immunosuppressive therapy in renal transplant patients. Am J Transplant 2004;4(9):1509-13.
24. Ghods AJ, Nasrollahzadeh D, Argani H. Risk factors for noncompliance to immunosuppressive medications in renal transplant recipients. Transplant Proc 2003;35(7):2609-11.
25. Vasquez EM, Tanzi M, Benedetti E, Pollak R. Medication noncompliance after kidney transplantation. Am J Health Syst Pharm 2003;60(3):266-9.
26. Butkus DE, Dottes AL, Meydrech EF, Barber WH. Effect of poverty and other socioeconomic variables on renal allograft survival. Transplantation 2001;72(2):261-6.
27. Isaacs RB, Conners A, Jr., Nock S, Spencer C, Lobo P. Noncompliance in living-related donor renal transplantation: the United Network of Organ Sharing experience. Transplant Proc 1999;31(4A):19S-20S.
28. Gaston RS, Hudson SL, Ward M, Jones P, Macon R. Late renal allograft loss: noncompliance masquerading as chronic rejection. Transplant Proc 1999;31(4A):21S-23S.
29. Rudman L, Gonzales M, Borgida E. Mishandling the gift of life: Noncompliance in renal transplant patients. Journal of Applied Social Psychology 1999;29(4):834-851.
30. Douglas S, Blixen C, Bartucci MR. Relationship between pretransplant noncompliance and posttransplant outcomes in renal transplant recipients. J Transpl Coord 1996;6(2):53-8.
31. De Geest S, Borgermans L, Gemoets H, Abraham I, Vlaminck H, Evers G, et al. Incidence, determinants, and consequences of subclinical noncompliance with immunosuppressive therapy in renal transplant recipients. Transplantation 1995;59(3):340-7.
33. Pirsch JD, Ploeg RJ, Gange S, D'Alessandro AM, Knechtle SJ, Sollinger HW, et al. Determinants of graft survival after renal transplantation. Transplantation 1996;61(11):1581-6.
34. Butkus DE, Meydrech EF, Raju SS. Racial differences in the survival of cadaveric renal allografts. Overriding effects of HLA matching and socioeconomic factors. N Engl J Med 1992;327(12):840-5.
35. Papajcik D, Mastroianni B, Goormastic M, Flechner SM. A tool to identify risk factors for noncompliance in the adult renal transplant recipient. Transplant Proc 1999;31(4A):84S-86S.
36. Meier-Kriesche HU, Ojo AO, Hanson JA, Cibrik DM, Punch JD, Leichtman AB, et al. Increased impact of acute rejection on chronic allograft failure in recent era. Transplantation 2000;70(7):1098-100.
37. Basadonna GP, Matas AJ, Gillingham KJ, Payne WD, Dunn DL, Sutherland DE, et al. Early versus late acute renal allograft rejection: impact on chronic rejection. Transplantation 1993;55(5):993-5.
38. Michelon TF, Piovesan F, Pozza R, Castilho C, Bittar AE, Keitel E, et al. Noncompliance as a cause of renal graft loss. Transplant Proc 2002;34(7):2768-70.
39. Matas AJ, Humar A, Gillingham KJ, Payne WD, Gruessner RW, Kandaswamy R, et al. Five preventable causes of kidney graft loss in the 1990s: a single-center analysis. Kidney Int 2002;62(2):704-14.
40. Irish W, Sherrill B, Brennan DC, Lowell J, Schnitzler M. Three-year posttransplant graft survival in renal-transplant patients with graft function at 6 months receiving tacrolimus or cyclosporine microemulsion within a triple-drug regimen. Transplantation 2003;76(12):1686-90.
41. Michelon T, Dominguez V, Losekan A, Messias A, Bruno R, Bittar A, et al. Kidney graft failure due to noncompliance. Transplant Proc 1999;31(7):3031-2.
42. Garcia V, Bittar A, Keitel E, Goldani J, Minozzo M, Pontremoli M, et al. Patient noncompliance as a major cause of kidney graft failure. Transplant Proc 1997;29(1-2):252-4.
Literature review: prevalence, consequences and determinants
38
43. Shoskes DA, Avelino L, Barba L, Sender M. Patient death or renal graft loss within 3 yr of transplantation in a county hospital: importance of poor initial graft function. Clin Transplant 1997;11(6):618-22.
44. Baltzan MA, Shoker AS, Baltzan RB, George D. HLA-identity--long-term renal graft survival, acute vascular, chronic vascular, and acute interstitial rejection. Transplantation 1996;61(6):881-5.
45. Matas AJ, Gillingham KJ, Payne WD, Najarian JS. The impact of an acute rejection episode on long-term renal allograft survival (t1/2). Transplantation 1994;57(6):857-9.
46. Kiley DJ, Lam CS, Pollak R. A study of treatment compliance following kidney transplantation. Transplantation 1993;55(1):51-6.
47. Hong JH, Sumrani N, Delaney V, Davis R, Dibenedetto A, Butt KM. Causes of late renal allograft failure in the ciclosporin era. Nephron 1992;62(3):272-9.
48. Dunn J, Golden D, Van Buren CT, Lewis RM, Lawen J, Kahan BD. Causes of graft loss beyond two years in the cyclosporine era. Transplantation 1990;49(2):349-53.
49. Didlake RH, Dreyfus K, Kerman RH, Van Buren CT, Kahan BD. Patient noncompliance: a major cause of late graft failure in cyclosporine-treated renal transplants. Transplant Proc 1988;20(3 Suppl 3):63-9.
50. Reinke P, Fietze E, Docke WD, Kern F, Ewert R, Volk HD. Late acute rejection in long-term renal allograft recipients. Diagnostic and predictive value of circulating activated T cells. Transplantation 1994;58(1):35-41.
51. Rovelli M, Palmeri D, Vossler E, Bartus S, Hull D, Schweizer R. Noncompliance in organ transplant recipients. Transplant Proc 1989;21(1 Pt 1):833-4.
52. Lawless CE, Dusck LK, Jarecki N. Impact of patient noncompliance on survival in cardiac transplant recipients. J Heart Lung Transplant 1999;18(1):38.
53. Cleemput I, Kesteloot K, De Geest S. A review of the literature on the economics of noncompliance. Room for methodological improvement. Health Policy 2002;59:65-94.
54. Swanson MA, Palmeri D, Vossler ED, Bartus SA, Hull D, Schweizer RT. Noncompliance in organ transplant recipients. Pharmacotherapy 1991;11(6):173S-174S.
55. Cleemput I, Kesteloot K, Vanrenterghem Y, De Geest S. The economic implications of non-adherence after renal transplantation. Pharmacoeconomics 2004;22(18):1217-34.
56. Teixeira de Barros C, Cabrita J. Noncompliance with immunosuppressive therapy: prevalence and determinants. Transplant Proc 2000;32(8):2633.
57. Raiz LR, Kilty KM, Henry ML, Ferguson RM. Medication compliance following renal transplantation. Transplantation 1999;68(1):51-5.
58. Greenstein S, Siegal B. Compliance and noncompliance in patients with a functioning renal transplant: a multicenter study. Transplantation 1998;66(12):1718-26.
59. Siegal BR, Greenstein SM. Postrenal transplant compliance from the perspective of African-Americans, Hispanic-Americans, and Anglo-Americans. Adv Ren Replace Ther 1997;4(1):46-54.
60. Sketris I, Waite N, Grobler K, West M, Gerus S. Factors affecting compliance with cyclosporine in adult renal transplant patients. Transplant Proc 1994;26(5):2538-41.
61. Frazier PA, Davis-Ali SH, Dahl KE. Correlates of noncompliance among renal transplant recipients. Clin Transplant 1994;8(6):550-7.
62. Yavuz A, Tuncer M, Erdogan O, Gurkan A, Cetinkaya R, Akbas SH, et al. Is there any effect of compliance on clinical parameters of renal transplant recipients? Transplant Proc 2004;36(1):120-1.
63. Teixera de Barros C, Cabrita J. Self-report of symptom frequency and symptom distress in kidney transplant recipients. Pharmacoepidemiol Drug Saf 1999;8(6):395-403.
64. Desmyttere A, Dobbels F, Moons P, Siegal B, Greenstein G, Vanrenterghem Y, et al. A cross-cultural comparison of noncompliance with immunosuppressive regimen and associated health beliefs among north american and european patients. Transplantation 2002;74(Suppl):490.
65. Desmyttere A, Denhaerynck K, Dobbels F, Moons P, Young J, Siegal B, et al. Prevalence of noncompliance with the immunosuppressive regimen: how different are North American and European renal transplant patients. Transpl Int Submitted.
Literature review: prevalence, consequences and determinants
39
66. Chisholm MA, Vollenweider LJ, Mulloy LL, Jagadeesan M, Wynn JJ, Rogers HE, et al. Renal transplant patient compliance with free immunosuppressive medications. Transplantation 2000;70(8):1240-4.
67. Weng FL, Israni AK, Joffe MM, Hoy T, Gaughan CA, Newman M, et al. Race and electronically measured adherence to immunosuppressive medications after deceased donor renal transplantation. J Am Soc Nephrol 2005;16(6):1839-48.
Examining assumptions of electronic medication monitoring
41
3. IS ELECTRONIC MEDICATION MONITORING THE GOLD STANDARD FOR ADHERENCE MEASUREMENT? A TEST OF ITS ASSUMPTIONS
Kris Denhaerynck, Petra Schäfer-Keller, James Young, Jürg Steiger, Andreas Bock, Christian Surber, Sabina De Geest Submitted to: Nursing Research
Examining assumptions of electronic medication monitoring
42
3.1. Introduction
The introduction of electronic monitoring (EM) for assessing medication non-adherence has enabled researchers and clinicians to gather data about medication-taking behavior with unprecedented precision. EM systems use pill bottles containing a small electronic processor that records the date and time of each cap opening, resulting in a more detailed non-adherence measurement. Compared to other methods (e.g., pill counts, assay, self-report, collateral report, prescription refills), EM captures more of the dynamics of medication-taking behavior 1. Although EM has for this reason been used as gold-standard method for assessing medication adherence 2 3, empirical evidence and clinical experience suggest that several factors can jeopardize the internal and external validity of EM studies 4. Unbiased EM measurement depends on the fulfillment of at least four assumptions. The first 3 of these assumptions ensure internal validity: (1) correct functioning of the EM equipment, (2) correspondence between EM-bottle openings and actual intake of the prescribed dose, (3) and absence of an EM-associated influence on a patient’s normal adherence behavior. The fourth assumption ensures external validity: use of EM does not bias the representativeness of the sample. This article discusses processes that might lead to a violation of these assumptions and describes how these assumptions were empirically tested.
Assumption 1. The first assumption ensuring unbiased assessment of medication non-adherence requires that electronic monitoring equipment function properly (Figure 1). Quality tests of the widely used Medication Event Monitoring System (MEMS®-6, Aardex Ltd.) performed under different laboratory conditions revealed that, of the 200,000 automatically generated events of 55 bottles and of the 31,740 manually generated events of 30 bottles, no missed, wrongly timed, or extra registrations were found 5 6. Moreover, exposing MEMS-6 to extreme laboratory conditions (e.g., keeping bottles at 60°C or at 2°C [n=12] for 6 h or submerging bottles under water for 12 h [n=8]) did not damage registration capacity or erase already registered events (n=12). Likewise, shocks (n=11) and vibrations (n=12) generated no extra events and did not damage subsequent registration capacity. Only a water resistance problem occurred in some bottles after they were subjected to unusually high atmospheric pressures exceeding 1.5 bar (n=13). Reports also exist of how MEMS performs in the field. A two-month assessment of eleven purposively sampled MEMS-IV bottles used in a one-year study of HIV patients (in which a number of bottles were suspected of being damaged) showed that EM registered only 97.5% of the generated events 7. Non-functional MEMS-V caps are also noted in an EM study in kidney transplant patients 8. The exact number of non-functional caps, however, could not be inferred from the research report, since non-functional caps and unused caps were grouped into one category.
Assumption 2: The second assumption ensuring unbiased assessment of medication non-adherence requires that each time the patient unscrews the EM-bottle cap, he/she also ingests the prescribed dose immediately. Discrepancies in pill removal and actual ingestion time may lead to over- or underestimation of non-adherence (Figure 1). We defined non-adherence as disregarding the dosage (underdosing, overdosing) or timing (taking the medication at the wrong time) information given in a prescription.
Fig. 1. Overview of possible violations of the assumptions underlying internal and external validity of EM: effects on the non-adherence estimate
Internal validity
External validity
Assumption 1. EM equipment functions correctly
2. All EM-bottle openings correspond to actual intake of the prescribed dose
3. EM does not influence typical adherence behavior
4. Use of EM does not bias the sample representativeness
Processes violating this assumption?
Non-functioning EM system technology
Interference with other adherence strategies (e.g., pill organizer)
Intervention effect of starting EM
Refusal to participate 3.a
Drop-out
Loss of data
Registration failures
Too many 1.b
Opening of the EM bottle without ingestion or with ingestion occurring at a later time
2.b
2.c
Ingestion of a dose larger or smaller than dose prescribed
2.d
3.b
3.c
registrations 1.a
Correct intake of prescribed drugs from a non-EM source (e.g., after having removed the prescribed dose from the EM bottle) 2.a
3.d
Effect of the violation
Overestimation of non-adherence
Underestimation of non-adherence
Abbreviations: EM, electronic monitoring
Examining assumptions of electronic medication monitoring
44
Overestimating non-adherence occurs when patients correctly ingest the immunosuppressive medication either from a source other than the EM bottle or from a supply of pills previously removed from the EM bottle 7 (see Figure 1, arrow 2.a). In these cases, patients can in fact be fully adherent but because EM-bottle openings are not registered, their adherence cannot be proven. Patients may avoid using the EM bottle because of practical or privacy reasons, making them reluctant to use the EM system outside the home 9 10. Overestimation of adherence also occurs when patients open the EM bottle but do not remove any pills (e.g., in a twice daily regimen, a third registration occurs when a patient demonstrates the EM system to friends; Figure 1, arrow 2.b). Phantom openings may, on the contrary, lead to underestimation of non-adherence if a prescribed opening is registered, but no medicine is taken 11 (e.g., in a twice daily regimen, only one intake occurs even though 2 openings are registered; Figure 1, arrow 2.c). EM-bottle openings without pill removal can occur quite frequently. In the HIV population, 26% of patients report at least one opening of the EM bottle without taking medication 7. Finally, underestimation of non-adherence may also occur if patients ingest doses that are larger or smaller than those prescribed (Figure 1, arrow 2d). Under- or overestimation of non-adherence can, to some extent, be prevented by asking patients to report discrepancies between cap openings and pill intakes and using these reports to correct the raw EM data. Several studies have implemented this method, offering patients a form on which to write down occurred discrepancies 9 12. However, patients who are non-adherent to the medication therapy are also likely to keep poor records of discrepancies 13. Moreover, asking patients to keep notes might induce self-monitoring and thus become an adherence-enhancing intervention.
Assumption 3. The third assumption underlying valid EM measurement requires the absence of an EM-induced effect on a patient’s normal or typical adherence behavior (Figure 1). Two pathways are important in this regard. Firstly, EM may influence normal intake behavior because patients cannot use medication aids like pill organizers as usual and, at the same time, be electronically monitored 4. Secondly, the awareness of being monitored may change the patient’s typical adherence habits 14. Using a pill organizer can increase the burden of a patient participating in an EM study, and lead to a lower participation to EM-studies among the pill-organizer users 4, or to stopping to use the pill organizer when continuing to be part of the study 15 (Figure 1, arrow 3.a). The problems related to combining an EM bottle and a pill organizer are expected to result in overestimating non-adherence (arrow 3.b). Support for the hypothesis that the awareness of being monitored may change a patient’s typical medication-taking habits comes from patient reports indicating that being electronically monitored influences normal intake behavior. In most cases, patients reported an increased adherence, seldom a decreased one 4 9 12 16-18 (Figure 1, arrows 3.d & 3.c). Support from sources other than these patient reports is scarce (Table 1). Five intervention studies examined whether administering EM 14 16 19 or disclosing the monitoring purpose of EM 13 20 changed a patient’s typical adherence behavior and one observational study examined whether non-adherence increased over time after having started EM 21. The results from these studies were inconclusive. The studies of Elixhauser et al. (1990) and Bertholet et al. (2000) confirmed that starting EM alters adherence behavior, while the other studies could not find any difference. The latter finding most probably reflected the existence of methodological weaknesses, rather than the absence of an EM-related intervention effect. A study overcoming most of the methodological flaws of currently published studies should include a large enough sample, evaluate a possible intervention effect at different time
Table 1: Published studies testing a possible intervention effect of electronic-medication monitoring on typical medication-taking behavior
Author & publication year
Study design
Description of the sample
n EM Description of the intervention
Outcome variable: medication adherence or clinical outcome
Result
Wagner et al. 2002
RCT
A community convenience sample of adult HIV-positive patients on HAART
117 MEMS Experimental group received EM; control group did not
Adherence measured with self-report (4 weeks after start of study) using a taking adherence parameter a
Less adherence (insignificant) in the EM group (91%) than in the control group (94%; p=.73)
Pre-post inter-vention study
A community convenience sample of adult HIV-positive patients on HAART monitored with EM
60 MEMS EM started after baseline blood pressure measurement
Adherence measured with self-report at baseline and after 4 weeks
Less adherence (insignificant) after introducing EM (91%) compared to baseline (93%; p=.16)
Bertholet et al. 2000
Pre-post inter-vention study
A convenience sample of primary care/hypertensive clinic patients with therapy-resistant hypertension
69 MEMS EM started after baseline blood pressure measurement
Clinical outcome: blood pressure evaluation after 1–2 months
Blood pressure was lower after EM (14/9 cm Hg) compared to baseline (16/10 cm Hg; p<.001)
Matsui et al. 1994
Pre-post inter-vention study
A convenience sample of young β-thalassemia out-patients on a new iron chelator
10 MEMS The purpose of EM was disclosed to patients after ± 11 months
Adherence measured by EM using the taking adherence parameter ± 18 months after disclosure
Greater adherence (insignificant) after disclosure (84%) compared to before (77%; p=.49)
Yeung et al. 1994
Quasi-experi-mental study
Non-equivalent study: two convenience samples of asthma patients on inhaling therapy
21 MDI Intervention group given disclosure; control group not given disclosure
Adherence measured by EM using the taking adherence parameter after 2–3 weeks from the study start
Greater adherence (insignificant) in the disclosed group (81%) than in the undisclosed group (71%; p=.53)
Elixhauser et al. 1990
RCT A convenience sample of psychiatric outpatients treated with lithium
90 Blister package
Experimental group received EM; control group did not
Adherence measured by self-reported, assay,% of expected prescription refills (after 2–4 months of study start)
Fewer expected prescription refills in the EM group (18%) than in the control group (31%; p<.01)
Cramer et al. 1990
Obser-vational study
An unspecified sample of patients
24 MEMS All patients received EM
Adherence measured by EM using the taking adherence parameter during the first and after a mean of 7 months from the start of the study
No significant difference found before and after (79% vs. 79%).
a Taking adherence = (number of taken pills / number of prescribed pills)*100
The fourth assumption refers to issues that might threaten the representativeness of the sample of an EM study. Examples include a large proportion of eligible subjects refusing to participate and a large proportion of patients dropping out of a study. The term dropout refers to patients who leave the study, who do not send their EM caps back to the research team, or who do not adhere to the guidelines underlying correct EM use (resulting in unreliable EM data). With the exception of a couple of studies that provided some evidence for representativeness bias, limited evidence exists concerning the external validity of EM studies. In one study, a smaller number of pill-organizer users decided to participate in EM than did non-users; the authors attributed this disparity to the burden of combining EM with pill organizers 4. Another study found that especially patients non-adherent to the medication have difficulties also to be adherent to the guidelines of the assessment 13.
3.1.3. Purpose of the study
Because no study to date has tested the four assumptions underlying valid EM measurement, the aim of the present study was to examine whether these assumptions were fulfilled when using EM in a sample of kidney transplant patients. More specifically, we aimed (1) to examine the accurate functioning of EM technology, (2) to check the correspondence of recorded EM-bottle openings with the actual intake of the prescribed dose, (3) to test whether EM influenced the typical adherence behavior of patients, and (4) to examine whether using EM biased the representativeness of the sample.
3.2. Methods
3.2.1. Design, sample, and setting
The data for this prospective cohort study came from the Supporting Medication Adherence in Renal Transplantation (SMART) study 22. Patients were eligible if they had received their kidney transplant at least one year prior to enrollment, and if they were self-administering immunosuppressive medication, more than 18 years of age, German or French speaking, and literate. Patients were excluded if they were not mentally able to respond adequately to the researcher’s questions or to complete the questionnaires. The convenience sample consisted of patients followed up at two outpatient transplant clinics in Switzerland. Swiss health insurance, which is compulsory, largely covers costs for immunosuppressive medications. Patients are responsible for paying out-of-pocket expenses amounting to about 10% of costs for prescribed drugs.
3.2.2. Variables and measurement
We used the Medication Event Monitoring System (MEMS-5 TrackCap) to measure non-adherence to immunosuppressive medications. The monitoring lasted three months and focused on one immunosuppressive drug per patient, preferably one taken twice
Examining assumptions of electronic medication monitoring
47
daily (cyclosporine, tactrolimus, mycophenolate mofetil). To capture the two dosing times of patients taking a combination of azathioprine and prednisone, both of which are typically prescribed once daily, we monitored the usage of both drugs. All patients received information about the monitoring of their medication-taking behavior, as requested by the ethical committee. Patients were also asked whether they perceived that using EM influenced their normal medication-intake behavior, and whether this influence changed their typical adherence to the immunosuppressives positively or negatively.
All participants received verbal and written instructions on how to use the EM system. Instructions stressed the need to match EM-bottle openings with actual drug intakes and requested patients to write down deviations from this guideline on a form that accompanied the EM bottle. Examples of such guideline violations include accidentally opening the EM bottle, stopping EM bottle use for a period of time, and removing pills prematurely. Upon completion of the EM measurements, we integrated these patient notes into the uploaded EM data.
At the end of the 3-month EM period, we used a structured interview to assess adherence to the EM instructions. The first goal of this interview was to detect defined periods of non-adherence to the EM instructions and to exclude them from the analysis (e.g., when a patient failed to use the EM device during the holidays for 14 days). The second goal of the interview was to assess the quality of the remaining data by scoring them according to five quality standards: (1) strict adherence to the EM guidelines (5 points); (2) self-report indicated that the EM system was not used exactly as instructed, but complete notes were available (4 points); (3) self-report indicated that the EM system was not used exactly as instructed, but incomplete notes were available (3 points); (4) self-report indicated that the EM system was not used exactly as instructed, but no notes were available (2 points); and (5) self-report indicated that neither the EM bottle nor the form was used as instructed (1 point) (Figure 2). Data was considered to be of sufficient quality for analysis when the patient received a score of 3 points or higher.
Dropped EM caps. We asked the patients to report if they dropped their EM caps to determine whether dropping the caps damaged the caps’ recording capacity. When the patients indicated on their special form that a drop occurred, we checked whether the recording system still functioned properly by scanning the uploaded EM data visually for extra recordings or for altered registration patterns.
Operational definition of EM-measured adherence. Electronically measured non-adherence was evaluated for each prescribed intake moment. Two binary variables represented the taking and timing dimensions of the patients’ non-adherence. The first variable indicated whether a patient omitted a dose (taking dimension). The second variable indicated whether the monitored inter-dose interval deviated by more than 25% from the prescribed interval or whether the medication was taken within the 25% range (timing dimension).
Other variables included in this study. To compare the characteristics of patients included in the EM study with those that refused to participate or dropped out, we measured non-adherence to the immunosuppressive therapy using self-report, collateral report, and blood assay. In the self-report, patients used a 7-point scale to score the frequency of non-adherence during the four weeks just prior to the inclusion interview – the scale ranged from never (0 points) to every day (7 points). This ordinal non-adherence variable was assessed during the inclusion interview. In the collateral
Examining assumptions of electronic medication monitoring
48
report, nurses and physicians involved in the follow-up care of the transplant patients scored non-adherence using a 3-point scale – good adherence (1 point), fair adherence (2 points), bad adherence (3 points). We used the mean scores of the health-care workers who evaluated and scored patients. With regard to the blood assay, non-adherence was scored according to each patient’s drug trough levels at inclusion (i.e., of cyclosporine, mycophenolate mofetil, tacrolimus, or sirolimus).
3.2.3. Data collection
The study was reviewed and approved by the appropriate ethical committees, and patients signed informed consents. We collected data from June 2001 to January 2004. Four research staff members recruited the patients, collected demographic and self-reported non-adherence data, and instructed the patients on how to use the EM system. After three months of electronic monitoring, participants received a letter to remind them to either bring back the EM device to the outpatient clinic or to send it back to the researchers (in a pre-stamped and pre-addressed envelope). Upon return of the device, we telephoned the patients and carried out a structured interview to assess their adherence to the EM guidelines (see Figure 2). During the interview, we also sought to determine how EM may have influenced the patients’ typical adherence behavior. We used Powerview® hard- and software to upload and adjust the EM data according to the patients’ notes.
3.2.4. Data analysis
Assumptions 1, 2 & 4 needed descriptive statistics. We calculated the prevalence of malfunctioning EM systems (assumption 1), the prevalence of reported cap recording mismatches and non-adherence to the EM system (assumption 2), and the proportion of pill organizer users not participating (assumption 4). We also compared tabulated mean values of non-EM measured adherence between participants and non-participants/dropouts (assumption 4). Assumption 3 required inferential statistics. We modeled the probability of non-adherence as a function of a patient’s exposure time to the EM system by performing two multiple random-intercepts logistic regression analysis, one modeling dose omissions and one timing non-adherence. The random-intercepts models, which we fitted using the nlmixed procedure in SAS® version 9.1, accounted for the repeated measurement structure of the data. These multiple models controlled for the variables "bottle volume" (1055cc, 325cc, 120cc), “the researcher who did the inclusion interview”, and “the self-reported perceived EM-intervention effect” (positive or not). For validity information on this method, see appendix 1. To get a more detailed insight into non-adherence over time, we also fit a generalized additive model including a spline smoothed function of exposure time 23. This function left the relationship between non-adherence and explosure time unspecified, and allowed graphical exploration of nonlinearities.
Examining assumptions of electronic medication monitoring
49
Self-reported EM bottle use
EM system always used as instructed
Yes No
Self-reported non-adherence to the EM guidelines
Sometimes
Never
Complete notes
Some notes No notes
Data Quality Data quality score 5 Data quality score 4 Data quality score 3 Data quality score 2 Data quality score 1
Adherence to the EM guidelines
Minor non-adherence to the EM guidelines
Data included in the analyses
Major non-adherence to the EM guidelines
Data excluded from the analyses Fig. 2 Algorithm estimating a patient’s non-adherence to the EM guidelines
Examining assumptions of electronic medication monitoring
50
3.3. Results
Four hundred thirteen adult renal transplant recipients visiting the outpatient clinic for their yearly check-up were asked to participate in the SMART study (Figure 3). Three hundred fifty-six accepted (86%) and 57 (14%) refused to participate in our study. Of the 57 patients, 28 granted us permission to obtain their demographic and clinical data from their medical files. Of the 356 participating patients, 291 (82%) agreed to be monitored electronically. The remaining 65 (18%) patients did not want to be monitored electronically but wanted to participate by completing the self-report questionnaires. Of the 291 patients who agreed to be monitored with EM, 3 (1%) never started, 3 (1%) did not return their EM caps, and one died (<1%). Thirty-four (12%) patients were excluded from the analyses because they failed to adhere to the EM guidelines. The final sample consisted of 250 patients, with an average age of 52.9 years (sd=13.5; Table 2). The majority of subjects were Swiss citizens (n=208; 83.5%) and male (n=141; 56.6%). Immunosuppressive therapies consisted of cyclosporine and mycophenolate mofetil (n=71; 28.5%), cyclosporine (n=38; 15.2%), cyclosporine and azathioprine (n=37; 15.2%), or other combinations (n=103; 41.1%).
Fig. 3. Patient-sample profile
413 patients invited to participate in study
57 (13.8%) refusals
356 (86.2%) acceptances
28 (49.1%) background data extraction granted
65 (18.3%) without EM
291 (81.7%) with EM
284 with data 6 without data - 3 never started - 3 did not return cap - 1 died
34 (12.3%) displayed major non-adherence to the EM guidelines
250 (87.7%) adhered to the EM guidelines
193 (77.5%) adhered to the EM guidelines (of which 1 cap deficit)
46 (18.5%) displayed minor non-adherence to the EM guidelines
Assumption 1. Sixty-one (22%) patients reported that they had dropped their EM caps. None of these caps registered the drop as an event, nor did the data afterwards reflect any visually detectable signs of damage to the recording system. One patient who never dropped his cap claimed to have better adherence than suggested by his EM data. A manual check of his cap revealed that it failed to register openings. This cap
Examining assumptions of electronic medication monitoring
51
seemed to have gradually lost its registration capacity during the 3-month monitoring period, because all expected openings within the first two weeks of the measurement period were recorded, after which the event recordings declined. Although the gradual decline of cap function suggested a battery problem, a battery check did not reveal an exhausted battery.
Assumption 2. Of the 249 patients with reliable EM data, 155 (62%) reported discrepancies on their form between recorded openings and actual medication intakes, which required 1084 corrections to the 44761 records of raw EM data (2.4 corrections, on average, per person). Twenty-eight percent of the corrections involved early decants of pills that were ingested later. The most frequently mentioned reasons patients gave for the discrepancies were going out, being on a trip, and having a meeting. Other reasons for correspondence failures were taking medication from another supply, phantom openings to demonstrate the EM bottle to visitors, and opening the wrong bottle. Twenty-three patients (9.2%) had defined periods of non-adherence to the EM guidelines. For these patients, an average of 13.6 days were excluded from the total monitoring period. Our sensitivity analysis showed that the average percentage of correctly dosed days reached 92.9% when including the defined periods, but amounted to 96.3% when excluding the defined periods.
Table 2: Characteristics of the sample (n=250)
Variable Categories ValueAge Mean= 54 (sd=13)Gender Male 142 (56.8%)Living alone No 194 (77.6%)Employed Yes 130 (52.0%)Education until age 11/12 years
until age 12/13–14/15 years until age 15/16–18/19 years advanced (college)
No influence Positive influence Negative influence
188 (76.1%)53 (21.5%)6 ( 2.4%)
Assumption 3. The random-intercepts logistic regression analysis confirmed an increase in both taking (OR: 1.009; CI: 1.006-1.013) and timing non-adherence (OR: 1.007; CI: 1.005-1.009) over time (Table 3). In addition, nonlinear regression lines showed that
Table 3: Estimates and inferences from the multiple logistic random-intercept models predicting the chance of non-adherence
Outcome variable Parameter Estimate Standard error
Examining assumptions of electronic medication monitoring
53
the increase in both dimensions mainly occurred during the first 5 weeks of monitoring (Figure 4). After day 35, the taking dimension of non-adherence stabilized. The average percentage of correctly dosed days was 96.7% when including the entire 3-month measurement period, but slightly decreased to 96.3% when the first 35 days were excluded. The timing dimension of non-adherence stabilized after about day 50. The average percentage of correctly timed intakes was 91.8% when including all data points, and slightly decreased to 91.4% when only considering the stable phase between day 50 and 75. A post hoc analysis identifying potential interactions between exposure to the EM bottle and perception of the EM-intervention effect, showed a stronger EM-intervention effect in patients acknowledging an intervention effect than in patients stating that they experienced no intervention effect (p=0.003).
Fig. 4. This figure presents the nonlinear regression lines modeling the rise of non-adherence over time after the start of electronic monitoring. Because nonlinear trends are easier to detect when axes have a linear interpretation, the Y-axis’ probability on non-adherence is transformed to a linear log-odds scale. The figure indicates that non-adherence increased until the first 35 days of electronic monitoring (vertical line). After 35 days, non-adherence was unrelated to exposure.
Assumption 4. A comparison of pill organizer use in participants vs. non-participants in the EM part of our study showed that pillbox use was more common among non-participants (38.5%) than among participants (25.1%). Table 4 compares non-EM adherence measurements of participants and non-participants/dropouts. The table shows that, although expected, dropouts did not
Examining assumptions of electronic medication monitoring
54
have a lower adherence to the immunosuppressive therapy than did participants. The same can be said of the non-participants: the data counterintuitively suggested slightly higher immunosuppressive blood assay values among the non-participants. This pattern remained the same when analyzing those who did not use a pill organizer (data not shown). Table 4: Comparisons of alternative adherence measures between participants and non-participants and between participants with reliable EM data and participant dropouts
mean sd n mean sd n Self-report (1-7) 0.25 0.73 36 0.15 0.45 244 Collateral report, Center 1 (1-3) 1.15 0.50 24 0.94 0.25 138 Collateral report, Center 2 (1-3) 1.35 0.66 12 1.17 0.40 87 Assay: cyclosporine (mmol/l) 122 103 125 112 43 164 Assay: tacrolimus (mmol/l) 7.3 3.8 5 7.6 2.7 39 Assay: mycophenolate mofetil
(mmol/l)3.5 2.5 17 3.0 1.8 101
3.4. Discussion
This study examined four assumptions underlying the valid electronic measurement of medication non-adherence, which, if violated, might threaten the external and/or internal validity of EM studies.
Assumption 1. We identified one EM device that had stopped recording cap openings during the study. Although previous laboratory test reports from Aardex, the company that markets MEMS, did not mention failures, our finding confirms literature reports that EM devices used in studies can be damaged 8 23. Admittedly, the Aardex report dealt with the newer MEMS-6 monitors, not the MEMS-5 monitors used in our study. MEMS-6 mainly differs from MEMS-5 in its data upload technology, otherwise MEMS-6 is comparable to its predecessor in most of its other components (www.aardex.ch; accessed September 6, 2005). The existence of a non-registering cap shows that overestimating non-adherence is possible for patients who have damaged caps that remain undetected. A systematic check of the recording system before and after a monitoring period is therefore advisable
Examining assumptions of electronic medication monitoring
55
(M-P Schneider, PhD, University of Lausanne, personal communication, Basel, April 18, 2005).
Assumption 2. The present study revealed that EM registrations often do not correspond to the actual ingestion of the monitored medication. A recent study of HIV patients came to the same conclusion, finding that 36% of patients failed to use their EM bottles continuously during a one-year monitoring period, 38% of patients used their EM bottles only on occasion, and 3% of patients always removed more than one dose per EM-bottle opening 7. These percentages confirm that mismatches between EM-bottle registrations and ingestion are common and that non-monitored periods often occur. We showed that negating non-monitored periods can result in a bias in the prevalence of monitored periods, as illustrated by our sensitivity analysis. We overestimated non-adherence by 3.4% when we included the non-monitored periods into our analyses of data obtained during the 3-month monitoring period. The overestimation would have probably been even larger if the Powerview analysis software we used for uploading and correcting the EM data allowed us only to export the uncorrected registrations instead of those we corrected using the patients’ notes. Also, the discrepancy will probably be larger in populations with higher non-adherence levels. Better correspondence between event registration and pill ingestion may be achieved by improving the way MEMS-6 measures adherence. An often mentioned drawback of MEMS is its impracticality 7; thus, a more practical, easy-to-use system may increase EM use outside of the home. Recent efforts are being made in this regard in that several companies have started to market EM-blister packs: Bang & Olufsen Medicom’s IDAS® (http://www.medicom.bang-olufsen.com), IMC’s Med-ic® (http://med-ic.biz), and MeadWestvaco’s Cerepak® (http:// www.meadwestvaco.com).
Assumption 3. Testing the third assumption revealed that EM influenced adherence behavior. We detected an initial increase of non-adherence, and believe that this increase reflects the waning of the adherence-enhancing effect of introducing EM in patients' daily life. To assess patients' normal level of adherence, studies should examine presence and duration of an intervention effect using longitudinal analysis techniques 24. Traditional analysis approaches, using period prevalence parameters like "the percentage of prescribed medications that are taken", are limited with regard to analysis of detailed time-dependent evolutions. Moreover, their often J-shaped distributions force researchers to rely on simple nonparametric tests 25. Given that the found intervention effect lasted more than one month, the validity of EM studies of one month or less can be questioned. Longer monitoring periods are probably less prone to bias, as shown by the fact that we only found minimal differences in period prevalences including the intervention period compared to prevalences excluding it.
Assumption 4. We found little evidence of compromised external validity in this sample of renal transplant patients. Our study indeed confirmed previous research that found less willingness to participate among pill-organizer users 4, but failed to confirm the hypothesis that patients who did not adhere to EM guidelines display higher medication non-adherence than patients who did adhere to the guidelines 13. This does not necessarily mean that there was no difference: measurement error coming from small sample sizes, low sensitivity of non-EM non-adherence assessment 1, and probably also of the EM-data quality assessment, may have blurred existing differences. Few conclusions can be made from the blood assay
Examining assumptions of electronic medication monitoring
56
data showing that values tended to be higher in non-participants compared to participants. The differences were very small compared to their variability and not confirmed by self-report or collateral report data.
3.5. Conclusion
This study shows that electronic monitoring of medication adherence, today's most sensitive method of measuring medication intake, can be further improved by fulfilling methodological requirements, such as the four assumptions discussed in this article: (1) A systematic functionality control of the EM system before and after use is indicated; (2) assessment of adherence to the EM guidelines should be incorporated in each EM study, and a form should be used on which patients can register deviations from the guidelines; (3) each EM study should examine intervention effects and estimate potential biases; and (4) further research examining the sample representativeness in EM studies is needed. Meeting these methodological standards may put EM on an even higher plane, helping it to really achieve its gold-standard aspirations.
Reference list 1. Liu H, Golin CE, Miller LG, Hays RD, Beck CK, Sanandaji S, et al. A comparison study of
multiple measures of adherence to HIV protease inhibitors. Ann Intern Med 2001;134(10):968-77.
2. Cramer JA. Microelectronic systems for monitoring and enhancing patient compliance with medication regimens. Drugs 1995;49(3):321-7.
3. Chaisson RE, Barnes GL, Hackman J, Watkinson L, Kimbrough L, Metha S, et al. A randomized, controlled trial of interventions to improve adherence to isoniazid therapy to prevent tuberculosis in injection drug users. Am J Med 2001;110(8):610-5.
4. Wendel CS, Mohler MJ, Kroesen K, Ampel NM, Gifford AL, Coons SJ. Barriers to use of electronic adherence monitoring in an HIV clinic. Ann Pharmacother 2001;35(9):1010
5. Results summary for hardware tests 1.0. Sion: Hexalog s.a., 2004. 6. MEMS 6: one year manual test of MEMS 6. Sion: Hexalog s.a., 2004. 7. Bova CA, Fennie KP, Knafl GJ, Dieckhaus KD, Watrous E, Williams AB. Use of electronic
monitoring devices to measure antiretroviral adherence: practical considerations. AIDS Behav 2005;9(1):103-10.
8. Weng FL, Israni AK, Joffe MM, Hoy T, Gaughan CA, Newman M, et al. Race and electronically measured adherence to immunosuppressive medications after deceased donor renal transplantation. J Am Soc Nephrol 2005;16(6):1839-48.
9. Deschamps AE, Graeve VD, van Wijngaerden E, De Saar V, Vandamme AM, Van Vaerenbergh K, et al. Prevalence and correlates of nonadherence to antiretroviral therapy in a population of HIV patients using Medication Event Monitoring System. AIDS Patient Care STDS 2004;18(11):644-57.
10. Dunbar-Jacob J, Sereika S, Rohay JM, Burke LE. Electronic methods in assessing adherence to medical regimens. In: Krantz D, Baum A, editors. Technology and methods in behavioral medicine. Mahwah, NJ: Lawrence Erlbaum Associates, 1998:95-113.
11. Burke LE. Electronic measurement. In: Burke LE, Ockene IS, editors. Compliance in Healthcare and Research. Armonk: Futura Publishing Co., 2001:117-138.
12. De Geest S, Abraham I, Moons P, Vandeputte M, Van Cleemput J, Evers G, et al. Late acute rejection and subclinical noncompliance with cyclosporine therapy in heart transplant recipients. J Heart Lung Transplant 1998;17(9):854-63.
13. Matsui D, Hermann C, Klein J, Berkovitch M, Olivieri N, Koren G. Critical comparison of novel and existing methods of compliance assessment during a clinical trial of an oral iron chelator. J Clin Pharmacol 1994;34(9):944-9.
Examining assumptions of electronic medication monitoring
57
14. Elixhauser A, Eisen SA, Romeis JC, Homan SM. The effects of monitoring and feedback on compliance. Med Care 1990;28(10):882-93.
15. Wagner GJ. Does discontinuing the use of pill boxes to facilitate electronic monitoring impede adherence? Int J STD AIDS 2003;14(1):64-5.
16. Wagner GJ, Ghosh-Dastidar B. Electronic monitoring: adherence assessment or intervention? HIV Clin Trials 2002;3(1):45-51.
17. Reddel HK, Toelle BG, Marks GB, Ware SI, Jenkins CR, Woolcock AJ. Analysis of adherence to peak flow monitoring when recording of data is electronic. BMJ 2002;324(7330):146-7.
18. Fulmer TT, Feldman PH, Kim TS, Carty B, Beers M, Molina M, et al. An intervention study to enhance medication compliance in community-dwelling elderly individuals. J Gerontol Nurs 1999;25(8):6-14.
19. Bertholet N, Favrat B, Fallab-Stubi CL, Brunner HR, Burnier M. Why objective monitoring of compliance is important in the management of hypertension. J Clin Hypertens (Greenwich) 2000;2(4):258-262.
20. Yeung M, O'Connor SA, Parry DT, Cochrane GM. Compliance with prescribed drug therapy in asthma. Respir Med 1994;88(1):31-5.
21. Cramer JA, Ouellette VL, Mattson RH. Effect of microelectronic observation on compliance. Epilepsia 1990;21(5):617-618.
22. De Geest S, Denhaerynck K, Schäfer-Keller P, Bock A, Steiger J. Supporting Medication Adherence in Renal Transplantation - the SMART study. Swiss Medical Weekly In press.
treatments. Control Clin Trials 1997;18(3):187-203. 25. Dunbar-Jacob J, Foley S. A historical overview of medication adherence. In: Dunbar-
Jacob J, Erlen J, Schlenk E, Stilley C, editors. Methodological issues in the study of adherence. Pittsburg: School of Nursing, 2005.
Prevalence and risk factors of non-adherence
59
4. PREVALENCE AND RISK FACTORS OF NON-ADHERENCE WITH IMMUNOSUPPRESSIVE MEDICATION IN KIDNEY TRANSPLANT PATIENTS
Kris Denhaerynck, Jürg Steiger, Andreas Bock, Petra Schäfer-Keller, Susanne Köfer, Nicole Thannberger, Sabina De Geest In re-review: American Journal of Transplantation
Prevalence and risk factors of non-adherence
60
4.1. Introduction
Receiving a kidney allograft entails a life-long intake of immunosuppressive medication to prevent rejection of the transplanted kidney. Although strict adherence to the immunosuppressive drug therapy is crucial to keeping the kidney well functioning, recipients do not always perfectly adhere to the agreed regimen 1. Studies that electronically monitor medication intake behavior of recipients, using microchip fitted pill bottles 2, show that adult kidney transplant patients are non-adherent to their immunosuppressive therapy in 3% to 7% of the monitored days 3-5. Non-adherence in kidney transplant is associated with an increased number of late acute rejections, late kidney graft failure 3 6-8, increased health care costs 9, and has been suggested 10 as a possible contributing factor of the recently observed stagnation of long-term survival of kidney grafts 11 12.
Improving long-term outcomes in kidney transplantation may be achieved by enhancing adherence to the immunosuppressive therapy of patients at risk. Unfortunately, limited evidence is available about risk factors of non-adherence to immunosuppressives in kidney transplant patients. Of all possible risk factors, categorized by the WHO into the classes ‘socio-economic’, ‘patient-related’, ‘condition/disease-related’, ‘therapy/treatment-related’, or ‘health care system/health care worker-related’ factors 13, only socio-economic variables have been extensively studied in adult kidney transplant patients 1. Frequently studied socio-economic risk factors for non-adherence with the immunosuppressive regimen are ‘younger age’ 14-22 and ‘being less imbedded in a social network’ (i.e. being unmarried, living alone, having no employment) 14 18 21 23 24. However, in contrast to many risk factors in other categories, socio-economic factors are often of limited use to clinicians because of their relatively unmodifiable nature. Moreover, many show inconsistent relationships to non-adherence (e.g. education) 1.
Self-efficacy 23 and erroneous health beliefs 18 25 are two examples of clinically valuable patient-related risk factors. Self-efficacy refers to a person’s confidence in mastering a specific task 26, and plays a central role in initiation and persistence of human behavior 26 27. Health beliefs refer to a recipient’s belief system regarding disease and therapy, a synthesis of information coming from previous experience, cultural background, and communication with significant others and health care authorities 28. Other patient-related factors that are related to medication taking behavior in kidney transplant patients are health behaviors such as smoking or alcohol use 15 29. The factor busyness/routine in life-style, which has been studied in HIV and arthritis population 30
31, could also be a risk factor in kidney transplantation.
Also of clinical interest are factors related to a patient’s condition or therapy. Tested and found to be associated to non-adherence in kidney transplantation are higher symptom experience 5 18 20 24, more previous rejections 20, longer time since transplantation 19 20, having received a graft from a living (related) donor 14 18 32, and depression 15 21. Suggested relevant factors but not yet appropriately tested in kidney transplantation are the use of medication aids 33, treatment complexity and changes 13, and pre-emptive transplantation 14.
A last category, health care system/worker-related factors, has been studied to a lesser extent. Only a small number of system-related risk factors are studied. Having no health insurance is for instance related to non-adherence 34. Other studies found that non-adherence varies among centers 5 35.
Prevalence and risk factors of non-adherence
61
Although some risk factors for non-adherence in kidney transplantation have been identified, important methodological shortcomings of the cited studies prevent firm conclusions 1. The majority of studies have a important methodological shortcomings, such as multiple testing problems, or the use of self-report to measure non-adherence, which is known to have less sensitivity compared to other methods (e.g. electronic monitoring of medication intake) 36. Moreover, many possibly important risk factors of non-adherence already tested in other populations (HIV, heart transplantation) have not been extensively examined in kidney transplantation.
The aim of this study was therefore do a comprehensive assessment and testing of risk factors of non-adherence. To maximize the power of this study and enhance the validity of its results, we measured non-adherence by sophisticated electronic monitoring technology.
4.2. Methodology
4.2.1. Design, sample and setting
This prospective study is part of the Supporting Medication Adherence in Renal Transplantation (SMART) project 37 38. The study’s convenience sample included adult kidney transplant recipients older than 18 years, who were at least one year transplanted, who managed their immunosuppressives intake independently, were German or French speaking, literate, and who were followed up at one of the two included outpatient transplant clinics in Switzerland. Exclusion criteria were lack of mental acuity to answer the questions or inability to read. Swiss health insurance, which is compulsory, largely covers costs for immunosuppressive medications. Patients are responsible for paying out-of-pocket expenses amounting to about 10% of costs for prescribed drugs.
4.2.2. Variables and measurement
4.2.2.1. Non-adherence measurement
Electronic monitoring of non-adherence. We assessed non-adherence with immunosuppressive medication by electronic monitoring, using the MEMS®-V TrackCap system (Aardex, Ltd.). Provided that certain validity issues are taken into account 37, EM has proven to be the most sensitive and valid measurement method for assessing non-adherence, able to detect minor deviations from the prescribed treatment regimen in clinically stable patients 36. Moreover, EM provides information on patients’ daily medication intake dynamics.
Validity of the EM measurement. To ensure the validity of the EM measurement, we excluded the first 35 days of the EM measurement period from the analyses because of a detected intervention effect of starting up EM 37. We also asked patients to write down actual medication intake times on a special form when cap openings did not correspond to medication intake. The form notes allowed us to correct mismatches between registrations and actual dose intakes. We also assessed adherence to the guidelines of correct EM and form use in a telephone interview at the end of the monitoring period. The telephone call allowed us to exclude data of time periods in which a patient was not adherent to the EM guidelines. Patients who made no
Prevalence and risk factors of non-adherence
62
continuous use of the EM-bottle and did not notify this on the form, were excluded from the study.
Definition of the EM variables. Variables for describing period prevalences and for doing inferential analyses were calculated differently.
The EM period prevalence parameters were 39: (1) taking adherence, the percentage of prescribed doses that were taken; (2) dosing adherence, the percentage of days with correct dosing; (3) timing adherence, the percentage of inter-dose intervals within 25% of the prescribed interval; and (4) drug holidays, the number of periods without drug intake that exceeded 48h in a once daily, or 24h in a twice daily regimen, standardized over 100 monitored days. The assessment period started 35 days after monitoring the first morning dose and ended three months later; or earlier when the patient dropped out. We defined a day as starting at 3:00 am and ending at 2.59 am.
The outcome variable in the inferential analyses consisted of a longitudinal binary sequence representing patients’ non-adherence status on each prescribed intake moment. Omitted doses or wrongly timed doses were considered as non-adherence. A dose was considered as rightly timed if the interval with the previous dose did not deviate more than 25% from the prescribed interval. Excess dosing was not taken into account, as previous research showed that only a minority of EM-detected overconsumption really corresponds to overdosing 40.
4.2.2.2. Measurement of risk factors of non-adherence
We explored selected risk factors of non-adherence from all five dimensions of the WHO classification of non-adherence risk factors. Socio-economic factors retrieved from the medical files were age, gender, and nationality; those assessed by structured interview were living alone/together, being employed/unemployed, the perception of adequacy of the financial situation to cover costs of medications (on a 4-point scale from more than enough to not enough money), and educational level (measured by a 4-points ordinal variable reflecting the age until which patients went to school: until 11/12, 14/15, 18/19 years, or longer). Received social support with medication taking was assessed using an 8-item scale that scored how often it happened in the past month that a patient received social support from others (e.g. someone helped preparing the medication) 41. Unrotated principal component analysis revealed unidimensionality among 7 items that loaded at least 0.44 on the first factor. One item (“Was there someone who went to the pharmacy for you to get your medication?”) only loaded 0.27 on the first component, indicating that it measured a different aspect of social support. We therefore considered this item as a separate variable in the analyses and calculated an average total score on the remaining seven items. The 7-item scale had a Cronbach’s alpha of 0.70.
Patient-related factors explored by structured interview in this study were vaccination status (influenza and pneumonia), current smoking status (yes/no), frequency of alcohol use during the last month (on a 6-point scale ranging from daily to never), use of complementary medicine (e.g. homeopathy, St. John’s worth, Chinese medicines), and the day of the week. We also measured self-reported non-adherence by asking patients in a non-threatening, non-accusatory way how frequently they did not take their immunosuppressive medication in the past four weeks 18. They could answer on a 7-point scale ranging from never to every day.
Prevalence and risk factors of non-adherence
63
Multi-item validated self-report instruments were used to measure self-efficacy with medication taking 42, illness representations 18, business and routine in life style 31 43, and coping style 44.
Self-efficacy was measured using the Long-Term Medication Behavior Self-Efficacy scale 42, a 27-item instrument with a 5-point scale ranging from 1 (=little confidence) to 5 (=strong confidence). The scale has been validated in both transplant and other populations as being a unidimensional instrument showing predictive validity 45. The instrument’s unidimensionality was reconfirmed in this study; an unrotated principal component analysis showed that the first component, on which all items loaded at least 0.44, accounted for 41% of the variance. We used the average score as a measure of self-efficacy.
Illness representations related to medication taking was assessed by a scale developed by Greenstein and Siegal 18, consisting of 10 beliefs about immunosuppressive drugs (e.g. “I will only be able to keep my kidney if I take my post transplant drugs”). For each health belief statement, patients scored their level of agreement on a 5-point scale ranging from ‘completely disagree’ to ‘completely agree’. An unrotated principal component analysis revealed that the items hardly shared common information: absolute component loadings on the first component ranged from |0.20| to |0.65|, with an average of |0.41|. Because of the lack of unidimensionality, we considered each item as a separate variable in the analyses.
Coping was assessed by the Utrecht Coping List (UCL) 44, a 47-item instrument measuring a person’s coping style when faced with difficult life situations. Patients scored on a scale from 1 (=seldom or never) to 4 (=very often) the frequency of a specific coping behavior. The scale is meant to measure seven different styles: 1) active coping (taking action to solve a problem), 2) avoidance coping (avoiding difficult situations or resigning), 3) seeking social support, 4) passive coping (waiting for things to change), 5) expression of emotions (showing emotions but not directly approaching a problem), 6) reassuring coping (overcoming a problem by thinking about bigger problems), and 7) palliative coping (taking action to soothe the discomfort of a problem) 44. An examination of the internal structure of the instrument using varimax rotated principal component analysis, revealed that the last component (palliative coping) consisted entirely of items that cross-loaded on other components. We therefore omitted this component from the analysis and refined the six remaining subscales by deleting items that loaded on more than one component at the same time. The six subscales had acceptable internal consistency, as shown by the respective Cronbach’s alpha values (0.80, 0.62, 0.84, 0.76, 0.50, and 0.70), which made it possible to calculate mean scores for each subscale.
Life style was assessed by the ACQ Busyness Scale, a 13-item 5-point self-report instrument presenting statements related to the dimensions busyness and regularity in one’s daily life 31 43. A varimax rotated principal component analysis confirmed the existence of two dimensions: ‘busyness’ (the items 1 to 9) and ‘routine’ (the items 10-13), for which the Cronbach’s alpha values were 0.85 and 0.76, respectively. The variables busyness and routine were calculated by averaging the items in each of the dimensions.
As condition-related factors, we extracted two variables from the medical file, namely body mass index and Charlson comorbidity index (omitting the age aspect, to prevent collinearity with the already included variable age). We also measured depressive symptomatology by self-report using the Beck Depression Inventory 46 47, a 21-item 4-
Prevalence and risk factors of non-adherence
64
points self-report scale assessing the emotional, cognitive and physical symptoms of depression. An unrotated principal component analysis confirmed the unidimensionality of the scale by showing one distinct component on which all items loaded at least 0.40. The scale’s Cronbach’s α was 0.88, which allowed us to calculate a mean score over all items.
The therapy-related factors extracted from the medical file were graft type (cadaver, living-related [e.g. a sibling], or living-unrelated donation [e.g. a spouse]), dialysis mode (peritoneal or haemo-dialysis), total time spent on dialysis, pre-emptive transplantation (yes/no), the number of received transplants, the number of prescribed medications, prescription changes, the regimen (once or twice daily), and medication intake time (morning or evening). We also measured by structured interview whether patients used medication aids (pillbox, alarm clock, beeper, calendar, putting the medication conspicuously on one or different places).
Symptom experience was measured with the Modified Transplant Symptom Occurrence and Symptom Distress Scale 48 49, a self-report instrument consisting of 45 symptoms measuring both symptom occurrence and symptom distress. Patients scored the occurrence of symptoms on a 5-point scale (0 to 4), and the accompanying distress on a separate and visually distinct 5-point scale (1 to 5). Distress scores were deleted if symptom occurrence was indicated as not present (=0). Because an unrotated principal component analysis on the occurrence items showed that the average absolute component loading only reached |0.38|, and that the shared variance among the items was only 16%, we considered each item as a separate variable in the analyses, an approach that differed from previous studies 5 18 20 24.
Health care system/health care worker-related factors assessed in this study were the number of clinic visits the patient had during the 3 months study period, the number of days before the next follow-up visit (both retrieved from the medical files)50, and outpatient center (Basle or Aarau).
4.2.3. Data collection
The study was reviewed and approved by the appropriate ethical review boards. We collected data from June 2001 to January 2004. Four research staff members recruited the patients, collected demographic and self-reported non-adherence data, instructed the patients on how to use the EM system, and obtained signed informed consents. Patients took the self-report questionnaires home, were asked to complete them and send them back in a pre-stamped and pre-addressed envelope. After three months of electronic monitoring, participants received a letter to remind them to either bring back the EM device to the outpatient clinic or to send it back to the researchers. Upon return of the device, we telephoned the patients and carried out a structured interview to assess their adherence to the EM guidelines. During the interview, we also sought to determine how EM may have influenced the patients’ typical adherence behavior. We used Powerview® hard- and software to upload and adjust the EM data according to the patients’ notes.
4.2.4. Statistical analysis
We checked the distribution of the non-adherence period prevalence parameters, and calculated the following central tendency and variance parameters: average, median, inter-quartile range, and range. Each risk factor’s relationship with non-adherence was
Prevalence and risk factors of non-adherence
65
separately tested using simple random-intercept logistic regression analysis. To prevent the accumulation of type I errors among the logistic regression analyses, we adapted all p-values by a method that holds the expected proportion of type I errors among the rejected null hypotheses at 5% 51. The tables presenting the results contain all uncorrected (p) significant variables, with their multiple testing corrected estimates and inferences (q). Variables that were significant after correction for multiple testing were put into a multiple random intercept logistic regression model. Because, as in a lot of behavioral research, many risk factors might be correlated with each other, we checked for possible multi-collinearity by calculating the variance inflation factor of the variables in the multiple regression model. All analyses were done in SAS 9.1.
4.3. Results
4.3.1. Sample characteristics
Four hundred thirteen adult renal transplant recipients visiting the outpatient clinic for their yearly check-up were asked to participate in this study, of which 86% (N=356) agreed to take part with the questionnaire part and 291 to be monitored electronically (Figure 1). Of these 291 EM patients, 3 (=1%) never started EM, 3 did not return the EM cap, 1 (<1%) died in the beginning of the study, and 34 (=11.7%) were excluded from the analyses because of non-adherence to the EM guidelines. The final sample (N=249) had a mean age of 53.5 years (sd=12.7), consisted of 83.6% Swiss citizens (n=208), and 58.6% males (n=207; Table 1). Monitored immunosuppressive therapies were mycophenolate mofetil (n=102; 41.0%), cyclosporine (n=53; 35.7%), azathioprine/prednisone (n=19; 7.6%), tacrolimus (n=37; 14.9%), and sirolimus (n=2; 0.8%).
Figure 1: Sample profile
413 patients invited
57 (13.8%) refusals
356 (86.2%) included
65 (18.3%) question-naires only
291 (81.7%) with EM
284 with data 7 without data - 3 never started - 3 did not return cap - 1 died
35 (12.3%) non- adherent to EM guidelines
249 (87.7%) adherent to EM guidelines (included in the analyses)
Prevalence and risk factors of non-adherence
66
Table 1: Demographical characteristics of the sample (n=249)
Variable Categories Value Mean (SD) Age 53.6 (12.7) Frequency (%) Gender Male 141 (56.6%) Living alone No 193 (77.5%) Employed Yes 129 (51.8%) Education until age 11/12 years
until age 12/13–14/15 years until age 15/16–18/19 years advanced (college)
Once daily regimen Twice daily regimen Other regimensRegimen changes during the study
8 ( 3.2%) 235 (94.4%)
3 ( 1.2%) 3 ( 1.2%)
4.3.2. Prevalence of (non-)adherence
The EM based period prevalence parameters showed a mean taking adherence of 98% (range: 47-110%; Table 2), a mean dosing adherence of 96% (range: 23-100%), and a mean timing adherence of 92% (range: 18-100%). The mean number of drug holidays standardized per monitored 100 days was 1.1 (range: 0.0-29.1). Inter-quartile ranges show that a substantial number of patients had low non-adherence. In the case of timing adherence for instance, it can be calculated from the median and inter-quartile range that 25% of the patients took less than 92.1% of their pills at the right time.
4.3.3. Risk factors of (non-)adherence
Table 3 presents the statistically significant results of the simple modeling. Significant risk factors after correction for multiple testing were: younger age (OR=0.96; q=0.02), male gender (OR=0.37; q=0.02), low self-efficacy (OR=0.24; q=0.02), high self-reported non-adherence (OR=4.34; q<0.001), busy life style (OR=2.3; q=0.03), symptom distress with spots in the face or on the back (OR=1.69; q=0.04), and having a graft from a living-related person (OR=2.88; q=0.02). Also, non-adherence was the lowest on Monday, the highest on Sunday and increased during the days in between (OR=1.04; q=0.02) in a gradual way, as was shown in an additional exploratory analysis. Borderline significant and clinically important (OR=0.37) is that using a pillbox was related to adherence.
Table 2: Period prevalence parameters measured by electronic monitoring
Variable Definitions Sample Mean Std Median Iqr Min Max Taking adherence (number of taken doses / number of prescribed doses)*100 249 98.4% 5.1 100.0 1.3 46.5 110.2 Dosing adherence (number of days with correct dosing / number of days monitored)*100 249 96.2% 8.7 100.0 3.6 22.8 100.0 Timing adherence (number of correct inter-dose intervals defined as the prescribed inter-
dose interval ± 25% / number of openings)*100 249 91.9% 15.1 98.1 7.9 18.2 100.0
Drug holidays The number of drug holidays per 100 monitored days. (*) 249 1.1 days 3.2 0.0 1.1 0.0 29.1
Abbreviations: n = sample size; std = standard deviation; iqr = inter-quartile range; min = lowest value in the sample; max = highest value (*) drug holiday = no medication intake for > 48 hours in a once (n=3) and > 24 hours in a twice daily regimen
Table 3: Results of the simple mixed logistic regression analysis
Category Variable More non-adherence … OR (95% CI) df t p q Socio- Age if younger 0.96 (0.94 - 0.99) 245 -3.18 0.002 0.024 * economic Gender if male 0.37 (0.20 - 0.68) 246 -3.23 0.001 0.024 * Education if higher educated 1.44 (1.09 - 1.90) 246 2.58 0.011 0.073 Patient Self-efficacy with medication taking if lower self-efficacy 0.24 (0.11 - 0.55) 243 -3.43 0.001 0.024 * related Self-reported non-adherence if more self-reported NA 4.34 (2.38 - 7.91) 241 4.81 0.000 <.001 * Busyness in life style when busy 2.30 (1.33 - 3.97) 242 2.99 0.003 0.030 * Belief: Advantages of having a kidney outweigh the problems
that accompany the post transplant drugs when believing this 1.39 (1.03 - 1.87) 238 2.14 0.033 0.124
Belief: I agree that personal knowledge about the own body should be taken into account when decisions are made about the amount of immunosuppressives to be taken
when believing this 1.29 (1.05 - 1.58) 235 2.48 0.014 0.076
Belief: My kidney is functioning so well that I do not need the post-transplant drugs
when believing this 1.63 (1.10 - 2.42) 241 2.42 0.016 0.082
Coping: passive if more of this coping style 2.05 (1.09 - 3.86 ) 240 2.23 0.027 0.117 Coping: expression of emotions if more of this coping style 1.94 (1.06 - 3.54) 239 2.17 0.031 0.122 Vaccination when not vaccinated 0.46 (0.22 - 0.97) 243 -2.04 0.042 0.126 Frequency of alcohol intake (1-6) when frequent alcohol intake 1.25 (1.05 - 1.50) 240 2.47 0.014 0.076 Therapy Graft type (cadaveric vs. living-related) if living-related 2.88 (1.47 - 5.64) 245 3.09 0.002 0.024 *
Category Variable More non-adherence … OR (95% CI) df t p q related Using a pillbox if not using this aid 0.37 (0.18 - 0.77) 245 -2.68 0.008 0.063 Using an alarm clock if not using this aid 0.13 (0.02 - 0.81) 245 -2.20 0.029 0.117 Putting the medication eye-catchingly to different places if not using this aid 0.48 (0.23 - 1.00) 245 -1.98 0.049 0.131 Using additional aids not specified in the questionnaire if using additional aids 3.19 (1.06 - 9.62) 245 2.07 0.040 0.126 Symptom occurrence: having spots on the face / back if spots occur 1.62 (1.12 - 2.36) 240 2.56 0.011 0.073 Symptom distress: having spots on the face / back if spots give distress 1.69 (1.22 - 2.34) 151 3.17 0.002 0.024 * Symptom occurrence: impotence (men only) if impotent 0.72 (0.53 - 0.97) 129 -2.14 0.034 0.124 Symptom occurrence: having swollen ankles if less swollen ankles 0.64 (0.45 - 0.91) 238 -2.53 0.012 0.075 Symptom occurrence: having trembling hands if trembling hands 1.53 (1.05 - 2.23) 239 2.21 0.028 0.117 Symptom distress: having increased hair growth if less distress about hair 0.70 (0.51 - 0.96) 140 -2.25 0.026 0.117 Symptom occurrence: having warts if having warts 1.38 (1.00 - 1.90) 236 1.98 0.049 0.131 Symptom distress: having warts if warts give distress 1.52 (1.02 - 2.27) 101 2.08 0.040 0.126 Symptom occurrence: having diarrhea if having diarrhea 1.59 (1.01 - 2.50) 239 2.03 0.044 0.126 Symptom distress: pain when passing water if passing water hurts 3.14 (1.06 - 9.31) 35 2.14 0.040 0.126 Weekday at the end of the week 1.04 (1.01 - 1.07) 244 3.15 0.002 0.024 * System Center 1 vs center 2 0.51 (0.27 - 0.96) 246 -2.11 0.036 0.126 related Center 1 vs other centers 0.23 (0.06 - 0.96) 246 -2.02 0.044 0.126
Prevalence and risk factors of non-adherence
69
All of these variables were put into the multiple regression model, except for ‘symptom distress with having spots’, which we replaced by the occurrence dimension. The occurrence variable had far fewer missing values, yet behaved similarly to the distress variable in the simple regression model. Moreover, both variables highly correlated with each other (r=0.49). Table 4 presents the result of the multiple regression model. Significant associations existed between EM-measured non-adherence and gender (OR=0.46; CI=0.26-0.81), weekday (OR=1.04; CI=1.02-1.07), using a pillbox (OR=0.31; CI=0.16-0.61), and self-reported non-adherence (OR=3.08; CI=1.69-5.61).
Table 4: Results of the multiple mixed logistic regression analysis
Random effect Estimate df t p Variance 1.898 234 15.06 <.0001 Fixed effects OR (95% CI) df t p Intercept 0.89 (0.01-70.5) 234 -0.05 0.95 Age 0.99 (0.97-1.02) 234 -0.55 0.58 Gender 0.46 (0.26-0.81) 234 -2.67 0.008 * Weekday 1.04 (1.02-1.07) 234 3.20 0.001 * Self-reported non-adherence 3.08 (1.69-5.61) 234 3.71 0.0002 * Busyness 1.41 (0.82-2.44) 234 1.25 0.21 Self-efficacy 0.49 (0.22-1.07) 234 -1.80 0.07 Using a pillbox 0.31 (0.16-0.61) 234 -3.40 0.0007 * Graft type: Cadaveric vs living-related 1.78 (0.90-3.51) 234 1.67 0.09 Cadaveric vs living-unrelated 1.46 (0.61-3.53) 234 0.85 0.39 Having spots on the face / back 1.20 (0.84-1.69) 234 1.01 0.31
A weak collinearity existed between some of the included variables. The non-significance of self-efficacy is probably the consequence of a weak correlation with self-reported non-adherence (r=0.22). Removing self-reported non-adherence from the model resulted in a lower p-value for self-efficacy (p=0.01). Other correlating predictor variables were busyness and age (r=-0.35). Alternately removing them from the model did not change the model’s final conclusion. A third predictor variable showing correlation with other predictors in the model was graft type. Persons who received a graft from a living-related person were younger (z=-7.2; p<0.0001), busier (z=4.1; p<0.0001), less self-efficacious (z=-2.9; p=0.003) and reported more non-adherence (z=2.1; p=0.03) than those who received a cadaveric graft. Because none of these factors seemed to entirely explain the association of living-related transplantation on non-adherence, we looked in the literature for additional information on expected differences between living (related) and cadaveric transplantation 14 18 32, and identified two additional explanatory variables. Recipients of a live donor graft might have a higher chance on pre-emptive transplantation 14, and have a stronger belief in the histocompatibility of the living-related graft 18. Our sample indeed showed strong differences in pre-emptive transplantation frequencies between living-related and cadaveric grafts: only 1% of the cadaveric graft transplantations were pre-emptive, compared to 20% of the living related (χ²=53.8; p<0.0001). Also living-related graft recipients had a stronger belief that “kidneys from living donors do not need as much immunosuppression as cadaver kidneys” (z=3.38; p=0.0007). Including both variables into the multiple model, however, did not change the results of table 4.
Prevalence and risk factors of non-adherence
70
4.4. Discussion
This study investigated period prevalence and risk factors of non-adherence to the immunosuppressive therapy in adult kidney transplant patients more than one year after transplantation, containing the largest sample ever of electronically monitored solid transplant recipients. Non-adherence in this sample was slightly lower compared to previous EM studies performed in the U.S. (see above) 3-5. Several explanations for this difference may be posited, for instance, adherent patients may have been more inclined to participate in the EM part of the study. Such a selection bias, however, was very unlikely, as we checked but did not find differences in non-adherence as measured by self-reported, health care provider report and blood assay between subjects participating and those not participating with EM 52. A second possible explanation for the observed prevalence differences between our study and published ones could be the protocols used to clean the data. We excluded subjects showing major non-adherence to the EM guidelines, which could have led to higher adherence estimates, as it is known that not excluding patients non-adherent to the EM guidelines leads to overestimating non-adherence 52. Again, this explanation is not likely to fully explain the observed differences. The reason is that two of our own studies in Belgian heart 53 and Dutch liver transplant patients 54 used a similar data cleaning protocol, but nevertheless found lower taking 53 and dosing 54 adherence prevalences than this study (a median 99% on both parameters). A third possible source of non-adherence prevalence variation can be found in regional differences among the compared studied samples. This geographical hypothesis is supported by a recent meta-analysis on individual patient data 55 that pooled self-reported non-adherence data of North American 18 and European patients 37 49, and by non-adherence research in non-transplant populations 56 57. All these studies reveal a similar geographical pattern as can be observed in the just mentioned EM measurements in transplant patients: the highest non-adherence is found in the U.S., the lowest in European samples. Future research will have to confirm this preliminary evidence of regional variation and determine underlying dynamics. Causes are likely to be of health care system-related origin. Unfortunately, this study was not designed to study correlations between macro-level differences in health care systems (such as access and reimbursement policies) and individual medication adherence behavior. The only evidence our study offers about system-related factors is that differences were found between the two included centers. Although not significant after correction for multiple testing, our finding is supported by other research 5 35, and may indicate that characteristics of health care programs (like chronic disease/behavioral management practices) influence patients’ adherence.
Aside from the health care system-related domain, this study identified a relatively small number of risk factors for non-adherence out of a large supply of candidate risk factors. The probability that these are not just statistical artifacts, but real risk factors of non-adherence, is very high. Moreover, some findings are very valuable for clinical practice, in that they offer both possibilities for identifying patients at risk for non-adherence, as well as for enhancing adherence. An example of a clinically useful result is the detected link between self-efficacy and adherence, confirming earlier research in transplant 23 53, and other populations (e.g. HIV) 58 59. Efficacy cognitions can be influenced by clinical intervention (e.g. by inducing mastery experience) 60, and are therefore useful as a cornerstone concept in adherence enhancing programs. Other results with possible relevance for adherence remediation are the detected strong
Prevalence and risk factors of non-adherence
71
associations between adherence and the use of medication aids, confirming research on medication aids done in HIV or glaucoma patients 61-65. Evidence for causal effects of medication aids on non-adherence exist for electronic 63-65 as well as non-electronic reminder devices (e.g. pillboxes) 66.
Not useful for adherence remediation, but certainly helpful for detecting patients at risk for non-adherence, is the finding that a one-unit increase in self-reported non-adherence resulted in a threefold higher odds on non-adherence as measured by EM. Self-reported non-adherence was the most powerful predictor in our multiple model, in spite of the fact that it is not regarded as a very sensitive method for measuring non-adherence 36 67. Supported by earlier research 53, this finding demonstrates the usefulness of self-report for the detection of patients at risk for non-adherence. If done in a non-accusatory and non-threatening way, self-report can be an easy screening method for detecting patients with non-adherence problems, and can be integrated as a clinical parameter in the clinical follow-up of transplanted patients.
The two last significant variables in the multiple model, weekday and gender, are not manipulatable. The gradual increase of non-adherence during the work week, culminating in the weekend, equals results of earlier research reporting a discontinuously higher non-adherence on weekend days 68. The variable gender on the other hand was not really expected to appear as a risk factor in this study. Of twelve kidney transplant studies that previously looked for gender differences 6 15-18 20-23 32 69 70, only one found that women were more non-adherent than men 21, the opposite result as ours.
All remaining variables of the multiple model seemed to be explained by other included variables. Non-adherence of living-related graft recipients for instance, is higher because these patients score higher on risk factors such as age, busyness, self-efficacy, health beliefs, and the lack of experience with dialysis 14 18. This list is probably not comprehensive, as estimates and inferences of the model including all these variables hardly differed from the one in Table 4. Therefore, further exploration of characteristics that increase non-adherence in living-related graft recipients is indicated.
The results for many variables in this study were not conclusive. Among the risk factors that did not prove to be significant after correction for multiple testing, a substantial proportion will be statistical noise, though that proportion could be somewhat smaller than the corrected inferences suggested. Moderate correlations among many of the risk factors may have made our multiple testing correction slightly conservative 51. Hence, the evidence for variables such as ‘alcohol use’, or the health belief that ‘immunosuppression is needed to keep the kidney’ is stronger than suggested in table 3, especially because these particular variables have previously already been associated to non-adherence 14 18 29. Variables on the other hand for which evidence is weaker are the many symptom experience items. Contra-intuitively to the theoretical framework 28, symptoms that appeared in the simple modeling results were not the most frequently occurring or the most distressing symptoms 49 71. Because earlier studies did not do item specific analysis, we cannot compare our results to earlier findings. It would therefore be worthwhile to try to replicate these results on older symptom data using the same data analysis techniques we used for this study 53.
Prevalence and risk factors of non-adherence
72
To conclude, we tested an extensive number of potential risk factors of non-adherence with immunosuppressive medication in adult kidney transplant patients on a stable medication regimen, and found a number of variables useful in detecting non-adherence or enhancing adherence. Higher self-efficacy, pill box use, being female, and being in the beginning of the work week were unequivocally associated with higher adherence. Also, self-reported non-adherence proved to be useful in tracing non-adherence problems. Given the high adherence in our sample, the results of this study are especially relevant for similar drug-disease combinations, like heart transplant or HIV treatments.
Reference list 1. Denhaerynck K, Dobbels F, Cleemput I, Desmyttere A, Schafer-Keller P, Schaub S, et al.
Prevalence, consequences, and determinants of nonadherence in adult renal transplant patients: a literature review. Transpl Int 2005;18(10):1121-33.
2. Cramer JA. Microelectronic systems for monitoring and enhancing patient compliance with medication regimens. Drugs 1995;49(3):321-7.
3. Nevins TE, Kruse L, Skeans MA, Thomas W. The natural history of azathioprine compliance after renal transplantation. Kidney Int 2001;60(4):1565-70.
4. Feldman HI, Hackett M, Bilker W, Strom BL. Potential utility of electronic drug compliance monitoring in measures of adverse outcomes associated with immunosuppressive agents. Pharmacoepidemiol Drug Saf 1999;8(1):1-14.
5. Weng FL, Israni AK, Joffe MM, Hoy T, Gaughan CA, Newman M, et al. Race and electronically measured adherence to immunosuppressive medications after deceased donor renal transplantation. J Am Soc Nephrol 2005;16(6):1839-48.
6. Vlaminck H, Maes B, Evers G, Verbeke G, Lerut E, Van Damme B, et al. Prospective study on late consequences of subclinical non-compliance with immunosuppressive therapy in renal transplant patients. Am J Transplant 2004;4(9):1509-13.
8. Dobbels F, De Geest S, van Cleemput J, Droogne W, Vanhaecke J. Effect of late medication non-compliance on outcome after heart transplantation: a 5-year follow-up. J Heart Lung Transplant 2004;23(11):1245-51.
9. Cleemput I, Kesteloot K, Vanrenterghem Y, De Geest S. The economic implications of non-adherence after renal transplantation. Pharmacoeconomics 2004;22(18):1217-34.
10. Rosenberger J, Geckova AM, van Dijk JP, Nagyova I, Roland R, van den Heuvel WJ, et al. Prevalence and characteristics of noncompliant behaviour and its risk factors in kidney transplant recipients. Transpl Int 2005;18(9):1072-8.
11. Meier-Kriesche HU, Schold JD, Kaplan B. Long-term renal allograft survival: have we made significant progress or is it time to rethink our analytic and therapeutic strategies? Am J Transplant 2004;4(8):1289-95.
12. Meier-Kriesche HU, Schold JD, Srinivas TR, Kaplan B. Lack of improvement in renal allograft survival despite a marked decrease in acute rejection rates over the most recent era. Am J Transplant 2004;4(3):378-83.
13. Sabaté E. Adherence to long-term therapies: Evidence for action. Geneva: World Health Organisation; 2003.
14. Butler JA, Peveler RC, Roderick P, Smith PW, Horne R, Mason JC. Modifiable risk factors for non-adherence to immunosuppressants in renal transplant recipients: a cross-sectional study. Nephrol Dial Transplant 2004;19(12):3144-9.
15. Ghods AJ, Nasrollahzadeh D, Argani H. Risk factors for noncompliance to immunosuppressive medications in renal transplant recipients. Transplant Proc 2003;35(7):2609-11.
16. Raiz LR, Kilty KM, Henry ML, Ferguson RM. Medication compliance following renal transplantation. Transplantation 1999;68(1):51-5.
Prevalence and risk factors of non-adherence
73
17. Papajcik D, Mastroianni B, Goormastic M, Flechner SM. A tool to identify risk factors for noncompliance in the adult renal transplant recipient. Transplant Proc 1999;31(4A):84S-86S.
18. Greenstein S, Siegal B. Compliance and noncompliance in patients with a functioning renal transplant: a multicenter study. Transplantation 1998;66(12):1718-26.
19. Siegal B, Greenstein SM. Differences between compliers and partial compliers: a multicenter study. Transplant Proc 1998;30(4):1310-1.
20. Sketris I, Waite N, Grobler K, West M, Gerus S. Factors affecting compliance with cyclosporine in adult renal transplant patients. Transplant Proc 1994;26(5):2538-41.
21. Frazier PA, Davis-Ali SH, Dahl KE. Correlates of noncompliance among renal transplant recipients. Clin Transplant 1994;8(6):550-7.
22. Rovelli M, Palmeri D, Vossler E, Bartus S, Hull D, Schweizer R. Noncompliance in organ transplant recipients. Transplant Proc 1989;21(1 Pt 1):833-4.
23. De Geest S, Borgermans L, Gemoets H, Abraham I, Vlaminck H, Evers G, et al. Incidence, determinants, and consequences of subclinical noncompliance with immunosuppressive therapy in renal transplant recipients. Transplantation 1995;59(3):340-7.
24. Teixeira de Barros C, Cabrita J. Noncompliance with immunosuppressive therapy: prevalence and determinants. Transplant Proc 2000;32(8):2633.
25. Cherubini P, Rumiati R, Bigoni M, Tursi V, Livi U. Long-term decrease in subjective perceived efficacy of immunosuppressive treatment after heart transplantation. J Heart Lung Transplant 2003;22(12):1376-80.
26. Bandura A. Self-efficacy: The exercise of control. New York: W.H. Freeman; 1997. 27. Reyna L. The Debate Continues Cognition, Behavior and Causality: A Broad Exchange of
Views Stemming from the Debate on the Causal Efficacy of Human Thought: Introduction. Journal of Behavior Therapy and Experimental Psychiatry 1996;27(4):321.
28. Leventhal H, Diefenbach M, Leventhal EA. Illness cognition: Using common sense to understand treatment adherence and affect cognition interactions. Cognit Ther Res 1992;16(2):143-163.
29. Yavuz A, Tuncer M, Gurkan A, Demirbas A, Suleymanlar G, Ersoy F, et al. Cigarette smoking in renal transplant recipients. Transplant Proc 2004;36(1):108-10.
30. Wagner GJ, Ryan GW. Relationship between routinization of daily behaviors and medication adherence in HIV-positive drug users. AIDS Patient Care STDS 2004;18(7):385-93.
31. Park DC, Hertzog C, Leventhal H, Morrell RW, Leventhal E, Birchmore D, et al. Medication adherence in rheumatoid arthritis patients: older is wiser. J Am Geriatr Soc 1999;47(2):172-83.
32. Yavuz A, Tuncer M, Erdogan O, Gurkan A, Cetinkaya R, Akbas SH, et al. Is there any effect of compliance on clinical parameters of renal transplant recipients? Transplant Proc 2004;36(1):120-1.
33. Wagner GJ. Does discontinuing the use of pill boxes to facilitate electronic monitoring impede adherence? Int J STD AIDS 2003;14(1):64-5.
34. Butkus DE, Meydrech EF, Raju SS. Racial differences in the survival of cadaveric renal allografts. Overriding effects of HLA matching and socioeconomic factors. N Engl J Med 1992;327(12):840-5.
35. Glass TR, De Geest S, Weber R, Vernazza PL, Rickenbach M, Furrer H, et al. Correlates of Self-Reported Nonadherence to Antiretroviral Therapy in HIV-Infected Patients The Swiss HIV Cohort Study. Epidemiology and social science In press.
36. Liu H, Golin CE, Miller LG, Hays RD, Beck CK, Sanandaji S, et al. A comparison study of multiple measures of adherence to HIV protease inhibitors. Ann Intern Med 2001;134(10):968-77.
37. De Geest S, Denhaerynck K, Schäfer-Keller P, Bock A, Steiger J. Supporting Medication Adherence in Renal Transplantation - the SMART study. Swiss Medical Weekly In press.
38. Fierz K, Steiger J, Denhaerynck K, Bock A, De Geest S. Prevalence, severity and correlates of alcohol use in renal transplant patients. Clinical transplantation In press.
39. Vrijens B, Goetghebeur E. Comparing compliance patterns between randomized treatments. Control Clin Trials 1997;18(3):187-203.
Prevalence and risk factors of non-adherence
74
40. Arnet I, Haefeli WE. Overconsumption detected by electronic drug monitoring requires subtle interpretation. Clin Pharmacol Ther 2000;67(1):44-7.
41. Deschamps AE, Graeve VD, van Wijngaerden E, De Saar V, Vandamme AM, Van Vaerenbergh K, et al. Prevalence and correlates of nonadherence to antiretroviral therapy in a population of HIV patients using Medication Event Monitoring System. AIDS Patient Care STDS 2004;18(11):644-57.
42. De Geest S, Abraham I, Gemoets H, Evers G. Development of the long-term medication behaviour self-efficacy scale: qualitative study for item development. J Adv Nurs 1994;19(2):233-8.
43. Martin M, Park DC. The Martin and Park Environmental Demands (MPED) Questionnaire: psychometric properties of a brief instrument to measure self-reported environmental demands. Aging Clin Exp Res 2003;15(1):77-82.
44. Schreurs PJ, Tellegen B, Willige GV. Gezondheid, stress en coping: de ontwikkeling van de Utrechtse coping-lijst [Health, stress and coping: The development of the Utrechtse Coping Scale]. Gedrag:-Tijdschrift-voor-Psychologie 1984;12(1-2):101-117.
45. Denhaerynck K, Abraham I, Gourley G, Drent G, De Vleeschouwer P, Papajcik D, et al. Validity testing of the Long-Term Medication Behavior Self-Efficacy Scale. J Nurs Meas 2003;11(3):267-82.
46. Beck AT, Ward CH, Mendelson M, Mock J, Erbaugh J. An inventory for measuring depression. Archives of General Psychiatry 1961;4:561-571.
47. Hole RW, Rush AJ, Beck AT. A cognitive investigation of schizophrenic delusions. Psychiatry: Journal for the Study of Interpersonal Processes 1979;42(4):312-319.
48. Moons P, De Geest S, Versteven K, Abraham I, Vlaminck H, Moens G, et al. Psychometric properties of the "Modified Transplant Symptom Occurrence and Symptom Distress Scale". J Nurs Meas 2001;9(2):115-34.
49. Moons P, Vanrenterghem Y, Van Hooff JP, Squifflet JP, Margodt D, Mullens M, et al. Health-related quality of life and symptom experience in tacrolimus-based regimens after renal transplantation: a multicentre study. Transpl Int 2003;16(9):653-64.
50. Cramer JA, Scheyer RD, Mattson RH. Compliance declines between clinic visits. Arch Intern Med 1990;150(7):1509-10.
51. Storey JD, Tibshirani R. Statistical significance for genomewide studies. Proc Natl Acad Sci U S A 2003;100(16):9440-5.
52. Denhaerynck K, Schäfer-Keller P, Young J, Steiger J, Bock A, Köfer S, et al. Challenging electronic medication monitoring as gold standard: a test of its assumptions. Nursing research In press.
53. De Geest S, Abraham I, Moons P, Vandeputte M, Van Cleemput J, Evers G, et al. Late acute rejection and subclinical noncompliance with cyclosporine therapy in heart transplant recipients. J Heart Lung Transplant 1998;17(9):854-63.
54. Drent G, Haagsma EB, Geest SD, van den Berg AP, Ten Vergert EM, van den Bosch HJ, et al. Prevalence of prednisolone (non)compliance in adult liver transplant recipients. Transpl Int 2005;18(8):960-6.
55. Denhaerynck K, Desmyttere A, Dobbels F, Moons P, Young J, Siegal B, et al. Prevalence of noncompliance with the immnosuppressive regimen in North American and European renal transplant recipients. Progress in Transplantation In press.
56. Cerveri I, Locatelli F, Zoia MC, Corsico A, Accordini S, de Marco R. International variations in asthma treatment compliance: the results of the European Community Respiratory Health Survey (ECRHS). Eur Respir J 1999;14(2):288-94.
57. Bleyer AJ, Hylander B, Sudo H, Nomoto Y, de la Torre E, Chen RA, et al. An international study of patient compliance with hemodialysis. Jama 1999;281(13):1211-3.
58. Wilson KJ, Doxanakis A, Fairley CK. Predictors for non-adherence to antiretroviral therapy. Sex Health 2004;1(4):251-7.
59. Kerr T, Marshall A, Walsh J, Palepu A, Tyndall M, Montaner J, et al. Determinants of HAART discontinuation among injection drug users. AIDS Care 2005;17(5):539-49.
60. Bandura A. Toward a Unifying Theory of Behavioral Change. Psychological Review 1977;84:191-215.
Prevalence and risk factors of non-adherence
75
61. Kalichman SC, Cain D, Cherry C, Kalichman M, Pope H. Pillboxes and antiretroviral adherence: prevalence of use, perceived benefits, and implications for electronic medication monitoring devices. AIDS Patient Care STDS 2005;19(12):833-9.
62. Golin CE, Liu H, Hays RD, Miller LG, Beck CK, Ickovics J, et al. A prospective study of predictors of adherence to combination antiretroviral medication. J Gen Intern Med 2002;17(10):756-65.
63. Chang JS, Jr., Lee DA, Petursson G, Spaeth G, Zimmerman TJ, Hoskins HD, et al. The effect of a glaucoma medication reminder cap on patient compliance and intraocular pressure. J Ocul Pharmacol 1991;7(2):117-24.
64. Laster SF, Martin JL, Fleming JB. The effect of a medication alarm device on patient compliance with topical pilocarpine. J Am Optom Assoc 1996;67(11):654-8.
65. Sclar DA, Skaer TL, Chin A, Okamoto MP, Nakahiro RK, Gill MA. Effectiveness of the C Cap in promoting prescription refill compliance among patients with glaucoma. Clin Ther 1991;13(3):396-400.
66. Heneghan CJ, Glasziou P, Perera R. Reminder packaging for improving adherence to self-administered long-term medications. Cochrane Database Syst Rev 2006(1):CD005025.
67. Schäfer-Keller P, Steiger J, Denhaerynck K, Bock A, De Geest S. Using electronic monitoring as reference standard: how well do state of measurement methods measure medication adherence in kidney transplant recipients. American Journal of Transplantation 2005;5(Suppl. 11):S331.
68. Carroll CL, Feldman SR, Camacho FT, Manuel JC, Balkrishnan R. Adherence to topical therapy decreases during the course of an 8-week psoriasis clinical trial: commonly used methods of measuring adherence to topical therapy overestimate actual use. J Am Acad Dermatol 2004;51(2):212-6.
69. Butler JA, Peveler RC, Roderick P, Horne R, Mason JC. Measuring compliance with drug regimens after renal transplantation: comparison of self-report and clinician rating with electronic monitoring. Transplantation 2004;77(5):786-9.
70. Vasquez EM, Tanzi M, Benedetti E, Pollak R. Medication noncompliance after kidney transplantation. Am J Health Syst Pharm 2003;60(3):266-9.
71. Artz MA, Boots JM, Ligtenberg G, Roodnat JI, Christiaans MH, Vos PF, et al. Conversion from cyclosporine to tacrolimus improves quality-of-life indices, renal graft function and cardiovascular risk profile. Am J Transplant 2004;4(6):937-45.
Non-adherence differences between countries
77
5. NON-ADHERENCE WITH IMMUNOSUPPRESSIVE DRUGS IS HIGHER IN NORTH AMERICAN COMPARED TO EUROPEAN RENAL TRANSPLANT PATIENTS
Kris Denhaerynck, Ariane Desmyttere, Fabienne Dobbels, Philip Moons, Jim Young, Bonita Siegal, Stuart Greenstein, Jürg Steiger, Yves Vanrenterghem, Jean-Paul Squifflet, Johannes P. Van Hooff, Sabina De Geest In press: Progress in Transplantation
Non-adherence differences between countries
78
5.1. Introduction
Non-adherence with immunosuppressive medication negatively impacts clinical and economical outcomes in renal transplantation and has therefore become under increased scrutiny 1-14. A recent comprehensive review from our group on non-adherence in renal transplantation 12 reports that the prevalence of non-adherence with immunosuppressive drugs ranges from 2% to 67% depending on the case finding methods, measurement methods, and operational definitions used. The weighted mean of non-adherence with immunosuppressive drugs over different publications is 27.7%. Non-adherence is an etiological factor in 16.3% of the graft losses and 19.9% of the late acute rejections in renal transplant recipients 12. Studying underlying dynamics and factors linked to non-adherence with immunosuppressive drugs in renal transplantation provides important information to develop strategies to identify patients at risk and develop adherence enhancing interventions. Correlates, determinants or risk factors for non-adherence can be categorized using the recently published WHO taxonomy. This taxonomy consists of 5 groups of factors: (1) socio-demographic factors, (2) patient related factors, (3) condition related factors, (4) treatment related factors and (5) health care team and health care system related factors 11. The relationship between the 4 first categories and non-adherence with the immunosuppressive regimen has been explored to some extent in transplant populations 12 13 15. Yet, the last category of health care team and health care system related factors has received limited attention so far.
System factors can be explored at the micro, meso and macro level. The micro level refers to patient-provider interaction such as for instance the quality of the patient provider relationship and communication style. The relationship between the health care provider and the patient is an overlooked variable when trying to understand non-adherence in transplant populations. To our knowledge, only Wolff et al. 16 identified barriers for effective patient provider interaction in view of adherence in a qualitative study focusing on pediatric transplant recipients. More specifically, they identified following risk factors for non-adherence: insufficient information regarding health and treatment (40%); no communication about non-adherence (34%); health care providers have given up and rendered the responsibility for non-adherence to the patient (34%); loss of trust in doctors (33%); feeling of not being taken seriously (24%); patients do not want to bother health care providers or health care providers do not want to be called in case of questions (21%); and loss of praise for adherence achievements (20%)16.
System factors at the meso level relate to characteristics of the transplant center. A center-specific effect in view of clinical outcome was observed among European heart transplant centers17, although this finding has not been confirmed in lung transplant centers18. Weng et al19 observed a center effect in view of prevalence of non-adherence with immunosuppressive drugs among renal transplant centers participating in a multi-site study. Non-adherence was assessed by electronic monitoring, and analyses were controlled for other potential influencing factors. Yet, these authors did not explore potential underlying dynamics explaining this center effect, such as for instance the provision of continuity of care, the skill mix of teams, time pressures and time constraints of overworked health care providers and support of health care providers to patients in view of self management and behavioral support 11 20. There are indeed some indications in the transplant literature showing that lack of continuity
Non-adherence differences between countries
79
of care and decreased supervision were positively related with higher non-adherence. More specifically, distance from the transplant center 21-24 and not being under direct supervision of the transplant team 25 26 were found to be positively correlated with non-adherence. Wolff et al. 16 also found that lack of time of health care provider was perceived as a risk factor for non-adherence in pediatric renal transplant patients.
Variability of prevalence rates in view of non-adherence with the immunosuppressive regimen among health care systems suggests that factors at the macro level might also be associated with non-adherence. More specifically, prevalences of non-adherence with immunosuppressive therapy in studies including European patients range from 13% to 36% 3 4, and studies including US patients range from 2% to 55% 1
9 21 27-33, respectively. These data suggest a somewhat higher level of non-adherence in US patients. However, the wide variety in methodologies used prevents firm conclusions. Further research is needed to substantiate if being a patient in the US is indeed associated with a higher probability of being non-adherent compared to being a patient in Europe.
The purpose of this study was therefore twofold: 1) to assess if there exists a difference in the prevalence of self-reported non-adherence with immunosuppressive regimen between European and North American kidney transplant recipients, and 2) to explore differences in prevalence of non-adherence among recipients of different European countries. This study thus focuses on the macro level of system factors by exploring possible variation among different health care systems.
5.2. Methodology
5.2.1. Design and sample
This descriptive comparative study pooled data from 3 independently performed, yet methodologically similar cross-sectional, descriptive, multi-center studies conducted in North America 32 34 and Western Europe (Belgium / The Netherlands and Switzerland) 35 36, respectively. Data collection for the North-American study was performed between June 1995 and December 1995, in 56 U.S. renal transplant centers 32. Patients were 18 years or older, taking cyclosporine, and having a functioning renal graft. Of the 3000 renal transplant recipients approached, 1563 (52.1%) returned valid questionnaires. Data collection for the Belgian / Dutch study took place during the period December 1999 to December 2000, in three renal transplant centers: two in Belgium (the University Hospitals of Leuven and the University Hospital St-Luc in Brussels) and one in the Netherlands (the Academic Hospital of Maastricht). This study was part of a wider investigation on quality of life of renal transplant recipients 35. Patients in this study were all 18 years or older, Dutch- or French-speaking, literate, at least 6 months post-transplant, taking immunosuppressive drugs including tacrolimus for at least 6 months, and being followed-up at one of the participating transplant centers. Exclusion criteria were re-transplantation and multiple organ transplantation. Of the 350 patients approached, 272 (77.7%) returned valid questionnaires. Data collection for the Swiss study (SMART) took place from June 2001 to December 2004 in the Kantonsspital Aarau and the University Hospital Basel 36. This study assessed subclinical non-adherence with the immunosuppressive regimen in adult renal transplant recipients who were at least 1 year post-transplantation, 18 years or older, literate, French- or German-speaking, and receiving post-transplant follow-up at one of
Non-adherence differences between countries
80
the participating centers. Exclusion criteria were patients being unable to read the questionnaires when using glasses, lack of mental clarity and not being able to manage the medication independently. Of the 413 eligible patients, 342 (82.8%) patients gave informed consent and returned valid questionnaires.
5.2.2. Variables and measurement methods
All three studies used similar methodology to assess non-adherence with the immunosuppressive regimen 32. Non-adherence was assessed by self-report using one item from the Siegal scale 37 assessing the taking dimension of medication taking. Patients scored how often in the past four weeks they had not taken their immunosuppressive drugs on a 5-point Likert scale ranging from 'never forgotten' (score 0) to 'forgotten every day' (score 5). Because the distribution of answer patterns was skewed, answers were dichotomized. Patients reporting ‘never forgotten’ their immunosuppressive drugs during the last 4 weeks (score 0) were considered to be adherent similar to the scoring of the original Siegal scale37. Patients were considered to be non-adherent if they forgot their immunosuppressive medication at least once during the past four weeks (score 1-5) 32. This admittedly stringent definition of non-adherence was based on the well known underreporting of non-adherence associated with self-report 38. Moreover, evidence from the renal and the heart transplant population shows that already minor deviations from dosing schedule are associated with an increased risk for poor clinical outcome 9 39, substantiating the choice of this stringent cut-off. No validity, reliability or diagnostic value of the Siegal scale has been reported by the researchers who developed the instrument. Our research group assessed the diagnostic value of the 4 item Siegal scale in the Swiss adherence study in renal transplantation36 using electronic monitoring as gold standard 40. Non-adherence as assessed with the 4–item Siegal scale was defined as any deviation from perfect adherence on 1 of the 4 items. Diagnostic values were following: sensitivity: 25.7%; specificity 89.6%; Likelihood ratio of a positive test result: 2.5 and area under the curve was 0.576 40. These results show the well known characteristics of self-report measures of non-adherence in that they underreport non-adherence 41.
In addition to non-adherence, selected demographic (i.e. gender, age and level of education) and clinical variables (i.e. number of transplants received, type of donor, months post-transplantation, and presence of diabetes mellitus), were also recorded. The operational definition of educational level needed to be standardized between European and U.S. patients. This was done by categorizing patients as those with ‘very low educational level' referring to a less-than-high school educational level; 'low educational level' meaning a high school education; and 'medium / high educational level' referring to a post-high school or professional degree 40. Since the sample included patients speaking French, Dutch and German, the original English questionnaire was translated in these respective languages using the adapted Brislin protocol 41.
5.2.3. Data collection
In all three studies, patients were approached by a member of the research team either during an outpatient clinic follow-up appointment or by phone. The questionnaires were filled out by the patient at home and sent back in pre-stamped
Non-adherence differences between countries
81
and pre-addressed envelopes. All three studies had been approved by the respective local ethics committees.
5.2.4. Data analysis
Demographic and clinical characteristics, and prevalence of non-adherence were summarized for the respective samples using appropriate descriptive measures based on the measurement level and the distribution of the respective variables. Univariable analyses used to compare renal transplant recipients regarding the demographic and clinical factors and non-adherence were chi-square test and student t-test as appropriate. These analyses were performed using the statistical program SPSS, version 9.0 for Windows. Level of significance was set at 0.05.
In order to discuss the independent effect of continent on prevalence of non-adherence, multivariable analysis was performed using logistic regression with a single random effect. For this analysis, patients within each center were assumed to be correlated, whereas data from patients from different centers were assumed to be independent observations. To model the probability of patient non-adherence, ‘mixed’ models were used with center as a random effect and all other predictors as fixed effects. These models were fit using the NLMIXED procedure in SAS version 8.1 (SAS Institute Inc., Cary, NC), with optimization by a conjugate gradient method. A multiple logistic regression fit without center as an effect was used to provide suitable starting values for optimizing the mixed model with center as a random effect.
5.3. Results
5.3.1. Demographic and clinical characteristics in European and U.S. samples
European and American patients differed on most demographic and some clinical characteristics (table 1). More specifically, the U.S. sample was younger, had a higher percentage of females, was better educated, and comprised a higher proportion of patients with more than one transplant than the European sample (table 1). Furthermore, U.S. patients had a shorter post-transplant status compared to European patients, and a higher proportion suffered from diabetes mellitus. The type of donor was similar for both U.S. and European patients.
5.3.2. Non-adherence in European compared to U.S. patients
In the European sample, 13.2% of respondents reported medication non-adherence in the last four weeks compared to 19.3% of U.S. respondents (p<0.001). Because differences between groups, the following demographic and clinical factors (table 1) were controlled for in multivariable analyses: gender, age, educational level, number of transplants received, type of donor, presence of diabetes mellitus, and time post-transplantation. A mixed model using center as a random effect and all other factors as fixed effects showed higher non-adherence with immunosuppressive drugs in U.S patients compared to European patients (OR=1.78; 95%CI: 1.10-2.89; p=0.019) (table 2).
Non-adherence differences between countries
82
Table 1: Demographic and clinical variables in the European versus the U.S. sample.
Number of transplant %1st renal transplant % >1 renal transplant
93.6% 6.4%
88.0% 12.0%
0.002 (∗)
Type of donor: % Living donor
26.2%
24.2%
0.318 (∗)
Diabetes mellitus: % Diabetes
15.3%
29.4%
<0.001 (∗)
Time post-TX (months): Mean ± SD
64.20 ± 67.25
36.2 ± 32.4
<0.001 (°)
Immunosuppressives % Cyclosporine % Tacrolimus % Other
37.1% 54.7% 8.2%
100.0%
<0.001(▫)
Non-adherence % Non-adherent
13.2%
19.3%
<0.001 (*)
(∗) = chi-square, (°) = student t test, (▫) = Fisher exact test Table 2: Comparison of non-adherence in the European versus the U.S. sample: logistic regression: Adjusted Odd’s Ratios (95% Confidence Intervals).
AOR (95% CI) (*)
Interpretation: Adherence is higher in patients who…
p-value
Gender 1.08 (0.84-1.38) - 0.5455 Age 1.03 (1.02-1.04) Are older <.0001 Educational level 0.86 (0.69-1.06) - 0.1568 Number of transplant 0.93 (0.68-1.28) - 0.6586 Type of donor 0.59 (0.45-0.79) Have cadaveric grafts 0.0006 Diabetes mellitus 1.33 (0.98-1.80) Have diabetes mellitus 0.0648 Time post-transplantation 0.99 (0.99-1.00) Are recently transplanted 0.0001 Continent 1.78 (1.10-2.89) Are European 0.0190 Random effects variance 1.13 (0.99-1.29) - 0.0685 Intercept 1.20 (0.42-3.43) - 0.7340
5.3.3. Comparison of non-adherence among European renal transplant patients
Comparison of clinical and demographic factors revealed that Belgian, Dutch and Swiss renal transplant patients differed in view of educational level, number of transplants received, percentage of living donor and time since transplantation (table 3). Table 3: Demographic and clinical variables in the European countries (Belgium, the Netherlands and Switzerland).
Number of transplant %1st renal transplant % >1st renal transplant
100.0% 0.0%
100.0% 0.0%
88.4% 11.6%
<0.001 (*)
Type of donor: % Living donor
1.6%
18.8%
42.1%
<0.001 (*)
Diabetes mellitus: % Diabetes
15.0%
20.0%
14.3%
0.425 (*)
Time post-TX (months): Mean ± SD
25.4 ±28.8
29.8 ±26.7
93.7 ±73.8
<0.001(°)
Non-adherence % Non-adherent
16.0%
14.1%
11.4%
0.314 (*)
(∗) = chi-square, (°) = one way ANOVA
Univariable analyses revealed no significant differences between non-adherence in the European countries: 16.0% in Belgium, 14.1% in the Netherlands and 11.4% in Switzerland respectively (chi-square, p=0.314). Given the differences in patient and clinical characteristics (table 3), additional logistic regression analyses compared the European countries in view of non-adherence (table 4), showing greater non-adherence in Belgium as compared to the Netherlands (OR=0.27; 95%CI: 0.09-0.80; p=0.0186) and to Switzerland (OR=0.17; 95%CI: 0.07-0.42; p=0.0001), but no differences were seen between Dutch and Swiss patients (OR=0.61; 95%CI:0.20-1.92; p=0.4010) (table 4).
Non-adherence differences between countries
84
Table 4: Comparison of non-adherence in the European countries (Belgium, the Netherlands, Switzerland): logistic regression: Adjusted Odd’s Ratios (95% Confidence Intervals).
AOR (95% CI) (*)
Interpretation: Adherence is higher in patients who…
p-value
Gender 1.40 (0.78-2.51) - 0.2558 Age 1.00 (0.98-1.03) - 0.6947 Educational level 1.09 (0.72-1.67) - 0.6783 Number of transplant 1.70 (0.45-6.38) - 0.4309 Type of donor 0.27 (0.12-0.61) Have cadaveric grafts 0.0017 Diabetes mellitus 1.75 (0.66-4.61) - 0.2576 Time post-transplantation 0.99 (0.99-1.00) Are recently transplanted <.0001 Belgium versus the Netherlands
0.27 (0.09-0.80) Are Dutch 0.0186
Belgium versus Switzerland 0.17 (0.07-0.42) Are Swiss 0.0001 The Netherlands versus Switzerland
To our knowledge, this is the first study that assessed if health care system related correlates at the macro level are associated with non-adherence with immunosuppressive drugs in transplantation. This study pooled findings from studies with similar methodology and showed that non-adherence is higher in North-American compared to European patients 1 9 21 27-33. Moreover, variability was observed in non-adherence rates among European countries, with Belgium showing higher non-adherence in multivariable analysis.
Limited other empirical evidence of non-transplant populations confirms the higher prevalence of non-adherence in U.S. patients. Using structured interviews, Cerveri et al. 42 compared non-adherence between U.S., Dutch and Belgian patients, and found a significantly higher level of adherence in Belgian and Dutch patients compared to U.S. patients 42. A comparison of appointment non-adherence between U.S., Japanese and Swedish hemodialysis patients also found higher non-adherence rates in the U.S. population 43. Hecking et al. 44 compared non-adherence rates among European dialysis patients in France (20 units-672 pts), Germany (21-571), Italy (20-600), Spain (20-576), UK (20-620) in view of skipping or shortening behavior of dialysis sessions. Variability in non-adherence rates were found (skipping: France: 0.3%, Germany: 0.9%, Italy: 8.8%, Spain: 6.6%, UK: 12.6%; shortening France: 7.3%, Germany: 9.5%, Italy: 8.8%, Spain: 6.6%, UK: 12.6%). Unfortunately, this study did not include one of the countries we studied.
The question that emerges when observing this variability in adherence rates among countries is which potential underlying dynamics at the macro level might explain this variability of non-adherence? It could be hypothesized that differences in health care system characteristics, such as for instance health insurance coverage and regulations on the reimbursement of (immunosuppressive) drugs or medical treatment, might be
Non-adherence differences between countries
85
important for the observed higher rate in non-adherence between the US and Europe. The importance of health insurance as a potential influencing factor in view of non-adherence was already suggested by Butkus et al., showing that non-adherence was higher in black uninsured renal transplant patients in the US 33. European countries have compulsory health insurance with provides easier access and equity in care. Moreover, the reimbursement of immunosuppressive drugs, even long-term after transplantation, is more favorable, with some countries completely reimbursing immunosuppressive drugs (Belgium & the Netherlands) and other countries requiring a limited percentage of co-payments (Switzerland). This is quite different from the US health care system where financial problems have been identified as the most important factor in non-adherence in heart transplant recipients 45 46. Yet, an increasing number of patients in Europe also report that the financial burden becomes heavier as the medication regimen (other drugs) and follow-up after transplantation necessitates co-payments. In a study in Switzerland 19% of the patients reported that did not have enough finances to pay the medication (SMART study, unpublished findings 22). Explaining possible dynamics among European countries is more challenging given that the health care systems are more similar. One could speculate that trans-cultural factors, especially with regard to specific illness beliefs, might differ among patients from different countries. Previous work in the US and Switzerland showed the importance of these health beliefs as a correlate of non-adherence 32 36.
Future research should try to further elucidate which system factors at micro, meso and macro level are important in explaining non-adherence with immunosuppressive drugs in transplant populations. Attention should also be given at unraveling the underlying dynamics. This information is crucial to develop and implement adherence enhancing interventions. More specifically, information concerning the relative importance of patient-provider relationship, overworked health care providers, weak capacity of system to educate and follow-up patients, and limited community support provides clue in this direction. A more pronounced focus on system factors in developing adherence enhancing interventions is also suggested by the chronic illness literature indicating that providing care within an acute care model to a chronic patient population results in poor outcomes and higher costs 11 47. It has been argued that system change towards a chronic care model that integrates medical, psychosocial and behavioral dimensions of transplant management, that guarantees continuity of care, that places a strong emphasis on patient’s active role and adequate self-management and that employs health care workers who have the necessary skills for behavioral management results in favorable patient outcomes 11 47.
5.5. Limitations of the study
Some limitations of this study merit discussion. From a methodological point of view, it needs to be mentioned that we pooled data of studies differencing in the timing of data collection, inclusion and exclusion criteria, and response rates. The fact that the Belgian / Dutch study included renal transplant patients with a minimum of 6 months after their first transplantation only, while the Swiss study included all renal transplant patients minimum 1 year post-transplant and the U.S. study included simply all transplant recipients with a functioning graft, explains both the difference in number of transplants received and the difference in time after transplantation. Differences in type of donor among countries confirm the known differences in living related donation in different countries 48. Yet, when controlling for these differences in multivariable analysis, the differences in non-adherence persisted.
Non-adherence differences between countries
86
We do not think that the different data collection points in the three pooled studies have influenced our findings. Adherence seems rather stable over time in the absence of intervention 11, and therefore we do not expect that the different data collection periods will have introduced a major bias into the current study. A different time of data collection will certainly involve differences in prescribed immunosuppressive medication. It is not expected that the use of different immunosuppressive medication had an influence on adherence levels in the respective studies. However, further research is needed to explore the relationship between adherence behavior and the type of immunosuppressive medication. Concerning differences in response rates, we could hypothesize that the lower response rate in the U.S. sample hides in fact even a higher prevalence of non-adherence, as non-adherent patients might have been unwilling to participate in the study.
A further limitation of this study is that non-adherence was measured by self-report, which is known to underestimate non-adherence, because of memory bias and / or untruthful answer patterns 41,51. Self-report also does not allow the detection of patterns of medication taking behavior; this is in contrast to the more reliable electronic event monitoring 49. Observed differences in non-adherence could be due to differences in the willingness of U.S. and European patients to disclose non-adherence by self-report, yet, there is no empirical evidence available to support this hypothesis to date, neither in transplant nor in non-transplant patient populations.
We used a single item of the 4 item Siegal scale as only this item was used in all three studies we pooled. This item assessed the most important dimension of medication taking behavior. Admittedly, we can not report specific validity data for this single item. As mentioned above we did preliminary validation work for the 4 item scale using electronic monitoring as gold standard as part of the Swiss renal transplant study40. Future work could focus on determinening the diagnostic value of the separate and combined items of the Siegal scale. It is perhaps important to mention our finding that a conglomerate measure of non-adherence with the immunosuppressive regimen combining information of self-report, collateral report of the clinicians and assay showed the best validity using electronic monitoring as gold standard 40. This finding is congruent with a recent review on adherence to medication 41. The feasibility of using such a conglomerate measure or even better using electronic monitoring is however limited in large scale adherence studies. In these large scale studies a trade off needs to be found between feasibility and accuracy of measurement. Our experience with adherence assessment as part of the Swiss HIV cohort study might be illustrative in this regard 52. We assessed non-adherence using two self report items in 3607 patients. One item assessed the taking dimension of medication taking, the second the presence of drug holidays. Definition of non-adherence was similar to our transplant study, i.e. at least 1 dose missed in the past 4 weeks. We could establish validity based on a strong correlation between the taking adherence item and the proportion of patients virally suppressed in the past 6 months 52.
A next limitation of our study is the lack of variation of our sample with regard to the number of included centers in Europe, the used immunosuppressive regimens (due to inclusion criteria in the US, Belgian and Dutch studies), and the inclusion of patients from different ethnic origins in the European samples (due to language related inclusion criteria). This prevented us to control for immunosuppressive regimen and ethnic origin. Since the literature suggests that non-adherence is higher in non-white kidney transplant patients 1 21 30 50, this may have led to an underrepresentation of persons with a low income and socio-economic status in our sample, factors known to
Non-adherence differences between countries
87
be associated with non-adherence behavior 11. It would, with regard to enhancing sample representativeness, be worthwile to include more individuals of foreign origin in future European studies.
5.6. Conclusion
To our knowledge, our study is the first demonstrating a higher probability of US renal transplant recipients to be non-adherent compared to European patients, suggesting macro level dynamics influencing non-adherence. The differences point to the potential importance of health care systems or other system factors in explaining non-adherence behavior. Hypothesized pathways through which the health care system might influence adherence are at the policy level (macro level) as well as at the organizational level (meso and micro level). Future research is needed investigating these pathways that might explain differences in non-adherence with immunosuppressive medication.
Reference list 1. Schweizer RT, Rovelli M, Palmeri D, Vossler E, Hull D, Bartus S. Noncompliance in organ
transplant recipients. Transplantation 1990;49(2):374-7. 2. Hong JH, Sumrani N, Delaney V, Davis R, Dibenedetto A, Butt KM. Causes of late renal
allograft failure in the ciclosporin era. Nephron 1992;62(3):272-9. 3. De Geest S, Borgermans L, Gemoets H, Abraham I, Vlaminck H, Evers G, et al. Incidence,
determinants, and consequences of subclinical noncompliance with immunosuppressive therapy in renal transplant recipients. Transplantation 1995;59(3):340-7.
5. Wainwright SP, Gould D. Non-adherence with medications in organ transplant patients: a literature review. J Adv Nurs 1997;26(5):968-77.
6. Michelon T, Dominguez V, Losekan A, Messias A, Bruno R, Bittar A, et al. Kidney graft failure due to noncompliance. Transplant Proc 1999;31(7):3031-2.
7. Bunzel B, Laederach_Hofmann K. Solid organ transplantation: are there predictors for posttransplant noncompliance? A literature overview. Transplantation 2000;70(5):711-6.
8. Laederach-Hofmann K, Bunzel B. Noncompliance in organ transplant recipients: a literature review. Gen Hosp Psychiatry 2000;22(6):412-24.
9. Nevins TE, Kruse L, Skeans MA, Thomas W. The natural history of azathioprine compliance after renal transplantation. Kidney Int 2001;60(4):1565-70.
10. Chisholm MA. Issues of adherence to immunosuppressant therapy after solid-organ transplantation. Drugs 2002;62(4):567-75.
11. Sabaté E. Adherence to long-term therapies: Evidence for action. Geneva: World Health Organisation, 2003.
12. Denhaerynck K, Dobbels F, Cleemput I, Desmyttere A, Schafer-Keller P, Schaub S, et al. Prevalence, consequences, and determinants of nonadherence in adult renal transplant patients: a literature review. Transpl Int 2005;18(10):1121-33.
13. Desmyttere A, Dobbels F, Cleemput I, De Geest S. Noncompliance with immunosuppressive regimen in organ transplantation: is it worth worrying about? Acta Gastroenterol Belg 2005;68(3):347-52.
14. Cleemput I, Kesteloot K, Vanrenterghem Y, De Geest S. The economic implications of non-adherence after renal transplantation. Pharmacoeconomics 2004;22(18):1217-34.
15. De Geest S, Dobbels F, Fluri C, Paris W, Troosters T. Adherence to the therapeutic regimen in heart, lung, and heart-lung transplant recipients. J Cardiovasc Nurs 2005;20(5 Suppl):S88-98.
16. Wolff G, Strecker K, Vester U, Latta K, Ehrich JH. Non-compliance following renal transplantation in children and adolescents. Pediatr Nephrol 1998;12(9):703-8.
Non-adherence differences between countries
88
17. Smits JM, De Meester J, Deng MC, Scheld HH, Hummel M, Schoendube F, et al. Mortality rates after heart transplantation: how to compare center-specific outcome data? Transplantation 2003;75(1):90-6.
18. Smits JM, Mertens BJ, Van Houwelingen HC, Haverich A, Persijn GG, Laufer G. Predictors of lung transplant survival in eurotransplant. Am J Transplant 2003;3(11):1400-6.
19. Weng FL, Israni AK, Joffe MM, Hoy T, Gaughan CA, Newman M, et al. Race and electronically measured adherence to immunosuppressive medications after deceased donor renal transplantation. J Am Soc Nephrol 2005;16(6):1839-48.
20. Bodenheimer T, Wagner EH, Grumbach K. Improving primary care for patients with chronic illness. Jama 2002;288(14):1775-9.
21. Didlake RH, Dreyfus K, Kerman RH, Van Buren CT, Kahan BD. Patient noncompliance: a major cause of late graft failure in cyclosporine-treated renal transplants. Transplant Proc 1988;20(3 Suppl 3):63-9.
22. Dunn J, Golden D, Van Buren CT, Lewis RM, Lawen J, Kahan BD. Causes of graft loss beyond two years in the cyclosporine era. Transplantation 1990;49(2):349-53.
23. Rodriguez A, Diaz M, Colon A, Santiago-Delpin EA. Psychosocial profile of noncompliant transplant patients. Transplant Proc 1991;23(2):1807-9.
24. Santiago Delpin EA, Gonzalez Z, Morales-Otero LA, Rive-Mora E, Amadeo JH, Cruz N, et al. Transplantation in Hispanics: the Puerto Rico experience. Transplant Proc 1989;21(6):3958-60.
25. Cooper. Heart transplantation: the present status of orthotopic and heterothopic heart transplantation: Boston MTP press, 1984.
26. Cooper DK. Orthotopic and heterotopic transplantation of the heart: the Cape Town experience. Ann R Coll Surg Engl 1984;66(4):228-34.
27. Kiley DJ, Lam CS, Pollak R. A study of treatment compliance following kidney transplantation. Transplantation 1993;55(1):51-6.
28. Raiz LR, Kilty KM, Henry ML, Ferguson RM. Medication compliance following renal transplantation. Transplantation 1999;68(1):51-5.
29. Rovelli M, Palmeri D, Vossler E, Bartus S, Hull D, Schweizer R. Noncompliance in renal transplant recipients: evaluation by socioeconomic groups. Transplant Proc 1989;21(6):3979-81.
30. Rovelli M, Palmeri D, Vossler E, Bartus S, Hull D, Schweizer R. Noncompliance in organ transplant recipients. Transplant Proc 1989;21(1 Pt 1):833-4.
31. Sketris I, Waite N, Grobler K, West M, Gerus S. Factors affecting compliance with cyclosporine in adult renal transplant patients. Transplant Proc 1994;26(5):2538-41.
32. Greenstein S, Siegal B. Compliance and noncompliance in patients with a functioning renal transplant: a multicenter study. Transplantation 1998;66(12):1718-26.
33. Butkus DE, Meydrech EF, Raju SS. Racial differences in the survival of cadaveric renal allografts. Overriding effects of HLA matching and socioeconomic factors. N Engl J Med 1992;327(12):840-5.
34. Greenstein S, Siegal B. Evaluation of a multivariate model predicting noncompliance with medication regimens among renal transplant patients. Transplantation 2000;69(10):2226-8.
35. Moons P, Vanrenterghem Y, Van Hooff JP, Squifflet JP, Margodt D, Mullens M, et al. Health-related quality of life and symptom experience in tacrolimus-based regimens after renal transplantation: a multicentre study. Transpl Int 2003;16(9):653-64.
36. Denhaerynck K, Schäfer P, Steiger J, Bock A, De Geest S. Prevalence and correlates of nonadherence with immunosuppressive regimen in adult renal transplant recipients. American Journal of Transplantation 2005;5(Suppl 11):331.
37. Siegal B, Greenstein SM. Differences between compliers and partial compliers: a multicenter study. Transplant Proc 1998;30(4):1310-1.
38. De Geest S, Abraham I, J. D-J, J. V. Behavioral strategies for long-term survival of transplant patients. In: Métry JM, U. M, editors. Drug regimen compliance. New York: John Wiley & Sons Ltd, 1999.
Non-adherence differences between countries
89
39. De Geest S, Abraham I, Moons P, Vandeputte M, Van Cleemput J, Evers G, et al. Late acute rejection and subclinical noncompliance with cyclosporine therapy in heart transplant recipients. J Heart Lung Transplant 1998;17(9):854-63.
40. Appel SJ, Harrell JS, Deng S. Racial and socioeconomic differences in risk factors for cardiovascular disease among Southern rural women. Nurs Res 2002;51(3):140-7.
41. Jones PS, Lee JW, Phillips LR, Zhang XE, Jaceldo KB. An adaptation of Brislin's translation model for cross-cultural research. Nurs Res 2001;50(5):300-4.
42. Cerveri I, Locatelli F, Zoia MC, Corsico A, Accordini S, de Marco R. International variations in asthma treatment compliance: the results of the European Community Respiratory Health Survey (ECRHS). Eur Respir J 1999;14(2):288-94.
43. Bleyer AJ, Hylander B, Sudo H, Nomoto Y, de la Torre E, Chen RA, et al. An international study of patient compliance with hemodialysis. Jama 1999;281(13):1211-3.
44. Hecking E, Bragg-Gresham JL, Rayner HC, Pisoni RL, Andreucci VE, Combe C, et al. Haemodialysis prescription, adherence and nutritional indicators in five European countries: results from the Dialysis Outcomes and Practice Patterns Study (DOPPS). Nephrol Dial Transplant 2004;19(1):100-7.
45. Sisson S, Tripp J, Paris W, Cooper DK, Zuhdi N. Medication noncompliance and its relationship to financial factors after heart transplantation. J Heart Lung Transplant 1994;13(5):930.
46. Chisholm MA, Mulloy LL, DiPiro JT. Comparing renal transplant patients' adherence to free cyclosporine and free tacrolimus immunosuppressant therapy. Clin Transplant 2005;19(1):77-82.
47. Bodenheimer T, Wagner EH, Grumbach K. Improving primary care for patients with chronic illness: the chronic care model, Part 2. Jama 2002;288(15):1909-14.
48. Matesanz R, Miranda B. International figures on organ donation and transplantation. Transplant Newsletter 2000 1999;9:219.
49. De Geest S, Abraham I, Dunbar-Jacob J. Measuring transplant patients' compliance with immunosuppressive therapy. West J Nurs Res 1996;18(5):595-605.
50. Siegal BR, Greenstein SM. Postrenal transplant compliance from the perspective of African-Americans, Hispanic-Americans, and Anglo-Americans. Adv Ren Replace Ther 1997;4(1):46-54.
Discussion
91
6. GRAND DISCUSSION
6.1. Main considerations
Adherence to medication regimens is increasingly recognized as a requirement for optimal treatment outcomes. Particularly in people with chronic diseases, where life-long commitment to a prescribed medication therapy is a precondition for a successful treatment result, non-adherence can have detrimental health effects 2. Living with a kidney transplant is a chronic condition that requires an almost perfect adherence to the immunosuppressive therapy to prevent graft deterioration. Despite the dangers related to less than perfect adherence, many kidney recipients show non-adherence and are thus at risk for rejection episodes or graft loss 3 4.
The program of research described in this dissertation aimed primarily to investigate risk factors of non-adherence to immunosuppressive medication. In our main study, we screened a large number of non-adherence risk factors derived from literature, and used electronic monitoring (EM), the most sensitive method available to date, to assess medication non-adherence. The sample, the largest ever drawn in transplantation research on non-adherence, consisted of kidney transplant patients on stable immunosuppressive medication.
Of all tested risk factors, relatively few were significantly related to non-adherence. The ones that were (i.e., gender, weekday, self-reported adherence, self-efficacy, experiencing spots, pillbox use), showed relationships of moderate strength. The most predictive variable for non-adherence as assessed with EM was self-reported non-adherence, which can be considered as an assessment of past behavior, generally a good predictor of future behavior 5. A number of reasons may explain the failure of our study to convincingly corroborate the results of past risk factors studies to a larger extent.
Specific methodological characteristics of our study, which differed in several aspects from the typical adherence study in kidney transplantation, may provide a first explanation. We found an exceptionally high average adherence, which limited variability and therefore statistical power but also compromized the generalizability of the results (risk factors for non-adherence may differ in high-adherence compared to low-adherence samples). Moreover, unlike most other risk factor studies, adherence was assessed electronically and not by self-report, two methods known to result in different risk factor profiles when tested on identical samples 6-8. Many of the risk factor findings reported hitherto in the literature may not be reproducible in EM studies.
Second, our divergent results may be explained by the following three issues in adherence research transplantation:
1. Adherence research in transplantation declares statistical artifacts as risk factors
2. Adherence research in transplantation rarely uses behavioral theory to guide research
3. Adherence research in transplantation does not take context variables into account
Discussion
92
1. Adherence research in transplantation declares statistical artifacts as risk factors
The way statistical findings are interpreted in a large part of the transplant adherence literature is misleading. Research papers in the adherence domain seldom report the total number of tested variables, but instead, only significant findings. Because of the fact that less tests are mentioned than actually carried out, the reported degrees of freedom do not correspond to the actually expended ones, resulting in underestimated p-values and subsequently profferring scientific discoveries that are in fact sample-specific stochastic noise 9. Moreover, replication research, which allows to confirm or discard previous findings is not very common in the adherence area 6, and thus will not redress the evidence base. It is therefore advisable for future research to clearly state the total number of tests performed, and/or to make sure that type I errors do not accumulate 10 11.
2. Adherence research in transplantation rarely uses behavioral theory to guide research
Although formal theoretical frameworks explaining behavior (thus also adherence) are available from cognitive psychology, and although these could facilitate understanding the driving forces behind adherence, few studies use such theories to guide selection of risk factors. Theories frequently used in health care are the Health Belief Model 12, the Theory of Planned Behavior 13, and the Social Cognitive Theory 14 15. Recently, these three theories were integrated into an Integrative Model of Behavioral Prediction 16 (Figure 2), which states that intentions and environmental or personal constraints are the primary determinants of behavior. Intentions are in turn determined by beliefs about social norms, self-efficacy (i.e., beliefs of behavioral control), and attitudes (i.e., covert feelings of favorability or unfavorability, e.g. outcome expectancy beliefs, weighings of pros and cons). Other variables have no direct path to behavior and are called distal variables.
Fig. 2. The Integrative Model of Behavioral Prediction 16
Discussion
93
The Integrative Model of Behavioral Prediction could serve as a heuristic tool in the search for risk factors of adherence behavior. Based on this model, it can be expected that attitudes, norms, self-efficacy, or environmental/personal constraints will be the strongest risk factors and that distal variables will show less strong associations to behavior. Nevertheless, despite their diluted relationship to adherence, distal variables are the predominant focus of current adherence research. Studies that aim to determine adherence-specific beliefs and/or test if these beliefs are related to adherence are rare 17-19.
Our study included both beliefs, such as self-efficacy 15 and attitudinal beliefs (i.e., illness representations) 20 and distal variables. Self-efficacy was related to non-adherence. Attitudinal beliefs, on the contrary, were not retained in the final results, which implies that either attitudinal beliefs did not matter in explaining adherence, or that our measurement instrument did not really capture adherence-critical attitudes 19. The latter is certainly a possibility, because in contrast to the more successful Long-Term Medication Behavior Self-Efficacy Scale, which was developed based on published qualitative research 18 and was carefully validated 21, the development of the Siegal instrument, which was not based on qualitative research, has never been described in detail. It is therefore difficult to evaluate whether the Siegal scale has sufficient content validity. Because qualitative research is a proper approach for unraveling complex phenomena such as context-dependent adherence behavior 22, it may be used to map lived experiences of medication-taking in kidney transplant patients, and, hence to determine critical attitudinal obstacles to good adherence, which can form the basis of a content valid attitudes scale.
Not much qualitative research has been done on attitudes about immunosuppressives. A study by Russell et al. in kidney transplant patients investigated attitudes using semi-structured questions (n=16) 17, finding that most of patients’ negative attitudes towards immunosuppressives referred to side effects of the drugs. None of the items in our attitudes instrument assessed attitudes towards side effects. We assessed patient perceptions of symptom occurrence and symptom distress using the Modified Transplant Symptom Occurrence and Symptom Distress (MTSOSD) scale to explore the relationship between symptom experience related to side effects of immunosuppressives and adherence. We found a limited number of associations. Although the MTSOSD did not really measure attitudes, the relative lack of detected relationships possibly suggests that symptoms were not a major driving factor of adherence in our sample. Future research should be conducted, exploring whether the findings of Russell et al. are generalizable and focusing on the development of a more evidence based attitudes instrument.
Normative beliefs, another group of behavioral determinants, were not measured in our study. The qualitative study by Russell et al. also explored normative beliefs related to adherence, reporting that patients did not experience a lot of disapproval regarding immunosuppressives intake from their social environment. Although this result suggests that norms are of minor importance in explaining adherence, it has to be noted that one of the limitations of this study was that it only included adults. The effect of norms on adherence might be more relevant in adolescents. Adolescents
There is nothing as practical as a good theory – Kurt Lewin 1
Discussion
94
suffering from chronic disease are a risk group for non-adherence 23. Being normal and autonomous is important for adolescents, however, medication taking may remind them of having a chronic disease (=not being normal), induce avoidance coping and, hence, non-adherence 23. Future research could give a decisive answer.
Self-efficacy was also assessed in our study, and although it appeared as one of the most powerful predictors of non-adherence, there is probably still room for improvement in view of the explanatory power of this belief. The variability measured with the Long-term Medication Behavior Self-Efficacy scale is constrained by an apparent ceiling effect (i.e., almost all patients mark the maximum score on every item, implying that they had very high confidence in their ability to handle the presented taxing situation). The high self-efficacy noted in our study reflects the sample’s high adherence, but also the fact that items may not adequately represent the right challenges the patients face. An extensive discussion of the possible causes and remedies of this ceiling effect may be found in previous work published by our group 21.
Among the distal variables included in our study, some were significantly related to non-adherence: gender, weekday, self-reported non-adherence, graft type, busyness and pillbox use. According to the Integrative Model of Behavioral Prediction, distal variables are associated to adherence through mediation by one of the driving forces of adherence, be it beliefs or constraints. Although this study was not designed to explore the exact causal paths that link distal variables to adherence, it shed some light on the way the significant distal variables could affect adherence. Some correlated with adherence through a supposed beliefs influence, others through constraints.
1. Beliefs. A variable that showed an association to adherence through an assumed correlation with self-efficacy and/or attitudinal beliefs is ‘graft type’. Living (related) graft recipients often show a lower adherence than recipients of a deceased donor graft 19 24 25, which may reflect the fact that these persons have a lower self-efficacy and a weaker belief that immunosuppressives are important.
2. Constraints. Variables that showed an association to adherence through an assumed effect on ‘personal skills and abilities’ are ‘pillbox use’ and ‘busyness’, and probably also ‘weekday’. The most probable causal path is that ‘pillbox use’ decreases and ‘busyness’ increases a person’s appeal on memory, thereby influencing a non-intentional driver of behavior, namely forgetfulness. The path of ‘weekday’ is less obvious, but it might be related to the effect of routine in daily life (e.g. adherence is lowest during the weekend, when lives are less structured and, hence, reliance on memory is higher). An issue supporting the importance of forgetfulness as major driver of non-adherence is that patients in many studies rank forgetfulness as the most important reason for non-adherence 26-29. Likewise, 66% of patients self-reporting non-adherence in our study mentioned forgetfulness as reason. Another issue supporting the importance of constraints comes from the fact that self-efficacy showed a more convincing relationship to adherence than attitudinal beliefs (if we take for granted that the Siegal scale measured the right attitudes). Self-efficacy reflects one’s perceived ability to cope with constraints. If constraints are a major driver of non-adherence, it can indeed be expected that the confidence to adhere despite constraints (= self-efficacy) will be positively related to adherence.
Discussion
95
Thus, our findings suggest that non-intentional factors are a major driver of non-adherence. Non-intentional factors possibly explain more of adherence behavior than intentional beliefs do, which may be a reason for the observed high adherence level in our EM study. High adherence could namely reflect the relative absence of intentional non-adherence. The results of our study are therefore not automatically relevant for populations with a typically lower adherence level (e.g. hypertension patients 21). This hypothesis, that non-intentional factors are more important than intentional factors in explaining non-adherence in kidney transplantation should be investigated further.
3. Adherence research in transplantation does not take context variables into account
Context is an important but mainly neglected aspect of the daily reality in which adherence behavior takes place. In the Integrative Model of Behavioral Prediction, context is mentioned under the distal variable category ‘culture’. Culture is, however, only one aspect of context. Context refers to any higher-level variables that exert a possible influence down to the individual subject level.
An example may clarify the concept of ‘context’. In many scientific disciplines it became clear that behavior of study subjects cannot be explained well if the characteristics of the system of which they are part are neglected. In pedagogical research for instance, it has long be acknowledged that explaining achievements of pupils requires not only taking into account pupil-related variables such as intelligence, motivation, or self-efficacy, but also higher level variables like teaching style, school atmosphere, and educational system 30. These variables reflect a system’s emergent properties not reducible to individual-level characteristics. Including these emergent variables in a statistical model contributes to its explanatory power.
Health care system variables like financial burden of immunosuppressive intake for the patient, level of chronic illness management in a setting, trust in health care workers, or communication style of health care providers might impact patient behavior in much the same way as teaching style or school system do in pupils 31. Like school performance, adherence behavior is bound to and fundamentally influenced by the social environment in which it is stimulated (or not stimulated). Patients in one environment may have different contextual experiences from patients “nested” in other environments, a reality requiring design and analysis adaptations that only recently have entered the mainstream 32 33. Congruent with research in sociology, pedagogy, and economy, it is time that health research abandons the idea that patient behavior originates in a social vacuum. Statistical practice should reflect this nested social reality by involving higher level variables and use the currently available analytical techniques to fit such models.
By performing the meta-analysis reported in chapter four, our research group is among the first to carefully examine non-adherence risk factors at both the level of individual patients and the systems in which they receive their care 34. This meta-analysis needs to be regarded as a pilot project to explore the feasibility of undertaking a multi-level study on possible differences in adherence in kidney transplant patients treated in different health care systems. We are planning a multi-center study in the near future to investigate the impact of different macro- and meso-level characteristics of health care on patient adherence. This study, which will draw a clustered convenience sample of heart transplant centers in the US and Europe and will be performed in collaboration with the Center for Health Services and Nursing Research at the Catholic University of
Discussion
96
Leuven and with the International Transplant Nursing Society, will include meso-level variables like composition and skill mix of the multidisciplinary team and level of implementation of chronic illness management, communication style of the health care worker, trust in the treating physician, next to macro-level data such as hospital system, type of health insurance, or organization of the pharmacy system.
6.2. Intervention research
A better understanding of adherence, which may result from addressing the three main shortcomings of adherence research in transplantation (statistical, theoretical, and multi-level) should contribute to the development of more targeted adherence-enhancing interventions and the improvement of transplant outcomes.
Adherence intervention research is limited in transplantation. Some adherence-enhancing intervention strategies have been described 35-38. Only two studies formally tested interventions to improve adherence to immunosuppressives in the transplant population 39 40, These interventions, as well as systematic reviews summarizing intervention studies in other chronic-, and acute-care populations (meta-analyses 41 42; narrative reviews 43-45) might be used to develop future interventions. Improved adherence is a difficult goal to attain, especially for long-term medication treatments. The best results are achieved by complex approaches combining educational, cognitive behavioral, and social support interventions at multiple levels (e.g. interventions towards health care professionals or realizing changes in the health care system) over a sustained time that target more than one risk factor 43 46. Studies based on strong theory or conceptual frameworks likely will contribute to more effective adherence interventions. Few interventions are theory based. Our study used the self-efficacy concept as a conceptual basis. Using theoretical models such as the self-efficacy theory or the Integrative Model will, however, probably not be sufficient to induce behavioral change. Extending the explanatory theoretical models with evidence from behavioral change research is therefore advisable. Behavioral change models, such as the Stages of Change model 47, provide greater detail of how to get people to change their beliefs and eventually, their behavior. Attempts to combine the Integrative Model and the Stages of Change model have already been undertaken 48. Such integrations could be useful for designing future intervention programs.
6.3. Electronic medication monitoring
In addition to the main goal of this dissertation, i.e. mapping risk factors of non-adherence, we also focused on a methodological issue, namely the measurement of non-adherence. We developed a framework for validating EM, contribution to adherence research as no systematic attempt to validate the EM system has been carried out in its two decades of existence. We demonstrated the existence of an intervention effect of EM, after almost 20 years of related debate in the literature. Recent statistical techniques allowed us to map time- dependent medication dynamics in a multivariable way (i.e., generalized linear and generalized additive models). As outlined in appendix 1, there remains room for improvement in using the generalized linear model technique for longitudinal studies. A recent replication test of this intervention effect by our group in HIV patients confirmed our findings in transplant patients, thereby supporting the external validity of the results presented in this dissertation 49.
Discussion
97
Aside from the intervention effect, we also found that failing technology and mismatches between pill intakes and bottle openings may bias EM measurement. Mismatches have the farthest reaching implications for setting up future EM studies. Its bias can be largely prevented by offering patients an option to register mismatches between pill intakes and an by assessing their adherence to the EM guidelines. Patients showing major non-adherence to the EM guidelines should be excluded to prevent that missing data from not using EM are considered to reflect non-adherence. To what extent these excluded patients differ from those not excluded remains to be examined.
6.4. Final summary
Summarized, we conclude that research on risk factors of non-adherence in kidney transplantation can still be improved, both content-wise and methodologically. Research should be more guided by behavioral theory, and should consider effects of the social system in which patients are cared for. Our research group will take the lead in investigating this latter research area by setting up an international multi-center study with the goal to explore higher-level system correlates of (non-) adherence. Our hope is that this will lead to an enhanced understanding of adherence behavior, so that health care professionals get a better grip on non-adherence and its detrimental consequences.
Reference list 1. Cartwright D. Field theory in social science; selected theoretical papers. New York: Harper &
Row, 1951. 2. DiMatteo MR, Giordani PJ, Lepper HS, Croghan TW. Patient adherence and medical
treatment outcomes: a meta-analysis. Med Care 2002;40(9):794-811. 3. Desmyttere A, Dobbels F, Cleemput I, De Geest S. Noncompliance with immunosuppressive
regimen in organ transplantation: is it worth worrying about? Acta Gastroenterol Belg 2005;68(3):347-52.
4. Denhaerynck K, Dobbels F, Cleemput I, Desmyttere A, Schafer-Keller P, Schaub S, et al. Prevalence, consequences, and determinants of nonadherence in adult renal transplant patients: a literature review. Transpl Int 2005;18(10):1121-33.
5. Quelette J. Habit and intention in everyday life: The multiple processes by which past behavior predicts future behavior. Psychological-Bulletin 1998;124(1):54-74.
6. DiMatteo MR, Haskard KB. Further challenges in adherence research: measurements, methodologies, and mental health care. Med Care 2006;44(4):297-9.
7. Mathews WC, Mar-Tang M, Ballard C, Colwell B, Abulhosn K, Noonan C, et al. Prevalence, predictors, and outcomes of early adherence after starting or changing antiretroviral therapy. AIDS Patient Care STDS 2002;16(4):157-72.
8. Garber MC, Nau DP, Erickson SR, Aikens JE, Lawrence JB. The concordance of self-report with other measures of medication adherence: a summary of the literature. Med Care 2004;42(7):649-52.
9. Benjamini Y, Hochberg Y. Controlling the false discovery rate: a practical and powerful approach to multiple testing. Journal of the Royal Society. Series B (Methodological) 1995;57(1):289-300.
10. Storey JD, Tibshirani R. Statistical significance for genomewide studies. Proc Natl Acad Sci U S A 2003;100(16):9440-5.
11. Greenland S. When should epidemiologic regressions use random coefficients? Biometrics 2000;56:915-921.
12. Rosenstock IM. Historical origins of the health belief model. Health education monographs 1974;2:1-8.
13. Ajzen I. The theory of planned behavior. Organizational behavior and human decision processes 1991;50:179-211.
Discussion
98
14. Bandura A. Self-efficacy: The exercise of control. New York: W.H. Freeman, 1997. 15. Bandura A. Toward a Unifying Theory of Behavioral Change. Psychological Review
1977;84:191-215. 16. Fishbein M, Hennessy M, Yzer M, Douglas J. Can we explain why some people do and some
people do not act on their intentions? Psychology, Health, and Medicine 2003;8(1):3-18. 17. Russell CL, Kilburn E, Conn VS, Libbus MK, Ashbaugh C. Medication-taking beliefs of adult
renal transplant recipients. Clin Nurse Spec 2003;17(4):200-8; quiz 209-30. 18. De Geest S, Abraham I, Gemoets H, Evers G. Development of the long-term medication
behaviour self-efficacy scale: qualitative study for item development. J Adv Nurs 1994;19(2):233-8.
19. Greenstein S, Siegal B. Compliance and noncompliance in patients with a functioning renal transplant: a multicenter study. Transplantation 1998;66(12):1718-26.
20. Leventhal H, Diefenbach M, Leventhal EA. Illness cognition: Using common sense to understand treatment adherence and affect cognition interactions. Cognit Ther Res 1992;16(2):143-163.
21. Denhaerynck K, Abraham I, Gourley G, Drent G, De Vleeschouwer P, Papajcik D, et al. Validity testing of the Long-Term Medication Behavior Self-Efficacy Scale. J Nurs Meas 2003;11(3):267-82.
22. De Geest S. Another perspective in understanding adherence: qualitative research in unraveling the behavioral dimension of heart failure management. J Cardiopulm Rehabil 2005;25(3):164-5.
23. Dobbels F, Van Damme-Lombaert R, Vanhaecke J, De Geest S. Growing pains: non-adherence with the immunosuppressive regimen in adolescent transplant recipients. Pediatr Transplant 2005;9(3):381-90.
24. Butler JA, Peveler RC, Roderick P, Smith PW, Horne R, Mason JC. Modifiable risk factors for non-adherence to immunosuppressants in renal transplant recipients: a cross-sectional study. Nephrol Dial Transplant 2004;19(12):3144-9.
25. Yavuz A, Tuncer M, Gurkan A, Demirbas A, Suleymanlar G, Ersoy F, et al. Cigarette smoking in renal transplant recipients. Transplant Proc 2004;36(1):108-10.
26. Aziz AM, Ibrahim MI. Medication noncompliance--a thriving problem. Med J Malaysia 1999;54(2):192-9.
27. Taylor SA, Galbraith SM, Mills RP. Causes of non-compliance with drug regimens in glaucoma patients: a qualitative study. J Ocul Pharmacol Ther 2002;18(5):401-9.
28. Walsh JC, Horne R, Dalton M, Burgess AP, Gazzard BG. Reasons for non-adherence to antiretroviral therapy: patients' perspectives provide evidence of multiple causes. AIDS Care 2001;13(6):709-20.
29. Compliance: many don't take drugs properly. Pharmaceutical Executive 2005(May):36. 30. Singer JD. Using SAS PROC MIXED to fit multilevel models, hierarchical models, and
individual growth models. The Journal of Educational and Behavioral Statistics 1999;23(4): 323-355.
31. Bultman DC, Svarstad BL. Effects of physician communication style on client medication beliefs and adherence with antidepressant treatment. Patient Educ Couns 2000;40(2):173-85.
32. Luke D. Multilevel modeling. In: Lewis-Beck MS, editor. London: Sage Publications, 2004. 33. Merlo J, Yang M, Chaix B, Lynch J, Rastam L. A brief conceptual tutorial on multilevel
analysis in social epidemiology: investigating contextual phenomena in different groups of people. J Epidemiol Community Health 2005;59(9):729-36.
34. Denhaerynck K, Desmyttere A, Dobbels F, Moons P, Young J, Siegal B, et al. Prevalence of noncompliance with the immnosuppressive regimen in North American and European renal transplant recipients. Progress in Transplantation In press.
35. Cifani L, Vargo R. Teaching strategies for the transplant recipient: a review and future directions. Focus Crit Care 1990;17(6):476-9.
36. Cupples SA, Steslow B. Use of behavioral contingency contracting with heart transplant candidates. Prog Transplant 2001;11(2):137-44.
38. Hardstaff R, Green K, Talbot D. Measurement of compliance posttransplantation--the results of a 12-month study using electronic monitoring. Transplant Proc 2003;35(2):796-7.
39. Dew MA, Goycoolea JM, Harris RC, Lee A, Zomak R, Dunbar-Jacob J, et al. An internet-based intervention to improve psychosocial outcomes in heart transplant recipients and family caregivers: development and evaluation. J Heart Lung Transplant 2004;23(6):745-58.
40. De Geest S, Denhaerynck K, Schäfer-Keller P, Bock A, Steiger J. Supporting Medication Adherence in Renal Transplantation - the SMART study. Swiss Medical Weekly In press.
41. Roter DL, Hall JA, Merisca R, Nordstrom B, Cretin D, Svarstad B. Effectiveness of interventions to improve patient compliance: a meta-analysis. Med Care 1998;36(8):1138-61.
42. Peterson AM, Takiya L, Finley R. Meta-analysis of trials of interventions to improve medication adherence. Am J Health Syst Pharm 2003;60(7):657-65.
43. Haynes RB, Yao X, Degani A, Kripalani S, Garg A, McDonald HP. Interventions to enhance medication adherence. Cochrane Database Syst Rev 2005(4):CD000011.
44. Schedlbauer A, Schroeder K, Peters TJ, Fahey T. Interventions to improve adherence to lipid lowering medication. Cochrane Database Syst Rev 2004(4):CD004371.
45. Schroeder K, Fahey T, Ebrahim S. Interventions for improving adherence to treatment in patients with high blood pressure in ambulatory settings. Cochrane Database Syst Rev 2004(2):CD004804.
46. DiMatteo MR. Social support and patient adherence to medical treatment: a meta-analysis. Health Psychol 2004;23(2):207-18.
47. Prochaska JO, DiClemente CC, PNorcross JC. In search of how people change. American Psychologist 1992;47:1002-1114.
48. Malotte CK, Jarvis B, Fishbein M, Kamb M, Iatesta M, Hoxworth T, et al. Stage of change versus an integrated psychosocial theory as a basis for developing effective behaviour change interventions. The Project RESPECT Study Group. AIDS Care 2000;12(3):357-64.
49. Deschamps AE, Denhaerynck K, Vandamme A, Van Wijngaerden E, De Geest S. Electronic Monitoring induces a 40-day intervention effect in HIV-patients. JAIDS In preparation.
Appendix 1: Validation of the random-effects model
101
7. APPENDIX 1: VALIDATION OF THE RANDOM-EFFECTS MODEL
Despite having advantages over previously proposed methods to analyse EM data in a longitudinal way 1 2, generalized Linear Mixed Models (e.g., random-intercepts logistic regression analysis) have their own drawbacks. Results are unbiased if certain assumptions are not violated. Overdispersion and serial dependency are two processes that may violate these assumptions.
7.1. Overdispersion
Logistic regression assumes binomial errors, with estimated variance (y) = m(1 - m), where m is the estimated mean residual. "Overdispersion" occurs when the observed variance of the residuals is greater than the expected variance, and indicates misspecification of the model, non-random sampling, or an unexpected distribution of the variables. As a result, standard errors will be over-optimistic, leading to confidence intervals that are too wide. Examination of overdispersion can be done using the GLMM procedure from the ‘lme4’ package that runs on the statistical R-platform 3. The program GLMM procedures fits a Generalized Linear Mixed Model by estimating the maximal likelihood with Laplacian approximation to the marginal likelihood instead of by using numerical quadrature as the NLMIXED procedure in SAS does. Fitting a model as the one presented in table 3 on page 50, showed that the estimated dispersion parameter approached the theoretically expected value of 1, suggesting that the model fit the data well.
7.2. Serial dependency
One drawback of Generalized Linear Mixed Model procedures is that they assume independence of observations within one patient, an assumption that might be violated in longitudinal studies, because observations closer in time generally resemble more than observations further away 4. To detect whether such a serial dependency occurred in our study, we performed a runs test on each patient’s binary adherence sequence. Runs tests allow to control if a binary sequence is random.
A runs test could be performed in 182 patients of the 249 patients with EM data. After controlling for multiple testing 5, 11 sequences differed significantly from random (q<0.05), suggesting serial dependency. The size of the runs test’s p-value highly correlated with the taking adherence parameter (Spearman’s rho=0.60), suggesting that serial dependency became worse when patients were more adherent. Redoing the main analysis of the EM-validation study while omitting all patients that had a runs test p-value <0.05 did not change the results as presented in table 3 on page 50, nor in terms of estimates, nor in terms of inferences. This result indicates reality is more complex than today’s available modelling techniques can capture, but that the existence of serial dependency did not lead to bias.
Reference list 1. Smith DM, Diggle PJ. Compliance in an anti-hypertension trial: a latent process model for
binary longitudinal data. Stat Med 1998;17(3):357-70. 2. Vrijens B, Goetghebeur E. Comparing compliance patterns between randomized treatments.
Control Clin Trials 1997;18(3):187-203.
Appendix 1: Validation of the random-effects model
102
3. Bates D, Deepayan S. The lme4 package, 2004. 4. Lindsey J. Models for repeated measurements. Oxford: University press, 1999. 5. Storey JD, Tibshirani R. Statistical significance for genomewide studies. Proc Natl Acad Sci U
S A 2003;100(16):9440-5.
Summary
103
8. EXECUTIVE SUMMARY
8.1. Background and aim of the research program
Non-adherence to the immunosuppressive therapy is an important issue in kidney transplant patients. About 20% of the kidney transplant patients are non-adherent to the immunosuppressive regimen. Non-adherence contributes to 20% of late acute rejection episodes and 16% of the graft losses, and results in a decreased number of quality adjusted life years. A strategy to increase long-term successful outcome after transplantation is to identify patients at risk for non-adherence and to target them for preventive and adherence enhancing interventions. Comprehensive research on risk factors of non-adherence addressing socio-economic, patient-, condition-, therapy-, and health care system/worker-related factors is lacking. Especially health care-related risk factors are understudied. Moreover, existing studies are hampered by a number of methodological shortcomings. An important shortcoming is that accurate measurement methods for detecting non-adherence, such as electronic monitoring (EM) are rarely adopted. EM, currently the most sensitive adherence assessment method, uses microchip technology to register date and time of openings of a pill bottle. Although EM’s superior sensitivity to detect non-adherence makes it a potential gold standard of adherence assessment, the lack of thorough validation as well as the lack of use of appropriate statistical methods for multivariable and/or longitudinal data analysis of EM data, hinder progress in the field.
The main purpose of this research program was to determine prevalence and risk factors of non-adherence to immunosuppressive medication in kidney transplant patients. As an additional purpose, we aimed to improve the validity of EM measurement by mapping assumptions underlying correct EM measurement. We tested these assumptions on adherence data of kidney transplant patients.
8.2. Methods
8.2.1. Prevalence and risk factors of non-adherence
To study prevalence and risk factors of non-adherence to immunosuppressives, we conducted a prospective study, in which we measured adherence by EM over a 3-month period in 250 adult renal transplant patients sampled from two outpatient transplant centers in Switzerland. We calculated period prevalences of adherence and expressed them as the percentage of prescribed doses taken (taking adherence), the percentage of days with correct dosing (dosing adherence), the percentage of inter-dose intervals not exceeding 25% of the prescribed interval (timing adherence), and the number of drug holidays per 100 days (>48h no intake if once; >24h if twice daily intake).
Selected risk factors were socio-economic, therapy related (e.g. number of transplantations, use of medication aids, symptom occurrence and distress), patient related (e.g. self-efficacy, health beliefs, coping styles, busyness, health behaviors), condition related (e.g. depression, substance use), and health care system/team related (e.g. regularity of follow up). Testing of the risk factors occurred by simple mixed logistic regression analysis, using a sequence of daily binary adherence data. Factors significant after correction for multiple testing were entered into a multiple mixed logistic regression model.
Summary
104
Because the EM-study was not designed to extensively investigate health care system or health care team-related factors, we performed an additional meta-analysis to look whether non-adherence prevalences differed between continents/countries. This meta-analysis on individual patient data pooled data from three studies in adult kidney transplant patients from the US (n=1563), the Netherlands (n=85), Belgium (n=187) and Switzerland (n=342). Adherence was measured by the Siegal scale, a self-report instrument for measuring non-adherence to immunosuppressives. Patients were categorized as non-adherent if they reported to have missed a dose of immunosuppression in the last 4 weeks. Data were analysed using multiple mixed logistic regression with center as a random effect and continent/country as fixed effects, while controlling for several demographical and clinical characteristics of the included samples.
8.2.2. Validation of EM assessment
To study the validity of the EM measurement, we summarized existing evidence on processes that may bias non-adherence assessment. Unbiased EM assessment requires fulfillment of four validity assumptions, being (1) correctly functioning EM equipment, (2) correspondence of EM-bottle openings to the actual intake of the prescribed dose, (3) absence of influence of EM on a patient’s normal adherence behavior, and (4) sample representativeness.
We examined these four validity assumptions using the above mentioned sample of 250 kidney transplant patients whose adherence was measured by EM. More specifically, we (1) determined the prevalence of non-functioning EM systems, (2) examined the impact of patient-reported discrepancies between cap openings and actual drug intakes on period prevalence, (3) explored whether non-adherence increased over time after patients started EM, and (4) screened for differences between participating patients and patients who refused to participate or who dropped out of the study.
8.3. Results
Mean taking, dosing, timing adherence and drug holidays per 100 days were 98%, 96%, 93%, and 1.1 days, respectively. Variables associated with EM measured non-adherence were: higher self-reported non-adherence (OR= 3.08; 95%CI: 1.69-5.61), no usage of a pillbox (OR= 0.31; 95%CI: 0.16-0.61), male gender (OR= 0.46; 95%CI: 0.26-0.81), and lower self-efficacy (OR= 0.49; 95%CI: 0.22-1.07). Furthermore, a gradually declining adherence could be observed between Monday and Sunday (OR= 1.04; 95%CI: 1.02-1.07).
The results of the meta-analysis examining self-reported non-adherence differences between continents/countries showed that the prevalence of non-adherence to immunosuppressives in the U.S. and Europe was 19.3% and 13.2.%, respectively The higher prevalence of non-adherence in US patients was confirmed in the multiple logistic regression analysis (OR=1.78; 95%CI: 1.10-2.89). Moreover, non-adherence differed between Belgium (16%) and the Netherlands (14.1%) (OR=0.27; 95% CI: 0.09-0.80) and between Belgium and Switzerland (11.4%) (OR=0.17; 95% CI: 0.0-0.42).
The validation study of EM showed that not all assumptions underlying EM measurement were fulfilled: (1) one cap malfunctioned, (2) mismatches between bottle
Summary
105
openings and actual drug intake occurred in 62% of the patients (n=155), and (3) non-adherence increased during the initial period of the monitoring, primarily during the first 5 weeks, indicating EM had an intervention effect. The bias caused by this 5-week intervention effect was minimal. The effect of mismatches between bottle openings and actual drug intake on the measured adherence prevalence was larger, but could be minimized by correcting the downloaded EM data using patient self-reports (i.e., self-reported adherence to the EM guidelines and notes made by the patient to correct mismatches between openings and ingestions).
8.4. Conclusions
This study program aimed to study risk factors of non-adherence in kidney transplant patients. Its contribution to the literature lies in the fact that a comprehensive number of non-adherence risk factors, including the currently neglected health care system factors, have been explored, and in the fact that improvements of the methodological approach for adherence studies have been proposed.
The profile of risk factor appearing in the final results suggest that forgetfulness was a major driver of non-adherence. Moreover, system factors might also have an impact on individual adherence behavior, as suggested by the found differences in prevalence of non-adherence between European and US patients and among European patients. These findings may change the focus of adherence research in the transplant population.
Methodological improvements put forward throughout this study program primarily concern the measurement of adherence behavior using EM. Novel statistical techniques are proposed that allow multivariate analysis of EM data and inclusion of time-varying variables into the statistical regression models. Besides, we showed that, although assumptions underlying valid EM measurement may be violated, bias can to a certain extent be prevented by correcting incorrect data or omitting them from the analysis.
Curriculum vitae
106
9. CURRICULUM VITAE Kris Denhaerynck was born on September 4, 1973 in Waregem, Belgium. He attended high school at the ‘Sint-Jan Bergmanscollege’ in Avelgem, Belgium. He attained his Bachelor Degree in Nursing from the ‘Heilig Hart’ institute in Roeselare (Belgium) in 1996. In 1999, he received a Master’s degree in Medical Social Sciences at the ‘Katholieke Universiteit Leuven’ (Belgium). During his Master’s education, he already became involved in transplantation research on medication adherence. After his graduation, Kris was appointed at the Center for Health Services and Nursing Research at the Katholieke Universiteit Leuven (Belgium) as a research assistant, working on projects on clinical leadership (1999-2000) and discharge planning in psychiatric hospitals (2000-2001). Subsequently, he joined the Leuven University Center for Cancer Prevention, where he coordinated a research project led by the European Breast Cancer Network (2001-2002). In November 2002, Kris joined the Institute of Nursing Science at the University of Basel (Switzerland). As a research assistant, he coordinated of the Supporting Medication Adherence in Renal Transplantation study (SMART), and started his PhD using SMART-study data in 2003. He also contributes to the educational activities of the Institute of Nursing Science by co-teaching the quantitative research courses. Next to his academic life, Kris is also a devoted trombone player, who takes private lessons in bass trombone at the opera house in Basel.
List of publications
107
10. LIST OF PUBLICATIONS
10.1. Peer reviewed
Denhaerynck K, Desmyttere A, Dobbels F, Moons P, Young J, Siegal B, Greenstein S, Steiger J, Vanrenterghem Y, Squifflet JP, van Hooff JP, De Geest S. Prevalence of noncompliance with the immnosuppressive regimen in North American and European renal transplant recipients. Progress in Transplantation, in press.
De Geest S, Denhaerynck K, Schäfer-Keller P, Bock A, Steiger J. Supporting Medication Adherence in Renal Transplantation - the SMART study. Swiss Medical Weekly, in press.
De Geest S, Schäfer-Keller P, Denhaerynck K, Thannberger N, Köfer S, Bock A, Steiger J. Supporting Medication Adherence in Renal Transplantation (SMART): A pilot study RCT to improve adherence with immunosuppressive regimen. Clinical Transplantation, 2006; 20: 359-368.
Fierz K, Steiger J, Denhaerynck K, Bock A, De Geest S. prevalence, severity and correlates of alcohol use in renal transplant patients'. Clinical transplantation 2006; 20(2):171-8.
Denhaerynck K, Dobbels F, Cleemput I, Desmyttere A, Schaefer-Keller P, Schaub S, De Geest S. Prevalence, consequences, and determinants of nonadherence in adult renal transplant patients: a literature review. Transplant International 2005; 18(10):1121-1133.
Denhaerynck K, Abraham I, Gourley G, Drent G, De Vleeschouwer P, Papajcik D, Lince E, De Geest S. Validity testing of the Long-Term Medication Behavior Self-Efficacy Scale. Journal of Nursing Measurement 2003; 11(3):267-82.
Denhaerynck K, Lesaffre E, Baele J, Cortebeeck K, Van Overstraete E, Buntinx F. Mammography Screening Attendance: Meta-Analysis of the Effect of Direct-Contact Invitation. American Journal of Preventive Medicine 2003; 25(3):195-203.
Translated: Denhaerynck K, Lesaffre E, Baele J, Cortebeeck K, Van Overstraete E, Buntinx F. (2006). Opkomst bij mammografiescreening: meta-analyse over het effect van uitnodigen via rechtstreeks contact. Huisarts Nu 2006; 35(1):19-28.
10.2. Submitted
Denhaerynck K, Schäfer-Keller P, Young J, Steiger J, Bock A, Surber C, De Geest, S. Is electronic medication monitoring the gold standard for adherence measurement? A test of its assumptions. Nursing Research. Submitted.
Denhaerynck K, Steiger J, Bock A, Schäfer-Keller P, Köfer S, Thannberger N, De Geest S. Prevalence and risk factors of non-adherence with immunosuppressive medication in kidney transplant patients. American Journal of Transplantation. Submitted.
Denhaerynck K, Manhaeve D, Dobbels F, Garzoni D, Nolte C, De Geest S. Prevalence and consequences of non-adherence with the hemodialysis regimen. American Journal of Critical Care. Submitted.
List of publications
108
10.3. Chapters
Denhaerynck K, Beullens J. Alcoholisme bij ouderen [Alcoholism in the elderly]. In: Milisen K, De Maesschalck L, Abraham IL. Verpleegkundige zorgaspecten bij ouderen. Elsevier Gezondheidszorg: Maarsen, Nederland, 2002, pp. 247-255. ISBN 90 352 2486 8.
Translated: Denhaerynck K, Beullens J. Alkoholprobleme bei älteren Menschen. In: Milisen K, De Maesschalck L, Abraham I. Die Pflege alter Menschen in speziellen Lebenssituationen: Modern, Wissenschaftlich, Praktisch. Springer-Verlag: Berlin, Deutschland, 2004. ISBN 3-540-20368-0.
10.4. Abstracts published in international literature
Deschamps A, Denhaerynck K, Van Wijngaerden E, De Geest S. Use of Electronic Monitoring Induces a 40-day Intervention Effect in HIV Patients. J Int Assoc Physicians AIDS Care 2006, 5(2): 57 - 82.
Denhaerynck K, Schaefer P, Steiger J, Bock A, De Geest, S. Prevalence and correlates of nonadherence with immunosuppressive regimen in adult renal transplant recipients. Transplant International 2005; 18(S1):183.
Denhaerynck K, Schäfer P, Steiger J, Bock A, De Geest S. Prevalence and correlates of nonadherence with immunosuppressive regimen in adult renal transplant recipients. American Journal of Transplantation 2005; 5(S11): 331.
De Geest S, Schäfer P, Denhaerynck K, Bock A, Steiger J. Supporting medication adherence in renal transplantation (SMART): a randomized controlled trial to improve adherence with the immunosuppressive regimen. Transplant International 2005; 18(S1):183.
De Geest S, Desmyttere A, Denhaerynck K, Dobbels F, Moons P, Young J, Siegal B, Greenstein S, Steiger J, Vanrenterghem Y, Squifflet JP, van Hooff J. Prevalence of noncompliance with the immunosuppressive regimen: How different are North Amercan and European transplant patients? American Journal of Transplantation 2005; 5(S11):507.
Schäfer-Keller P, Steiger J, Denhaerynck K, Bock A, De Geest S. Using electronic monitoring as reference standard: how well do state of measurement methods measure medication adherence in kidney transplant recipients? American Journal of Transplantation 2005; 5(S11): 331.
Denhaerynck K, Schäfer-Keller P, De Geest S. (2004) Determinanten von Noncompliance und Compliance verbessernde Interventionen zur Verlängerung des Langzeitüberlebens nach Organtransplantation. Journal für das nephrologische Team 2004; 3(4):172-173.
Denhaerynck K, Schäfer P, Thannberger N, Köfer S, Bock A, Surber S, Steiger J, De Geest S. Prevalence and correlates of nonadherence with immunosuppressive regimen in in renal transplant recipients International Journal of Behavioral Medicine 2004; 11(S): p 186.
"Er gaat meer boven mijn petje dan eronder" – Toon Hermans


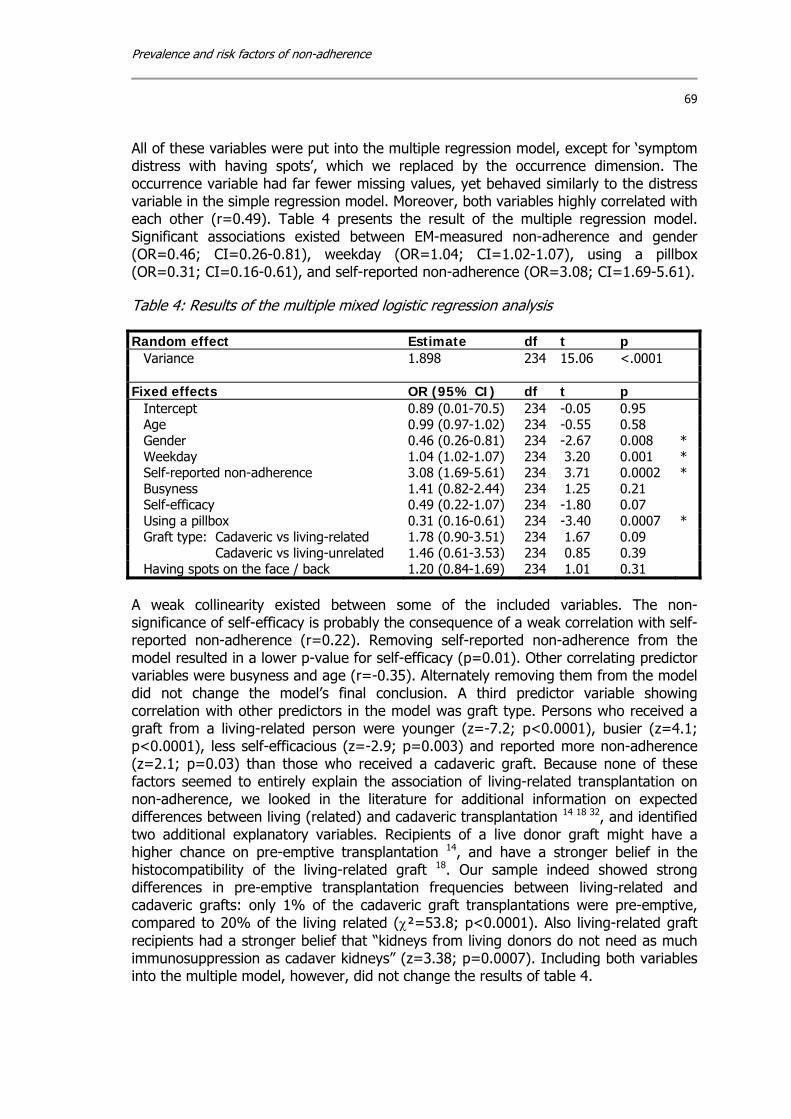


![Nicolet High School 12 Wkst... · 2015-05-22 · shed in veur backvzrd. the shed made] 'the stvle of vouy you plan to paint the outside of the shed and shingle the roof. The shed](https://static.documents.pub/doc/80x56/5f21a64c60c96072f9111dc1/nicolet-high-school-12-wkst-2015-05-22-shed-in-veur-backvzrd-the-shed-made.jpg)
