Exploring RM-Replay for Cluster Scheduling Zhen Huang, Undergraduate, Department of Computer Science Blake Ehrenbeck, Undergraduate, Department of Computer Science Zhiling Lan, Professor, Department of Computer Science Boyang Li, PhD Student, Department of Computer Science Illinois Institute of Technology Chicago, IL 60616 PROJECT OVERVIEW This project was worked on by undergraduate students, Blake Ehrenbeck and Zhen Huang under the supervision of Professor Zhiling Lan and her doctoral student, Boyang Li. There are two objectives for this project. The first (1) is to install RM-Replay and explore it by means of experimentation with different workloads. The second (2) is to transform a workload trace from jobs run on Argonne National Lab’s Theta to something that can be replayed with RM-Replay and run that replay. The duration of the project was from January 14, 2019 to April 28, 2019. Every week we met with Professor Lan and discussed what we had achieved in the week prior, problems we had encountered, and what we were to do in the coming week. We also wrote a biweekly report documenting all of this. The reports are posted on the project’s website (see Reference section). PROJECT TASKS The subsequent subsections will will guide you through what we accomplished in a step-by-step fashion: I. Downloading RM-Replay and Slurm Downloading RM-Replay is straightforward. Clone the repository wherever you like: gitclonehttps://github.com/eth- cscs/slurm-replay.gitDownload a .tar.bz2 version of Slurm into the cloned directory from above. (See reference section for Slurm downloads). II. Building RM-Replay RM-Replay is run through a Docker container. Ensure that you have Docker installed on your machine before continuing, on the machine we were working with, it was installed for us. Before we can build the container we need to make some adjustments on the machine that running RM-Replay (in our case, Lightning machine): 1. Edit the line 11 in trace_builder_mysql.c file, under submitter folder, change the it to be #include “mysql.h” . 2. Line 43 of start_slurmdbd.sh should be changed from “Daint” to be the name of the cluster you wish to simulate. In our case, the cluster was named “jarvis”. In our machines, the document /etc/slurm/ slurm.conf defines the clustername to be jarvis, 3. On Line 39 of start_slurmdbd.sh change “sleep 1” to be “sleep 30”. This prevents a race condition when starting the Slurm accounting database. 4. On Lines 54 and 56 of start_slurm.sh change “sleep 2” to be “sleep 300”. This is also to prevent a race condition when the number of the nodes in your simulated cluster is large. 5. Also in start_slurm.sh comment out lines 30, 33,34 6. Change “replayuser” on Line 5 of the Dockerfile to be “slurm”. After you’ve made these changes navigate to the slurm- replay folder and build the image: dockerbuild-trm_replay_docker-- build-argSLURM_VERSION=18.08.0.• t is the tag or name of the built image • built-argis where you can supply the version of Slurm your cluster was using. III. Getting Some Data
Transcript
Exploring RM-Replay for Cluster Scheduling Zhen Huang, Undergraduate, Department of Computer Science
Blake Ehrenbeck, Undergraduate, Department of Computer Science Zhiling Lan, Professor, Department of Computer Science
Boyang Li, PhD Student, Department of Computer Science Illinois Institute of Technology
Chicago, IL 60616
PROJECT OVERVIEW
This project was worked on by undergraduate students, Blake Ehrenbeck and Zhen Huang under the supervision of Professor Zhiling Lan and her doctoral student, Boyang Li. There are two objectives for this project. The first (1) is to install RM-Replay and explore it by means of experimentation with different workloads. The second (2) is to transform a workload trace from jobs run on Argonne National Lab’s Theta to something that can be replayed with RM-Replay and run that replay. The duration of the project was from January 14, 2019 to April 28, 2019. Every week we met with Professor Lan and discussed what we had achieved in the week prior, problems we had encountered, and what we were to do in the coming week. We also wrote a biweekly report documenting all of this. The reports are posted on the project’s website (see Reference section).
PROJECT TASKS
The subsequent subsections will will guide you through what we accomplished in a step-by-step fashion:
I. Downloading RM-Replay and Slurm
Downloading RM-Replay is straightforward. Clone the repository wherever you like:
Download a .tar.bz2 version of Slurm into the cloned directory from above. (See reference section for Slurm downloads).
II. Building RM-Replay
RM-Replay is run through a Docker container. Ensure that you have Docker installed on your machine before continuing, on the machine we were working with, it was installed for us.
Before we can build the container we need to make some adjustments on the machine that running RM-Replay (in our case, Lightning machine):
1. Edit the line 11 in trace_builder_mysql.c file, under submitter folder, change the it to be #include “mysql.h” .
2. Line 43 of start_slurmdbd.sh should be changed from “Daint” to be the name of the cluster you wish to simulate. In our case, the cluster was named “jarvis”. In our machines, the document /etc/slurm/slurm.conf defines the clustername to be jarvis,
3. On Line 39 of start_slurmdbd.sh change “sleep 1” to be “sleep 30”. This prevents a race condition when starting the Slurm accounting database.
4. On Lines 54 and 56 of start_slurm.sh change “sleep 2” to be “sleep 300”. This is also to prevent a race condition when the number of the nodes in your simulated cluster is large.
5. Also in start_slurm.sh comment out lines 30, 33,34
6. Change “replayuser” on Line 5 of the Dockerfile to be “slurm”.
After you’ve made these changes navigate to the slurm-replay folder and build the image:
It’s important to note that the time and dates above are converted from the UNIX timestamp in the database to something in your local time.
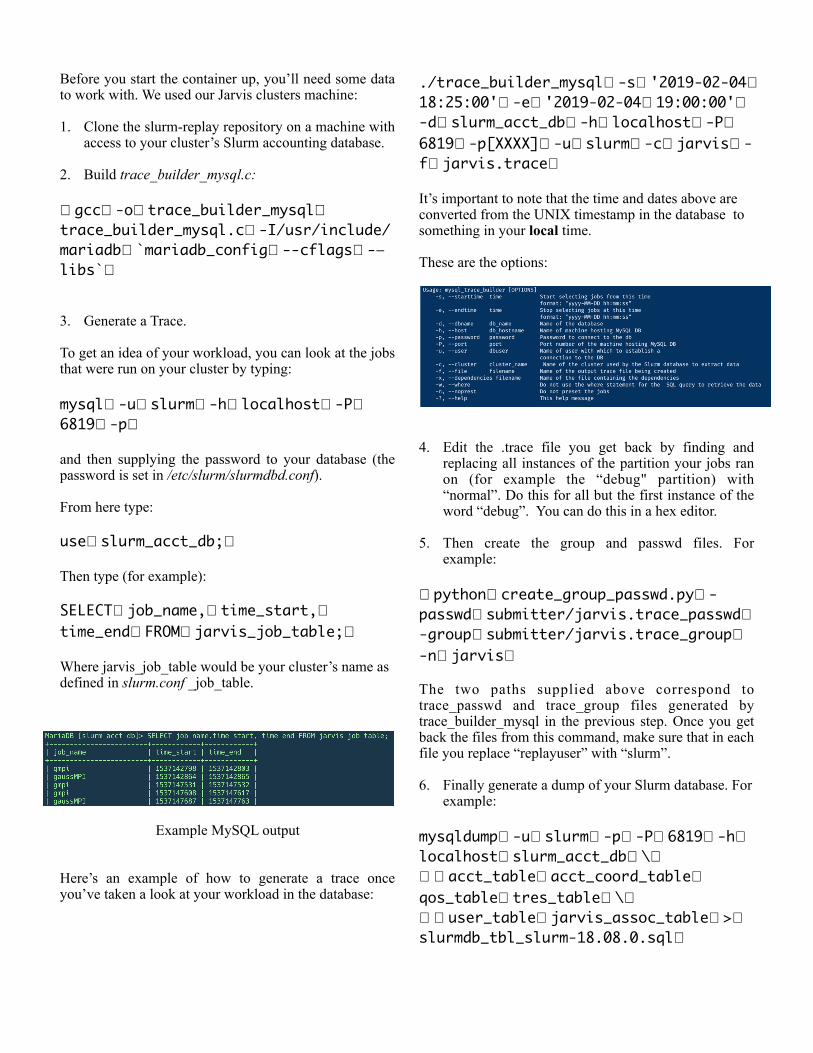
These are the options:
4. Edit the .trace file you get back by finding and replacing all instances of the partition your jobs ran on (for example the “debug" partition) with “normal”. Do this for all but the first instance of the word “debug”. You can do this in a hex editor.
5. Then create the group and passwd files. For example:
The two paths supplied above correspond to trace_passwd and trace_group files generated by trace_builder_mysql in the previous step. Once you get back the files from this command, make sure that in each file you replace “replayuser” with “slurm”.
6. Finally generate a dump of your Slurm database. For example:
Now, go back to Lightning machine that we run RM-Replay with. Place the group, passwd, sql dump file, and trace file in a folder named data that is in the same directory as slurm-replay. Type chown 777 data to give this data folder the correct permissions. In a new subdirectory of data labeled slurmcfg: include: the gres.conf, slurm.conf, slurmdbd.conf, and topology.conf from your cluster. If you don’t have gres.conf or topology.conf files, they can be empty files.
You also need to make sure slurm-replay sets the values of certain plugins to none. If slurm-replay fails to make these changes (because the format of the config file is different in Slurm versions other than the one the author of rm-replay used), look at configure_slurm.sh in the slurm-replay directory and make the changes yourself.
We needed to make the following adjustments:
* Change any hostnames or addresses you may find in this file to localhost.
IV. Starting the Container
Before you can start the container you will need to create a file to fix some SQL configurations: Create a file named fix_cnf
rm_replay_3 is the tag supplied when building the Docker image.
You will then be inside the Docker image. From here you can run experiments with RM-Replay. The only other thing you will need to change each time is the start & end times inside start_replay.sh. For an unknown reason, it does not correctly find the start and end times from the trace. Convert the start and end times of your workload to UNIX timestamps and fill in those values for START_TIME and END_TIME in the file. Use three minutes before the start time you want and three minutes
after the end time you want just for some padding. You can start a replay like this for example:
./start_replay.sh -w ../data/jarvis.2019.02.27.trace -r 0.0001 -n test -p 3
• w is the path to your trace in the data folder • r is ratio of actual seconds to replayed seconds • n is the name of your experiment • p 3 means you want to use the same nodes as done
in the workload versus letting slurm-replay decide which nodes to schedule
Don’t worry if you get errors about multiple hostnames or addresses being listed.
How to get the correct results: There is a C file under the submitter folder called: trace_metrics.c and this file will calculate metrics including utilization. average wait-time etc. But this some parameters in this file need to be edit to match user’s machine configuration, otherwise user might get wrong output or the output is unreadable.
1. In line 113, make a new line inside the function computer_metrics, add line : *nwait = 0;
2. Change the number of nodes on Lines 246 and 247 to match your cluster.
3. Delete the “+2” on Line 248
4. On Line 180 change “> 3*60” to “>=0”
5. Type “make all”
6. To see the corrected metrics.log file in the data folder tun this command:
./trace_metrics -w [path to generated .trace file] -r 4
The 4 just gives some padding.
A functional build of RM-Replay is on jarvis at IIT under the rm-replay-c user’s home directory. The name of the image is rm_replay_3. Instructions for how to use this build are in a file named INSTRUCTIONS.
RESULTS
There are total three experiments that we done with RM-Replay.
(1) The first experiment on RM-Replay is replaying a trace file we built from our Jarvis machine which ran a single job of a C program that implement Gaussian Elimination utilizing three nodes. The two graphs below show a script of the job, and the log of successful replay of the job.
There are 8 nodes in Jarvis machine and in the first experiment, only 3 of them were been used, so the output log was correct.
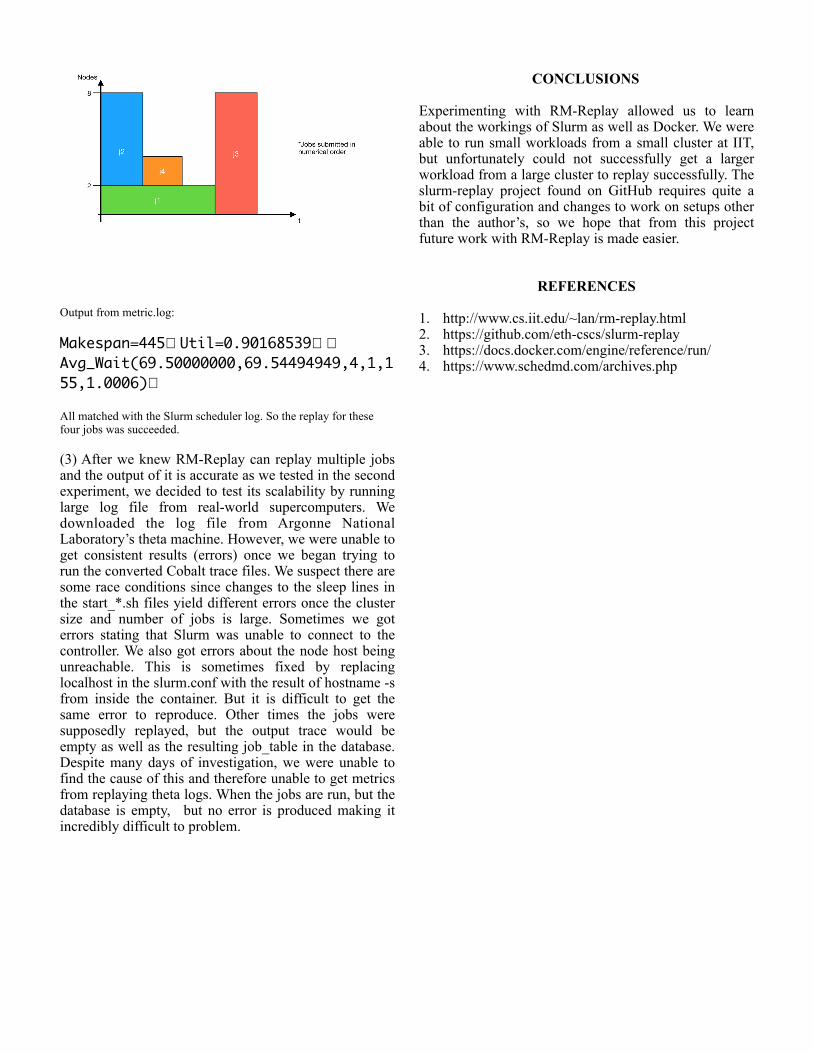
(2) After we test that RM-Replay can work well with Jarvis machine at least for one job, we decided to test whether it will work for multiple jobs that expect backfilling in the scheduler, and examine the utilization and wait time in the RM-Replay output to see if it match with the information appeared in Slurm Database on Jarvis machine. So the second experiment we did is to submit four jobs (same C program in the first experiment) at the same time, and each jobs are different in terms of resources they use, and running time. The diagram on the next page shows how the Slurm will run them:
All matched with the Slurm scheduler log. So the replay for these four jobs was succeeded.
(3) After we knew RM-Replay can replay multiple jobs and the output of it is accurate as we tested in the second experiment, we decided to test its scalability by running large log file from real-world supercomputers. We downloaded the log file from Argonne National Laboratory’s theta machine. However, we were unable to get consistent results (errors) once we began trying to run the converted Cobalt trace files. We suspect there are some race conditions since changes to the sleep lines in the start_*.sh files yield different errors once the cluster size and number of jobs is large. Sometimes we got errors stating that Slurm was unable to connect to the controller. We also got errors about the node host being unreachable. This is sometimes fixed by replacing localhost in the slurm.conf with the result of hostname -s from inside the container. But it is difficult to get the same error to reproduce. Other times the jobs were supposedly replayed, but the output trace would be empty as well as the resulting job_table in the database. Despite many days of investigation, we were unable to find the cause of this and therefore unable to get metrics from replaying theta logs. When the jobs are run, but the database is empty, but no error is produced making it incredibly difficult to problem.
CONCLUSIONS
Experimenting with RM-Replay allowed us to learn about the workings of Slurm as well as Docker. We were able to run small workloads from a small cluster at IIT, but unfortunately could not successfully get a larger workload from a large cluster to replay successfully. The slurm-replay project found on GitHub requires quite a bit of configuration and changes to work on setups other than the author’s, so we hope that from this project future work with RM-Replay is made easier.