35
Exploring the Link between Obesity and Food Purchasing Behaviour in the West Midlands: Research Methodology & Key Findings Professor Andrew Fearne
| Date post: | 14-Dec-2015 |
| Category: |
Documents |
| Upload: | sharon-holdren |
| View: | 215 times |
| Download: | 0 times |
Exploring the Link between Obesityand Food Purchasing Behaviour
in the West Midlands:Research Methodology & Key Findings
Professor Andrew Fearne
Outline
About Us
Research Methodology
Key Findings
Conclusions
Slide 2

About Us
Slide 3
Centre for Value Chain Research
• 8 Core Staff
• 12 PhD students
Focus on applied research with strong industry links and multiple stakeholder engagement
• Demand Management
NPD (key success factors) Promotions (evaluation) Sustainable consumption (behaviour change)
• Value Chain Management
Value Chain Analysis (process improvement) Co-regulation (food safety) B2B Relationships (organisational Justice)
Slide 4

Social
EnvironmentalEconomic
Social
EnvironmentalEconomic
FOOD
Research Context - Sustainability
Challenges:• Complex
• Dynamic
• Universal
Solutions:• Holistic
• Multi-disciplinary
• Cross-functional
• Multiple stakeholders
Slide 5

Research Focus
• Focus on understanding and changing behaviour Individual (consumer) Collective (organisations)
• multi-disciplinary frameworks• mixed research methods• collaborative networks (government, industry, NGOs)
Slide 6

Research Methodology
Slide 7
Behaviour Change
• Use behaviour data to target (design and implement) and evaluate interventions People rarely do (did) what they say (have done)
• they lie• they forget• they misinterpret • their circumstances change
Slide 8
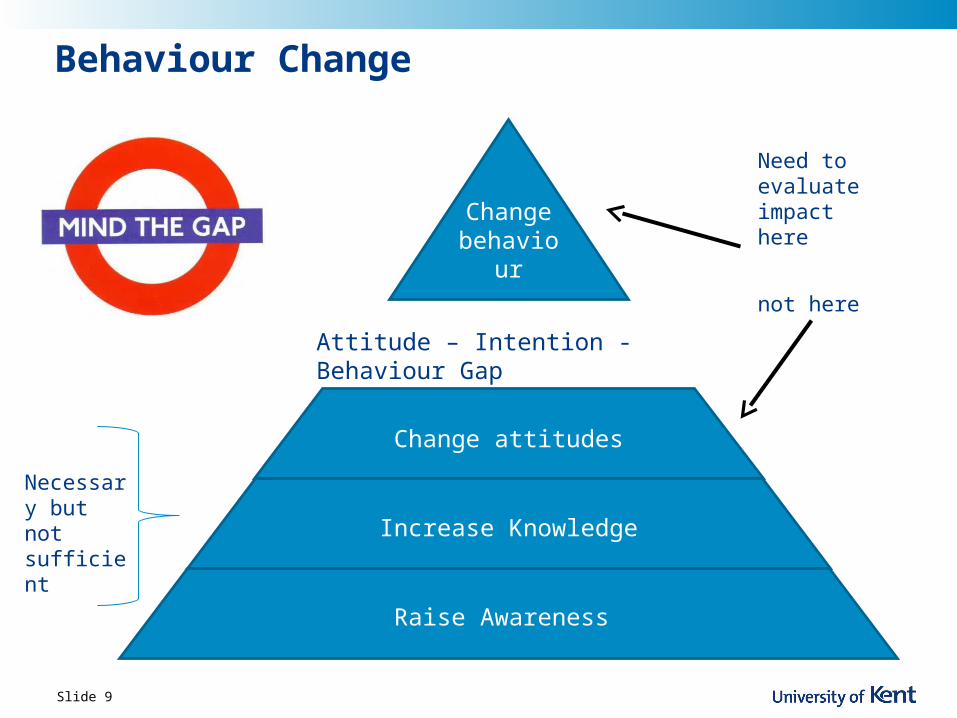
Change behaviour
Change attitudes
Increase Knowledge
Raise Awareness
Attitude – Intention - Behaviour Gap
Necessary but not sufficient
Need to evaluate impact here
not here
Behaviour Change
Slide 9

Change behaviour
Change attitudes
Increase Knowledge
Raise Awareness
Create enabling environment
Necessary but not sufficient
Need to evaluate impact here
not here
Behaviour Change
Slide 10

Supermarket loyalty card data
2 years of weekly supermarket transactions
Population = 17 million households Sample = 10% (1.7 million shoppers)
Representative of 40%+ of UK households
Over 30,000 food products
(265,000+ total)
Slide 11
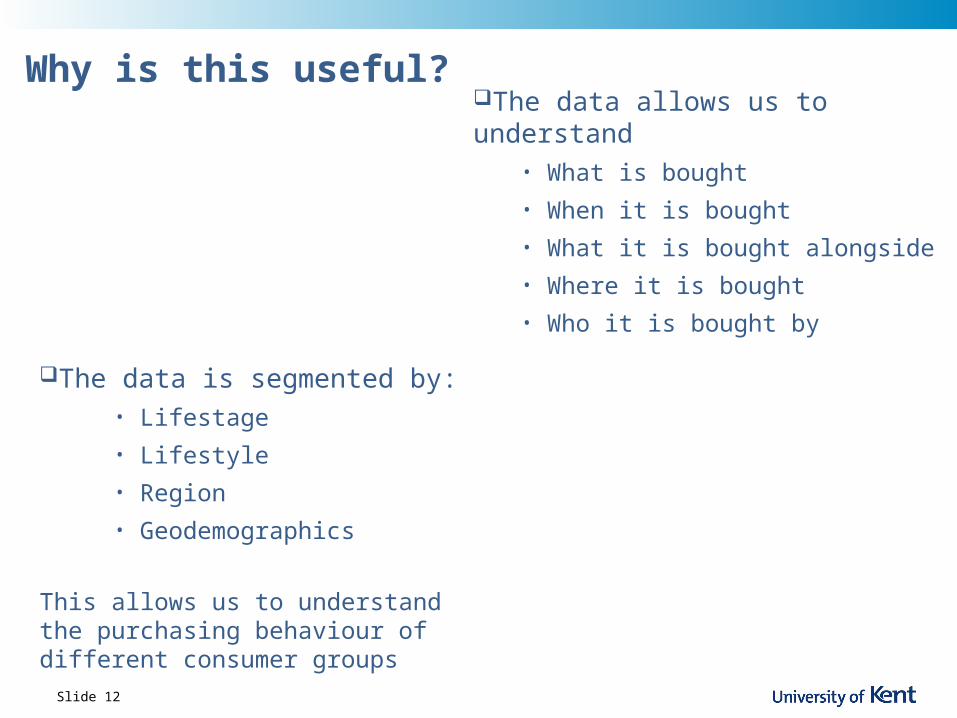
The data is segmented by:• Lifestage• Lifestyle• Region• Geodemographics
This allows us to understand the purchasing behaviour of different consumer groups
Why is this useful?The data allows us to understand
• What is bought• When it is bought• What it is bought alongside• Where it is bought • Who it is bought by
Slide 12
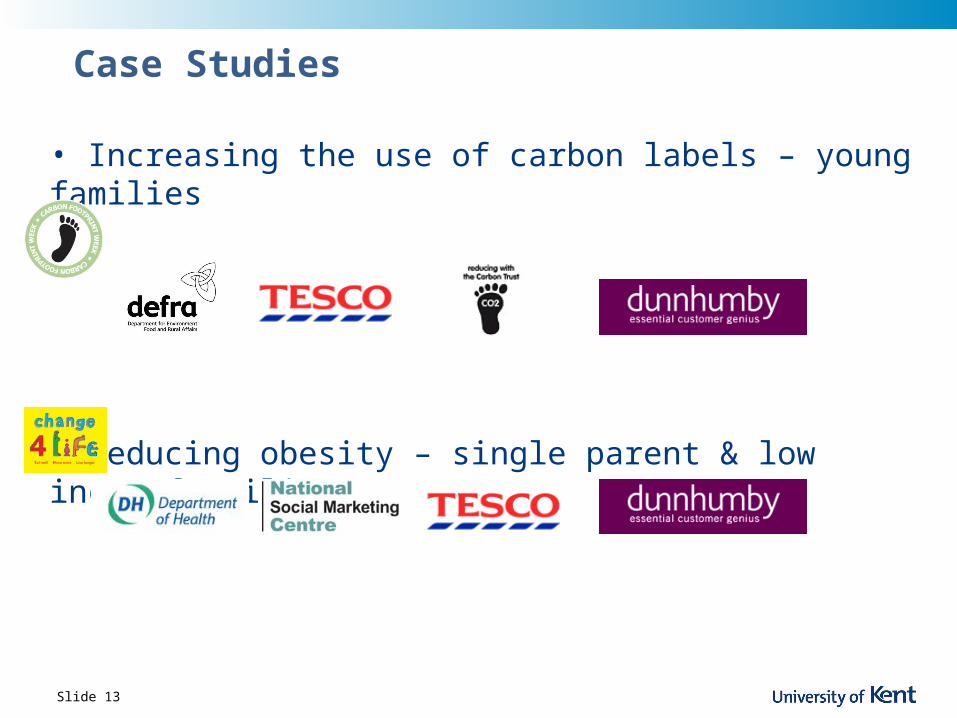
Case Studies
• Increasing the use of carbon labels – young families
• Reducing obesity – single parent & low incomef amilies
Slide 13

Key Findings
Slide 14
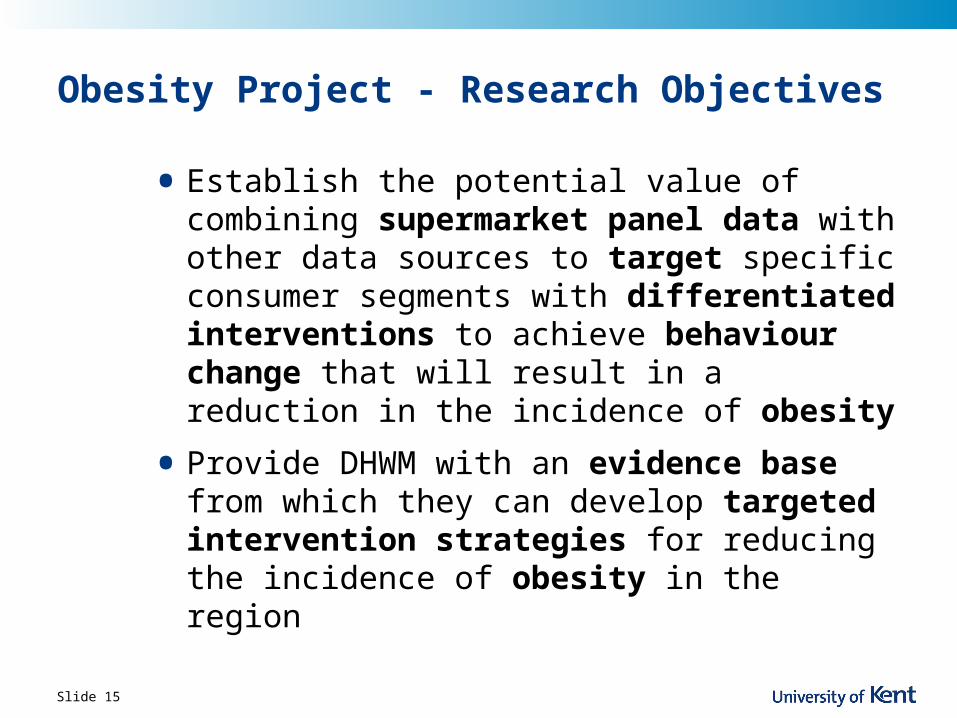
Obesity Project - Research Objectives
• Establish the potential value of combining supermarket panel data with other data sources to target specific consumer segments with differentiated interventions to achieve behaviour change that will result in a reduction in the incidence of obesity
• Provide DHWM with an evidence base from which they can develop targeted intervention strategies for reducing the incidence of obesity in the region
Slide 15

Obesity Project - Research Methodology
Slide 16
Phase 1 Identify target area
• Analyse dunnhumby data to identify Tesco store with the highest penetration of ‘unhealthy’ food products and lowest penetration of ‘healthy’ products amongst single parent and low income households
Explore attitudes, perceptions and purchase drivers• Four focus groups with single mothers all with BMIndex >30
(plus two control groups with BMI <30) Quantify barriers, enablers and potential impact of
targeted intervention• Face to face interviews with 200 shoppers in target area, all
with BMIs over 30 and on-line survey of 200 households across the UK with varied BMIs
Phase 2 Develop, implement and evaluate targeted intervention

Identify target group Two Cameo (Geo-demoghraphic) segments
• Poorer and single parent households (10.1% UK householdds)• Poorer council tenants including many single parents (10.7% UK
households)
Identify discrimnating products 15 ‘unhealthy’ food categories (361 products) 11 ‘healthy’ food categories (216 products)
Obesity Project – Key Findings (Phase 1a)
Slide 17
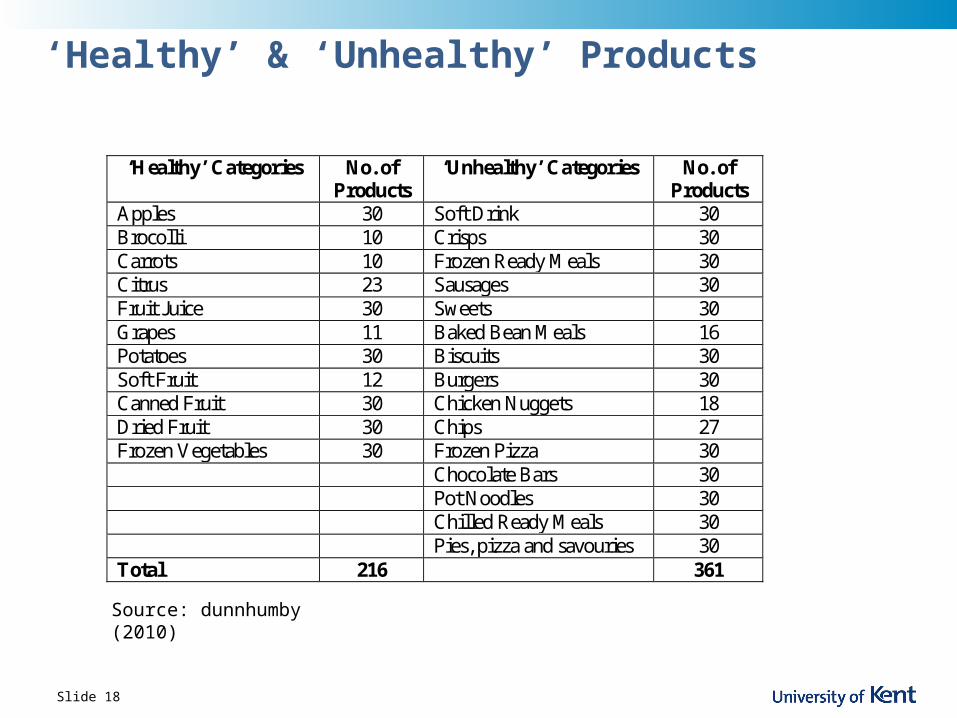
‘Healthy’ & ‘Unhealthy’ Products
‘Healthy’ Categories No. of Products
‘Unhealthy’ Categories No. of Products
Apples 30 Soft Drink 30 Brocolli 10 Crisps 30 Carrots 10 Frozen Ready Meals 30 Citrus 23 Sausages 30 Fruit Juice 30 Sweets 30 Grapes 11 Baked Bean Meals 16 Potatoes 30 Biscuits 30 Soft Fruit 12 Burgers 30 Canned Fruit 30 Chicken Nuggets 18 Dried Fruit 30 Chips 27 Frozen Vegetables 30 Frozen Pizza 30 Chocolate Bars 30 Pot Noodles 30 Chilled Ready Meals 30 Pies, pizza and savouries 30 Total 216 361
Slide 18
Source: dunnhumby (2010)

Shopper Profiling – ‘Unhealthy’ SKUs
0
20
40
60
80
100
120
140
160
180
Baked Bean Meals
Burgers Carbonated Drinks
Chicken Nuggets Chips Choc Bars & Sweets
Crisps Frozen Pizza & Frozen Ready
Meals
Pot Noodles Sausages
Young and Affluent Singles Wealthy Retired Neighbourhoods Affluent Home Owners Smaller Private Family HomesComfortable Mixed Neighbourhoods Less Affluent Families Less Affluent Singles and Students Poorer White and Blue Collar WorkersPoorer Family and Single Parent Households Poorer Council Tenants - Many Single Parents
Slide 19
Source: dunnhumby (2010)

20
Shopper Profiling – ‘Healthy’ SKUs
0
20
40
60
80
100
120
140
Apples Brocoli Carrots Citrus Fruit Juice Grapes Potatoes Soft Fruit
Young and Affluent Singles Wealthy Retired Neighbourhoods Affluent Home Owners Smaller Private Family HomesComfortable Mixed Neighbourhoods Less Affluent Families Less Affluent Singles and Students Poorer White and Blue Collar WorkersPoorer Family and Single Parent Households Poorer Council Tenants - Many Single Parents
Slide 20
Source: dunnhumby (2010)
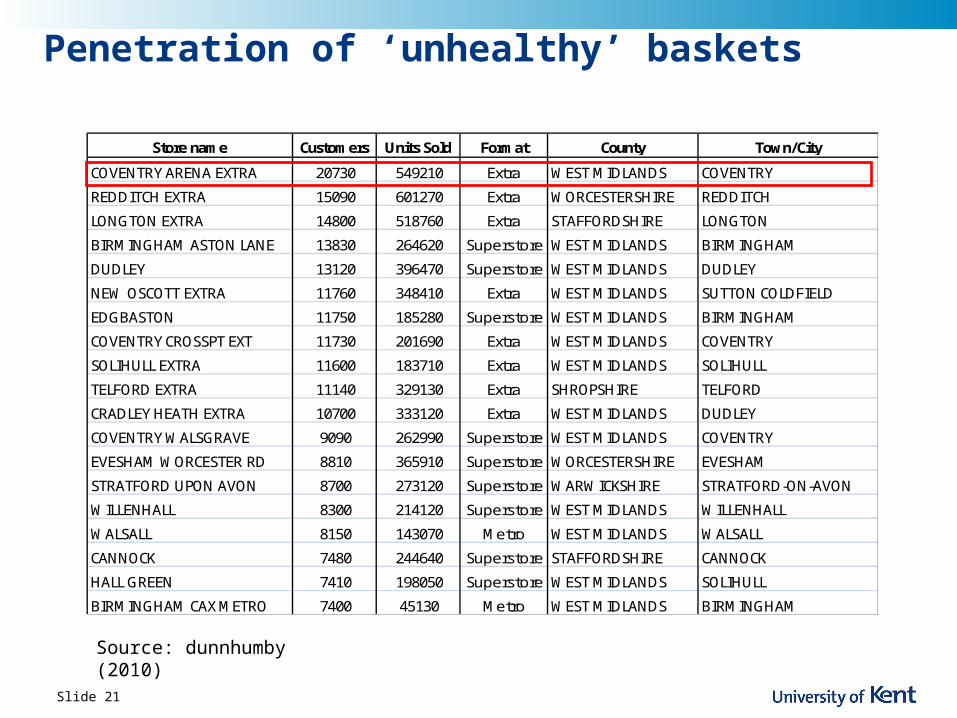
Penetration of ‘unhealthy’ baskets
Store name Customers Units SoldStore
Format County Town/City
COVENTRY ARENA EXTRA 20730 549210 Extra WEST MIDLANDS COVENTRY
REDDITCH EXTRA 15090 601270 Extra WORCESTERSHIRE REDDITCH
LONGTON EXTRA 14800 518760 Extra STAFFORDSHIRE LONGTON
BIRMINGHAM ASTON LANE 13830 264620 Superstore WEST MIDLANDS BIRMINGHAM
DUDLEY 13120 396470 Superstore WEST MIDLANDS DUDLEY
NEW OSCOTT EXTRA 11760 348410 Extra WEST MIDLANDS SUTTON COLDFIELD
EDGBASTON 11750 185280 Superstore WEST MIDLANDS BIRMINGHAM
COVENTRY CROSSPT EXT 11730 201690 Extra WEST MIDLANDS COVENTRY
SOLIHULL EXTRA 11600 183710 Extra WEST MIDLANDS SOLIHULL
TELFORD EXTRA 11140 329130 Extra SHROPSHIRE TELFORD
CRADLEY HEATH EXTRA 10700 333120 Extra WEST MIDLANDS DUDLEY
COVENTRY WALSGRAVE 9090 262990 Superstore WEST MIDLANDS COVENTRY
EVESHAM WORCESTER RD 8810 365910 Superstore WORCESTERSHIRE EVESHAM
STRATFORD UPON AVON 8700 273120 Superstore WARWICKSHIRE STRATFORD-ON-AVON
WILLENHALL 8300 214120 Superstore WEST MIDLANDS WILLENHALL
WALSALL 8150 143070 Metro WEST MIDLANDS WALSALL
CANNOCK 7480 244640 Superstore STAFFORDSHIRE CANNOCK
HALL GREEN 7410 198050 Superstore WEST MIDLANDS SOLIHULL
BIRMINGHAM CAX METRO 7400 45130 Metro WEST MIDLANDS BIRMINGHAM
Slide 21
Source: dunnhumby (2010)
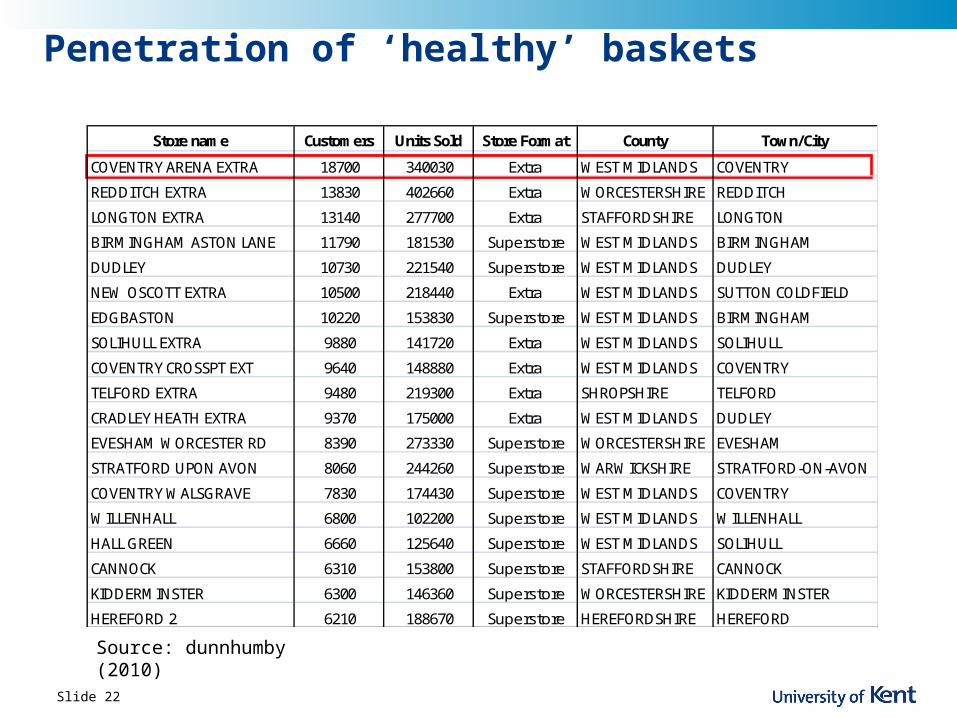
Penetration of ‘healthy’ baskets
Slide 22
Source: dunnhumby (2010)
Store name Customers Units Sold Store Format County Town/City
COVENTRY ARENA EXTRA 18700 340030 Extra WEST MIDLANDS COVENTRY
REDDITCH EXTRA 13830 402660 Extra WORCESTERSHIRE REDDITCH
LONGTON EXTRA 13140 277700 Extra STAFFORDSHIRE LONGTON
BIRMINGHAM ASTON LANE 11790 181530 Superstore WEST MIDLANDS BIRMINGHAM
DUDLEY 10730 221540 Superstore WEST MIDLANDS DUDLEY
NEW OSCOTT EXTRA 10500 218440 Extra WEST MIDLANDS SUTTON COLDFIELD
EDGBASTON 10220 153830 Superstore WEST MIDLANDS BIRMINGHAM
SOLIHULL EXTRA 9880 141720 Extra WEST MIDLANDS SOLIHULL
COVENTRY CROSSPT EXT 9640 148880 Extra WEST MIDLANDS COVENTRY
TELFORD EXTRA 9480 219300 Extra SHROPSHIRE TELFORD
CRADLEY HEATH EXTRA 9370 175000 Extra WEST MIDLANDS DUDLEY
EVESHAM WORCESTER RD 8390 273330 Superstore WORCESTERSHIRE EVESHAM
STRATFORD UPON AVON 8060 244260 Superstore WARWICKSHIRE STRATFORD-ON-AVON
COVENTRY WALSGRAVE 7830 174430 Superstore WEST MIDLANDS COVENTRY
WILLENHALL 6800 102200 Superstore WEST MIDLANDS WILLENHALL
HALL GREEN 6660 125640 Superstore WEST MIDLANDS SOLIHULL
CANNOCK 6310 153800 Superstore STAFFORDSHIRE CANNOCK
KIDDERMINSTER 6300 146360 Superstore WORCESTERSHIRE KIDDERMINSTER
HEREFORD 2 6210 188670 Superstore HEREFORDSHIRE HEREFORD

• Focus groups identified four key barriers to healthy eating amongst our target group cost (healthy foods were widely perceived as more expensive) time (in buying ingredients and preparing healthy meals) lack of cooking skills (fuelled by habitual purchase of convenience
foods) and perceived lack of taste of healthy options
“Putting a meal together is sometimes hard – with a burger it’s really easy, you know it goes with chips and peas or beans, but when you have a bunch of vegetables in front of you, you might not know what to do with it, so meal cards would be helpful… free, everyday cooking and within a budget as well – healthy and cheap because you are more likely to use all the ingredients”
“I don’t buy much healthy food because the kids won’t eat it, so why should I buy it if I end up throwing it away.... I have had 3 kids screaming at me all day so mealtimes I want to be peaceful, so I give them what they want”
23
Obesity Project – Key findings (Phase 1b)
Slide 23
24
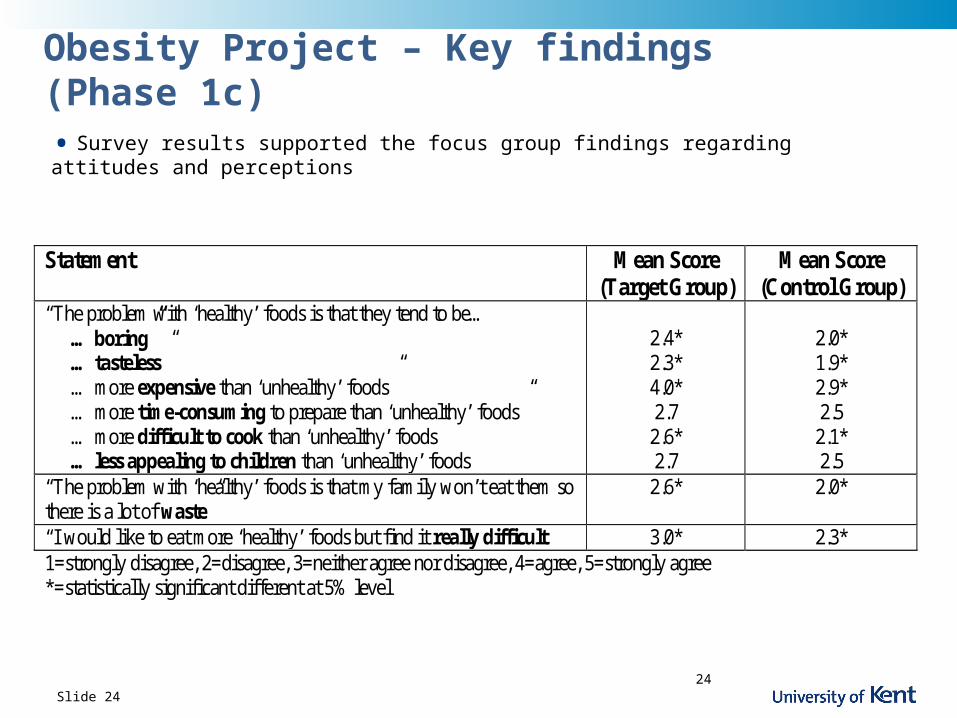
Obesity Project – Key findings (Phase 1c)
Slide 24
Statement Mean Score
(Target Group) Mean Score
(Control Group) “The problem with ‘healthy’ foods is that they tend to be…
… boring” … tasteless” … more expensive than ‘unhealthy’ foods” … more time-consuming to prepare than ‘unhealthy’ foods” … more difficult to cook than ‘unhealthy’ foods … less appealing to children than ‘unhealthy’ foods
2.4* 2.3* 4.0* 2.7
2.6* 2.7
2.0* 1.9* 2.9* 2.5
2.1* 2.5
“The problem with ‘healthy’ foods is that my family won’t eat them so there is a lot of waste”
2.6* 2.0*
“I would like to eat more ‘healthy’ foods but find it really difficult” 3.0* 2.3* 1=strongly disagree, 2=disagree, 3=neither agree nor disagree, 4=agree, 5=strongly agree *=statistically significant different at 5% level
• Survey results supported the focus group findings regarding attitudes and perceptions

25
Obesity Project – Key findings (Phase 1c)
Slide 25
• Survey results highlighted the dominant role of price – information alone is unlikely to change behaviour
Statement Mean Score
(Target Group) Mean Score
(Control Group) Supermarkets positioned ‘healthy’ foods more prominently on their shelves Manufacturers made the packaging of ‘healthy’ foods more attractive Supermarkets offered discounts on ‘healthy’ foods Supermarkets ran in-store cooking demonstrations with ‘healthy’ ingredients Supermarkets provided recipe ideas for ‘healthy’ meals The government introduced a tax on ‘unhealthy’ foods
3.1*
3.1* 6.1* 3.7
3.8* 5.1*
4.1*
3.7* 5.2* 3.9
4.6* 4.3*
1=not all likely, 7=extremely likely *=statistically significant different at 5% level
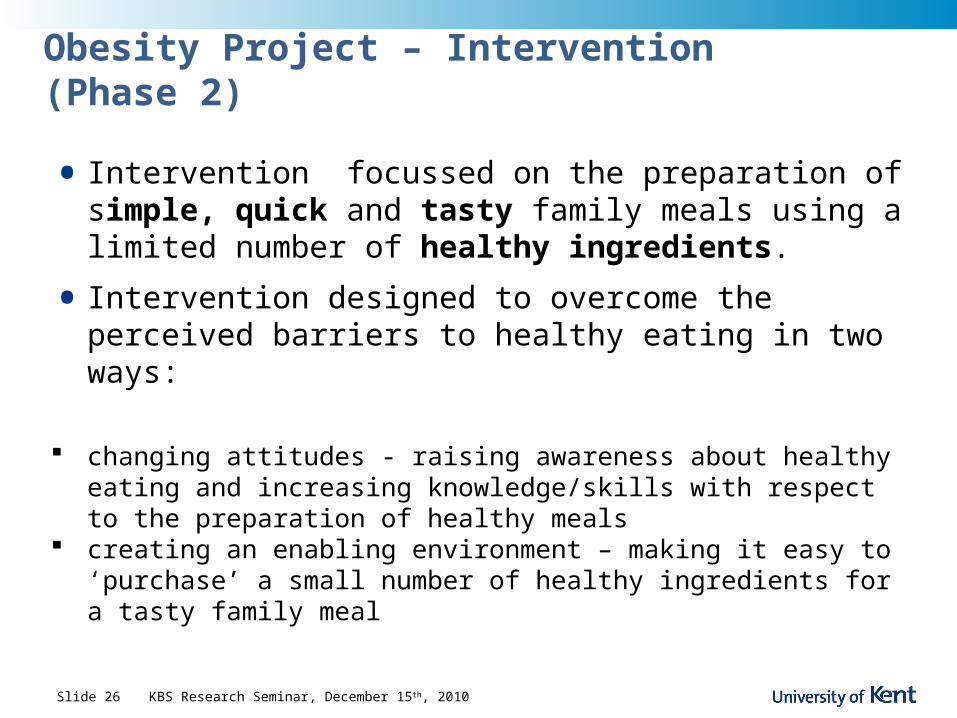
• Intervention focussed on the preparation of simple, quick and tasty family meals using a limited number of healthy ingredients.
• Intervention designed to overcome the perceived barriers to healthy eating in two ways:
changing attitudes - raising awareness about healthy eating and increasing knowledge/skills with respect to the preparation of healthy meals
creating an enabling environment – making it easy to ‘purchase’ a small number of healthy ingredients for a tasty family meal
Obesity Project – Intervention (Phase 2)
Slide 26 KBS Research Seminar, December 15th, 2010
Obesity Project – Intervention (Phase 2)
Slide 27
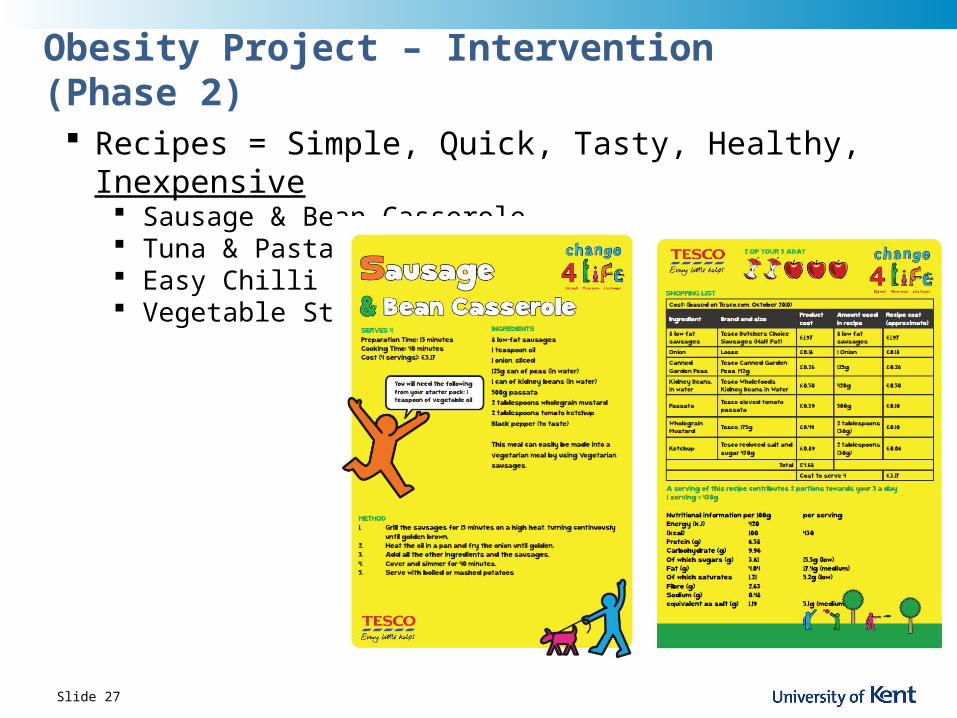
Recipes = Simple, Quick, Tasty, Healthy, Inexpensive Sausage & Bean Casserole Tuna & Pasta Bake Easy Chilli Vegetable Stew

• Four weekly cooking demonstrations outside the focal store (Tesco Coventry Ricoh Arena)
Obesity Project – Intervention (Phase 2)
Slide 28
People recruited from survey respondents, focus group participants and local agencies (e.g. Groundwork)
Offered free ingredients along with written cooking instructions, to enable them to try the dishes at home
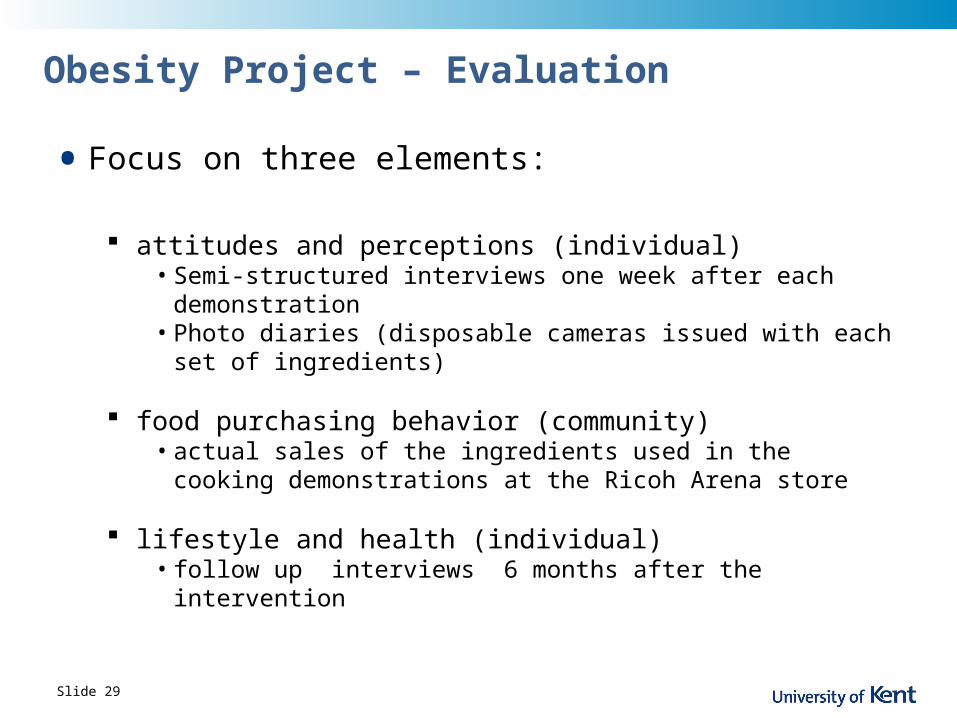
• Focus on three elements:
attitudes and perceptions (individual)• Semi-structured interviews one week after each demonstration • Photo diaries (disposable cameras issued with each set of
ingredients)
food purchasing behavior (community)• actual sales of the ingredients used in the cooking demonstrations
at the Ricoh Arena store
lifestyle and health (individual)• follow up interviews 6 months after the intervention
Obesity Project – Evaluation
Slide 29

• Claire – week 4
“I enjoyed it because it was a cheap affordable meal”
“As a child I wasn’t given vegetables, so I didn’t try them, and I’ve now got the strength to try these vegetables, and I’ve now realised that I like turnip too”
“I think children these days have a got a lot of changes in store, we’ve been giving them all these fast foods for too long now. And even myself, and I know with a busy lifestyle it was quite easy just to go to the chip shop and takeaway and McDonalds, its all on your doorstep now people are delivering, and now the fun in the kitchen starts, and I’ve got all the stuff there, I’ve got the food processor, I’ve got the food blender, I’ve got everything there but I never use it. They were ornaments in my kitchen, but not anymore! Now I actually use them”
Obesity Project – Evaluation
(attitudes and perceptions)
Slide 30
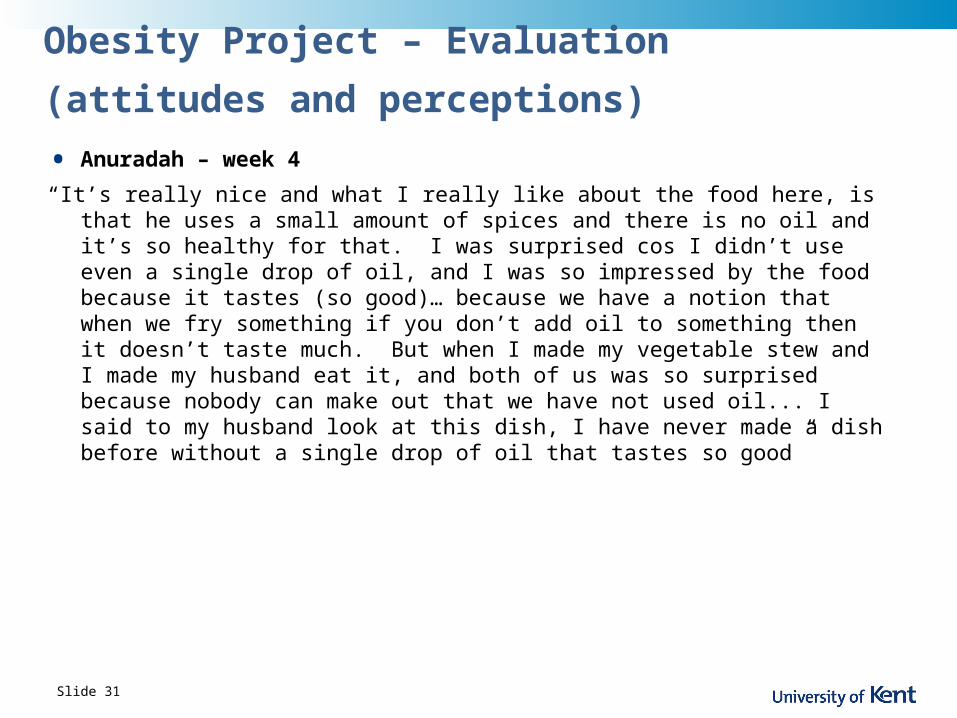
• Anuradah – week 4
“It’s really nice and what I really like about the food here, is that he uses a small amount of spices and there is no oil and it’s so healthy for that. I was surprised cos I didn’t use even a single drop of oil, and I was so impressed by the food because it tastes (so good)… because we have a notion that when we fry something if you don’t add oil to something then it doesn’t taste much. But when I made my vegetable stew and I made my husband eat it, and both of us was so surprised because nobody can make out that we have not used oil... I said to my husband look at this dish, I have never made a dish before without a single drop of oil that tastes so good”
Obesity Project – Evaluation
(attitudes and perceptions)
Slide 31

Obesity Project – Evaluation (food purchasing behaviour)
Slide 32
Source: dunnhumby (2010)
Casserole Sales by stores Customers Units soldCustomer
PenetrationSpend per Customer
Pre COVENTRY ARENA EXTRA 4250 8040 9.85% £0.72
% Change During vs Pre COVENTRY ARENA EXTRA 5.64% 5.59% 4.63% 5.20%
% Change Post vs Pre COVENTRY ARENA EXTRA 3.53% 2.36% -0.22% -1.51%
Pre ALL MIDLANDS STORES 219070 379300 12.16% £0.66
% Change During vs Pre ALL MIDLANDS STORES 8.26% 7.05% 6.60% 2.86%
% Change Post vs Pre ALL MIDLANDS STORES 6.44% 4.79% 3.36% 2.42%
Casserole Stores Selling Customers Units soldCustomer
PenetrationSpend per Customer
Pre COVENTRY ARENA EXTRA 810 1030 8.17% £0.72
% Change During vs Pre COVENTRY ARENA EXTRA -22.22% -20.29% -26.10% 5.20%
% Change Post vs Pre COVENTRY ARENA EXTRA -7.41% -4.90% -13.60% -1.51%
Pre ALL MIDLANDS STORES 28790 38390 9.17% £0.66
% Change During vs Pre ALL MIDLANDS STORES -1.95% -1.43% -3.15% 2.86%
% Change Post vs Pre ALL MIDLANDS STORES -2.29% -0.16% -2.41% 2.42%
All Shoppers
Target Group

Conclusions
Slide 33
4. Conclusions
• Interest in and application of social marketing is increasing in response to the growing need for behaviour change on a grand scale
• Changing behaviour is difficult, multi-faceted and takes time
• Evaluation of interventions (impact on behaviour) is critical given scarcity of resources and need to protect vulnerable groups
• We still have much to learn about what to do and how to do it!
Slide 34

Thank you!
• Keep in touch with us…
Website: http://www.kent.ac.uk/cvcr Blog: http://blogs.kent.ac.uk/value-chain-thinking Follow us on Twitter: @valuechains
Slide 35


