Page 1
1
UNIVERSITY OF NAIROBI
COLLEGE OF BIOLOGICAL AND PHYSICAL SCIENCES
SCHOOL OF MATHEMATICS
PROJECT IN SOCIAL STATISTICS
EXPLORING THE MAJOR CAUSES OF ROAD TRAFFIC ACCIDENTS IN
NAIROBI COUNTY
OLEMO CLIFFORD DANIEL
A RESEARCH PROJECT SUBMITTED TO THE SCHOOL OF MATHEMATICS
IN PARTIAL FULFILLMENT OF THE REQUIREMENT FOR THE AWARD OF
THE DEGREE OF MASTER OF SCIENCE IN SOCIAL STATISTICS OF THE
UNIVERSITY OF NAIROBI
NOVEMBER, 2016
Page 2
ii
DECLARATION
This is my original work and has not been presented for any academic award at the
University of Nairobi or in any other University.
Signature………………………………………………………Date……………………..
Olemo Clifford Daniel
I56/75573/2014
This research project has been submitted for presentation with my approval as the
university supervisor.
Signature………………………………………………………Date……………………..
Idah Orowe
School of Mathematics
Page 3
iii
DEDICATION
This Research Project Report is dedicated to my late mother Mrs Joan Opado for
believing in me. It is also dedicated to my late grandmother Mrs. Plister Opado and
cousin John Bosco who were victims of road accidents.
Page 4
iv
ACKNOWLEDGEMENT
I thank the almighty God for granting me the strength and good health during the period of this
study, and courage to complete this thesis.
I would like to acknowledge my Supervisor Mrs. Idah Orowe for her dedicated support
and guidance at the most opportune occasions throughout the process.
I also acknowledge the support I received from the Nairobi Traffic Police department and
the National Transport and Safety Authority (NTSA) for providing the necessary
information relevant to my research project.
Finally, I acknowledge my family, friends and colleagues who offered me a great support
system and encouragement to make sure that I finished this research project on time.
Page 5
v
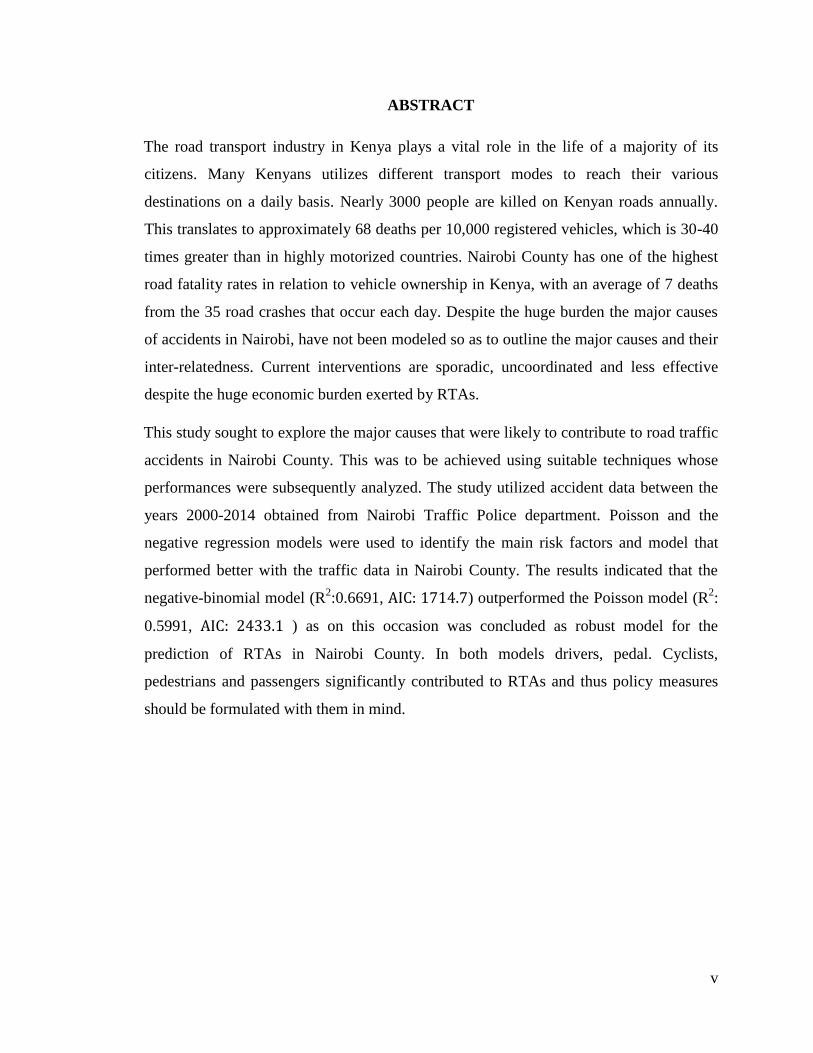
ABSTRACT
The road transport industry in Kenya plays a vital role in the life of a majority of its
citizens. Many Kenyans utilizes different transport modes to reach their various
destinations on a daily basis. Nearly 3000 people are killed on Kenyan roads annually.
This translates to approximately 68 deaths per 10,000 registered vehicles, which is 30-40
times greater than in highly motorized countries. Nairobi County has one of the highest
road fatality rates in relation to vehicle ownership in Kenya, with an average of 7 deaths
from the 35 road crashes that occur each day. Despite the huge burden the major causes
of accidents in Nairobi, have not been modeled so as to outline the major causes and their
inter-relatedness. Current interventions are sporadic, uncoordinated and less effective
despite the huge economic burden exerted by RTAs.
This study sought to explore the major causes that were likely to contribute to road traffic
accidents in Nairobi County. This was to be achieved using suitable techniques whose
performances were subsequently analyzed. The study utilized accident data between the
years 2000-2014 obtained from Nairobi Traffic Police department. Poisson and the
negative regression models were used to identify the main risk factors and model that
performed better with the traffic data in Nairobi County. The results indicated that the
negative-binomial model (R2:0.6691, AIC: 1714.7) outperformed the Poisson model (R
2:
0.5991, AIC: 2433.1 ) as on this occasion was concluded as robust model for the
prediction of RTAs in Nairobi County. In both models drivers, pedal. Cyclists,
pedestrians and passengers significantly contributed to RTAs and thus policy measures
should be formulated with them in mind.
Page 6
vi
TABLE OF CONTENT
DECLARATION ............................................................................................................... ii
DEDICATION .................................................................................................................. iii
ACKNOWLEDGEMENT ............................................................................................... iv
ABSTRACT ....................................................................................................................... v
TABLE OF CONTENT ................................................................................................... vi
LIST OF TABLES ......................................................................................................... viii
LIST OF FIGURES ......................................................................................................... ix
LIST OF ACRONYMS .................................................................................................... x
DEFINITION OF TERMS .............................................................................................. xi
CHAPTER ONE: INTRODUCTION ............................................................................. 1
1.1Background .................................................................................................................... 1
1.1.1 Global State of Road Traffic Accidents ................................................................. 1
1.1.2 Road Transportation in Nairobi County ................................................................. 2
1.1.3 Road Transport Agencies ....................................................................................... 3
1.2 Statement of the Problem .............................................................................................. 3
1.3 Study Objectives ........................................................................................................... 4
1.3.1General Objective ................................................................................................... 4
1.3.2 Specific Objectives ................................................................................................ 4
1.4 Significance ................................................................................................................... 4
1.5 Scope ............................................................................................................................. 4
CHAPTER TWO: LITERATURE REVIEW ................................................................ 5
2.0 Introduction ................................................................................................................... 5
2.1 Review of Previous Studies .......................................................................................... 5
2.2 Nairobi County Profile .................................................................................................. 7
2.3 Understanding Road Traffic Accidents in Kenya ......................................................... 7
2.4 Determinants of Road Traffic Accidents occurrence in Nairobi County ...................... 8
2.5 History of Motorcycles in Kenya .................................................................................. 9
2.6 Motorcycle accidents .................................................................................................. 10
Page 7
vii
2.7 Causes of Motorcycle Accidents ................................................................................. 10
CHAPTER THREE: METHODOLOGY ..................................................................... 12
3.0 Introduction ................................................................................................................. 12
3.2 Study Variables ........................................................................................................... 12
3.3 Poisson Regression Model .......................................................................................... 12
3.4 The Negative Binomial ............................................................................................... 13
3.5 Performance Measures ................................................................................................ 14
CHAPTER FOUR: DATA ANALYSIS AND RESULTS ........................................... 16
4.1 Introduction ................................................................................................................. 16
4.1.1 Description of the Study Area .............................................................................. 16
4.2 Descriptive Statistics ................................................................................................... 17
4.3Data Pre-processing ..................................................................................................... 17
4.4 Normality Test ............................................................................................................ 18
4.5Durbin-Watson Test ..................................................................................................... 19
4.5.1 Assumptions of the Durbin-Watson test: ............................................................. 19
4.5.2 Durbin-Watson test results ................................................................................... 20
4.6 Over-dispersion test results ......................................................................................... 20
4.7 Poisson regression model results ................................................................................ 21
4.8 Negative binomial regression model results. .............................................................. 22
4.9 Performances Measures .............................................................................................. 23
CHAPTER FIVE: CONCLUSIONS AND RECOMMENDATIONS ....................... 24
5.1. Introduction ................................................................................................................ 24
5.2. Summary of Findings ................................................................................................. 24
5.3. Recommendations ...................................................................................................... 24
5.3.1. Recommendation to Nairobi City County .......................................................... 24
5.3.2. Recommendation to planners and policy makers ............................................... 25
5.3.3. Recommendations for scholars ........................................................................... 25
References ........................................................................................................................ 26
Page 8
viii
LIST OF TABLES
Table 4.1. Descriptive statistics of variables ..................................................................... 17
Table 4.2. Kolmogorov-smirnov test results ..................................................................... 18
Table 4.3. Durbin – Watson test results ............................................................................ 20
Table 4.4. Over-dispersion test results .............................................................................. 21
Table 4.5. Poisson regression results ................................................................................ 21
Table 4.6. Negative-Binomial regression results .............................................................. 22
Table 4.7. Performance measures results .......................................................................... 23
Page 9
ix
LIST OF FIGURES
Figure 4.1. Map of Nairobi County ................................................................................... 16
Figure 4.2. Normal Q-Q plot ............................................................................................. 19
Page 10
x
LIST OF ACRONYMS
KeNHA - Kenya National Highway Authority
KeRRA - Kenya Rural Road Authority
KRA - Kenya Revenue Authority
KRB - Kenya Roads Board
KURA - Kenya Urban Roads Authority
PSV - Public Service Vehicle
RTAs - Road Traffic Accidents
RTIs - Road Traffic Injuries
Page 11
xi
DEFINITION OF TERMS
Boda-boda: Popular name for motor-bicycle taxis in Kenya
GDP: Gross Domestic Product, is a measure of the economic production of a particular
territory in financial capital terms over a specific time period
Matatu: A passenger service vehicle.
Road Traffic Accident (RTA): A collision between vehicles; between vehicles and
pedestrians; between vehicles and animals; or between vehicles and fixed obstacle.
Road Traffic Injuries (RTI): Are injuries occurring as a result of RTA.
Road User: Pedestrians and vehicle users which include all occupants (i.e. driver or rider
and passengers).
Road: Every public road system: state, regional or local road, or city street.
Vehicle: A machine that is used to carry people or goods from one place to another, it
could be a bicycle, motor cycle or three and above wheeled machine.
Slight injury: Is an injury of minor character (i.e. bruise, sprain, cut or laceration) that is
not judged to be severe and requires roadside attention.
Serious injury: Is an injury resulting to a person being detained in a health facility as an
“in patient”, or any of the following injuries whether or not detention result (i.e. fractures,
internal injuries, crushing, severe cuts and concussions). They do cause death 30 or more
days after the accident
Fatal injury: Is an injury resulting to death
Pedal-cycle: A vehicle operated solely by pedals and propelled by human power. This
includes bicycle, tricycle, unicycle, sidecar or trailer attached to any of the above listed
devices.
Page 12
1
CHAPTER ONE
INTRODUCTION
This chapter provides the background to the study, context, problem statement and the
objectives of the study. The purpose of this chapter is to provide an overview of the
research that is presented through the body of this work.
1.1Background
1.1.1 Global State of Road Traffic Accidents
A road accident refers to a collision involving one or more vehicles on the road, or a
pedestrian and results into death, injury or damage of property (Odhiambo et al, 2015).
Road traffic injuries place a heavy burden on global and national economies and
household finances. With more than 13 million deaths and 20 – 50 million injuries being
directly linked to road traffic accidents in the world, the social and economic burden
presents a compromising scenario for Kenya as a nation. Road accidents follow
HIV/AIDS and malaria as the leading causes of deaths in Kenya according (Odero,
Khayesi & Heda, 2003). This largely affects the economically productive population in
the country. About 23% of them are motorists, while pedestrians and cyclists account for
22 and 5 percent respectively. Other victims are pedestrians, vehicle occupants, and other
unspecified users who account for 31% and 19% of the rest of the deaths.
Most of the road accidents lead to fatalities or serious disabilities which disenfranchise
many families. In addition, family members are plunged into poverty because of the loss
of their usual breadwinner through death or the high costs incurred in medical costs
(WHO, 2009). Therefore, relevant authorities in the transportation sector need to make an
effort and enact policies or measures that would significantly reduce the impacts of road
accidents including fatalities, disabilities, morbidity and the related costs of medical
expenses associated with preventable road accidents.
Page 13
2
Most players in the transport sector blame the bad state of the Kenyan roads for the
numerous accidents. With the recent improvement of infrastructure however, fatal road
accidents continue to be reported. This elicited varied reactions from transport authorities
in Kenya including the ban on night travel on all Public Service Vehicles until they met
the stated requirements of the government. Public Service Vehicles operators have
protested this move claiming that the government has been insensitive about their needs.
The blame game between transport authorities and PSV operators continues even though
the much has been done to curb the number of road accidents. Traffic police has also
been on the receiving end following their role in reducing road accidents. Corruption has
been cited as one of the reasons the traffic police have failed to arrest the drivers found to
have infringed on the regulations of road use. Policies developed based on the
comprehensive statistical models are likely to lead to the development of a competitive
transportation network that will enhance Kenya’s role as a hub in East Africa.
1.1.2 Road Transportation in Nairobi County
Nairobi is the capital city of Kenya hosting national government ministries, businesses
and numerous economic activities. It is also an important economic hub for Eastern and
Central Africa. The population of Nairobi city has experienced a significant growth since
the year 2009 when it was at 3,138,000 (Population and Housing Census, 2009). The
city’ population continues to grow at the rate of 4.0%. Nairobi City had 1, 214. 5
kilometers of roads in 2006 of which 972 kilometers were paved while the remaining 178
were earth gravel roads. Continued urban sprawl has increased transportation in the city
with a large population relying on public transport system, which has been marked with
unstructured operations due to poor monitoring.
Many organizations in Nairobi city structure their work hours between 8.00 a.m. and 5.00
p.m. This system has caused a scramble among the people trying to access their
workstations or job opportunities within the set working hours. This has led to rapid
growth in non-conventional means of public transport comprising of minibuses, taxis
and more recently by commercial motorcycles. Most of these means are notorious for
flouting traffic rules resulting to externalities such as accidents, congestion and
Page 14
3
corruption. KIPPRA (2015: 1) estimates that in 2013 there were 2 million registered
vehicles in Kenya and 60% were used in Nairobi. The distance of the road network in
Nairobi as in 2012 was about 58,000 kilometers long (KRB, 2012), with an approximate
1.2 million vehicles using these roads.
1.1.3 Road Transport Agencies
The Roads Act of 2007 enacted established three new agencies in charge of road
infrastructure management, rehabilitation, maintenance and development. These are the
Kenya National Highways Authority (KeNHA); Kenya Rural Roads Authority (KeRRA)
and the Kenya Urban Roads Authority (KURA). The Kenya Roads Board (KRB) solicits
and distributes funds for development of the road infrastructure while the Nairobi Traffic
Department and City Inspectorate Department are responsible for enforcement duty to
ensure compliance with traffic Act and County Government regulations. The National
Transport and safety Authority (NTSA) whose vision is geared towards a sustainable,
safe road transport system with zero crashes has been instrumental in the efforts to reduce
road accidents and is responsible for registration, licensing and road safety. This informs
us that the government appreciates the role of road transport and research geared towards
addressing the influences of RTAs, which will foster a sound policy formulation
framework.
1.2 Statement of the Problem
Road accidents are among the leading cause of death and disability in Kenya. Nearly
three thousand people die annually because of accident related activities. This translates
to approximately 68 deaths per 10,000 registered vehicles, which is 30-40 times greater
than in highly motorized countries. Research indicates that about seven people die out of
thirty-five road crashes that occur each day in Nairobi. Despite the huge economic
burden exerted by RTAs, the major causes of accidents in Nairobi have not been
descriptively analyzed and modeled to outline the major causes and their inter-
relatedness. This emphasizes the need to comprehensively understand the major causes of
these accidents. This study therefore intends to utilize generalized linear models to
explore the major causes of road traffic accidents in Nairobi County that will help in
minimizing loss of lives through road accidents.
Page 15
4
1.3 Study Objectives
1.3.1General Objective
To explore major causes of road accidents in Nairobi county
1.3.2 Specific Objectives
i. To identify the suitable technique to model the injuries arising from road
accidents in Nairobi County.
ii. To compare the results of models used in estimating the daily number of
RTAs.
1.4 Significance
Researchers have been modeling RTAs with crash prevention models in various parts of
the world. This has however not been done in Kenya. It is essential to conduct research
to establish the main causes of Road Accidents and come out with the reality on the
ground so that, policy makers can design strategies that will effectively reduce the
numerous deaths caused by Road Traffic Accidents to the barest minimum in the country.
It is necessary to develop better prediction mechanism to plan for future occurrence. This
will help ensure that resources are channeled to the right direction geared towards
addressing the major cause of Road Traffic Accidents (RTAs) as many causes have
overtime been attributed to causing accidents in Nairobi. It will also aid in policy
formulation that would address the major causes of accidents thus reducing the number
of deaths resulting from RTAs in Kenya.
1.5 Scope
The study will be limited to roads in Nairobi County.
Page 16
5
CHAPTER TWO: LITERATURE REVIEW
2.0 Introduction
In 2010, the United Nations General Assembly adopted resolution 64/2551 proclaiming a
Decade of Action for Road Safety so as to stabilize and reduce the increasing trend in
road traffic fatalities. Interestingly RTAs in high income countries is expected to fall by
2020, while the converse is true for the developing countries (IRAP, 2009). More than
85% of RTAs occur in developing countries. The total number of losses realized in
developing countries annually exceed the annual amounts of aid and loans received for
the purpose of development. It has been suggested that the cost to the economy due
to RTAs costs an approximately 1- 2% of a country’s gross national product (WHO,
2012).
Road network in Kenya was historically developed as a subsidiary of the railway system
up to 1963 when she attained her independence, to forge a link between the railways and
the European-owned large-scale farmlands. Today road transport is the predominant
mode of transport ferrying about 93% of all cargo and passenger transport. Furthermore,
the government prioritizes road transport infrastructure as a leading developmental
agenda in its total investments in fixed assets and serves the domestic and regional
transport demand. The Northern Corridor is important as a freight transport corridor for
both import and exports for the countries in Eastern and Central Africa. Modelling the
major influences of RTAs will thus have a ripple effect on the neighboring economies.
2.1 Review of Previous Studies
A population based survey study on RTAs conducted in Nigeria, by Libinjo et al (2009)
revealed that RTAs was a significant problem claiming approximately 200,000 Nigerian
lives annually and injuring 4 million more. The loss to the economy was also
considerably high at $25 million per annum. The study also found that men were more at
risk of being involved in road accidents than women, while younger people, especially
those aged 18- 44 years, formed the bulk of road accident victims.
Page 17
6
Agoki (1992) indicates that RTAs causation factors may be traced to the road users,
vehicles or the road environment; and in Kenya the proportion is 80% traceable to road
users, 6% to vehicle and 14% to road environment. In Nairobi County the contribution by
road user factors is as high as 94% and an analysis of road traffic accident characteristics
revealed four major groupings of factors influencing RTAs namely; pedestrian factors;
land use factors; road layout factors, vehicular factors and traffic control device factors
(Agoki, 1992). These variables are also to be considered in our study.
Technical reports by the National Transport and Safety Authority recommends road
safety be made an integral component in urban planning. Many stakeholders outline the
importance of urban traffic planning for road safety and enforcement of traffic rules &
regulations. This study will go further in addressing the missing link where all the road
safety stakeholders are involved in formulating road safety programs and interventions in
order to reduce the scale of RTAs in Nairobi County.
Kim et al (1995) utilized a log-linear model to explain the role of driver behaviors in the
causal sequence that led to more severe injuries. They showed that behaviors of alcohol
use and lack of seat belt use greatly increased the odds of more severe crashes and
injuries. This was also employed by Akomolafe (2007) when he utilized the Artificial
Neural Network using Multilayer perceptron to predict likelihood of accident happening
at a particular location between the first 40 kilometers along Lagos-Ibadan Express road.
Statistical research on the causes and effects of RTAs in Nairobi County is a green field
of research. This might be as a result of inadequate information and institutional
framework dedicated to combating it. The Nairobi traffic department that is tasked with
collecting data is the best equipped in the county when compared to the other
departments. Despite the urgent need to combat death, injuries and costs affiliated to road
traffic accidents, no statistical model has been developed to address the causative factors
of RTAs in Nairobi. Instead, risk factors contributing to the accident like over-speeding,
seat-belt use, alcohol use and old-age have been overemphasized at the expense of the
direct accident causes.
Page 18
7
2.2 Nairobi County Profile
Nairobi County has an area of 684 sq. km and is the only city in the world with a national
park. It is the commercial hub of Eastern and Central Africa harboring close to over 100
international organizations and companies such as the United Nations Environmental
programme (UNEP). The Nairobi Stock Exchange (NSE) is one of the biggest stocks
markets in Africa. It has nine districts namely Kasarani, Dagoretti, Westlands, Starehe,
Langata, Kamukunji, Njiru, Embakasi and Makadara. The major roads in the city are
Thika road, Waiyaki road, Langata road, Uhuru highway, Mombasa road, Juja road,
Jogoo road, Magadi road, Valley road and Limuru road.
Nairobi’s high population density and expansion rate has outstripped the capacity of its
road network as the county is unable to connect every locality. Approximately a great
percentage of the city residents rely on a fleet of about twenty thousand personal
minibuses known as matatus (KBNS, 2014). Nonetheless, Nairobi County roads are
reported to be the world’s fourth most congested (IBM, Commuter Pain Survey, 2011).
The Kenyan government estimates that the traffic jams cost $578,000 a day, in terms of
lost productivity to the County (Bloomberg Business, 2014). Notably, a faster means of
transportation has become a necessity rather than a luxury as during peak hours many of
the roads are rendered impassable by vehicles, elevating motorcycles as the quick and
reliable form of transportation.
2.3 Understanding Road Traffic Accidents in Kenya
In 1986 a research study done by UK Transport Research Laboratory (TRRL) rated
Kenya as 5th out of 29 worldwide selected countries in terms of highest number of
accidents per licensed vehicles. Since then, the reported accidents continued to rise. In
1990, 10300 people were injured while in the year 2000, 13900 were injured. This
translated to a 3 percent growth rate per annum. During the same period an average of 0.8
percent growth of vehicle population was realized rising from 350,000 vehicles to
530,000 vehicles, (Ministry of Transport, 2010). The Nation realized a road traffic
fatality rate of 59.96 per 100,000 populations in 2009, with vehicle passengers being the
most affected. This was much higher compared to the global figure of 21.5 per 100,000
Page 19
8
populations for low-income countries and 10.3 per 100,000 for high income countries.
However, recent statistics indicate that the number of reported accidents has decreased
from 12,399, in 2004 to 6205 in 2013, but ironically the number of persons killed and
those injured have increased.
A report by the Kenya Roads Board, 2009 indicates that 85.5% of all road accidents that
occurred were as a result of human factors on the part of drivers and motorcyclists
(43.6%), pedestrians (24.8%), passengers (4.8%) and pedal-cyclist (10.3%). According to
(Ogendi et al, 2013), passengers on motorcycles, the elderly, children and pedestrians are
among the most vulnerable road users. RTA fatalities have laid big burden to the victim’s
families, dependents, society and government at large. It has placed strain on health care
services in terms of financial resources, bed occupancy, and demand placed on health
professionals (WHO, 2009). In 1991, RTIs were estimated to cost Kenyans
approximately US$3.8 billion annually, corresponding to 5 percent of the annual gross
national product (Odero, et al., 2003). This was however thought to be a conservative
estimate because it did not include costs associated with lost productivity and other
related costs due to the years of life lost (William Maina & Kent A. Stevens 2012).
Fatalities due to RTIs increased at an annual rate of 7 percent for the period 2004 to 2009.
(Bachani, et al., 2012), therefore, a great relief would be realized if ways of minimizing
these occurrences could be discerned.
2.4 Determinants of Road Traffic Accidents occurrence in Nairobi County
Understanding the effect of a risk factor is very important towards identifying the exact
cause of an accident. Causation may be attributed to human related factors, road factors,
environmental factors and vehicular factors. Human factors are triggered directly by the
human behavior when in the vicinity of the road. According to the Kenya Traffic Police
department pedal, driver, pedestrian, cyclist, passengers are categorized as the human
factors directly responsible for accidents in Nairobi County. There are also different risk
factors that are connected to immediate cause of accidents. Fatigues, overtaking
improperly, negligence, inexperience, illness are some of the risk factors likely to result
into the occurrence of an accident.
Page 20
9
Road factors are risk factors that are associated with the road as an accident cause and
include a slippery road surface, excessive dust obscuring road user view and dilapidated
road surface. Environmental factors constitute weather and animals. Example of
situations are fog or mist, torrential rain, glaring sun and animal in the carriage way.
Vehicular factors are the mechanical defects on the vehicles and any vehicle feature that
may contribute to an accident occurring.
2.5 History of Motorcycles in Kenya
Howe (2003) asserts that boda boda transport services originated from Ugandan as a new
innovation. Initially this mode of transport was provided on a bicycle but the sector has
now evolved in Kenya to include motorcycles. The motorcycle sector in Kenya is fast
evolving and they are extensively utilized as the preferred mode of transport in the
neglected rural villages and the otherwise inaccessible areas. According to the NTSA,
90% of the registered motorcycles are used for passenger transport. In the year 2014, the
industry contributed close to 2.2 billion shillings to the economy. The rapid increase and
use of motorcycles in Kenya is attributed to four factors first, the zero-rating of all
motorcycles below 250cc by the Government in 2008. Second, the current transport
system’s inability to fully meet the commuters’ transportation needs (Kumar & Barret,
2008). Third, the high levels of unemployment forcing mostly the young people to
embrace the business as a form of employment (Nyachieo, 2012). It offers direct
employment to close to 100,000 Kenyans with over 30,000 based in Nairobi. Fourth,
entry into the motorcycle business is easy as there are fewer restrictions. One only needs
to know how to ride a motorcycle (formally or informally) and they are in business.
Notably in the case of motorcycle riding in Kenya, there is lack of documented
information on motorcyclists formally trained through driving schools despite the
increasing cases of motorcycle accidents among boda boda riders. Formal training is
associated with acquisition of riding skills and safety knowledge. Therefore trained
motorcycle riders are expected to have a certain level of road safety knowledge.
Page 21
10
2.6 Motorcycle accidents
Kenya has reported a continuous increase in the number of motorcycles as is indicated by
data from the Kenya Revenue Authority (KRA). For instance, annual registrations of
motorcycles increased by 3730% from 3,759 in 2005 to 140,215 in 2011 (KRA, 2012). In
the same way, accidents involving boda boda motorcycles have also exhibited an upward
trend. For example nationally, deaths and injuries related to motorcycles accidents have
increased by a factor of 4.4, from 451 in 2005 to 1,991 in 2013.
In 2010, a total of 3,055 road traffic deaths were reported by the Kenya Traffic Police of
which approximately 7% were motorcyclists (World Health Organization, 2013).
According to National Transport and Safety Authority, between 1st and 13th January
2016, the number of motorcyclist who died due to motorcycle accident have increased by
40% and the number could increase in the remaining months of 2016 if no interventions
are made. Hurt, Quellet, & Thom, (1981) observe that riders of motorcycles received
their raining from friends and family or unqualified trainers.
In spite of offering advantages such as affordability, availability, flexibility and even
ability to travel on poorly maintained roads, safety concerns have emerged. The
motorcycle taxis have been categorized as having a poor road safety record that increased
by 58% during the first four months of 2015. Road traffic injury patients represent
between 45-60% of all admissions to surgical wards. It is essential to note that Kenyatta
National Hospital identified the need to have to improve its capacity to address accidents
and converted some of its wards for emergency use. These wards include 6A, C, and D
that receives the large number of motorcycle victims brought into the hospital. If nothing
is done more accidents are likely to occur with serious socio-economic implications.
2.7 Causes of Motorcycle Accidents
According to the Kenya Traffic Police department different vehicles are primarily
responsible for causing RTAs on the Kenyan roads. These have been classified as motor
cars, Lorries, buses and taxis, motorcycles, pedal cycles, animals and matatus. About 582
cases people who were involved while using motorcycles accidents were recorded in high
Page 22
11
numbers. The number of cases has continued to sour with motorcycles accounting for
18% of annual road fatalities.
Rapid growth in the use of motorized two-wheeled vehicles in Kenya has been
accompanied by increases in injuries and fatalities among its users. The problem of
untrained riders has been a stubborn stain on the motorcycle industry resulting to its
publicity. As a matter of priority the causes of RTAs in Kenya should thus be established
in earnest.
Page 23
12
CHAPTER THREE: METHODOLOGY
3.0 Introduction
The goal of any robust model-building technique is to identify the best fitting and the
most parsimonious model that describes the relationship between a given outcome
(dependent or response) variable and a set of independent variables (covariates).
3.2 Study Variables
a. Dependent variable (Y) – Number of Injuries
b. Independent variables ( )
i. Drivers
ii. Pedestrians
iii. Pedal Cyclists
iv. Passengers
v. Animals
vi. Obstruction
vii. Vehicle Defect
viii. Road Defects
ix. Weather
3.3 Poisson Regression Model
The Poisson modelling approach is often referred to as an ideal baseline model for
modelling count data. It dominates the count data modelling activities as it suits the
statistical properties of count data and is flexible to be parameterised into other form of
distribution functions (Shanker, 1995; Cameron et al, 1998).
In this model, the number of accidents(Y) is the dependent variable and it is generated as:
The primary equation of the model is:
Page 24
13
The mean µ is let to depend on a given vector of explanatory variables resulting to a
simple linear model of the form:
However, the linear predictor part can be taken to assume any value, whereas the Poisson
mean is taken to be a non-negative since it represents the expected count.
The solution is to model the logarithm of the mean function using the linear model. The
log-linear specification will be:
According to G. Rodriguez, the log link function is advantageous as it stems from the
empirical observations of the count data. The effects of the model predictors is
considered multiplicative rather than additive. That is, one typically observes small
effects for small counts and large effects for large counts.
Thus, expected number of accident is given by:
Assumption of the Poisson Model
The major assumption of the Poisson model is:
If then there is over-dispersion.
Then under-dispersion has occurred.
3.4 The Negative Binomial
The Poisson regression approach assumes a log linear relationship between its parameter
and the explanatory variables.
Where;
Page 25
14
The negative binomial regression relaxes the assumption of equality of the mean and
variance. By adding a gamma - distributed error term ( ), equation is rewritten as,
The error term makes the variance to be distinct from the mean and is gamma-
distributed with a mean of 1 and variance . The addition of makes the variance to be
different from the mean as follows:
[ ]
Where following a gamma distribution and is the
mean from a Poisson process.
Therefore, the negative binomial is a mixture of two distributions (Poisson-Gamma) and
was first derived by Greenwood and Yule (1920). It was developed to account for over-
dispersion that is commonly observed in discrete or count data (Lord et al., 2005).
When the dispersion parameter approaches zero, the variation of the model is almost
equal to mean of the distribution, and can thus be modeled using the Poisson regression
approach.
The primary equation of the negative binomial model is given as:
( )
The formula integrating is as follows:
(( ⁄ ) )
( ⁄ ) (
⁄
( ⁄ ) )
⁄
(
( ⁄ ) )
; Where, is a gamma function.
The model is estimated by the standard maximum likelihood method. The corresponding
likelihood function is outlined in equation
∏ (( ⁄ ) )
( ⁄ ) (
⁄
( ⁄ )
)
⁄
(
( ⁄ )
)
This function is maximized to obtain coefficient estimates for β and
3.5 Performance Measures
We employ root mean squared error (RMSE) (Ghaffari et al, 2006)
∑
Page 26
15
The coefficient of determination reflects the degree of fit for the mathematical model
(Sin et al, 2006). The model with the highest is considered best.
∑
∑
Absolute average deviation (AAD) could also be used to the output error between the
actual and predicted output (Bas & Boyaci, 2007)
{[∑ ⁄ ] ⁄ }
Where:
- predicted value
– actual value
– average of the actual values
Page 27
16
CHAPTER FOUR: DATA ANALYSIS AND RESULTS
4.1 Introduction
This chapter briefly describes our study area and details the results generated from data
analysis.
4.1.1 Description of the Study Area
Figure 4.1. Map of Nairobi County
Nairobi county is situated at 1 o
17’S 36o49’E in south central Kenya, 140 kilometers
south of the equator. The county is surrounded by 113 sq.km of cliffs, plains and forest. It
is adjacent to the eastern edge of the Rift Valley, and to the west are the Ngong hills.
Nairobi is the capital and largest city of Kenya with a population of approximately 3
million people living in 17 constituencies.
Page 28
17
4.2 Descriptive Statistics
Monthly data, from the Nairobi traffic department was collected from 2002 to 2014 and it
comprised of nine variables namely drivers, pedal cyclist, pedestrians, passengers,
animals, obstruction, vehicle defects, road defects and weather.
Variables N Range Minimum Maximum Mean Std.
Deviation
Variance
Driver 156 130 57 187 122.19 28.037 786.066
Pedal.
Cyclist
156 78 2 80 12.26 8.027 64.439
Pedestrians 156 183 16 199 78.86 33.943 1.15E+03
Passengers 156 52 0 52 11.34 7.726 59.692
Animals 156 3 0 3 0.21 0.655 0.428
Obstruction 156 11 0 11 0.85 1.611 2.595
Vehicles.
Defects
156 13 0 13 1.97 2.278 5.187
Road.
Defects
156 5 0 5 0.36 0.889 0.791
Weather 156 14 0 14 0.29 1.385 1.918
Table 4.1. Descriptive statistics of variables
4.3 Data Pre-processing
The data used in modeling was normalized to prevent and overcome the problem
associated with extreme values:
i.e.
Where;
Page 29
18
4.4 Normality Test
The Kolmogorov - Smirnov test was conducted to determine the normality of our data
distribution.
Results:
D-value 0.6994
P -value <0.001
Table 4.2. Kolmogorov-smirnov test results
The D-value was 0.6994 with an associated p-value < 0.001, the study rejected the null
hypothesis, and thus the data is non-normal.
Page 30
19
Figure 4.2. Normal Q-Q plot
4.5 Durbin-Watson Test
4.5.1Assumptions of the Durbin-Watson test:
The regression model includes an intercept term. The repressors are fixed in repeated
sampling. The error term of the regression follows the first-order autoregressive (AR1)
scheme. The error term is normally distributed. The repressors do not include the lagged
value(s) of the dependent variable (Kramer, 2011).
Autocorrelation is a relationship, between values separated from each other by a given
time lag; in this case, our data has been separated by months. Residuals are the prediction
errors in our model.
Page 31
20
Where;
Our accident data is a time series, and so we need to test for stationarity
Null hypothesis: There is no lag one autocorrelation in the residuals (Errors are serially
uncorrelated)
Alternative hypothesis: There is lag one autocorrelation in the residuals. If there is no
autocorrelation, the Durbin-Watson distribution is symmetric around 2.
4.5.2 Durbin-Watson test results
DW (d-value) 1.7687
p-value 0.1095
Table 4.3. Durbin – Watson test results
A two-sided test was used to check for negative as well as positive autocorrelation. The
d-value is 1.7687, which implies that there was no correlation in the residuals. Our p-
value was 0.1095, thus there is no significant auto correlation remaining in the residuals.
The Durbin-Watson test was utilized in this study, to test whether errors had
autocorrelation or not. The study concluded with 95% certainty that there was no
significant evidence of autocorrelation.
4.6 Over-dispersion test results
In a Poisson model, the mean and variance are equal. This test, tests this assumption as a
null hypothesis against an alternative where [ ] [ ] [ ]
The constant α takes values greater than zero or less than zero, which results to over
dispersion and under-dispersion respectively.
Page 32
21
z-value
P -value
α 6.337604
Table 4.4. Over-dispersion test results
The study concluded that there was significant evidence of over dispersion ( was
estimated to be 6.337604), which is against the assumption of equi-dispersion i.e.
4.7 Poisson regression model results
The study fitted a Poisson regression as its baseline model and the following output was
recorded.
Estimate Std. Error Z-value Pr (>|z|)
Intercept 5.0190 0.2025 247.8890 0.0000
Driver 0.0047 0.0002 28.6500 0.0000
Pedal. Cyclist 0.0051 0.0006 8.9200 0.0000
Pedestrians 0.0024 0.0002 15.6050 0.0000
Passengers 0.0080 0.0007 7.6330 0.0000
Animals 0.0036 0.0063 0.5660 0.5717
Obstruction 0.0075 0.0027 2.8250 0.0047
Vehicles. Defects -0.0050 0.0018 -2.7150 0.0066
Road. Defects -0.0004 0.0056 -0.0690 0.9453
Weather -0.0140 0.0029 -4.7860 0.0000
Table 4.5. Poisson regression results
Injuries = 5.0190+0.004732(Drivers) +0.0051(Pedal. Cyclists ) +0.0024( Pedestrians )
+0.0080( Passengers ) +0.0036( Animals ) +0.0075( Obstruction ) -0.005( Vehicle.
Defects) -0.0004(Road. Defects) -0.0140(Weather)
AIC: 2433.1
Page 33
22
4.8 Negative binomial regression model results.
Estimate Std. Error Z-value Pr (>|z|)
Intercept 4.9975 0.0570 87.6040 0.0000
Driver 0.0049 0.0005 10.0610 0.0000
Pedal. Cyclist 0.0049 0.0018 2.7460 0.0060
Pedestrians 0.0026 0.0005 5.5370 0.0000
Passengers 0.0045 0.0020 2.2840 0.0224
Animals 0.0034 0.0187 0.1800 0.8574
Obstruction 0.0084 0.0084 0.9910 0.3215
Vehicles. Defects -0.0054 0.0056 -0.9560 0.3391
Road. Defects 0.0029 0.0165 0.1770 0.8593
Weather -0.0155 0.0094 -1.6550 0.0980
Table 4.6. Negative-Binomial regression results
Injuries=4.9975+0.0049(Drivers) +0.0049(Pedal. Cyclists ) +0.0026( Pedestrians )
+0.0045( Passengers ) +0.0034( Animals ) +0.0084 ( Obstruction ) -0.0054( Vehicle.
Defects) +0.0029(Road. Defects) -0.0155(Weather)
AIC: 1714.7
The study noted from the results in that drivers, pedal cyclists, pedestrians and passengers
significantly determined the total number of injury occurrence in Nairobi county. The
positive regression estimates indicated that the number of injuries was directly influenced
by the significant variables.
Page 34
23
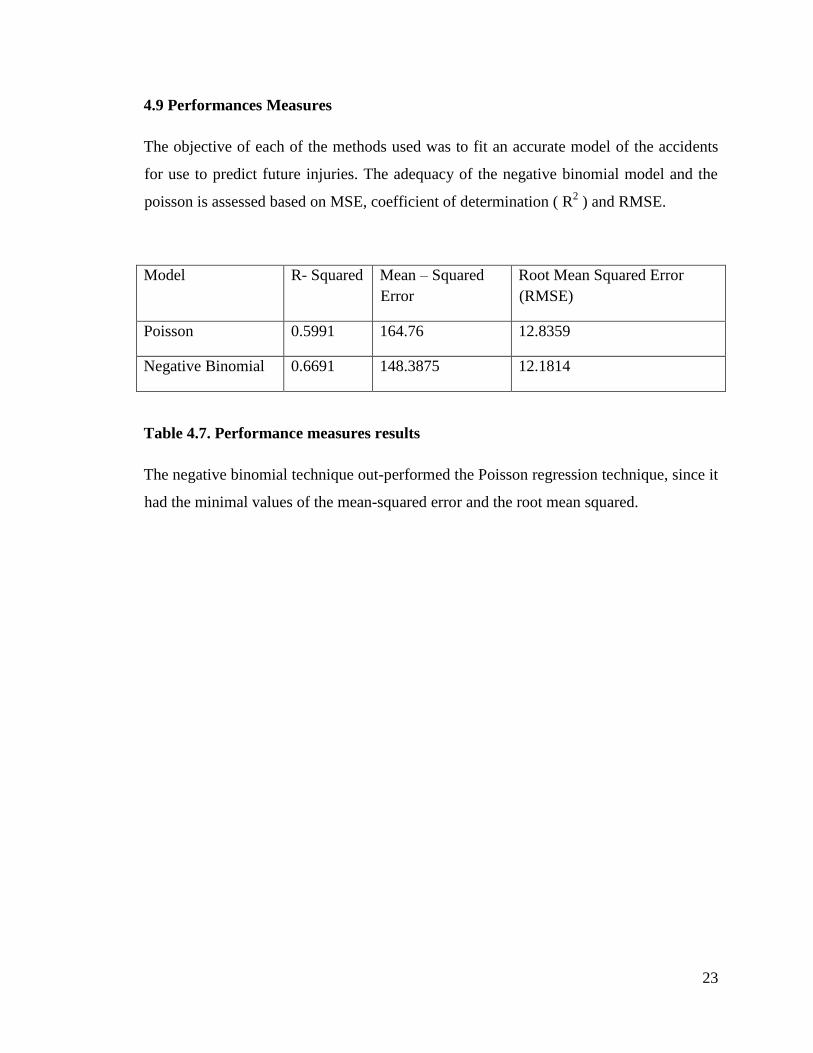
4.9 Performances Measures
The objective of each of the methods used was to fit an accurate model of the accidents
for use to predict future injuries. The adequacy of the negative binomial model and the
poisson is assessed based on MSE, coefficient of determination ( R2 ) and RMSE.
Model R- Squared Mean – Squared
Error
Root Mean Squared Error
(RMSE)
Poisson 0.5991 164.76 12.8359
Negative Binomial 0.6691 148.3875 12.1814
Table 4.7. Performance measures results
The negative binomial technique out-performed the Poisson regression technique, since it
had the minimal values of the mean-squared error and the root mean squared.
Page 35
24
CHAPTER FIVE: CONCLUSIONS AND RECOMMENDATIONS
5.1. Introduction
Based on study results, there is an urgent need to address the root causes of accidents in
Nairobi County. Laws and regulatory frameworks should be formulated and enforced
promptly to avoid losses caused by the occurrence of an accident.
5.2. Summary of Findings
The results attest that a robust model will be beneficial in so far as RTAs mitigation and
prevention is concerned. Given the nature of data being handled, a parsimonious model
should always be chosen. In this study the negative binomial was chosen given that our
data was over-dispersed.
The study also concluded that the causes of RTAs in Nairobi County are multi-factorial
and can be categorized into driver factors, vehicle factors and roadway factors. Driver
factors relates to all proximate factors affiliated to the diver that may result to an accident
occurring. Speeding is a leading cause of accidents and policy should be geared towards
addressing driver behavior as it predisposes the driver and other road users to injury.
5.3. Recommendations
From the results and finding in the study this recommendations if implemented will
significantly reduce the number of accidents in Nairobi County. Additionally, motor
cyclists should undergo formal training on road safety; increase levels of road use
awareness among pedestrians, enforce use of seatbelts and discourage carrying excessive
passengers.
5.3.1. Recommendation to Nairobi City County
The public should be sensitized on safe practices on the roads. Bumps should be erected
in regions with a high population density.
Page 36
25
5.3.2. Recommendation to planners and policy makers
RTAs require a collaborative approach in from different sectors so as to address RTAs in
a holistic manner. Pedestrian’s walkways and pedal-cyclists lanes should be factored in
road design. The government, the police, the health personnel and general public should
be incorporated into preventive measures to be formulated. Road safety professionals
should be trained, to monitor the magnitude, severity and burden resulting from RTAs in
Nairobi County to counteract the paucity of evidence occasioned by insufficient data
handling skills. City planning should incorporate all road users in mind and should focus
more on the behavior and the setting. Law enforcement officers should also be trained on
different important aspects of road safety.
5.3.3. Recommendations for scholars
Future research should focus on the spatial modeling of road traffic accidents.
Page 37
26
REFERENCES
Abdel-Aty, M. A. and H. T. Abdelwahab (2004). Predicting injury severity levels in
traffic crashes: a modeling comparison. Journal of transportation engineering
130(2), 204–210.
Abdelwahab, H. T. & Abdel-Aty, M. A. Development of Artificial Neural Network
Models to Predict Driver Injury Severity in Traffic Accidents at Signalized
Intersections. Transportation Research Record 1746, Paper No. 01-2234.
Abdelwahab, H. T. and M. A. Abdel-Aty (2002). Investigating driver injury severity in
traffic accidents using fuzzy artmap. Computer-Aided Civil and Infrastructure
Engineering 17 (6), 396–408.
Agoki, G.S. (1992). Road Traffic Accidents in Kenya with special reference to the City
Agresti, A. (2013). Categorical data analysis. John Wiley & Sons.
Ahmed, A., B. A. Khan, M. B. Khurshid, M. B. Khan, and A. Waheed (2015). Estimating
national road crash fatalities using aggregate data. International journal of injury
control and safety promotion (ahead-of-print), 1–6.
Akomolafe, O.P. (2004); predicting possibilities of Road Accidents occurring, using
Neural Network. M. Sc. Thesis, Department of Computer Science, University of
Ibadan
Asingo P.O. (2004). The institutional and organizational structure of public road transport
in Kenya. IPAR Discussion Paper No.50
Chitere, P. O. and T. N. Kibua (2012). Efforts to improve road safety in kenya. Nairobi,
Institute of Policy and Research.
Dahdah, S. and D. Bose (2013). Road traffic injuries: A public health crisis in the middle
east and north africa. Transport Notes (TRN-45).
Di Gallo, A., J. Barton, and W. L. Parry-Jones (1997). Road traffic accidents: early
psychological consequences in children and adolescents. The British Journal of
Psychiatry 170(4), 358–362.
Page 38
27
Haykin, S. (2001). “Neural Networks – A Comprehensive Foundation”. IEEE Press, New
York.
Hornik, K. (1993), “Some new results on neural network approximation”. Neural
Networks, 6, pp. 1069-1072.
International Road Assessment Program: Kenyan Report (2009)
Kenya Roads Board Report (2009)
Kim, K., L. Nitz, J. Richardson, and L. Li (1995). Personal and behavioral predictors of
automobile crash and injury severity. Accident Analysis & Prevention 27(4), 469–
481.
National Transport and Safety Authority. Website, 2016
Odero, W., Khayesi, M., & Heda, P.M. (2003). Road traffic injuries in Kenya:
Magnitude, causes and status of intervention. International Journal of Injury
Control Safety Promotion, 10, 53–61.
Odhiambo, N., Wanjoya, A., Waititu, G. (2015). Modeling Road Traffic Accident Injuries
in Nairobi County: Model Comparison Approach. American Journal of
Theoretical and Applied Statistics.Vol.4, No. 3, 2015, pp. 178-184.
of Nairobi. African Urban Quarterly, Vol.7. Nos.1 and 2.
Ogendi J., Odero W, Mitullah W., and Khayesi M. (2013) Pattern of Pedestrian Injuries
in the City of Nairobi: Implications for Urban Safety Planning. Journal of Urban
Health: Bulletin of the New York Academy of Medicine, (90), 5.
Republic of Kenya (2004). National road Safety Action Plan (2004- 2014) .Produced and
Coordinated under the Ministry of Transport Funded by GOK/SIDA Roads 2000
Project. Republic of Kenya (2010). Kenya Police Report 2010.
WHO. Road traffic accidents in developing countries. Technical report series No. 73.
World Health Organization, Geneva 1984
World Health Organization (2009). Global Status Report on Road Safety 2009: Time for
action.
Page 39
28
World Health Organization (2013). Global Status Report on Road Safety 2013:
Supporting a decade of action.
World Health Organization, (2013). Road traffic injuries. Fact sheet No. 358 March 2013.
Accessedon October 4, 2014. At
http://www.who.int/mediacentre/factsheets/fs358/en/.