Exploring tourism and hospitality opportunities in the gay and lesbian marketplace.
2010
Special Thanks to this Year’s Study Sponsors & Partners:
Community Marketing, Inc., 584 Castro St. #834, San Francisco CA 94114 USA • +1 415/437-3800 • www.CommunityMarketingInc.com
Page 1 of 1
CMI’s 14th Annual
Gay & Lesbian Tourism Study
December 28, 2009 N= 4,726
INTRODUCTION Findings from Community Marketing, Inc.’s (CMI) 14th Annual Gay & Lesbian Tourism Study have been compiled from responses from self-identified gay and lesbian consumers who read LGBT publications, visit LGBT websites, interact with LGBT organizations and/or attend LGBT events. With over 4,700 responses, CMI samples far more qualified respondents than any other LGBT tourism research, and offers valuable insights about consumers who may be reached through LGBT-dedicated marketing initiatives. In addition to the Tourism Study, CMI produces the annual LGBT Consumer Index®, online surveys, telephone interviews, focus groups, field studies and customer satisfaction evaluations for a wide variety of clients including CVBs, DMOs and tourism offices, tour operators, hospitality groups, developers, etc., as well as leaders in other industries. Based on tourism industry data from the US Department of Commerce and CMI sample demographics, the annual economic impact of LGBT travelers is approximately $63.3 billion in the US alone. This report contains a detailed statistical analysis of the results for the 14th Annual Gay & Lesbian Tourism Survey. Of the 7,078 total survey participants in this year’s study, 4,726 are LGBT consumers who reside in the United States.
Community Marketing, Inc., 584 Castro St. #834, San Francisco CA 94114 USA • +1 415/437-3800 • www.CommunityMarketingInc.com
Page 2 of 2
METHODOLOGY During the 30-day period from October 6, 2009 to November 5, 2009, Community Marketing, Inc. (CMI) conducted an online survey of self-identified gay and lesbian individuals selected from CMI’s proprietary survey panel regarding their travel habits and motivators, to provide data and insight to the tourism, travel and hospitality industries. Community Marketing has developed its survey panel over the last 15+ years by partnering with leading media companies from across the United States, as well as LGBT organizations and events. Subscribers to this survey panel received an email invitation to take a gay/lesbian travel survey, with an incentive to win one of six prizes. In order to keep the survey panel geographically balanced to the US Census same sex partner data, a second invitation was sent to targeted geographic areas to balance regions that were initially underrepresented. We make no attempt in this study to define the size of the LGBT population (which is virtually impossible for many reasons), nor are these findings intended to represent or profile the entire US gay and lesbian population (similarly challenging). Instead, these findings are designed to provide guidance to tourism companies looking to outreach to the LGBT community through their media and events. Some survey questions invite multiple responses, and in these cases, percentages total more than 100. Thanks to our media and event partners that contributed participants to this year’s Study: Alpenglow Productions Corp. Bay Area Reporter Curve Magazine EDGE Publications fab Magazine FlawLes / FlawLes Magazine Gay Ad Network Gay Cities, Inc. Guide Magazine Hotspots IGLTA Lesbian Connection LGBT Community Center of Greater Cleveland Out Front Colorado Pink Banana Media Pride FM 103.9 Pride Source Media Group Regent Media / Out.com Windy City Media Group Xtra & Xtra.ca
Community Marketing, Inc., 584 Castro St. #834, San Francisco CA 94114 USA • +1 415/437-3800 • www.CommunityMarketingInc.com
Page 3 of 3
SURVEY DEMOGRAPHICS The purpose of the survey is to give guidance to travel-related companies considering advertising in the gay and lesbian media (print and Internet), and connect through the communities events and organizations. The demographics of this survey are consistent with the reader profiles of the majority of LGBT media, trending significantly towards white and male (except for specific lesbian media), and middle aged. This report provides data from United States respondents only. The median age was 48. 75% were gay men, 25% lesbian, 3% bisexual, 1% transgender (multiple responses were permitted). 37% were single, 51% living with partner, 12% in relationship not living with partner. 6% had children under 18 living at home. 87% White, 5% Latino, 3% African American, 2% Asian, 3% other/mixed.
Community Marketing, Inc., 584 Castro St. #834, San Francisco CA 94114 USA • +1 415/437-3800 • www.CommunityMarketingInc.com
Page 4 of 4
Top Ten Findings from CMI’s 14th Annual Gay & Lesbian Tourism Survey
For the past 14 years, Community Marketing, Inc. (CMI) has been conducting its Annual Gay & Lesbian Tourism Study, the most comprehensive and longest-running such survey in the LGBT marketplace. Many of the questions are asked in consistent ways to a similar study panel, in order to identify LGBT travel trends and changes over time. The following “top ten” list presents findings that the CMI research team views as important changes or observations from the past year. For those new to CMI’s research, all the questions provide important insight into the travel motivations, preferences and interests of gay men and lesbians. 1) Gay Men and Lesbian Booking Patterns Gays and lesbians are primarily booking their travel directly via airline and hotel websites (56%) or through online travel agencies such as Travelocity or Orbitz (34%). Direct booking is significantly more important than web-based travel services, so for travel suppliers, developing relationships with the gay and lesbian community to encourage direct booking through your own website is extremely important. Travel suppliers and destinations having an LGBT “microsite” with dedicated content is a positive motivator for LGBT consumers. 2) For the First Time in 15 years of sampling – A Decrease in LGBT Travel For the first time since our first study in 1994, CMI has seen a decrease in LGBT travel due to the deep and wide-reaching recession. This survey, taken in October 2009, was far more pessimistic than CMI’s survey taken in October 2008, which largely showed a net-even in travel patterns. In the 2009 survey, nearly all travel categories saw some loss (except for regional travel). Business travel and cruise travel were the hardest-hit categories. That said, far more LGBT travelers took cruises in the past year than their mainstream counterparts (as in previous years), indicating that LGBT travelers are a viable cruise market even in down economies. 3) Recession-Influenced Travel Decreases Affecting Small and Medium-Sized Markets Worse than Big Markets Every major city in North America except for Washington DC (perhaps an Obama effect) saw a decrease in gay and lesbian travel over the past 12 months. That decrease affected cities very differently. Major markets, including New York City, San Francisco and Las Vegas saw only small leisure travel decreases, usually less than 5%, while medium sized cities, destinations that are geographically isolated, and some resort towns saw more significant decreases over 10%, and for some, over 20%.
Community Marketing, Inc., 584 Castro St. #834, San Francisco CA 94114 USA • +1 415/437-3800 • www.CommunityMarketingInc.com
Page 5 of 5
4) Staycations Staycations were the only travel category to see an increase in 2009. When asked to specify how many regional drive vacations (i.e. including at least one night in a hotel) were taken, 66% indicated taking a longer regional drive vacation of more than two hours; 42% took a regional drive vacation where the drive was two hours or less; 14% took a trip where they stayed in a hotel in their own city. This trend should benefit some metropolitan markets. Cities such as Boston, New York, Philadelphia and Washington DC, which are all close to each other, will probably “trade” stays among LGBT residents. Also of note is the 14% of gays and lesbians who reported taking a staycation at a hotel in their own town, defined as a very short drive or via public transportation. While this number may be smaller, with dedicated promotions this could be a way of filling hotel rooms during slower periods, especially if packaged with other local activities. 5) How to Reach the LGBT Community CMI has been tracking advertising trends for LGBT travel marketing for over a decade. In general, the survey shows substantive increases in the influence of traveler reviews on travel websites and blogs, a softening of the influence of banner ads on mainstream and LGBT websites, and a remarkable resilience of the influence of travel articles in LGBT and mainstream print publications. 6) Interest in Health and Fitness While Traveling is Down CMI has seen a trend over the past few years showing that health and fitness while traveling are becoming less important to the LGBT community. In this survey, when given a long list of potential motivators, health and fitness-related responses were near the bottom of the motivators, and often last on the lists. From hotel gyms to health and fitness vacations, they all scored poorly. This is not to say that health and fitness are not important in the day-to-day lives of gay men and lesbians, but bringing these healthy habits with them on leisure or business travel has shown less importance over time. It could also indicate that with tightening budgets, LGBT travelers prefer to spend more time enjoying the sights and experiences of the destination, rather than spend limited time in a gym. 7) Pride Events are Important Unaffected by recessionary influences, nearly a quarter of the respondents reported traveling to another city and spending at least one night in a hotel to attend a Pride event; same as previous years. Nationally, Pride events continue to move millions of hotel nights in the Unites States, and Pride remains an important motivator for LGBT travelers under 35.
Community Marketing, Inc., 584 Castro St. #834, San Francisco CA 94114 USA • +1 415/437-3800 • www.CommunityMarketingInc.com
Page 6 of 6
8) Strength of Local Neighborhoods Further confirming other recent research conducted by CMI, gays and lesbians tend to be especially interested in visiting city neighborhoods and experiencing local, non-chain restaurants. In fact, going to neighborhood restaurants and visiting the gay neighborhood were the top activities enjoyed by gays and lesbians when visiting a destination. 9) Top Travel Brands As an unaided question, survey participants were asked to fill in a blank for in the destination, hotel brand, and airline that they felt had done the best job in outreaching to the LGBT community. Of the total sample, 3,800 responded to the destination question. The top destinations indicated were: Las Vegas: 11%, San Francisco: 10%, Fort Lauderdale: 7%, Philadelphia: 6%, Provincetown: 5%, and London: 5%. Of the total sample, 2,800 responded to the hotel question. The top hotel brands indicated were: W Hotels: 11%, Kimpton Hotels: 11%, Hilton: 9%, Hyatt: 8%, and Marriott: 7%. Of the total sample, 3,287 responded to the airline question. The top airlines indicated were: American Airlines: 38%, Southwest: 15%, Delta: 11% and Virgin: 3%. 10) Top Destinations CMI’s list of top destinations remains amazingly consistent from year to year (based on the question of where did you travel in the past 12 months, and spend at least one night in a hotel). The following lists are reflective of the 4,726 American LGBT survey takers, who traveled to the city in the past 12 months and spent at least one night in a hotel: Top 25 US Destinations for American LGBT Travelers, with percentage who visited and spent a night in a hotel (as Combined Leisure & Business Travel Ranking) 1) New York City: 32% 2) San Francisco: 27% 3) Las Vegas: 26% 4) Chicago: 25% 5) Los Angeles / West Hollywood: 24% 6) Washington, DC: 23% 7) Fort Lauderdale: 17% 8) San Diego: 15% 9) Orlando: 14% 9) Seattle: 14% 11) Boston: 13%
Community Marketing, Inc., 584 Castro St. #834, San Francisco CA 94114 USA • +1 415/437-3800 • www.CommunityMarketingInc.com
Page 7 of 7
11) Philadelphia: 13% 13) Palm Springs 12% 13) Atlanta: 12% 13) Miami: 12% 16) Dallas: 11% 16) Denver: 11% 16) Phoenix/Tempe/Scottsdale: 11% 19) New Orleans: 10% 20) Napa County, CA: 9% 20) Provincetown, MA: 9% 20) Sonoma County, CA: 9% 23) Portland, OR 8% 23) Baltimore: 8% 23) Tampa/St. Pete: 8% Top 5 US Destinations for American LGBT Travelers (as Leisure Travel Ranking) 1) New York 2) Las Vegas 3) San Francisco 4) Los Angeles / West Hollywood 5) Chicago Top 5 US Destinations for American LGBT Travelers (as Business Travel Ranking) 1) Chicago 2) New York 3) Washington DC 4) San Francisco 5) Los Angeles Top Canadian Destinations for American LGBT Travelers 1) Toronto 2) Montreal 3) Vancouver Top European Destinations for American LGBT Travelers 1) England 2) France 3) Germany 4) Italy 5) Spain
Community Marketing, Inc., 584 Castro St. #834, San Francisco CA 94114 USA • +1 415/437-3800 • www.CommunityMarketingInc.com
Page 8 of 8
Below are the top destinations for segments within the full LGBT panel: Top 5 Destinations for American Gay Men 1) New York 2) Las Vegas 3) San Francisco 4) Los Angeles / West Hollywood 5) Chicago Top 5 Destinations for American Lesbians 1) Las Vegas 2) San Francisco 3) New York 4) Los Angeles / West Hollywood 5) Chicago Top 5 Destinations for American LGBT Seniors Age 62+ 1) New York 2) Las Vegas 3) Los Angeles / West Hollywood 4) Fort Lauderdale 5) San Francisco Top 5 Destinations for American LGBT Young Adults Age 18-32 1) New York 2) Las Vegas 3) San Francisco 4) Chicago 5) Washington DC
Community Marketing, Inc., 584 Castro St. #834, San Francisco CA 94114 USA • +1 415/437-3800 • www.CommunityMarketingInc.com
Page 9 of 9
Survey Findings
How Most Recent Vacation Was Purchased
How did you purchase your most recent vacation (not business travel)? (Respondents could only choose a single response)
Response Chart Frequency Count
Directly with airlines and hotels (phone or website)
55.5% 2537
Travel website like Travelocity, Orbitz etc. 33.5% 1532
Retail travel agency 6.5% 299
Tour operator group 4.4% 200
Not Answered 158
Valid Responses 4568
Total Responses 4726
Over half of participants (56%) said they had purchased their most recent vacation directly with airlines and hotels, whether by phone or a website. Another one-third (34%) reported purchasing the vacation through an online travel agency website like Travelocity or Orbitz.
Community Marketing, Inc., 584 Castro St. #834, San Francisco CA 94114 USA • +1 415/437-3800 • www.CommunityMarketingInc.com
Page 10 of 10
Travel Compared to Previous Year
Comparing your travel over the past 12 months, have you traveled more, about the same or less than the previous year? (Change in Travel)
Travel decreased About the same Travel increased
Overall travel 34.6% 39.3% 26.1%
Leisure travel 32.8% 42.3% 24.9%
Business travel 43.8% 37.5% 18.7%
Number of flights taken 35.2% 39.0% 25.8%
Number of nights in hotels 32.5% 37.6% 29.9%
Number of cruises 45.2% 39.3% 15.5%
Number of local/regional staycations or drive vacations 19.5% 48.1% 32.5%
Total 33.6% 40.6% 25.8%
The largest percentages of respondents reported that compared to the previous year, their overall travel in the past year had remained the same (39%), as had their leisure travel (42%). Of the 66% of those who reported any business travel, the greatest percentage (44%) said their business travel had decreased. Of the 40% of respondents who reported taking cruises, the greatest percentage (45%) said the number of cruises they had taken had decreased compared to the previous year. Looking at the bigger picture, more survey respondents reported a decrease in travel than an increase. This contrasts to the report of October 2008 that showed an equal number of respondents increasing travel as decreasing travel for a net neutral effect, and previous years when we saw travel increasing year over year.
Community Marketing, Inc., 584 Castro St. #834, San Francisco CA 94114 USA • +1 415/437-3800 • www.CommunityMarketingInc.com
Page 11 of 11
Number of Roundtrip Flights, and Flights in Business- or First-Class
About all your trips, business and leisure:
0 1 2 3 4 5 6 7 8 9 10+ Mean
How many total roundtrip air flights did you take in the past 12 months?
The majority (79%) of respondents reported at least one roundtrip air flight for business or leisure in the past year. 24% indicated that they took at least one business class flight in the past year.
Community Marketing, Inc., 584 Castro St. #834, San Francisco CA 94114 USA • +1 415/437-3800 • www.CommunityMarketingInc.com
Page 12 of 12
Used a Smart Phone to Research or Book Travel When researching or booking travel, in the last 12 months have you used a smart phone or other hand-held mobile device? Check all that apply. (Respondents were allowed to choose multiple responses)
Response Chart Frequency Count
I DON'T HAVE SUCH A DEVICE 47.5% 2245
For staying in touch while I'm away (email, texting, Facebook, etc.)
37.3% 1761
For maps 30.5% 1443
For flight alerts (change of time, gate, etc.) 25.2% 1193
For finding local mainstream resources (restaurants, attractions, etc.) at the destination
25.2% 1192
For finding LGBT resources (gay bars, restaurants, clubs, etc.) at the destination
21.7% 1025
For researching a destination prior to departure
13.5% 639
For booking hotels 6.6% 313
For booking flights 5.3% 249
Other, please specify: 2.1% 100
Valid Responses 4726
Total Responses 4726
Asked about researching or booking travel with a smart phone, 48% of participants said they didn’t have a smart phone. Over one-third (37%) said they used their phones to stay in touch while away, whether through e-mail, texting or Facebook. Some also reported using their phones for maps (31%), flight alerts (25%) or finding local mainstream resources at the destination (25%).
Community Marketing, Inc., 584 Castro St. #834, San Francisco CA 94114 USA • +1 415/437-3800 • www.CommunityMarketingInc.com
Page 13 of 13
Overnight Trips
Overnight Trips With a Hotel Stay
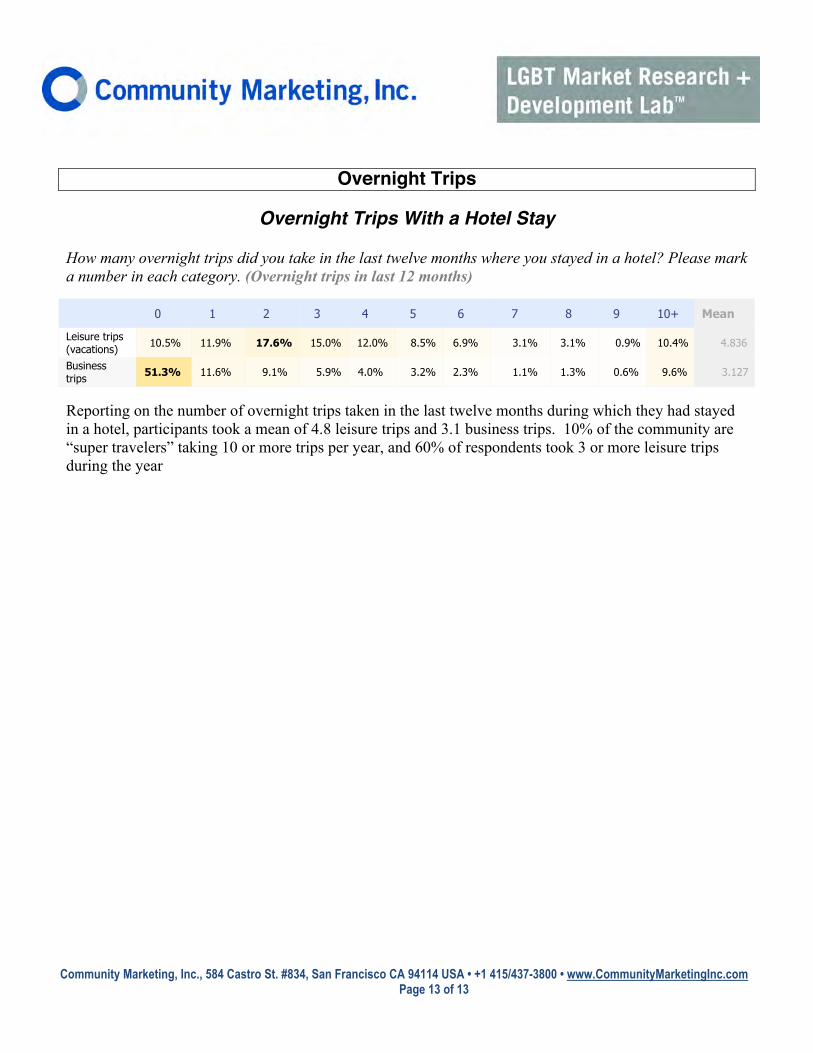
How many overnight trips did you take in the last twelve months where you stayed in a hotel? Please mark a number in each category. (Overnight trips in last 12 months)
Reporting on the number of overnight trips taken in the last twelve months during which they had stayed in a hotel, participants took a mean of 4.8 leisure trips and 3.1 business trips. 10% of the community are “super travelers” taking 10 or more trips per year, and 60% of respondents took 3 or more leisure trips during the year
Community Marketing, Inc., 584 Castro St. #834, San Francisco CA 94114 USA • +1 415/437-3800 • www.CommunityMarketingInc.com
Page 14 of 14
Types of Overnight Leisure Trips The following question is just for your leisure trips indicated above (not business trips) where you spent at least one night in a hotel. The total number of trips below should equal the total number of leisure trips above. Let’s explore the concept of local/regional staycations vs. vacations further away from home. How many of these leisure trips were... (Overnight leisure trips in last 12 months that involved:)
Participants were more likely to report having taken overnight leisure trips where trips involved longer flights (69%) or drive vacations of more than two hours (67%) than when the trip was a drive vacation of less than two hours in one’s own region (44%) or a trip involving a short flight (41%). Nearly 15% reported taking a leisure trip with an overnight stay in their own city.
Community Marketing, Inc., 584 Castro St. #834, San Francisco CA 94114 USA • +1 415/437-3800 • www.CommunityMarketingInc.com
Page 15 of 15
Number of Nights in Hotels, and in Luxury Hotels
Again, considering both business and leisure travel:
0 1-5 6-10 11-15 16-20 21-30 31-40 41-50 50+
How many nights did you spend in a hotel in the past 12 months?
9.0% 24.5% 20.8% 15.1% 10.9% 9.0% 4.4% 2.0% 4.3%
How many of these nights were in a “luxury class” hotel?
48.4% 27.4% 11.1% 5.5% 3.2% 2.2% 1.1% 0.4% 0.8%
Total 28.1% 25.9% 16.1% 10.4% 7.2% 5.7% 2.8% 1.2% 2.6%
Of the 81% of participants who said they had stayed a night or more in a hotel in the past 12 months, almost half (46%) reported spending more than 10 nights in a hotel.
Community Marketing, Inc., 584 Castro St. #834, San Francisco CA 94114 USA • +1 415/437-3800 • www.CommunityMarketingInc.com
Page 16 of 16
Travel Expressing LGBT Preferences
Business Travel Decisions Influenced by LGBT Preferences If you travel for business, are your business travel decisions influenced by your LGBT preferences as an individual? For example, do you purchase gay-friendly hotels or airlines when making business travel plans? (Respondents could only choose a single response)
Response Chart Frequency Count
Sometimes, whenever possible 41.6% 1739
No 31.0% 1297
Yes 17.2% 719
Rarely 10.3% 429
Not Answered 542
Valid Responses 4184
Total Responses 4726
More than half of respondents (59%) indicated that their business travel decisions were (17%) or sometimes were (42%) influenced by their preferences and loyalties as an LGBT consumer.
Community Marketing, Inc., 584 Castro St. #834, San Francisco CA 94114 USA • +1 415/437-3800 • www.CommunityMarketingInc.com
Page 17 of 17
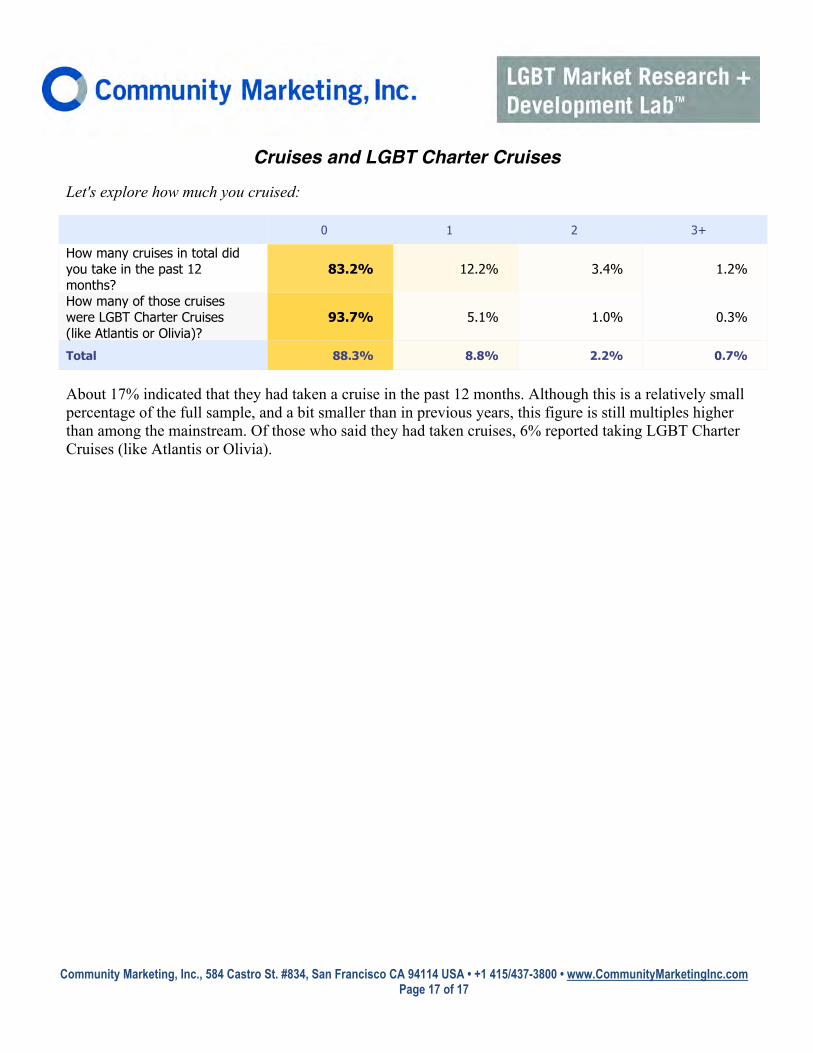
Cruises and LGBT Charter Cruises Let's explore how much you cruised:
0 1 2 3+
How many cruises in total did you take in the past 12 months?
83.2% 12.2% 3.4% 1.2%
How many of those cruises were LGBT Charter Cruises (like Atlantis or Olivia)?
93.7% 5.1% 1.0% 0.3%
Total 88.3% 8.8% 2.2% 0.7%
About 17% indicated that they had taken a cruise in the past 12 months. Although this is a relatively small percentage of the full sample, and a bit smaller than in previous years, this figure is still multiples higher than among the mainstream. Of those who said they had taken cruises, 6% reported taking LGBT Charter Cruises (like Atlantis or Olivia).
Community Marketing, Inc., 584 Castro St. #834, San Francisco CA 94114 USA • +1 415/437-3800 • www.CommunityMarketingInc.com
Page 18 of 18
Tours and LGBT Tours About your group travel:
0 1 2 3+
How many group tours in total did you take in the past 12 months (small group of people in one packaged tour)?
86.3% 9.6% 2.6% 1.5%
How many of those tours were LGBT oriented (mostly LGBT people traveling together)?
92.4% 5.5% 1.3% 0.8%
Nearly 14% of respondents said they had taken group tours in the past 12 months. Roughly half of those were in LGBT groups.
Community Marketing, Inc., 584 Castro St. #834, San Francisco CA 94114 USA • +1 415/437-3800 • www.CommunityMarketingInc.com
Page 19 of 19
Used Services of a Local Retail Travel Agent Have you used the services of a local, retail travel agent in the past 12 months? (Respondents could only choose a single response) Response Chart Frequency Count
No 85.9% 4061
Yes 14.1% 665
Valid Responses 4726
Total Responses 4726
About 14% of respondents said they had used the services of a local retail travel agent in the past 12 months. This figure continues to decline since it’s peak in the early 90’s, but many retail agents have answered this trend with specific offerings that their LGBT clients can’t get via Internet channels (e.g. small groups on crises, dedication to specific destinations or activities, etc.). See following question.
Community Marketing, Inc., 584 Castro St. #834, San Francisco CA 94114 USA • +1 415/437-3800 • www.CommunityMarketingInc.com
Page 20 of 20
Type of Travel That Travel Agent Was Used For For which types of travel did you use the local, retail travel agent (mark all that apply)? (Respondents were allowed to choose multiple responses) Response Chart Frequency Count
Unfamiliar destinations 30.8% 209
Complicated itineraries 29.0% 197
Other, specify: 21.9% 149
Mainstream cruise 21.1% 143
LGBT group cruise 13.0% 88
Mainstream group tour 8.4% 57
LGBT group tour 8.2% 56
Valid Responses 679
Total Responses 679
Those who said they had used a local travel agent were especially likely to report asking the travel agent for assistance with unfamiliar destinations (31%) or complicated itineraries (29%). Some also indicated requesting help arranging mainstream cruises (21%) or LGBT group cruises (13%). About 8% each of respondents said they had turned to a travel agent to find out about a mainstream group tour or LGBT group tour.
Community Marketing, Inc., 584 Castro St. #834, San Francisco CA 94114 USA • +1 415/437-3800 • www.CommunityMarketingInc.com
Page 21 of 21
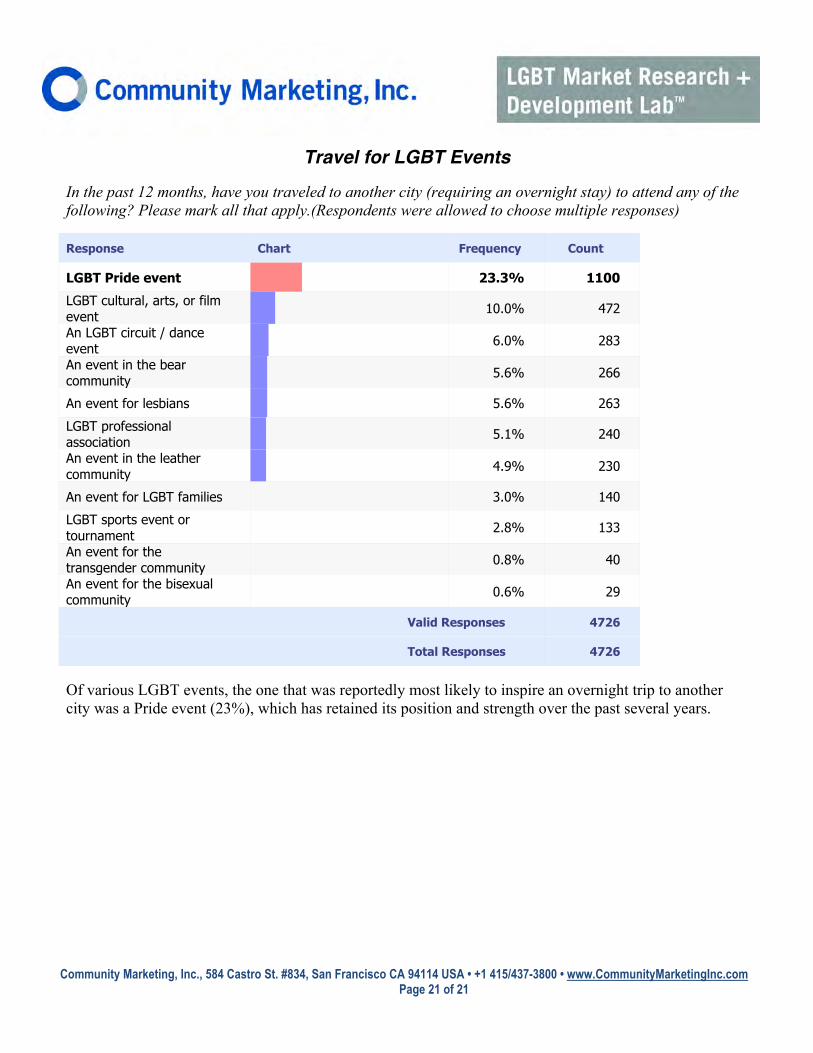
Travel for LGBT Events In the past 12 months, have you traveled to another city (requiring an overnight stay) to attend any of the following? Please mark all that apply.(Respondents were allowed to choose multiple responses)
Response Chart Frequency Count
LGBT Pride event 23.3% 1100
LGBT cultural, arts, or film event 10.0% 472
An LGBT circuit / dance event 6.0% 283
An event in the bear community 5.6% 266
An event for lesbians 5.6% 263
LGBT professional association 5.1% 240
An event in the leather community 4.9% 230
An event for LGBT families 3.0% 140
LGBT sports event or tournament 2.8% 133
An event for the transgender community 0.8% 40
An event for the bisexual community 0.6% 29
Valid Responses 4726
Total Responses 4726
Of various LGBT events, the one that was reportedly most likely to inspire an overnight trip to another city was a Pride event (23%), which has retained its position and strength over the past several years.
Community Marketing, Inc., 584 Castro St. #834, San Francisco CA 94114 USA • +1 415/437-3800 • www.CommunityMarketingInc.com
Page 22 of 22
General Motivations For Travel
Motivations for Taking a Vacation
What are your motivations when deciding where to take a vacation? Please select your top five. (Respondents were allowed to choose multiple responses) Response Chart Frequency Count
Rest and relaxation 68.8% 3251
Explore new destinations 62.9% 2974
Need a break from routine 51.5% 2433
Return to favorite destinations 50.1% 2370 Art, architecture, culture, music, etc. 41.8% 1976
Romance with partner 36.7% 1735 The destination's gay/lesbian bars, clubs, parties, etc.
25.6% 1211
Food & Wine 21.0% 991
Sexual adventure 14.1% 666
Check destination off my list 13.5% 640
Shopping 13.0% 616
Other, please specify: 12.1% 574 Make new friends with people living in the destination
9.5% 449
Make new friends with other travelers and tourists 8.6% 407
Health and fitness (i.e. active vacation) 8.1% 383
Valid Responses 4726
Total Responses 4726
In deciding where to vacation, participants said they were especially motivated by rest and relaxation (69%), to explore new locations (63%), to take a break from daily routines (52%) or to return to favorite destinations (50%). 42%.wanted to explore cultural attractions such as art, architecture, culture, or music. Others chose locations based on wanting a romantic trip with a partner (37%), or interest in a destination’s gay/lesbian bars, clubs, and parties (26%) or food and wine (21%).
Community Marketing, Inc., 584 Castro St. #834, San Francisco CA 94114 USA • +1 415/437-3800 • www.CommunityMarketingInc.com
Page 23 of 23
Resources That Influence Selecting a Destination Motivators for Destination Selection: We want to understand which resources motivate you to visit a city or country. When choosing a destination to visit, what are the top motivators that make you choose one destination over another? Choose your top five. (Respondents were allowed to choose multiple responses)
Response Chart Frequency Count
Word of mouth from friends 72.1% 3407
Articles in LGBT publications 47.5% 2245
Articles in mainstream publications 35.7% 1688
Traveler reviews on travel websites and blogs 34.8% 1644
Articles on LGBT websites 31.9% 1508
Display ads in LGBT publications 26.4% 1250
Articles on mainstream websites 23.9% 1131
Tourism bureau having an LGBT-specific website 21.1% 999
Banner ads on LGBT websites 15.4% 728
Display ads in mainstream publications 13.2% 623
Email newsletter broadcasts for LGBT community 12.8% 605
Banner ads on mainstream websites 6.7% 318
Valid Responses 4726
Total Responses 4726
Respondents reported being especially likely to choose a travel destination based on word of mouth from friends (72%). Many said they would be influenced by articles in LGBT publications (48%) or mainstream publications (36%), or by travel reviews on travel websites or blogs (35%) or articles on LGBT websites (32%). About one-quarter (26%) of respondents thought they would be motivated by display ads in LGBT publications.
Community Marketing, Inc., 584 Castro St. #834, San Francisco CA 94114 USA • +1 415/437-3800 • www.CommunityMarketingInc.com
Page 24 of 24
Motivations for Choosing a Hotel When making a hotel reservation for leisure travel, what are the top motivators influencing you choose one hotel over another?
Hotel’s affiliation or rating with organizations like IGLTA, TAG or HRC
26.2% 18.0% 31.2% 15.9% 8.7% 2.630
Availability of hotel gym 40.9% 20.5% 21.7% 10.9% 6.0% 2.205
Total 14.9% 11.8% 27.5% 25.1% 20.8% N/A
In considering which hotel they would select when making a hotel reservation for leisure travel, over half (52%) of respondents said they would consider the price of the hotel very motivating. About one-third of participants also thought they would be relatively highly motivated by the hotel’s location near tourist attractions (36%) or a review on the Internet (35%).
Community Marketing, Inc., 584 Castro St. #834, San Francisco CA 94114 USA • +1 415/437-3800 • www.CommunityMarketingInc.com
Page 25 of 25
Favorite American And Canadian City Travel Destinations
Primary Activities in Visiting Any City
When traveling to a city, how likely are you to participate in the following activities?
Not likely Somewhat likely Very likely Mean
Go to the gay neighborhood 6.7% 35.0% 58.4% 2.517
Go to a neighborhood restaurant 1.4% 27.2% 71.4% 2.700
Visit the popular mainstream tourist attractions 6.6% 44.5% 48.8% 2.422
Go to a museum 10.1% 43.8% 46.1% 2.360
Go to a gay bar or nightclub 14.1% 37.3% 48.6% 2.345
Go shopping in city's retail district 11.6% 44.5% 44.0% 2.324
Go on a day trip outside the city 17.5% 52.2% 30.4% 2.129
Go to a concert or play 20.0% 49.9% 30.1% 2.101
Go to a medium to upper scale chain restaurant. 22.4% 46.6% 30.9% 2.085
Go to an expensive / high end restaurant 30.2% 40.2% 29.6% 1.994
Take a city tour 29.6% 46.9% 23.5% 1.938
Go to a gym while on vacation 60.0% 27.1% 12.9% 1.528
Rent a bike/canoe/kayak 60.4% 30.5% 9.0% 1.486
Go to a straight bar or nightclub 62.4% 30.0% 7.6% 1.452
Total 25.2% 39.7% 35.1% N/A
When they thought about activities they were likely to participate in while visiting a city, the majority of respondents strongly agreed that they were very likely to go to a neighborhood restaurant (71%) or to the city’s gay neighborhood (58%). Almost half also strongly agreed that they would visit popular mainstream tourist attractions (49%), go to a museum (46%), or go to a gay bar or nightclub (49%). Between 40% and about 50% also said they would be somewhat likely to go on a day trip outside a city (52%), go to a concert or play (50%), take a city tour (47%), go shopping in the city’s retail district (45%), or eat at a medium- to upper-scale chain restaurant (47%) or high-end restaurant (40%).
Community Marketing, Inc., 584 Castro St. #834, San Francisco CA 94114 USA • +1 415/437-3800 • www.CommunityMarketingInc.com
Page 26 of 26
Passport Used In the Past 12 Months
Did you use your passport in the past 12 months? Mark all that apply. (Respondents were allowed to choose multiple responses)
Response Chart Frequency Count
Yes, for travel to Canada, Mexico or the Caribbean
34.3% 1620
I have a passport, but I did not use it in the past 12 months
32.1% 1517
Yes, for travel to other international destinations 28.4% 1343
I DO NOT HAVE A PASSPORT 17.0% 802
Valid Responses 4726
Total Responses 4726
83% of LGBT consumers surveyed in this study hold a valid passport, far higher than the US average (according to an article in The Economist) of 34% of Americans age 18 and older. 63% indicated that they used their passport in the past 12 months for some type of international travel. As for travel outside the U.S., a somewhat greater percentage (34%) of participants said they had used their passports for travel to Canada, Mexico or the Caribbean in the past 12 months than for travel to other international destinations (28%).
Community Marketing, Inc., 584 Castro St. #834, San Francisco CA 94114 USA • +1 415/437-3800 • www.CommunityMarketingInc.com
Page 27 of 27
Places, Hotels and Airlines With Best Promotions to the LGBT Community
Question #1: Over the past year, which city, resort town, state or country has done the best job promoting themselves to the LGBT community? Base your answer on the destination’s LGBT advertising, outreach and communications. Please write only one destination. (Destination:) (Respondents were limited to brief text responses). Of the total sample, 3,800 responded to this question. The top destinations indicated were: Las Vegas: 11% San Francisco: 10% Fort Lauderdale: 7% Philadelphia: 6% Provincetown: 5% London: 5% Question#2: Over the past year which hotel brand has done the best job promoting themselves to the LGBT community? Base your answer on the hotel’s LGBT advertising, outreach and communications. Please write only one hotel brand name. (Hotel Brand:) (Respondents were limited to brief text responses) Of the total sample, 2,800 responded to this question. The top hotel brands indicated were: W Hotels: 11% Kimpton Hotels: 11% Hilton: 9% Hyatt: 8% Marriott: 7% Question #3: Over the past year which airline has done the best job promoting themselves to the LGBT community? Base your answer on the airline’s LGBT advertising, outreach and communications. Please write only one airline. (Airline:) (Respondents were limited to brief text responses) Of the total sample, 3,287 responded to this question. The top airlines indicated were: American Airlines: 38% Southwest: 15% Delta: 11% Virgin: 3%
Community Marketing, Inc., 584 Castro St. #834, San Francisco CA 94114 USA • +1 415/437-3800 • www.CommunityMarketingInc.com
Page 28 of 28
U.S. and World Travel: Vacation, Business, and Future Travel
U.S. West of the Mississippi This is the final question, but it takes a little time to complete if you travel a lot. We are going to present you with a list of cities and countries around the world. Please tell us if you have visited these places in the past 12 months for leisure or business travel reasons. By "visit," we mean you traveled to the destination and spent at least one paid night in a hotel/ guest house/condo rental (i.e. you paid for your overnight accommodations–not stayed with friends). If you live in the destination, please DO NOT CHECK the destination. Also tell us if you plan to visit any of these destinations over the next 12 months.
Vacation travel, past 12 months
Business travel, past 12 months
Plan to visit next 12 months for any reason
Las Vegas, NV 20.5% 6.0% 22.0%
San Francisco, CA 19.7% 8.0% 25.0%
Los Angeles/West Hollywood, CA 16.9% 7.0% 18.0%
Palm Springs, CA 10.9% 1.0% 15.0%
San Diego, CA 10.1% 5.0% 13.0%
Seattle, WA 9.0% 5.0% 13.0%
Napa County, CA 8.0% 1.0% 9.0%
Sonoma County, CA / Russian River 7.9% 1.0% 9.0%
New Orleans, LA 7.1% 3.0% 14.0%
Hawaii 6.7% 1.0% 15.0%
Phoenix/Tempe/Scottsdale, AZ 6.4% 4.0% 9.0%
Denver, CO 6.1% 5.0% 8.0%
Dallas, TX 5.9% 5.0% 7.0%
Portland, OR 5.7% 3.0% 10.0%
Austin, TX 5.0% 3.0% 7.0%
Finally, participants were also asked about places inside and outside the United States that they had visited for a vacation or business in the past year, as well as about which places they hoped to visit in the year ahead. Of destinations west of the Mississippi River, Las Vegas, San Francisco, and L.A. were the three destinations that the greatest percentage of respondents reported having visited in the past year for vacation (respectively 21%, 20%, and 17%) or for business (respectively 6%, 8%, and 7%), as well as being the locations respondents most hoped to visit in the next year (respectively 22%, 25%, and 18%).
Community Marketing, Inc., 584 Castro St. #834, San Francisco CA 94114 USA • +1 415/437-3800 • www.CommunityMarketingInc.com
Page 29 of 29
Of the top 10 Western U.S. locations reported as past-year vacation sites by the greatest percentage of respondents, California locations comprised 6 of these sites, including San Diego, Palm Springs, and wine-district Napa County and Sonoma County/Russian River. Other top-10 past-year vacation locations outside California included Seattle (9%), New Orleans and Hawaii (7% each).
Community Marketing, Inc., 584 Castro St. #834, San Francisco CA 94114 USA • +1 415/437-3800 • www.CommunityMarketingInc.com
Page 30 of 30
U.S. East of the Mississippi
Vacation travel, past 12 months
Business travel, past 12 months
Plan to visit next 12 months for any reason
New York City, N.Y. 23.0% 9.0% 27.0%
Chicago, IL 15.8% 9.0% 19.0%
Washington, DC 14.7% 9.0% 18.0%
Ft. Lauderdale/Wilton Manors, FL 14.4% 3.0% 14.0%
Orlando, FL 10.0% 4.0% 11.0%
Miami/ South Beach, FL 9.1% 3.0% 12.0%
Boston, MA 8.6% 5.0% 12.0%
Provincetown, MA 8.3% 0.0% 14.0%
Philadelphia, PA 8.3% 4.0% 10.0%
Atlanta, GA 6.8% 5.0% 9.0%
Key West, FL 6.5% 0.0% 12.0%
Tampa/St. Petersburg, FL 6.0% 2.0% 7.0%
Baltimore, MD 5.4% 3.0% 5.0%
Rehoboth Beach, DE 4.5% 0.0% 6.0%
Atlantic City, NJ 4.4% 1.0% 5.0%
Maine / Portland ME 4.3% 1.0% 5.0%
Minneapolis/St. Paul, MN 4.1% 3.0% 5.0%
Cleveland, OH 3.5% 2.0% 4.0%
Detroit, MI 3.0% 2.0% 3.0%
Raleigh/Durham/Chapel Hill, NC 3.0% 2.0% 3.0%
Providence RI 2.9% 1.0% 4.0%
Fire Island, N.Y. 2.8% 0.0% 5.0%
As for cities east of the Mississippi, participants were most likely to report past-year vacation travel to New York (23%), Chicago (16%) or Washington, D.C. (15%), as well as past-year business travel to these locations (each 9%); they were also especially likely to want to visit these locations in the next year (respectively, 27%, 19% and 18%).
Community Marketing, Inc., 584 Castro St. #834, San Francisco CA 94114 USA • +1 415/437-3800 • www.CommunityMarketingInc.com
Page 31 of 31
Of the top 6 vacation locations east of the Mississippi that the greatest percentage of participants reported visiting, 3 were in Florida, with past-year vacation travel reported to Fort Lauderdale/Wilton Manors (14%), Orlando (10%) or Miami/South Beach (9%), and next year travel to these locations also respectively anticipated by 14%, 11% and 12% of participants; another 12% of respondents hoped to visit Key West as well. The #7 and #8 vacation locations reported in the past year—Boston (9%) and Provincetown, MA. (8%)—were also locations that 12% and 14% of respondents respectively hoped to visit in the next year. As for cities that respondents reported visiting relatively often for business, these included not only N.Y., Chicago and Washington D.C. but also Boston and Atlanta (each 5%).
Community Marketing, Inc., 584 Castro St. #834, San Francisco CA 94114 USA • +1 415/437-3800 • www.CommunityMarketingInc.com
Page 32 of 32
Canada
Vacation travel, past 12 months
Business travel, past 12 months
Plan to visit next 12 months for any reason
Toronto 6.4% 2.3% 12.9%
Montreal 6.1% 1.4% 12.0%
Vancouver 5.4% 1.3% 10.4%
Victoria/Vancouver Island 2.6% 4.2%
Quebec City 1.3% 2.8%
Whistler 1.2% 2.3%
Halifax 0.9% 1.4%
Ottawa 0.7% 1.4%
Banff 0.7% 1.3%
Calgary 0.7% 1.2%
Winnipeg 0.3% 0.7%
Whitehorse/Dawson City, Yukon 0.3% 0.4%
Of Canadian cities, Toronto, Montreal and Vancouver were the cities reportedly visited by the greatest percentage of participants for past-year vacation travel (respectively 6%, 6% and 5%) or business (respectively 2%, 1% and 1%), as well as being the Canadian cities participants most hoped to visit in the next year (respectively 13%, 12% and 10%).
Community Marketing, Inc., 584 Castro St. #834, San Francisco CA 94114 USA • +1 415/437-3800 • www.CommunityMarketingInc.com
Page 33 of 33
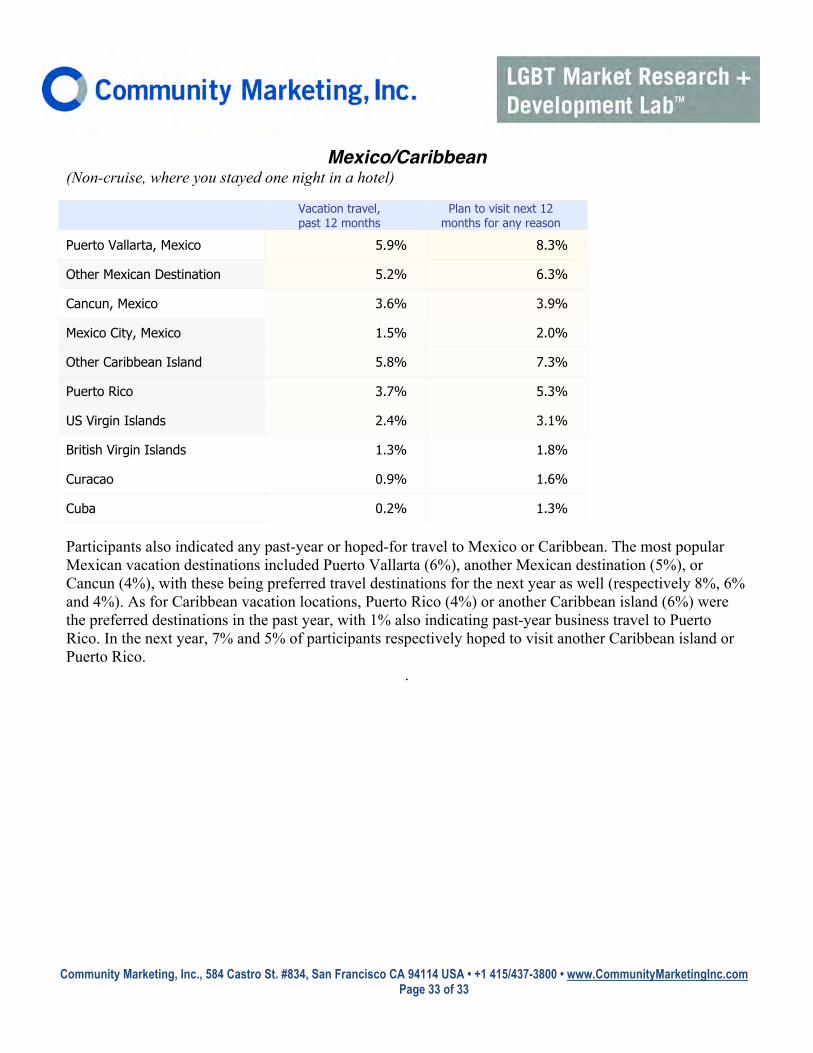
Mexico/Caribbean (Non-cruise, where you stayed one night in a hotel)
Vacation travel, past 12 months
Plan to visit next 12 months for any reason
Puerto Vallarta, Mexico 5.9% 8.3%
Other Mexican Destination 5.2% 6.3%
Cancun, Mexico 3.6% 3.9%
Mexico City, Mexico 1.5% 2.0%
Other Caribbean Island 5.8% 7.3%
Puerto Rico 3.7% 5.3%
US Virgin Islands 2.4% 3.1%
British Virgin Islands 1.3% 1.8%
Curacao 0.9% 1.6%
Cuba 0.2% 1.3%
Participants also indicated any past-year or hoped-for travel to Mexico or Caribbean. The most popular Mexican vacation destinations included Puerto Vallarta (6%), another Mexican destination (5%), or Cancun (4%), with these being preferred travel destinations for the next year as well (respectively 8%, 6% and 4%). As for Caribbean vacation locations, Puerto Rico (4%) or another Caribbean island (6%) were the preferred destinations in the past year, with 1% also indicating past-year business travel to Puerto Rico. In the next year, 7% and 5% of participants respectively hoped to visit another Caribbean island or Puerto Rico.
.
Community Marketing, Inc., 584 Castro St. #834, San Francisco CA 94114 USA • +1 415/437-3800 • www.CommunityMarketingInc.com
Page 34 of 34
Central and South America
Vacation travel, past 12 months
Plan to visit next 12 months for any reason
Costa Rica 2.0% 4.0%
Argentina 2.0% 3.4%
Other Central American Country 1.4% 2.5%
Brazil 1.1% 3.8%
Other South American Country 1.0% 1.8%
Peru 0.9% 1.7%
Chile 0.8% 1.6%
Ecuador 0.4% 1.1%
Venezuela 0.2% 0.7%
Compared to reports of travel to Mexico or the Caribbean, fewer participants said they had visited Central or South America for vacation in the past year, with 2% reporting vacations to Costa Rica or Argentina, and 1% vacations to Brazil, Peru, Chile, or another Central American or South American country. Not even 1% of participants reported business travel to Central American or South America in the past year. Between 3% and 4% of participants envisioned travelling to Costa Rica (4%), Brazil (4%), Argentina (3%) or another Central American country (3%) in the next year.
Community Marketing, Inc., 584 Castro St. #834, San Francisco CA 94114 USA • +1 415/437-3800 • www.CommunityMarketingInc.com
Page 35 of 35
Europe – Top 15 Reported Vacation travel,
past 12 months Business travel, past 12 months
Plan to visit next 12 months for any reason
England 7.3% 3.0% 12.0%
France 6.2% 2.0% 9.0%
Germany 4.8% 2.0% 7.0%
Italy 4.6% 1.0% 9.0%
Spain 3.9% 1.0% 7.0%
Netherlands (Holland) 3.2% 1.0% 5.0%
Greece 1.9% 4.0%
Ireland 1.8% 1.0% 4.0%
Denmark 1.8% 2.0%
Czech Republic 1.5% 3.0%
Austria 1.5% 2.0%
Switzerland 1.4% 1.0% 2.0%
Belgium 1.4% 2.0%
Sweden 1.4% 2.0%
The European countries that participants were most likely to report having visited in the past year included England (7%), France (6%). Germany (5%), Italy (5%), and Spain (4%), with these countries also being those that the greatest percentage of participants—7% to 12%—reported wanting to visit in the next 12 months. Additionally 3% of respondents reported business travel to England and 2% each business travel to France or Germany in the past year.
.
Community Marketing, Inc., 584 Castro St. #834, San Francisco CA 94114 USA • +1 415/437-3800 • www.CommunityMarketingInc.com
Page 36 of 36
Africa
Vacation travel, past 12 months
Business travel, past 12 months
Plan to visit next 12 months for any reason
Egypt 1.1% 0.1% 1.5%
South Africa 0.7% 0.4% 2.2%
Morocco 0.6% 0.1% 1.2%
Other African Country 0.5% 0.3% 1.2%
Kenya 0.2% 0.1% 0.7%
Only a small percentage of respondents reported visiting Africa for a vacation in the past year; 1% each of participants reporting having visited Egypt or South Africa in the past year; and 2% hoped to visit either of these two countries in the next year.
.
Community Marketing, Inc., 584 Castro St. #834, San Francisco CA 94114 USA • +1 415/437-3800 • www.CommunityMarketingInc.com
Page 37 of 37
Middle East and Asia
Vacation travel, past 12 months
Business travel, past 12 months
Plan to visit next 12 months for any reason
Thailand 1.9% 0.3% 2.9%
China (Hong Kong) 1.3% 0.9% 2.5%
Japan 1.1% 0.7% 2.0%
Other Asian Country 1.0% 0.4% 1.8%
Singapore 0.9% 0.4% 1.6%
China (Mainland) 0.8% 0.6% 1.9%
Vietnam 0.7% 0.1% 1.2%
Israel 0.6% 0.3% 1.9%
India 0.4% 0.4% 1.6%
Indonesia 0.4% 0.1% 1.0%
Malaysia 0.4% 0.2% 0.7%
Dubai 0.3% 0.4% 0.9%
Nepal 0.1% 0.0% 0.4%
With regard to Asian countries, participants were most likely to say that in the past year they had taken vacations to such Southeast Asian or Far Eastern countries as Thailand (2%), Hong Kong (1%), Japan (1%), Singapore (1%), Mainland China (1%) or Vietnam (1%). They were somewhat less likely to report having visited Middle Eastern countries such as Israel or Dubai, or Central Asian countries such as India or Nepal. About 1% each of participants also said they had taken past-year business trips to Hong Kong, Japan or Mainland China. As for travel in the next 12 months, participants thought they would be most likely to go to Thailand or Hong Kong (each 3%), or Japan, Mainland China, Israel, or India (each 2%).
Community Marketing, Inc., 584 Castro St. #834, San Francisco CA 94114 USA • +1 415/437-3800 • www.CommunityMarketingInc.com
Page 38 of 38
South Pacific
Vacation travel, past 12 months
Business travel, past 12 months
Plan to visit next 12 months for any reason
Australia 1.7% 0.6% 5.8%
New Zealand 0.7% 0.2% 3.7%
Tahiti 0.6% 0.1% 1.4%
Other South Pacific Country 0.4% 0.2% 1.2%
Additionally, few participants reported taking a past-year vacation to Australia (2%) or New Zealand (1%), but 6% and 4% respectively reported hoping to visit these two countries in the next 12 months.
Community Marketing, Inc., 584 Castro St. #834, San Francisco CA 94114 USA • +1 415/437-3800 • www.CommunityMarketingInc.com
Page 39 of 39
Demographics
State of Residence
Please select the state in which you live. (Respondents could only choose a single response) Response Chart Frequency Count
California 15.6% 733
New York 7.8% 366
Florida 6.6% 308
Texas 6.5% 303
Illinois 4.9% 231
Pennsylvania 4.2% 199
Ohio 3.5% 163
Massachusetts 3.4% 162
Georgia 3.2% 151
Colorado 3.2% 150
Washington 3.0% 140
New Jersey 2.8% 131
Virginia 2.5% 116
North Carolina 2.3% 109
Michigan 2.3% 107
Arizona 2.3% 106
Maryland 1.9% 89
Oregon 1.7% 81
District of Columbia 1.7% 78
Wisconsin 1.6% 75
Minnesota 1.6% 74
Community Marketing, Inc., 584 Castro St. #834, San Francisco CA 94114 USA • +1 415/437-3800 • www.CommunityMarketingInc.com
Page 40 of 40
Missouri 1.5% 71
Indiana 1.4% 67
Nevada 1.4% 67
Tennessee 1.4% 67
Connecticut 1.0% 49
Alaska 0.8% 39
New Mexico 0.8% 36
Kentucky 0.7% 34
Oklahoma 0.7% 33
Kansas 0.6% 30
Hawaii 0.6% 29
Louisiana 0.6% 28
Utah 0.6% 28
Alabama 0.5% 24
Iowa 0.5% 24
Arkansas 0.5% 22
South Carolina 0.5% 22
New Hampshire 0.4% 20
Rhode Island 0.4% 19
Delaware 0.4% 18
Maine 0.4% 18
Nebraska 0.3% 15
Montana 0.3% 12
West Virginia 0.2% 11
Idaho 0.2% 10
Vermont 0.2% 8
Mississippi 0.1% 7
Community Marketing, Inc., 584 Castro St. #834, San Francisco CA 94114 USA • +1 415/437-3800 • www.CommunityMarketingInc.com
Page 41 of 41
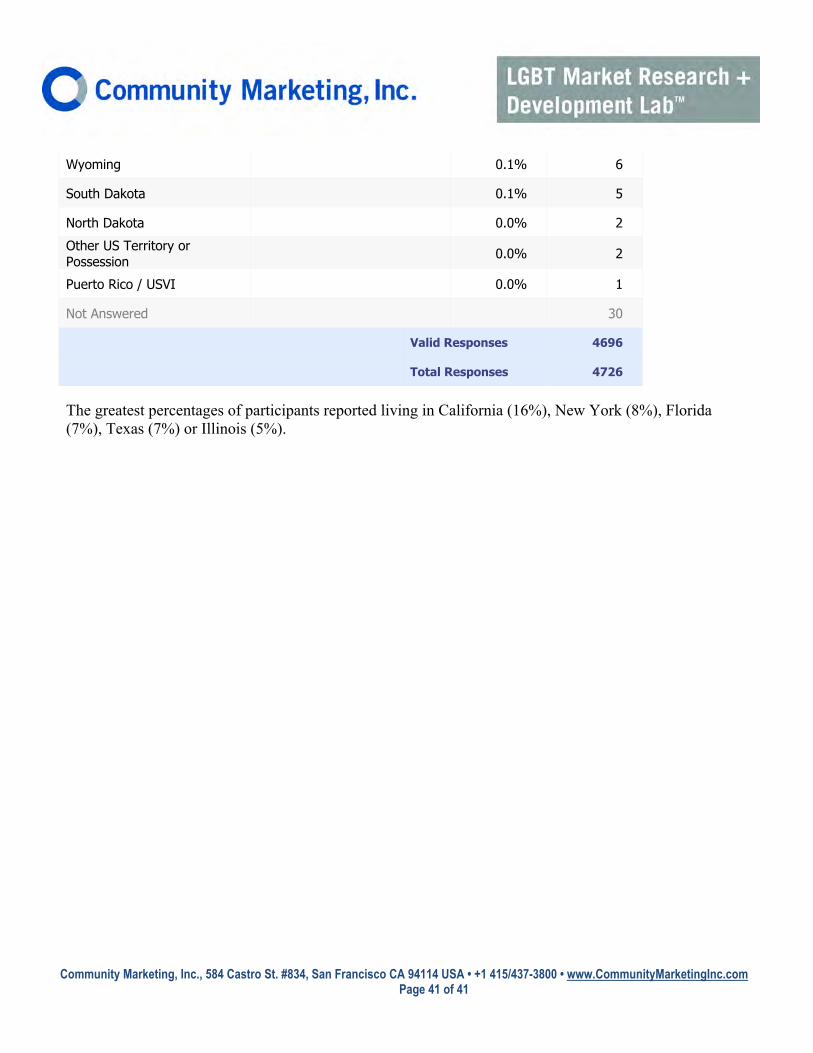
Wyoming 0.1% 6
South Dakota 0.1% 5
North Dakota 0.0% 2
Other US Territory or Possession 0.0% 2
Puerto Rico / USVI 0.0% 1
Not Answered 30
Valid Responses 4696
Total Responses 4726
The greatest percentages of participants reported living in California (16%), New York (8%), Florida (7%), Texas (7%) or Illinois (5%).
Community Marketing, Inc., 584 Castro St. #834, San Francisco CA 94114 USA • +1 415/437-3800 • www.CommunityMarketingInc.com
Page 42 of 42
Urban or Rural Living Environment What type of environment best describes the place in which you live? (Respondents could only choose a single response) Response Chart Frequency Count
Urban / Big City 38.5% 1813
Medium sized city 21.1% 996
Suburb 16.8% 792
Small city 10.4% 491
Small town 5.9% 280
Rural area 5.4% 255
Resort community 1.8% 84
Not Answered 15
Valid Responses 4711
Total Responses 4726
The majority (70%) of respondents reported living in cities, whether big cities (39%), medium-sized cities (21%) or small cities (10%).
Community Marketing, Inc., 584 Castro St. #834, San Francisco CA 94114 USA • +1 415/437-3800 • www.CommunityMarketingInc.com
Page 43 of 43
ABOUT COMMUNITY MARKETING, INC. The facts are plain: gay men and lesbians travel more, spend more and have the largest amount of disposable income. Undaunted by events in the news, gay and lesbian travelers make up 10% of the travel industry—or more. Most critically, their travel dollars go to suppliers and destinations that recognize their unique buying preferences and offer them differentiated value. Community Marketing, Inc. has been helping tourism industry leaders master the subtleties of this market since 1992. Whether your organization is just learning about the market or is updating its strategy, Community Marketing can accelerate your plans, reduce your risks and deliver measurable results. Because gays and lesbians comprise a “slice” of the world’s population, you’ll find markets for singles, couples and families in every ethnicity. And you’ll find a world of diverse interests, from rodeo to golf to snowboarding, from outdoor adventure to mega-parties to theatre. Community Marketing’s proven, powerful portfolio of services helps deliver your targeted markets. Community Marketing, Inc. has earned its position as the global leader in gay tourism marketing. Through the company’s tireless efforts since 1992, “doors have opened” around the world for gay and lesbian travelers. We have helped grow gay market recognition through research, media relations and education; and have brought marketing opportunities to the world’s leading gay-welcoming destinations, hotels and travel suppliers. Besides its rapidly growing LGBT Market Research + Development Lab® practice, we produce the “International Conference on Gay & Lesbian Tourism,” now in its 11th year, and regional “Best Practices in Gay & Lesbian Tourism” seminars. We also developed and operate the TAG Approved® Accommodations program and the GLCVB (Gay & Lesbian Convention & Visitors Bureau), and publish the Annual Gay & Lesbian Travel Industry Directory. As we look forward, we see our partnership with suppliers, hospitality leaders, government Tourism Offices, Convention & Visitors Bureaus and Destination Marketing Organizations continuing to grow, ultimately helping to create a more welcoming “gay-friendly” environment for gay and lesbian travelers worldwide. CMI’s LGBT Market Research + Development Lab® clients include:
Greater Philadelphia Tourism Marketing Corporation Las Vegas Convention & Visitors Authority Dallas Convention & Visitors Bureau Fort Lauderdale Convention & Visitors Bureau
San Francisco Convention & Visitors Bureau Tempe Convention & Visitors Bureau NYC & Co. Baltimore Convention & Visitors Bureau
Palm Springs Bureau of Tourism LA, Inc. (Los Angeles CVB)
Canadian Tourism Commission Switzerland Tourism Japan National Tourism Organization Japan Travel Bureau Travelocity.com LP Kimpton Hotels & Restaurants Hyatt Hotels & Resorts Marriott Hotels Starwood Hotels & Resorts And many others!
Community Marketing, Inc., 584 Castro St. #834, San Francisco CA 94114 USA • +1 415/437-3800 • www.CommunityMarketingInc.com
ABOUT COMMUNITY MARKETING, INC. The facts are plain: gay men and lesbians travel more, spend more and have the largest amount of disposable income. Undaunted by events in the news, gay and lesbian travelers make up 10% of the travel industry—or more. Most critically, their travel dollars go to suppliers and destinations that recognize their unique buying preferences and offer them differentiated value. Community Marketing, Inc. has been helping tourism industry leaders master the subtleties of this market since 1992. Whether your organization is just learning about the market or is updating its strategy, Community Marketing can accelerate your plans, reduce your risks and deliver measurable results. Because gays and lesbians comprise a “slice” of the world’s population, you’ll find markets for singles, couples and families in every ethnicity. And you’ll find a world of diverse interests, from rodeo to golf to snowboarding, from outdoor adventure to mega-parties to theatre. Community Marketing’s proven, powerful portfolio of services helps deliver your targeted markets. Community Marketing, Inc. has earned its position as the global leader in gay tourism marketing. Through the company’s tireless efforts since 1992, “doors have opened” around the world for gay and lesbian travelers. We have helped grow gay market recognition through research, media relations and education; and have brought marketing opportunities to the world’s leading gay-welcoming destinations, hotels and travel suppliers. Besides its rapidly growing LGBT Market Research + Development Lab® practice, we produce the “International Conference on Gay & Lesbian Tourism,” now in its 11th year, and regional “Best Practices in Gay & Lesbian Tourism” seminars. We also developed and operate the TAG Approved® Accommodations program and the GLCVB (Gay & Lesbian Convention & Visitors Bureau), and publish the Annual Gay & Lesbian Travel Industry Directory. As we look forward, we see our partnership with suppliers, hospitality leaders, government Tourism Offices, Convention & Visitors Bureaus and Destination Marketing Organizations continuing to grow, ultimately helping to create a more welcoming “gay-friendly” environment for gay and lesbian travelers worldwide. CMI’s LGBT Market Research + Development Lab® clients include:
Greater Philadelphia Tourism Marketing Corporation Las Vegas Convention & Visitors Authority Dallas Convention & Visitors Bureau Fort Lauderdale Convention & Visitors Bureau
San Francisco Convention & Visitors Bureau Tempe Convention & Visitors Bureau NYC & Co. Baltimore Convention & Visitors Bureau
Palm Springs Bureau of Tourism LA, Inc. (Los Angeles CVB)
Canadian Tourism Commission Switzerland Tourism Japan National Tourism Organization Japan Travel Bureau Travelocity.com LP Kimpton Hotels & Restaurants Hyatt Hotels & Resorts Marriott Hotels Starwood Hotels & Resorts And many others!
LGBT Market Research:There is a difference.
Market research studies and resulting statistics are meant to help marketers understand the LGBTcommunities, and influence educated decisions about their strategies and tactics. However, not allresearch is the same. Community Marketing’s methodologies and experience are distinct from those ofothers when considering approaches, survey respondent sources—and ultimately—the validity andutility of sought-after results.
WHO ARE YOU TALKING TO?Community Marketing, Inc. (CMI) has developed our proprietary consumer panel over the past 15+ years by cir-
culating field surveys at leading LGBT events, and by partnering with LGBT organizations and media across the USA,Canada, the UK, and around the world. These partners distribute our survey invitations via print ads, web banners, andemail broadcasts to their memberships and/or readers. The resulting panels are highly representative of LGBT con-sumers who interact with the LGBT community and media. This is important: If your communications channels are viathe LGBT media, you’ll want to depend on research that represents these consumers’ interests, preferences, sensitivitiesand motivations. CMI research is trusted by—and frequently quoted in—the New York Times, Chicago Tribune, Los AngelesTimes, Miami Herald, USA Today, the Wall Street Journal, Brand Week, etc.
Other providers typically send out widely distributed panel invitations (via Yahoo, etc.), and then sort for those who trustthe researcher enough to indicate that they are gay or lesbian in the context of a survey. This academic approach, attempting to “rep-resent the gay community at large,” may be appropriate for some studies. But we feel that for marketers desiring valid consumerinsights about products, services, advertising creative and marketing strategies, this methodology it is not likely to represent LGBTcommunity members who are reading the media where you are placing ads.
IN RESEARCH, SIZE DOES MATTER.CMI has conducted over a hundred LGBT-dedicated research studies since the early ‘90s, covering a wide variety
of topics, industries and interests. We both observe and influence the trends of this market. Size does matter in the caseof research. Our research panel has grown to over 40,000 qualified LGBT consumers, the largest of its kind, by far. Ourrecent LGBT Consumer Index® study resulted in over 25,000 completed surveys, with nearly a 50-50 male to female ratio,making it the largest such study in history. We leverage our long history/experience/expertise for your benefit, and fine-tune our portfolio of research panels, methodologies and approaches to best match your market intelligence goals.
Without access to this enormous resource of qualified LGBT consumer panelists, other companies have to compromise on thequality and demographic representation of the panel, or “reinvent the wheel” at your expense. One cannot fathom the diversity andcomplexities within LGBT (see below) on a small sample. And with small samples, you loose the opportunity to derive statistically-significant cross tabs on gender, geographical location, age, income, experience, product choice, etc. Can you really make the assump-tion that a 28 year old lesbian in Seattle has the same purchasing motivations and behaviors as a 67 year old gay man in Atlanta?Generalities and sweeping statements based on comparatively small samples can distort the results of research findings, potentiallywasting your investment of time and resources.
DIVERSITY: THERE IS NO “LGBT MARKET”Community Marketing emphasizes that there is no “gay market,” just as there is no singular “Asian market.”
The LGBT communities represent a broad and dynamic variety of interests, sensitivities, preferences and priorities.Those, plus variations in geographical location, age, income, relationship status, gender, sexual identity and more, makeit even more important to discover which opportunities within LGBT will help you achieve your goals. Fine tuning yourapproaches based on highly refined and well-targeted matches within LGBT will make your outreach initiatives moreefficient and cost-effective, and will significantly improve your marketing ROI.
General surveys on “the gay market” are likely to only scratch the surface of the diversity and varieties of opportunitiesmarketers can enjoy if properly explored and understood.
continues...
LGBT Market Research + Development Lab®
584 Castro St. #834 • San Francisco, CA 94114 USA • Tel 415/437-3800 • Fax 415/552-5104info@CommunityMarket ingInc.com • www.CommunityMarket ingInc.com
TWO SIDES OF THE COIN: QUANTITATIVE AND QUALITATIVECMI takes pride in operating the most consistent, longest-running series of LGBT community surveys in the
world. But we don’t stop there. Quantitative (data) research is one important side of a coin, but only tells half of the story.The other side of a comprehensive research initiative involves qualitative research, most notably derived from focusgroups. We pre-qualify our focus group participants from among our survey panelists, identifying the best candidatesbased on characteristics such as age, gender, relationship status, geographical location, and even a propensity or historyof using the client’s products or services. We maintain sufficient numbers of panelists to conduct groups in most majormetro areas across the USA, Canada and Britain, as well as several secondary markets. We’ve found that the same cre-ative, tested in different regions, often yields substantially differing results. Isn’t it wise to know that—and adjust yourplans—before investing in marketing campaigns? CMI is the only LGBT-dedicated research provider that develops andfacilitates LGBT focus groups and other qualitative research options. We have produced and reported on focus groupscovering a wide variety of topics, plus we have run advisory board series, multi-year customer satisfaction survey proj-ects and field studies which can round out a comprehensive market intelligence plan.
Running only online surveys, other research companies are telling half of the story. Without actual consumer interaction,they cannot fathom the deeper insights hiding behind the bar graphs and pie charts, nor can they adequately advise you on the sensi-tivities and complexities that are only uncovered in qualitative research... extremely important considerations that averages andextrapolated assumptions based only on averages are likely to miss.
WE DON’T OUTSOURCE!Community Marketing maintains our own research panels and utilizes advanced, sophisticated research soft-
ware. We do all of our research in-house, because nobody knows this market segment as well as we do. We never sell orrep another company’s services, nor will we outsource your project to a 3rd party.
Some firms work as representatives of research companies, or outsource clients’ projects, and report on the results of the 3rdparty’s work. But without being intimately involved in every aspect of the project, from discussing the client’s goals and designingthe study, to building the survey, implementing it and writing the report, and without engaging directly with consumers in focusgroups, it is difficult to gain the insights that can only come from CMI’s hands-on LGBT research specialization over 15 years.
TRUSTEDCommunity Marketing, Inc., founded in 1992, pioneered LGBT consumer research. Because we are LGBT-owned
and -operated and well known in the community, we have earned the recognition and trust of our survey panelists.LGBT consumers recognize that we use research data to build corporate relationships, which ultimately lead to betterconditions for LGBT employees, social progress, and sensitive communications.
PROUDLY LGBT-OWNED AND -OPERATEDOne of the questions in HRC’s Corporate Equality Index application is whether the applicant company includes
LGBT-owned suppliers when sourcing products and services. When you contract with Community Marketing, you notonly gain the benefit of our long-standing leadership in this field, you are working with one of the only LGBT-ownedmarket research providers. Community Marketing, Inc. is a National Gay & Lesbian Chamber of Commerce-CertifiedLGBT-Owned Business Enterprise.
COMMUNITY CITIZENSHIPCMI is involved in the LGBT community: we volunteer time, donate resources and raise funds for numerous
community-based organizations. We also participate in the community’s leading business and advocacy organizations,events and conferences, such as Out & Equal, HRC, National Gay & Lesbian Chamber of Commerce, Commercial Closet,International Gay & Lesbian Travel Association, National Lesbian & Gay Journalists Association, etc. This communityconnection is not only the right thing to do, it is essential for initiating appropriate relationships for our clients.
VALUEYou’d think that with this kind of specialization and experience, you’d be investing considerably more for CMI
research than for studies from other companies. But it is due to our specific focus on LGBT market intelligence, and thecumulative 50+ years of dedicated LGBT research among the CMI team, that we can actually keep your costs low. We arenot spending your money to locate qualified survey or focus group participants, nor are we spending our time (or yourmoney) trying to source comparative data or case studies. We’ve done all that over the past 15 years for your benefit.And we are not running a large operation that juggles many accounts and projects of differing scope and focus. CMI’sclient dedication and market specialization delivers you superior intelligence at a fraction of the cost of other firms.