EXPLORIS Deliverable D2.8 1 Project number: EVR1-CT-2002-40026 Project Coordinator: Dr. Augusto Neri Deliverable D2.8 Initial and boundary conditions for quasi-steady magmatic eruption scenarios, caldera/edifice collapse scenarios and dome eruption scenarios based on numerical studies Part A: Initial and boundary conditions for quasi-steady magmatic eruptions and caldera/edifice collapse scenarios A.Folch, J.Martì, A.Felpeto, G.Macedonio, A.Neri (CSIC and INGV) Part B: Conduit flow characteristics and the impact they have on explosive eruptions K.Diller, A.Clarke, B.Voight, A.Neri, (ASU, PSU, and INGV) Part C: Large abundance of carbon dioxide in magma below Vesuvius Paolo Papale and Roberto Moretti (INGV) Report period 24 months
Transcript
EXPLORIS Deliverable D2.8
1
Project number: EVR1-CT-2002-40026 Project Coordinator: Dr. Augusto Neri
Deliverable D2.8
Initial and boundary conditions for quasi-steady magmatic eruption scenarios, caldera/edifice collapse scenarios and dome eruption
scenarios based on numerical studies
Part A: Initial and boundary conditions for quasi-steady magmatic eruptions and caldera/edifice collapse scenarios
A.Folch, J.Martì, A.Felpeto, G.Macedonio, A.Neri (CSIC and INGV)
Part B: Conduit flow characteristics and the impact they have on explosive eruptions
K.Diller, A.Clarke, B.Voight, A.Neri, (ASU, PSU, and INGV)
Part C: Large abundance of carbon dioxide in magma below Vesuvius
Paolo Papale and Roberto Moretti
(INGV)
Report period 24 months
EXPLORIS Deliverable D2.8
2
Part A.
Initial and boundary conditions for quasi-steady magmatic eruptions and caldera/edifice collapse scenarios
Arnau Folch1, Joan Martì1, Alicia Felpeto1, Giovanni Macedonio2, Augusto Neri3
1Institut Jaume Almeira, Consejo Superior de Investigaciones Cientificas
2Osservatorio Vesuviano, INGV Napoli 3Centro per la Modellistica Fisica e Pericolosità dei Processi Vulcanici
INGV Pisa
Objective • Proportionate adequate initial and boundary conditions to the modelling of pyroclastic flows and fallout dispersal during explosive eruptions. The goal can be split into two contributions: (i) Quasi-steady magmatic eruptions scenario. In this case it is essential to quantify the main flow variables at the vent and also throughout the eruptive column in order to proportionate realistic boundary conditions to the pyroclastic flows and fallout dispersal models. (ii) Caldera-forming eruptions scenario. Collapse calderas are nearly circular or elliptical volcanic depressions produced by a partial or total roof collapse of a shallow-level magma chamber due to its decompression during the course of an eruptive event. The occurrence of such a catastrophic phenomena is controlled by multiple aspects related to geometry, flow regime within the magma chamber plus conduit system, and syn-eruptive response of the embedding country rocks. The goal here is to assess the syn-eruptive stress field around the chamber plus conduit in order to predict the likelihood of such phenomena. In this sense, one task of the project is to develop a physical model coupling the fluid dynamics within the chamber and the conduit with the structural response of the volcanic edifice. First year achievements • Definition and implementation of a model for the chamber plus conduit system coupled together (see [Macedonio et al., 2005] for more details). The purpose of the model, called CPIUC, is to have an starting point for both quasi-steady eruptions (when coupled with models for the eruptive column and dispersal of pyroclasts) and caldera forming eruptions (when coupled with models for the host rock behavior). The chamber model assumes an homogeneous composition of magma, a vertical profile of volatile content and can have an arbitrary geometry. On the other hand, the conduit model is based on the averaged mass and momentum balance equations solved along an arbitrary-shaped conduit but assuming choked-flow conditions at the exit. Bubble nucleation is considered when the homogeneous flow pressure drops below the nucleation pressure given the total water content and the solubility law. Above the nucleation level, bubbles and liquid magma are considered in mechanical equilibrium. The same equilibrium assumption is assumed above the fragmentation level between gas and pyroclasts. The integration of the density distribution in the chamber allows to obtain the total mass in the chamber as a function of pressure at the chamber top and, through the conduit model, as a function of time (Figure 1). Successful simulation tests pertaining to rhyolitic and basaltic magmas have been performed.
EXPLORIS Deliverable D2.8
3
-11 -10 -9 -8 -7 -6 -5 -4 -3 -2 -1 0
Depth (Km)
0
25
50
75
100
125
150
175
200
225
250
275
Pre
ssur
e (M
Pa)
t = 0 h
t = 4 h
t = 22 h
ConduitChamber
Vent
Figure 1.- Numerical results from the coupled magma chamber plus conduit model, indicating the variation of pressure (above) and magma void fraction (below) along the whole system • Definition and implementation of a model for the host rock and investigation of geometrical constrains for caldera-forming eruptions (see [Folch and Martí, 2004] for details). The model, solves via a Finite Element Method several rehologies such as elastic, thermoelastic or poroelastic and contemplates standard basic fracture criteria. Its main application to project has been to investigate which chamber geometries may induce a syn-eruptive stress field suitable for the formation of ring-fault calderas without needing previous fracturing or without the need of an extensional regional tectonic regime. It has been found that two dimensionless geometrical parameters (chamber extension to chamber depth ratio and chamber eccentricity) determinate two different regions of ring fault calderas with different associated collapse regimes. Ring-fault region A is related to large collapse calderas (i.e. Andean calderas or Western US calderas), for which few depressurization is needed to set up a collapse initially governed by flexural bending of the chamber roof. In contrast, ring-fault region B is related to small to moderate size calderas (i.e. stratovolcano calderas), for which much depressurization is needed. The collapse requires, in this case, reactivation of pre-existing fractures and therefore is more complex and history dependent.
EXPLORIS Deliverable D2.8
4
0 1 2 3 4 5 6-2
-1.5
-1
-0.5
0
0.5
1
1.5
0 1 2 3 4 5 6-2
-1.5
-1
-0.5
0
0.5
1
1.5
Figure 2.- Numerical model illustrating the conditions to form ring-fault calderas, maximum tensile stress at surface (above) and maximum shear stress at a vertical distance on the magma chamber border (below). Second year achievements • The CPIUC model has been extended to other conduit geometries different from the cylindrical in order to contemplate also multiple vents with and arbitrary inclination and ring-fissure conduits. It allows to investigate the influence of the conduit geometry on the dynamics of caldera-forming eruptions. A future publication [Folch and Martí, 2005] will be devoted to this subject. • Coupling of the CPIUC model (first year preliminary results) with a model for the volcanic plume (see [Folch and Felpeto, 2005] for details). The outcome is a one-way coupled model that involves all the spatial domains simultaneously and has a good compromise between physical accuracy and computational efficiency. The coupled model outputs several relevant eruptive parameters such as column height, mass eruption rate, or duration of the eruption. Time-dependency is introduced via a quasi-steady approach, that is, considering a succession of steady states. The purpose of the coupling is to proportionate time-dependent boundary conditions according to the formats and needs demanded by pyroclastic flow and fallout dispersal models developed in parallel in other WP's. • Implementation of the coupling between the fluid (CPIUC) and the structural models developed during the first year of the project. This objective have been reach only in part since further numerical tests are required and computational efficiency must be improved before launching a demonstrator software.
EXPLORIS Deliverable D2.8
5
Future work (up to month 30) Despite the general objectives of D2.8 have been successfully covered it still remain some work to do. A extension the month 30 would allow: • To finish the fluid-structure coupling properly. In addition, it would be interesting to develop a graphical user-friendly interface to input data and visualize the results. • To couple the CPIUC+plume with the fall3d fallout model developed also within the project. It would proportionate, for the first time, a model covering ALL the spatial domains (from the chamber to the deposit). The disposal of such a tool would be an important aid not only in terms of hazard assessment but also to reconstruct past events. References cited
Authors Date Title Journal Reference
Folch, A. and J. Martí
2004 Geometrical and mechanical constraints on the formation of ring-fault calderas
Earth and Planetary Science Letters
221, 215-225, 2004
Macedonio, G., A. Neri, J. Martí, and A. Folch
2005 Temporal evolution of flow conditions in sustained magmatic explosive eruptions
Journal of Volcanology and Geothermal Research
Accepted In press
Folch, A., and A. Felpeto
2005 A coupled model for dispersal of tephra during sustained explosive eruptions
Journal of Volcanology and Geothermal Research
AcceptedIn press
Folch, A., and J. Martí
Manuscript to be submitted
Time-dependent vent conditions at the onset of explosive caldera-forming eruptions
Journal of volcanology and geothermal Research
EXPLORIS Deliverable D2.8
6
Part B.
Conduit flow characteristics and the impact they have on explosive eruptions
Kristina Diller1, Amanda Clarke1, Barry Voight2 and Augusto Neri3
1Arizona State University, Phoenix AZ (USA)
2Penn State University, PN (USA) 3Centro per la Modellistica Fisica e Pericolosità dei Processi Vulcanici
INGV Pisa Background This research is building on previous work published by Clarke et al. in 2002 that explored unsteady vent conditions of Vulcanian explosions. Their research paired a simple, static conduit formulation with a pyroclast dispersal model, PDAC2D (Neri, 1998), which is a numerical, axisymmetric model with three particle sizes. Their conduit model assumed that magma flow had stagnated in the conduit prior to the explosion. Their resulting simulations produced behavior that generally mimicked many qualitative and quantitative characteristics of observed Vulcanian explosions that occurred at Soufrière Hills Volcano, Montserrat, in August of 1997. Based on their models, they concluded that conduit permeability played a significant role in controlling large-scale eruption processes. Table 1 contains input conditions used in both Clarke et al.’s study and the research presented here. These pre-eruptive subsurface initial conditions were derived from published data of the 1997 Vulcanian eruptions at Soufrière Hills Volcano. TABLE 1
Conduit diameter 30 m
Vent plug 20 m thick
Initial conduit gas overpressure 10 MPa
Dissolved water content of the melt 4.3 wt% in chamber
Crystal volume fraction 45% in chamber
Melt composition rhyolitic
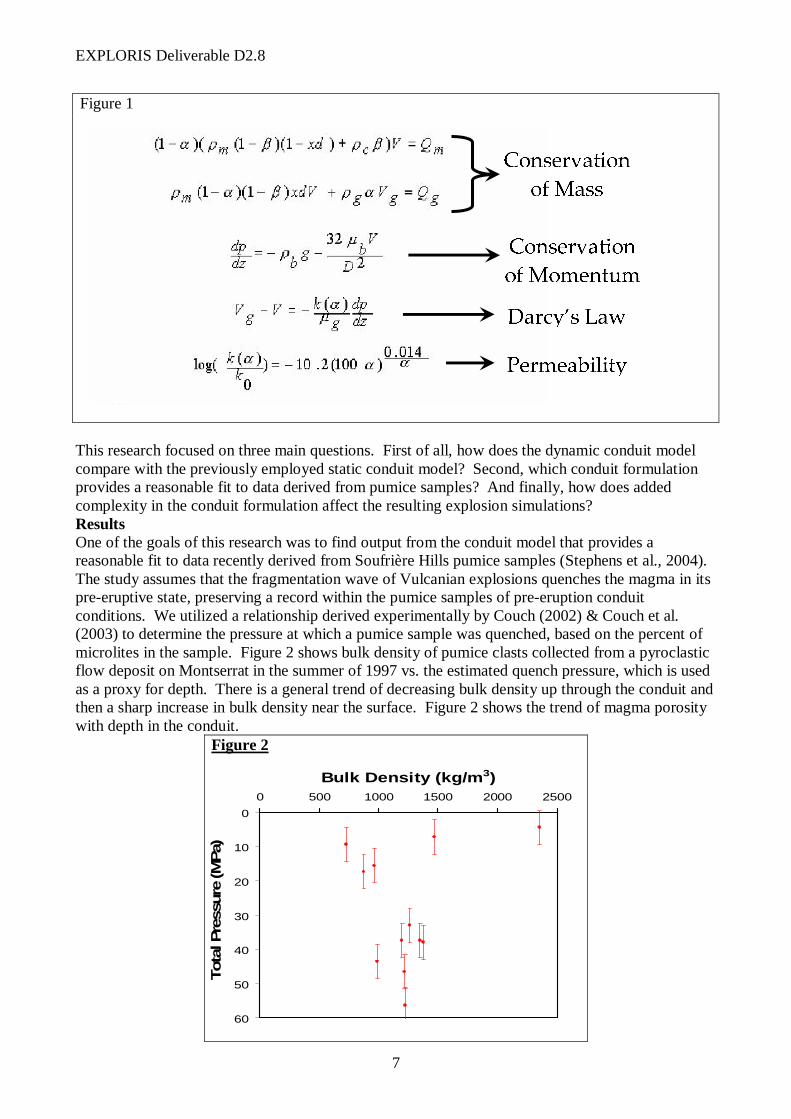
This ongoing research has implemented a new, more rheologically complex, dynamic conduit formulation. The new formulation models 1-D, steady-state, homogeneous flow through a vertical conduit with constant cross section. And, allows for magma viscosity and density changes due to degassing, crystallization, and the presence of bubbles. This formulation creates high overpressure in the shallow conduit. This dynamic conduit formulation is based on equations from Melnik and Sparks 1999 (shown in Figure 1). The model solves for equations of conservation of mass for both the melt and gas phases and conservation of momentum. Darcy’s Law allows the melt and gas phases to move at different velocities relative to one another.
EXPLORIS Deliverable D2.8
7
Figure 1
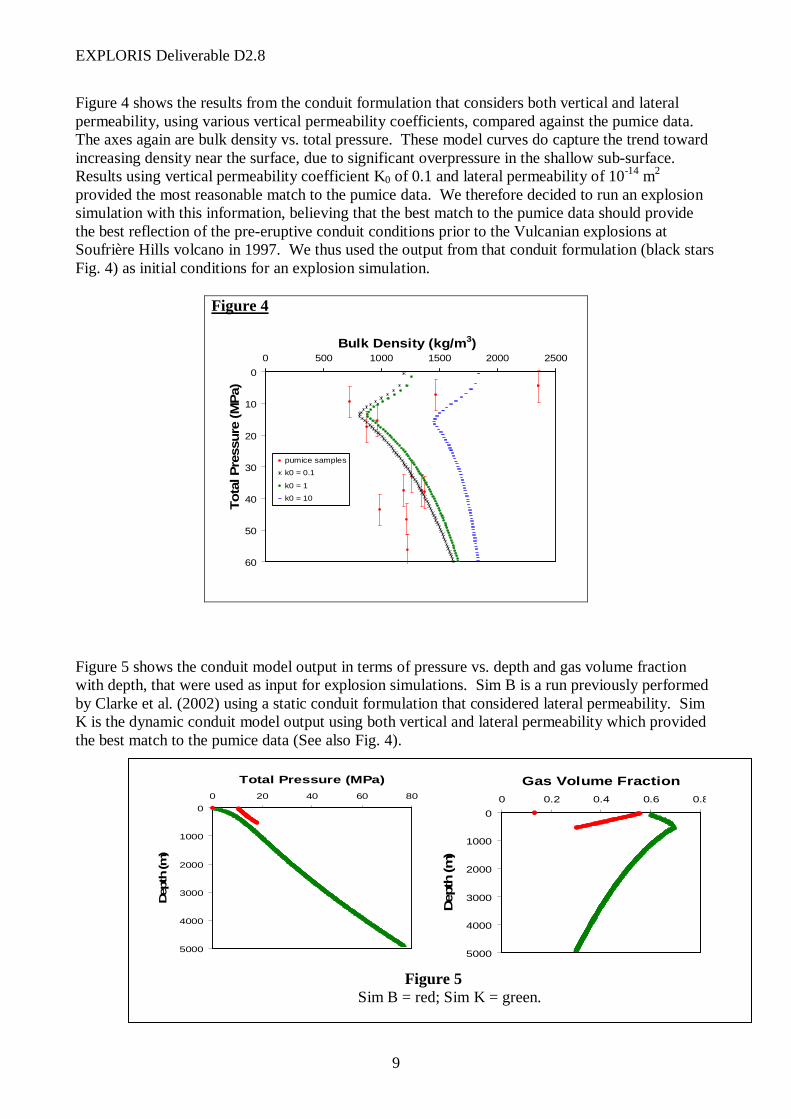
This research focused on three main questions. First of all, how does the dynamic conduit model compare with the previously employed static conduit model? Second, which conduit formulation provides a reasonable fit to data derived from pumice samples? And finally, how does added complexity in the conduit formulation affect the resulting explosion simulations?Results One of the goals of this research was to find output from the conduit model that provides a reasonable fit to data recently derived from Soufrière Hills pumice samples (Stephens et al., 2004). The study assumes that the fragmentation wave of Vulcanian explosions quenches the magma in its pre-eruptive state, preserving a record within the pumice samples of pre-eruption conduit conditions. We utilized a relationship derived experimentally by Couch (2002) & Couch et al. (2003) to determine the pressure at which a pumice sample was quenched, based on the percent of microlites in the sample. Figure 2 shows bulk density of pumice clasts collected from a pyroclastic flow deposit on Montserrat in the summer of 1997 vs. the estimated quench pressure, which is used as a proxy for depth. There is a general trend of decreasing bulk density up through the conduit and then a sharp increase in bulk density near the surface. Figure 2 shows the trend of magma porosity with depth in the conduit.
Figure 2
C o n s e r v a t i o no f M a s sC o n s e r v a t i o no f M o m e n t u mD a r c y ’ s L a wP e r m e a b i l i t y
0
10
20
30
40
50
60
0 500 1000 1500 2000 2500
Bulk Density (kg/m3)
Tota
l Pre
ssure
(M
Pa)
EXPLORIS Deliverable D2.8
8
The only free parameter in our conduit model that is not constrained by field data is permeability. Therefore, we explored permeability as a variable in the dynamic conduit model. Figure 3 shows a formulation considering only vertical permeability, gases escaping only through the top surface of the conduit. The graph shows the conduit model output as bulk density vs. total pressure (again as a proxy for depth) for 4 different values of permeability coefficient. Bulk density increases as permeability increases. However, no reasonable vertical permeability in conjunction with a high magma flux rate of 7.5 m3/s (which is thought to be the approximate flux rate for the period of Vulcanian explosions) captures the sharp increase in bulk density near the surface that is suggested by the pumice samples.
Figure 3
The curves considering only vertical permeability do not capture the trend of the pumice data. We thus realized that this increased density near the surface was an important factor to consider, primarily because it is the high density material near the surface which serves as a ‘cap,’ creating the very conditions necessary for Vulcanian explosions. Our question then becomes: what is causing this increased density in the pumice samples in the shallow subsurface? Our list of possible culprits includes: macroscale permeability, the presence of fractures near the surface allowing for enhanced gas loss; interconnectivity of bubbles near the surface, creating pathways that allow for increased gas loss; unsteady dynamics in the conduit, in which there is rapid ascent of magma followed by stagnation allowing time for extensive near-surface degassing; and lateral permeability, where gases are escaping radially out of the conduit into the country rock. In terms of practical integration of one of these concepts into our conduit formulation, macroscale permeability and interconnectivity of bubbles and their effect on permeability would require additional data. Accounting for unsteady dynamics in the code would require an extensive reformulation of the current code. Therefore, we decided that the most efficient option to test first was lateral permeability. We did this by integrating the following equation into the dynamic conduit model Q g a s l o s s l a t e r a l = A v s k
cr( ∆p / ∆r )
The rate of gas lost laterally is equal to the vertical surface area (
A v s) of the conduit times the
permeability coefficient of the country rock (k
cr) times the radial pressure gradient ( ∆p / ∆r )
.
0
10
20
30
40
50
60
0 500 1000 1500 2000 2500
Bulk Density (kg/m3)
To
tal P
ress
ure
(M
Pa)
pumice samples
k0 = 0
k0 = 1
k0 = 10
k0 = 100
EXPLORIS Deliverable D2.8
9
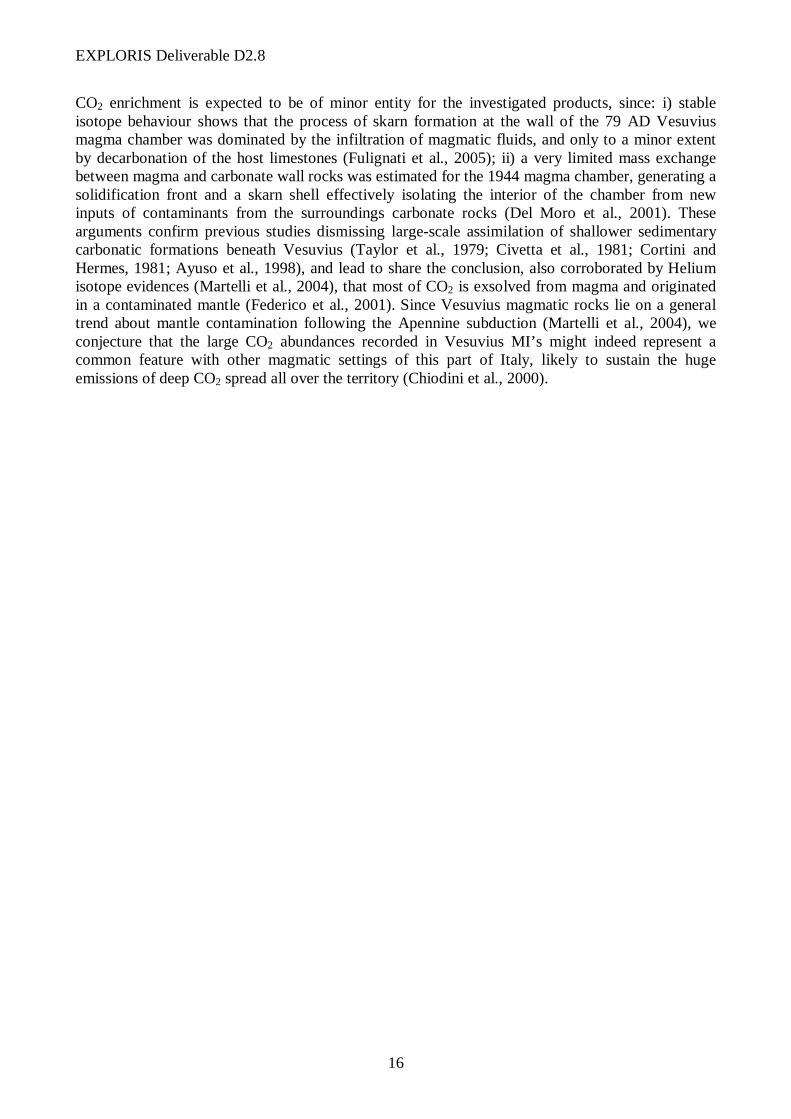
Figure 4 shows the results from the conduit formulation that considers both vertical and lateral permeability, using various vertical permeability coefficients, compared against the pumice data. The axes again are bulk density vs. total pressure. These model curves do capture the trend toward increasing density near the surface, due to significant overpressure in the shallow sub-surface. Results using vertical permeability coefficient K0 of 0.1 and lateral permeability of 10-14 m2 provided the most reasonable match to the pumice data. We therefore decided to run an explosion simulation with this information, believing that the best match to the pumice data should provide the best reflection of the pre-eruptive conduit conditions prior to the Vulcanian explosions at Soufrière Hills volcano in 1997. We thus used the output from that conduit formulation (black stars Fig. 4) as initial conditions for an explosion simulation.
Figure 4
Figure 5 shows the conduit model output in terms of pressure vs. depth and gas volume fraction with depth, that were used as input for explosion simulations. Sim B is a run previously performed by Clarke et al. (2002) using a static conduit formulation that considered lateral permeability. Sim K is the dynamic conduit model output using both vertical and lateral permeability which provided the best match to the pumice data (See also Fig. 4). Figure 5 Sim B = red; Sim K = green.
0
1000
2000
3000
4000
5000
0 20 40 60 80
Total Pressure (MPa)
Dep
th (m
)
0
1000
2000
3000
4000
5000
0 0.2 0.4 0.6 0.8
Gas Volume Fraction
Dep
th (m
)
0
10
20
30
40
50
60
0 500 1000 1500 2000 2500
Bulk Density (kg/m3)
To
tal P
ress
ure
(M
Pa)
pumice samples
k0 = 0.1
k0 = 1
k0 = 10
EXPLORIS Deliverable D2.8
10
Results of these two explosions simulations are presented as two animations (included with this report) of the first 120 seconds of the eruptions. The plots are of total particulate volumetric fraction in the atmosphere, where colored contours indicate log to the base 10 from –8 to –1, with red being the highest concentration and the outer yellow colors being the limit of what is visible to the naked eye. Important things to note are the increased energy and greater particulate volume fractions of Sim K. Qualitatively the two plumes are different, but both produce features present in the actual eruptions at Soufrière Hills volcano – overhangs, collapsing columns, pyroclastic density currents, and co-pyroclastic density current buoyant thermal plumes.
Figure 6 shows the explosion simulation results (dashed lines) on a graph of time after start of explosion vs. height of the plume, with the points representing data obtained from digital video from explosions that occurred on August 6th and 7th 1997 at Soufrière Hills Volcano, is it clear that from 10 seconds on, Sim K is much more energetic than Sim B, and it obviously did not provide an accurate model of the real plume ascent. This excess energy can be attributed to the fact that Sim K had much greater gas volume fractions both at depth and in the shallow subsurface. Figure 6
The simulation based on the dynamic conduit formulation with both vertical and lateral permeability is much more energetic than the actual explosions. But, why did it not match the real eruptions, when it was the best match to the pumice data? One factor to consider is that our explosion model does not account for energy dissipation during fragmentation. Another possibility is that post-fragmentation bubble expansion played a role in the eruptions. Stephens et al.’s analysis of the pumice data used the assumption that the pumice clasts were quenched immediately at the time of fragmentation, so that the porosity of the pumice represents the gas volume fraction of the magma at the time of fragmentation. If post-fragmentation bubble expansion did occur, the data derived from the pumices would not accurately reflect the pre-eruptive gas volume fraction in the conduit. Recently, we attempted to quantify the amount of post-fragmentation bubble expansion for these pumice samples. Using concepts concerning post-fragmentation bubble expansion during the 1997 Soufrière Hills Vulcanian explosions (Formenti and Druitt, 2003), we have adjusted the bulk
EXPLORIS Deliverable D2.8
11
density data of Stephens and Clarke to account for this expansion (Figure 7). We quickly created new conduit results in hopes of matching the adjusted pumice data. This gold curve, which uses a higher vertical permeability coefficient, appears to be a reasonable match. If this conduit output was used as input for our next explosion simulation, the lower gas volume fractions throughout the conduit should help to alleviate the excessive energy seen in Sim K (Figure 8). However, this was our first attempt at quantifying the post-fragmentation bubble expansion and we plan to further investigate this in the future, with the overarching goal of understanding the relationship between conduit dynamics and eruption plume dynamics. Figure 7
0
10
20
30
40
50
60
500 1000 1500 2000 2500 3000
Bulk Density (kg/m3)
To
tal P
ress
ure
(M
Pa)
pumice data
adjusted pumice data
k0 = 0.1
k0 = 2.5
EXPLORIS Deliverable D2.8
12
Figure 8
Recommendations and Future Work Future work will involve the continued effort to quantify post-fragmentation bubble expansion of the pumice samples. This will include an investigation of literature concerning post-fragmentation bubble expansion and data from Montserrat pumice. Also, SEM images of our Montserrat pumice samples will be analyzed to search for evidence of post-fragmentation bubble expansion. In addition, we will continue to improve the dynamic conduit code to create output results that more accurately match the existing pumice data. We plan to investigate how the addition of crystallization in the conduit and different fragmentation mechanisms may affect conduit processes. Finally, we will continue to perform explosion simulations in hopes of producing results that mimic the actual explosions, thereby revealing information about the true connection between conduit dynamics and eruptive plume dynamics.
0
2500
5000
0.25 0.45 0.65
Gas Volume Fraction
Dep
th (
m)
Sim B
Sim K
New Sim?
EXPLORIS Deliverable D2.8
13
Part C
Large abundance of carbon dioxide in magma below Vesuvius
Paolo Papale1 and Roberto Moretti2
Istituto Nazionale di Geofisica e Vulcanologia 1Sez. Roma1, Via della Faggiola 32, 56126 Pisa
2Sez. Osservatorio Vesuviano, Via Diocleziano 328, 80124 Napoli
Carbon dioxide is commonly assumed to be about 10 times less abundant than water in most natural magmas. However, direct measurements of the total H2O and CO2 contents in magmas do not exist, as the available measurements refer to either the dissolved amounts in melt inclusions (hereafter MI’s) within crystals, or the concentrations in gas plumes and fumaroles. Due to high H2O solubility, MI’s can provide a reasonable approximation of total water contents in magmas. On the contrary, the very low CO2 solubility in natural magmas results in its preferential partition in the gas phase, making melt inclusions unsuitable for a direct estimate of its abundance. MI’s in olivine crystals from past eruptions of Vesuvius show maximum water contents around 5 wt%, while dissolved carbon dioxide is at most about 0.4 wt%. Recent investigation (Papale, JGR in press) shows that MI’s can be used in conjunction with multi-component gas-liquid equilibrium modelling to constrain the total amounts of H2O and CO2 consistent with the dissolved quantities. Here it is shown that MI’s in crystals erupted during the 1944, 1906, and AD 79 eruptions of Vesuvius indicate the existence of a large magma body with top at around 10 km depth and extending down to at least 18-20 km. This magma body contains carbon dioxide in the order of at least some wt%, and a gas phase made of 80-90 wt% CO2.
Any pair of H2O and CO2 dissolved in a liquid at given P-T-composition conditions can originate from an infinite combination of total H2O and CO2 contents lying on a straight line called TV (Total Volatile) line. A set of MI’s formed in closed system conditions relative to the gas phase produces therefore a corresponding set of TV lines, the intersection of which corresponds to the actual total H2O and CO2 contents in the system. Crystallisation of magma corresponds to a shift of TV lines, which can be easily corrected by including the amount of crystallisation. This quantity can be determined for any pair of MI’s on the basis of the concentration of incompatible elements. Open system conditions produce a progressive decrease of the slope of TV lines. In this case, the envelope of all TV lines approximates the evolution of total volatile contents in that system. These simple concepts, which have been rigorously demonstrated and successfully applied to basaltic and rhyolitic test cases, open new perspectives in the investigation of magmatic volatiles. In fact, the TV line concept provides a simple, sound, and straightforward method to constrain the amount of the two major magmatic volatiles water and carbon dioxide during the various stages of magmatic evolution.
The basic assumption underlying the TV method is that of local equilibrium conditions, that is, the liquid composition measured in MI’s must be representative of the local liquid-gas equilibrium. The same assumption is commonly adopted in MI’s studies carried out all over the world. We make this assumption throughout this study, although we stress the importance of improving much the present-day knowledge of the kinetics of volatile diffusion at the boundary of crystals growing in a magmatic melt.
Any pair of equilibrium dissolved H2O and CO2 content corresponds to a unique entrapment pressure and composition of the coexisting gas phase. The composition of the gas phase is also required in the definition of the TV line corresponding to that given H2O and CO2 pair. In order to be determined, pressure and gas phase composition need an independent estimate of the entrapment temperature, and the availability of a multi-component gas-liquid equilibrium model. Here we adopt a fully non-ideal, non-Henrian model based on 10 major oxides and dissolved H2O and CO2 volatiles (Papale, AM 1999), after having re-calibrated the model by updating the database with the
EXPLORIS Deliverable D2.8
14
H2O, CO2, and H2O+CO2 saturation data produced in the literature after its first calibration in 1997. This means an increase of 537 data points which nearly double the original database. The linear robust estimate technique adopted in model calibration is described in Papale (AM, 1999). Figure 1 shows the comparison between the experimental and calculated saturation conditions. A total of 856 data on H2O solubility, 182 data on CO2 solubility, and 85 data on H2O+CO2 saturation in silicate liquids is satisfactorily reproduced by the model. These data span pressure conditions from a few tens to thousands MPa, temperature conditions from 800 to 2000 °C, and volatile-free composition conditions from synthetic two-component oxide systems to natural silicate melts from basaltic to rhyolitic and peraluminous to peralkaline. The CO2 saturation data produced before the eighties are not included in the database, since they are affected by systematic errors due to the 14C β-tracking analytical technique used at that time. The dissolved amounts of H2O and CO2 from MI’s in the Vesuvius products considered here correspond to the initial portion of the 1:1 line in Fig. 1a,b, where the correspondence between calculated and experimental conditions is maximum.
Figure 2 reports the MI’s data relative to the concentration of H2O and CO2 measured in samples from the AD79, 1906, and 1944 eruptions of Vesuvius. Most of the data cluster between 2 and 5 wt% H2O, and 500 – 4000 ppm of CO2. Two samples from MI’s in leucite crystals of the 1944 eruption have about 1 wt% H2O and 300-400 ppm CO2, and one sample from the interstitial liquid of a cumulitic dunite of the same eruption shows about 1.5 wt% H2O and 100 – 200 ppm CO2. Figure 3 shows the application of the TV line concept to these MI’s, entrapment temperatures having been calculated via a composition-based empirical function specifically calibrated on Vesuvius MI’s. MI’s belonging to the same group defined in Fig. 2 are processed in order to determine the total (in the liquid and gas phases) H2O and CO2 contents consistent with the amounts dissolved in the liquid phase. Uncertainties (reported in Fig. 2) are taken into account by expanding the analytical uncertainty in order to include the approximation of the model in reproducing the experimental H2O and CO2 saturation contents. The conservative total uncertainty of 15% for H2O and 25% for CO2 has been assumed, on the basis of 10% analytical uncertainty and experimental-calculated relationships in Fig. 1. The fields referring to different MI groups in Fig. 3 include therefore all the total H2O and CO2 pairs which would produce the corresponding sequence of MI’s, by taking into account the uncertainties in the analytical data and in model predictions. These total H2O and CO2 contents refer to the liquid+gas phase mass only. The corresponding fields for the 1944 eruption samples, which account for different amounts of crystallisation from the 1944 liquid in MI’s within dunitic cumulates, are also shown. Total H2O and CO2 concentrations in these fields refer to liquid+gas+crystal phase mass.
All of the fields in Fig. 3 except that referring to MI’s in dunitic cumulates from 1944 eruption are open towards the height. The reason is that in order to close the field it is required that MI data cover conditions from high to low volatile contents. Unfortunately, this is not the case, since MI studies are normally carried out with the intention to detect the highest volatile contents. The single low pressure datum in Fig. 2 referring to interstitial liquid in cumulate dunite allows closing the corresponding field in Fig. 3. That field corresponds to possible total H2O and CO2 pairs consistent with all data from 1944 cumulate dunite. If the low pressure volatile contents were formed under open system degassing conditions, that field represents a minimum estimate of total H2O and CO2 contents. All of the fields in the figure, except that referring to 1944 MI’s in leucite, are closed at the bottom. This implies that total volatile contents lower than those corresponding to each field are not consistent with the bulk of the corresponding MI data. Having made a conservative estimate of the uncertainties implies that these minimum estimates of total volatile contents are also conservative.
One relevant information from Fig. 3 is that the relatively abundant 1906 and 1944 data show minimum total CO2 contents of 3 – 7 wt%, and minimum total H2O contents of 3 – 4 wt%. Larger total H2O contents imply larger total CO2, according to the shape and slope of each of the fields in the figure. A second relevant information derives from the distinction between the various fields corresponding to different sets of data. This distinction means a different total CO2/H2O mass ratio in magma. The lowest ratio is associated with melt inclusions in dunite cumulates. This ratio
EXPLORIS Deliverable D2.8
15
increases progressively for inclusions in 1906 olivine, 1944 olivine, and 1944 leucite, for which it is maximum. Data from the AD 79 eruption correspond to a wide possible range of CO2/H2O mass ratios largely overlapping with those of 1944 dunite and 1906 olivine melt inclusions.
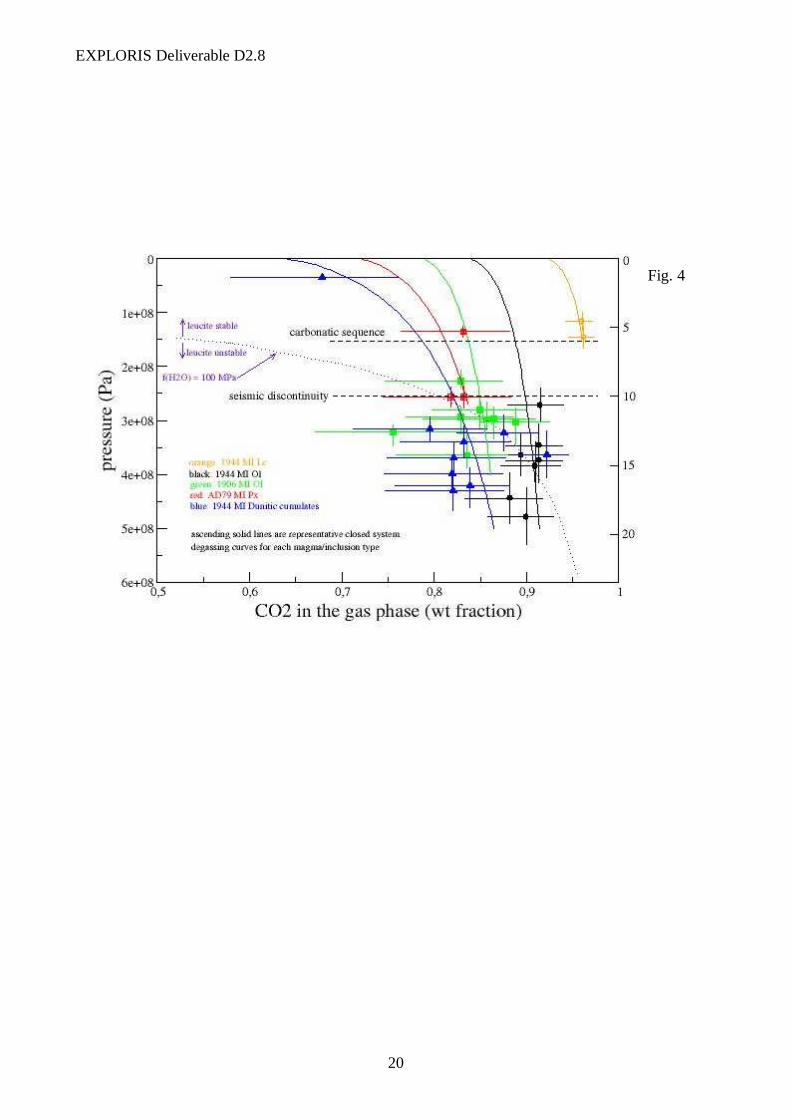
Figure 4 shows the pressure and gas phase composition corresponding to all MI data considered here. The corresponding depth is obtained by assuming an average rock density below Vesuvius of 2600 kg/m3. Most data correspond to a depth range between 10 and 20 km, with an upper limit at 8 – 10 km representing a sort of barrier below which the data cluster. This depth corresponds closely to that of a prominent converted P-to-S phase obtained by 2D seismic tomography, and interpreted as the possible top of an extended magma body below Vesuvius (Zollo et al., 1996, 1998; Auger et al., 2001). CO2 concentration in the gas phase for these high pressure MI’s range 70 – 95 wt%, with most data clustering above 80 wt%. The two high total CO2/H2O mass ratio inclusions in leucite from the 1944 eruption, and one MI from the AD 79 eruption, correspond to a depth of 4 - 7 km, just above or at the contact with the inferred bottom of the carbonatic sequence (5-6 km of depth), in good agreement with estimates on fluid inclusions hosted in clinopyroxenes found in cumulates and subeffusive nodules from 3800 y.B.P., 79 AD and 472 AD Vesuvius plinian events (Belkin and De Vivo, 1993). Inclusions in leucite correspond to the highest CO2 concentration in the gas phase of 95 – 97 wt%. Finally, the relatively low volatile concentrations in the interstitial liquid of the dunitic cumulate correspond to a depth of only about 1.4 km, and were probably formed during continuous gas exsolution from the liquid upon magma rise. Accordingly, the corresponding CO2 concentration in the gas phase results to be the lowest, in the range 58 – 75 wt%.
An important implication of the high to very high CO2 concentrations in the gas phase shown in Fig. 4 is that the stability curve of leucite for Vesuvius magmas is strongly shifted towards large pressure/depth conditions. The curve reported in Fig. 4 refers to H2O fugacity of 100 MPa, above which leucite is commonly assumed to be unstable in Vesuvius magmas at magmatic temperatures (1050 ≤ T ≤ 1200 °C). Although this may represent an erroneous conclusion due to the shrinking of the leucite field as H2O enters the liquid in the nepheline-kalsilite-SiO2 systemref.some, it is known from experiments on 1944 volcanics that leucite can be the primary phase at liquidus under CO2-rich conditions (Trigila and De Benedetti, 1993). In the range of conditions pertaining to the considered melt inclusions, leucite can easily start forming down to a pressure of 400 MPa, or to a depth of 15 km. Leucite phenocrystals were indeed observed in 1944 lava fountain deposits carrying clinopyroxenes and olivines hosting the volatile-rich MI’s (Marianelli et al., 1999). Accordingly, the common and simplistic use of leucite crystals as an indicator of low pressure (i.e. Ptot ≤ 1 kbar) crystallisation conditions is not justified. The picture that emerges for magma below Vesuvius from the major XX century eruptions, and possibly for the AD 79 eruption, is that of a large reservoir, at least 7 – 8 km thick and having its top at 8 – 10 km depth, hosting a large carbon dioxide content of at least some wt%, comparable to, or even larger than, the corresponding water content, with a gas phase occupying a large portion of total volume and dominantly made of carbon dioxide. A second minor reservoir appears at the shallow depth of 4 – 7 km. The progressive CO2 to H2O enrichment from dunite to 1906 to deep 1944 to shallow 1944 magma is not simply consistent with an open system degassing path, since loss of CO2-rich gas would rather result in progressive decrease of total CO2 relative to H2O. A progressive CO2 accumulation from a CO2-rich gas phase bubbling through the deep magma body and locally re-equilibrating with the melt phase could instead explain such a trend. The large CO2 enrichment in MI’s from shallow crystallising leucite is consistent with this view, although a contribution by decarbonation reactions at the contact with the carbonatic rocks of the Campanian Plain can not be ruled out. It is worth noting that our barometric estimate for these inclusions is consistent with that from a pyroxene-hosted MI from the 79 AD event and with the maximum depth of metamorphism (5-6 km) inferred by carbonate ejecta from Vesuvius Plinian eruptions (Barberi and Leoni, 1980). Nevertheless, this latter depth value must not be taken as representative of the bottom of magma chambers feeding plinian events, but simply as the bottom of the carbonatic sequence. This implies that roots of a unique magma chamber can extend downward this depth, coherently with our barometric estimates. Moreover, the decarbonation contribution to the observed
EXPLORIS Deliverable D2.8
16
CO2 enrichment is expected to be of minor entity for the investigated products, since: i) stable isotope behaviour shows that the process of skarn formation at the wall of the 79 AD Vesuvius magma chamber was dominated by the infiltration of magmatic fluids, and only to a minor extent by decarbonation of the host limestones (Fulignati et al., 2005); ii) a very limited mass exchange between magma and carbonate wall rocks was estimated for the 1944 magma chamber, generating a solidification front and a skarn shell effectively isolating the interior of the chamber from new inputs of contaminants from the surroundings carbonate rocks (Del Moro et al., 2001). These arguments confirm previous studies dismissing large-scale assimilation of shallower sedimentary carbonatic formations beneath Vesuvius (Taylor et al., 1979; Civetta et al., 1981; Cortini and Hermes, 1981; Ayuso et al., 1998), and lead to share the conclusion, also corroborated by Helium isotope evidences (Martelli et al., 2004), that most of CO2 is exsolved from magma and originated in a contaminated mantle (Federico et al., 2001). Since Vesuvius magmatic rocks lie on a general trend about mantle contamination following the Apennine subduction (Martelli et al., 2004), we conjecture that the large CO2 abundances recorded in Vesuvius MI’s might indeed represent a common feature with other magmatic settings of this part of Italy, likely to sustain the huge emissions of deep CO2 spread all over the territory (Chiodini et al., 2000).