Explosive Residue Analysis: Evaluation and Optimisation of Sampling, Storage and Cleanup Protocols Nopporn Song-im A thesis submitted for the degree of Doctor of Philosophy in Applied Science University of Canberra June 2011
Transcript
Explosive Residue Analysis: Evaluation and Optimisation of
Sampling, Storage and Cleanup Protocols
Nopporn Song-im
A thesis submitted for the degree of Doctor of Philosophy in Applied Science
University of Canberra
June 2011
ii
iii
ABSTRACT
For the detection and identification of explosive residues, surfaces of interest are typically sampled by swabbing or solvent wash. The current use of sequential swabbing protocols that separately target organic and inorganic compounds is under threat due to the increased use of improvised organic/inorganic explosive mixtures. An optimised swabbing procedure, using commercially available skin cleansing alcohol wipes, was developed to maximize the collection of both organic and inorganic explosive residues in a single step. Using six representative compounds (TNT, RDX, PETN, TATP, ammonium nitrate, and sodium chlorate) and four different substrates (glass, plastic, aluminium foil and laminate), the collection efficiency of the alcohol wipes was compared to the results obtained using conventional cotton swabs, polyester swabs, and a direct solvent wash (used as a control). The alcohol wipes demonstrated better overall performance in the recovery of both the organic and inorganic compounds from all test surfaces.
The compositions of a mixture of three organic solvents (acetone, acetonitrile and methanol) and water for a single-step solvent extraction of both organic and inorganic representative compounds from the alcohol wipes was investigated. In addition, the study included the evaluation and optimisation of a subsequent solid-phase extraction (SPE) clean-up procedure for the wipes extracts utilising several solid-phase extraction cartridges (both commercially available and prepared in-house).
The application of a polyester alcohol wipe as a universal swab, followed by extraction with 60% v/v methanol/water and clean-up with a Nexus SPE cartridge, was proposed as the final optimised protocol for the combined recovery and clean-up of organic and inorganic explosive residues.
The stability of the six representative compounds on polyester wipes and in 60% v/v methanol/water extracts, stored over 30 days in clear and amber glass vials at three different temperatures, was assessed in order to establish storage recommendations in conjunction with the final proposed protocol. The retention of all six target compounds on a glass surface at two different storage temperatures was included for an estimation of the maximum time that the explosive material could still be detected and recovered from a stored exhibit.
iv
The results from the stability study suggested that, after sampling, the wipes should be stored in a dark and low temperature environment. Also, after processing using the proposed protocol, the extracts should be stored in a similar fashion. The results from the retention study of the six target compounds on the glass substrate suggested that exhibits should be stored at the lowest temperature possible to minimise the loss of any TNT or TATP (or similar target compounds) that might be contained within the sample.
vi
vii
ACKNOWLEDGEMENTS
Completion of this research would not have been possible without the significant assistance and outstanding support of a number of individuals and organizations.
I owe enormous thanks to my great supervisors, Professor Chris Lennard and Dr Sarah Benson. Without the support of my application to the university from Chris, and the initial thoughts of Sarah to outline the scope of the research, this thesis would not exist and my passion to gain expertise in the field of forensic chemistry would have come to an abrupt end. Thank you very much for your encouragement, guidance and your effort to review this thesis within a short period of time. It has been a privilege to be your student.
I must thank my parents for their absolute support in all the endeavours I have chosen.
I would like to acknowledge the support from Forensic and Data Centres at the Australian Federal Police (AFP), and the assistance and advice given by the staff of the Chemical Criminalistics team at the AFP.
Thanks are due to technical staff, both past and present, at the Faculty of Applied Science, University of Canberra, especially to Melissa Clark, Richard Carne and Dr Ruben Ramirez. Without their help, this research would not have been completed on time.
As a first time user of capillary electrophoresis, my special thanks go to Dr Cameron Jones at the University of Tasmania for his guidance regarding technical issues, and to Dr Tamsin Kelly for access to the instrument.
Cheers to my colleagues at the National Centre for Forensic Studies, both past and present, for making it such a great and friendly environment. Carolyn, Sam and Aidan deserve special thanks for lending me their helping hands to collect background swabs.
viii
During the first month in Canberra, life would not have been easy without the help from Ron Foster and also I would like to thank Dr Dennis McNevin for help in commuting to the University at that period of time. Thanks also to Nicholas Coppel and housemates at number 52 for a great living environment. Heartfelt thanks to my good friends, Dr Stephen Wild, Dr Royston Gustuvson and Dr Peter McCabe who offered advice and insights on life during the PhD and how to manage personal issues.
All work and no play make Jack a dull boy. I am extremely grateful to everyone in Sydney Roadrunners especially James and Luke who provided me an exhilarating experience at high speed every time I fled from frustrating laboratory work.
Finally, on a more personal level, I would like to express my deep appreciation for the sustaining support from two extra-special men who have been my great mates, Tom and Steve, their encouragement kept me going through all the tough times. Thank you.
ix
TABLE OF CONTENTS
Abstract ....................................................................................................................................iii Certificate of Authorship of Thesis......................................................................................... v Acknowledgements.................................................................................................................vii Table of Contents .................................................................................................................... ix List of Figures ......................................................................................................................... xv List of Tables.......................................................................................................................xxvii List of Abbreviations........................................................................................................... xxix Chapter 1 Introduction............................................................................................................ 1 1.1 Types of explosives.............................................................................................................. 2
1.2 Forensic analysis of explosive residues ............................................................................... 5 1.2.1 Types of samples submitted for analysis....................................................................... 5 1.2.2 Explosive residue analysis protocols............................................................................. 6 1.2.3 Specific issues with current sampling protocols ........................................................... 7
1.3 Survey on the swabbing protocols for the recovery and analysis of explosive residues ..... 8 1.4 Anticipated outcomes........................................................................................................... 9 1.5 Structure of this research...................................................................................................... 9 1.6 References .......................................................................................................................... 12 Chapter 2 Quantitative Methods for the Analysis of Representative Explosives ............ 15 2.1 Introduction ........................................................................................................................ 15 2.2 Quantitative method for the analysis of RDX, TNT and PETN ........................................ 15
2.2.1 Method selection and optimisation ............................................................................. 15 2.2.2 Chemicals .................................................................................................................... 17 2.2.3 Instrumentation............................................................................................................ 17 2.2.4 Results ......................................................................................................................... 18 2.2.5 Linearity of the method ............................................................................................... 20 2.2.6 Conclusions ................................................................................................................. 27
x
2.3 Quantitative method for the analysis of triacetone triperoxide (TATP) ............................ 28 2.3.1 Introduction ................................................................................................................. 28 2.3.2 Method selection ......................................................................................................... 29 2.3.3 Chemicals .................................................................................................................... 35 2.3.4 Instrumentation............................................................................................................ 36 2.3.5 Method optimisation and results ................................................................................. 36 2.3.6 Linearity of the method ............................................................................................... 42 2.3.7 Conclusions ................................................................................................................. 43
2.4 Quantitative method for the analysis of chlorate and nitrate ............................................. 44 2.4.1 Method selection and optimisation ............................................................................. 44 2.4.2 Chemicals .................................................................................................................... 44 2.4.3 Instrumentation............................................................................................................ 45 2.4.4 Results ......................................................................................................................... 45 2.4.5 Linearity of the method ............................................................................................... 47 2.4.6 Conclusions ................................................................................................................. 51
2.5 References .......................................................................................................................... 51 Chapter 3 Evaluation of various sampling media – the search for a universal swab for collecting explosive residues ............................................................................................ 55 3.1 Characterisation of fibre material in the selected sampling media .................................... 58
3.3 Evaluation of a sampling system utilising a combined swab for both organic and inorganic explosive residues. ................................................................................................... 67
3.3.1 Evaluation of three organic solvents for the recovery of selected organic explosives from test surfaces utilising cotton and polyester swabs ..................................... 68
3.3.2 Evaluation of a swabbing system for a combined organic/inorganic swab for the recovery of explosive residues ............................................................................................. 71
3.4 Evaluation of alcohol wipes for use as a universal swab for collecting explosive residues..................................................................................................................................... 78
3.5 References .......................................................................................................................... 85 Chapter 4 Optimisation of the swab extraction and clean-up procedure......................... 87 4.1 A single step swab extraction for the combined recovery of organic and inorganic explosives ................................................................................................................................. 87
4.2 Evalution and optimisation of a clean-up procedure for extracts obtained from universal swabs ...................................................................................................................... 105
4.2.1 Assessment of the retention capacity of the selected sorbents.................................. 109 4.2.1.1 Materials and chemicals.................................................................................... 110 4.2.1.2 Experimental method........................................................................................ 111 4.2.1.3 Results............................................................................................................... 111 4.2.1.4 Conclusions....................................................................................................... 115
4.2.2 Optimisation and establishment of a clean-up procedure ......................................... 116 4.2.2.1 Materials and chemicals.................................................................................... 116 4.2.2.2 Experimental methods and results .................................................................... 116 4.2.2.3 Conclusions....................................................................................................... 121
4.2.3 Testing the clean-up procedure with the extract from a polyester wipe ................... 121 4.2.3.1 Materials and chemicals.................................................................................... 121 4.2.3.2 Sample preparation ........................................................................................... 122 4.2.3.3 Results............................................................................................................... 123 4.2.3.4 Conclusions....................................................................................................... 129
4.3 References ........................................................................................................................ 129 Chapter 5 A universal swabbing protocol for the combined recovery of organic and inorganic explosive residues ................................................................................................ 133 5.1 Quantitative method for the analysis of extracts containing both TNT and PETN ......... 134
5.1.1 Chemicals .................................................................................................................. 134 5.1.2 Instrumentation.......................................................................................................... 134 5.1.3 Linearity of the method ............................................................................................. 135 5.1.4 Conclusions ............................................................................................................... 138
5.2 Feasibility study of the proposed protocol ....................................................................... 139 5.2.1 Materials and chemicals ............................................................................................ 139 5.2.2 Experimental method ................................................................................................ 139
5.2.2.1 Experimental method for testing the protocol modified by the addition of a deionised water flush .................................................................................................... 140
Chapter 6 Stability of explosive residues on polyester wipes and in methanol/water extracts .................................................................................................................................. 155 6.1 Experimental .................................................................................................................... 156
6.1.1 Materials and chemicals ............................................................................................ 156 6.1.2 Sample preparation.................................................................................................... 157
6.2 Results .............................................................................................................................. 160 6.3 Conclusions ...................................................................................................................... 183 6.4 References ........................................................................................................................ 184 Chapter 7 Summary and future directions........................................................................ 187 7.1 Summary of the study ...................................................................................................... 187 7.2 Future directions............................................................................................................... 191 7.3 References ........................................................................................................................ 192 Appendix 1 Survey on the collection, sample preparation and analysis of explosive residues.................................................................................................................................. 195 Appendix 2 Preliminary study on the efficiency of various solvents for the extraction of organic explosives .......................................................................................... 203 A2.1 Experimental ................................................................................................................. 203
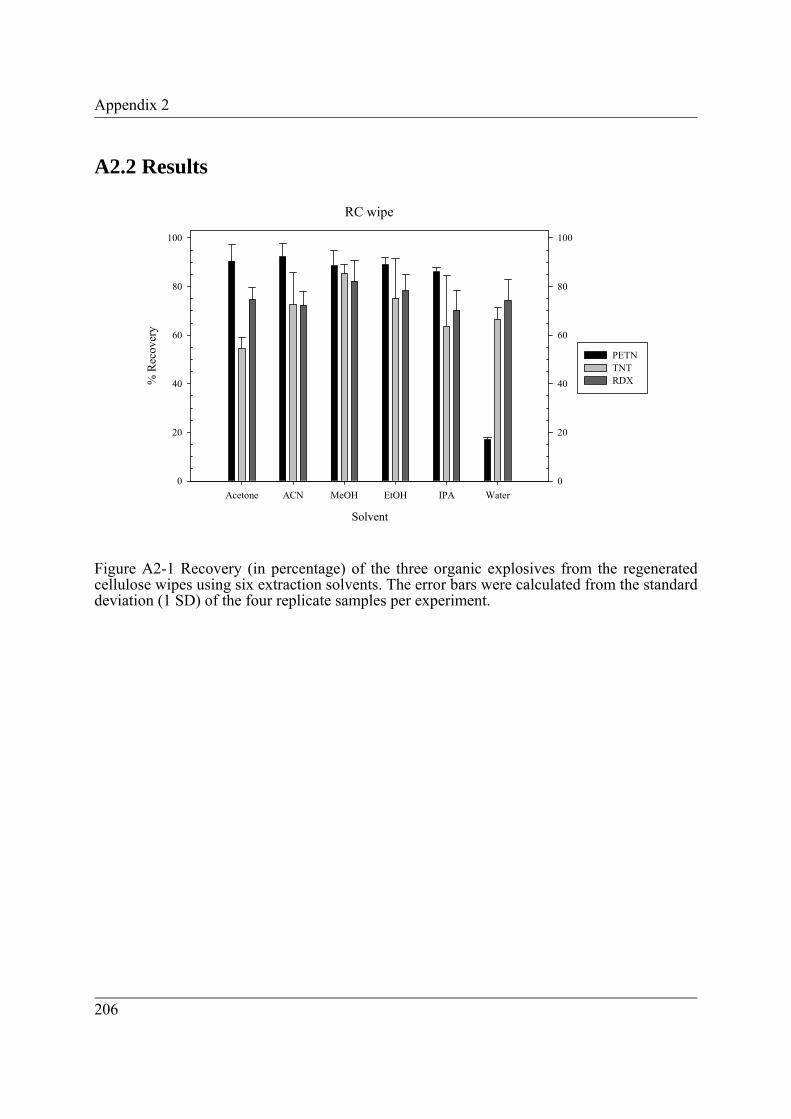
A2.2 Results ........................................................................................................................... 206 A2.3 Conclusions ................................................................................................................... 209 Appendix 3 Information on the types of environmental surfaces sampled for testing the proposed clean-up procedure........................................................................................ 211
xiv
xv
LIST OF FIGURES
Figure 1-1 Examples of chemical structures of some nitroaromatics ........................................ 2 Figure 1-2 Examples of chemical structures of some nitrate esters........................................... 3 Figure 1-3 Examples of chemical structures of some nitramines .............................................. 3 Figure 1-4 Chemical structure of hexamethylene triperoxide diamine...................................... 4 Figure 1-5 Chemical structures of the six representative compounds ..................................... 10 Figure 2-1 Chromatogram of a solution containing 0.1 ppm of RDX (peak at 4.17 min.)
and 0.6 ppm of DNB (internal standard; peak at 7.40 min.). .............................. 18 Figure 2-2 Chromatogram of a solution containing 0.1 ppm of TNT (peak at 7.85 min.)
and 1.4 ppm of DNB (internal standard; peak at 5.35 min.). .............................. 19 Figure 2-3 Chromatogram of a solution containing 0.4 ppm PETN (peak at 6.43 min.)
and 0.8 ppm DNN (internal standard; peak at 9.84 min.). The peak at approximately 2.7 minute is a system peak (see section 2.2.5)........................... 20
Figure 2-4 Analytical regression curve for RDX in the range of 0.04 – 4.2 ppm (Set 1). The dotted lines represent the upper and lower limits of the prediction band for a 95% confidence interval.............................................................................. 22
Figure 2-5 Analytical regression curve for RDX in the range of 0.04 – 2 ppm (Set 2). The dotted lines represent the upper and lower limits of the prediction band for a 95% confidence interval.............................................................................. 23
Figure 2-6 Analytical regression curve for TNT in the range of 0.2 – 6 ppm (Set 1). The dotted lines represent the upper and lower limits of the prediction band for a 95% confidence interval. ..................................................................................... 24
Figure 2-7 Analytical regression curve for TNT in the range of 0.02 – 2 ppm (Set 2). The dotted lines represent the upper and lower limits of the prediction band for a 95% confidence interval. ..................................................................................... 25
Figure 2-8 Analytical regression curve for PETN in the range of 0.12 – 6 ppm (Set 1). The dotted lines represent the upper and lower limits of the prediction band for a 95% confidence interval.............................................................................. 26
Figure 2-9 Analytical regression curve for PETN in the range of 0.1 – 2 ppm (Set 2). The dotted lines represent the upper and lower limits of the prediction band for a 95% confidence interval. ..................................................................................... 27
xvi
Figure 2-10 UV-visible absorption spectra of a mixture between 1 mL of titanium (IV) oxysulfate – sulfuric acid solution (reagent) and 1.5 mL of sample solution (acid pre-treatment, where applied, was with 0.5 mL 50% H2SO4 for 2 minutes before adding the reagent): a) 150 ppm H2O2 (positive control): b) 10 ppm TATP: c) 10 ppm TATP without acid pre-treatment; and d) reagent blank. ................................................................................................................... 32
Figure 2-11 UV-visible absorption spectra of a mixture between 1 mL of ferrous thiocyanate solution (reagent) and 1.5 mL of an aqueous solution containing 10 ppm TATP (following a 2-minute pretreatment with 0.5 mL of the acid solution): a) pretreatment with 50% sulfuric acid; c) no acid pretreatment. A solution of 1 ppm hydrogen peroxide was used as a positive control (Spectrum b) and a reagent blank is shown as spectrum d.................................. 34
Figure 2-12 UV-visible absorption spectra of a mixture between 1 mL of ferrous thiocyanate solution (reagent) and 1.5 mL of an aqueous solution containing 10 ppm TATP (following a 2-minute pretreatment with 0.5 mL of the relevant acid solution): a) pretreatment with 50% sulfuric acid; b) pretreatment with 1:1 of glacial acid and 50% sulfuric acid; c) pretreatment with conc. HCl; and d) pretreatment with 6M HCl ............................................. 35
Figure 2-13 Effect of sulfuric acid concentration (in the TATP decomposition step) on the absorbance of the treated test solution: a) 50% v/v; b) 30% v/v; and c) 10% v/v................................................................................................................ 37
Figure 2-14 Effect of the volume of acid solution used in the pretreatment step on the absorbance of the treated test solution: a) 0.5 mL; b) 1 mL; and c) 2 mL. ......... 38
Figure 2-15 Effect of reaction time in the acid pretreatment step on the final absorbance of the treated test solution: a) 1 minute; b) 2 minutes; and c) 5 minutes. ........... 39
Figure 2-16 Absorbance of reagent blank measured at 465 nm every 10 seconds. ................. 40 Figure 2-17 Effect of organic solvent on the background absorbance of the reagent
blank: a) reagent blank without organic solvent at time zero; b) with acetonitrile; c) with acetone; d) with methanol; and e) blank without organic solvent at 10 minutes. .......................................................................................... 41
Figure 2-18 Analytical curve for TATP test solutions in the range of 0 – 16 ppm. The dotted lines represent the upper and lower limits of the prediction band for a 95% confidence interval. ..................................................................................... 43
Figure 2-19 Electropherogram of a solution containing 2 ppm of chlorate (peak at 4.05 min.) and 6 ppm of sulfate (internal standard; peak at 3.82 min.) ...................... 46
xvii
Figure 2-20 Electropherogram of a solution containing 2 ppm of nitrate (peak at 3.58 min.) and 15 ppm of thiocyanate (internal standard; peak at 3.81 min.)............. 46
Figure 2-21 Analytical regression curve for chlorate in the range of 1 – 29 ppm (Set 1). The dotted lines represent the upper and lower limits of the prediction band for a 95% confidence interval.............................................................................. 48
Figure 2-22 Analytical regression curve for chlorate in the range of 1 – 6 ppm (Set 2). The dotted lines represent the upper and lower limits of the prediction band for a 95% confidence interval.............................................................................. 49
Figure 2-23 Analytical regression curve for nitrate in the range of 5 – 40 ppm (Set 1). The dotted lines represent the upper and lower limits of the prediction band for a 95% confidence interval.............................................................................. 50
Figure 2-24 Analytical regression curve for nitrate in the range of 1 – 20 ppm (Set 2). The dotted lines represent the upper and lower limits of the prediction band for a 95% confidence interval.............................................................................. 51
Figure 3-1 Infrared spectrum of a fibre taken from the Kendall Webcol™ alcohol wipe (top spectrum) compared with the best match spectrum from the library (regenerated cellulose; bottom spectrum). .......................................................... 60
Figure 3-2 Infrared spectrum of a fibre taken from the Mini Liv-wipe alcohol swab (top spectrum) compared with the best match spectrum from the library (polyester; bottom spectrum)............................................................................... 61
Figure 3-3 Infrared spectrum of a fibre taken from the cotton applicator (top spectrum) compared with that from a known cotton fibre (bottom spectrum)..................... 62
Figure 3-4 Infrared spectrum of a fibre taken from the ITW Texwipe® Alpha® swab (top spectrum) compared with the best match library spectrum (polyester; bottom spectrum)................................................................................................. 63
Figure 3-5 Recovery (in percentage) of four organic explosives from the selected wipes and swabs using three organic extraction solvents. The error bars were calculated from the standard deviation (1 SD) of the three replicate samples per experiment. .................................................................................................... 66
Figure 3-6 Collection efficiency for the recovery of PETN, TNT and RDX from two testing surfaces (glass and plastic) using cotton swabs with three different organic solvents. The error bars were calculated from the standard deviation (1 SD) of the three replicate samples per experiment. ........................................ 70
xviii
Figure 3-7 Collection efficiency for the recovery of PETN, TNT and RDX from two testing surfaces (glass and plastic) using polyester swabs with three different organic solvents. The error bars were calculated from the standard deviation (1 SD) of the three replicate samples per experiment. ........................ 71
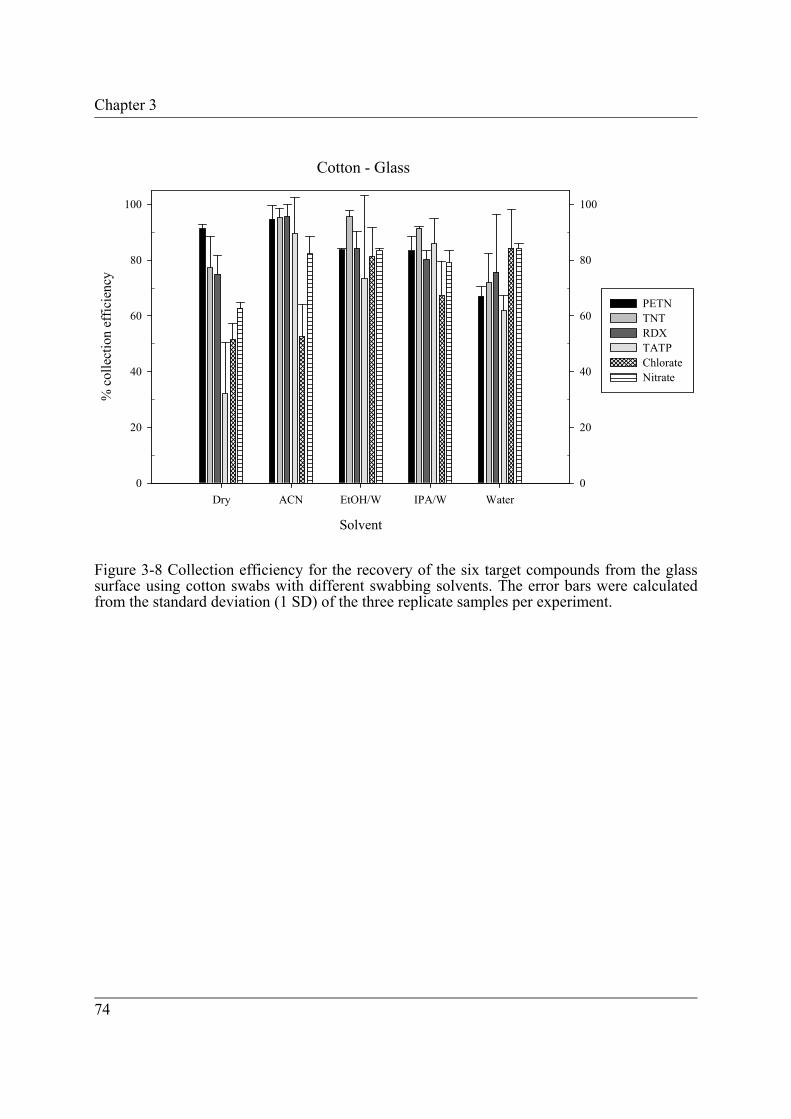
Figure 3-8 Collection efficiency for the recovery of the six target compounds from the glass surface using cotton swabs with different swabbing solvents. The error bars were calculated from the standard deviation (1 SD) of the three replicate samples per experiment. ....................................................................... 74
Figure 3-9 Collection efficiency for the recovery of the six target compounds from the plastic surface using cotton swabs with different swabbing solvents. The error bars were calculated from the standard deviation (1 SD) of the three replicate samples per experiment. The asterisk indicates where the amount of the target compound in the final solution was found to be lower than the limit of quantification of the analytical method employed. ................................ 75
Figure 3-10 Collection efficiency in the recovery of the six target compounds from the glass surface using polyester swabs with different swabbing solvents. The error bars were calculated from the standard deviation (1 SD) of the three replicate samples for each experiment. ............................................................... 77
Figure 3-11 Collection efficiency for the recovery of the six target compounds from the plastic surface using polyester swabs with different swabbing solvents. The error bars were calculated from the standard deviation (1 SD) of the three replicate samples per experiment. ....................................................................... 78
Figure 3-12 Collection efficiency in the recovery of the six target compounds from glass surface using direct solvent washing and sampling by selected wipes and swabs with different swabbing solvents. The error bars were calculated from the standard deviation (1 SD) of the three replicate samples per experiment. .......................................................................................................... 81
Figure 3-13 Collection efficiency for the recovery of the six target compounds from aluminium foil sheets using direct solvent washing and sampling by selected wipes and swabs with different swabbing solvents. The error bars were calculated from the standard deviation (1 SD) of the three replicate samples per experiment. ...................................................................................... 82
xix
Figure 3-14 Collection efficiency for the recovery of the six target compounds from plastic sheets using direct solvent washing and sampling by selected wipes and swabs with different swabbing solvents. The error bars were calculated from the standard deviation (1 SD) of the three replicate samples per experiment. .......................................................................................................... 83
Figure 3-15 Collection efficiency in the recovery of the six target compounds from laminate sheets using direct solvent washing and sampling by selected wipes and swabs with different swabbing solvents. The error bars were calculated from the standard deviation (1 SD) of the three replicate samples per experiment. .................................................................................................... 84
Figure 4-1 Extraction profiles for PETN from selected wipes and swabs using a mixture of acetone and water at various compositions. The error bars represent the standard deviation (1 SD) of three replicate samples per experiment................. 90
Figure 4-2 Extraction profiles for PETN from selected wipes and swabs using a mixture of acetonitrile and water at various compositions. The error bars represent the standard deviation (1 SD) of three replicate samples per experiment. .......... 91
Figure 4-3 Extraction profiles for PETN from selected wipes and swabs using a mixture of methanol and water at various compositions. The error bars represent the standard deviation (1 SD) of three replicate samples per experiment................. 92
Figure 4-4 Extraction profiles for TNT from selected wipes and swabs using a mixture of acetone and water at various compositions. The error bars represent the standard deviation (1 SD) of three replicate samples per experiment. For the 80 and 100 % acetone recoveries from regenerated cellulose wipes, the error bars represent the standard deviation (1 SD) from six and nine replicate samples, respectively. ........................................................................... 94
Figure 4-5 Extraction profiles for TNT from selected wipes and swabs using a mixture of acetonitrile and water at various compositions. The error bars represent the standard deviation (1 SD) of three replicate samples per experiment................. 95
Figure 4-6 Extraction profiles for TNT from selected wipes and swabs using a mixture of methanol and water at various compositions. The error bars represent the standard deviation (1 SD) of three replicate samples per experiment................. 96
Figure 4-7 Extraction profiles for RDX from selected wipes and swabs using a mixture of acetone and water at various compositions. The error bars represent the standard deviation (1 SD) of three replicate samples per experiment................. 97
xx
Figure 4-8 Extraction profiles for RDX from selected wipes and swabs using a mixture of acetonitrile and water at various compositions. The error bars represent the standard deviation (1 SD) of three replicate samples per experiment. .......... 98
Figure 4-9 Extraction profiles for RDX from selected wipes and swabs using a mixture of methanol and water at various compositions. The error bars represent the standard deviation (1 SD) of three replicate samples per experiment................ 99
Figure 4-10 Extraction profiles for TATP from selected wipes and swabs using a mixture of acetone and water at various compositions. The error bars represent the standard deviation (1 SD) of three replicate samples per experiment............... 100
Figure 4-11 Extraction profiles for TATP from selected wipes and swabs using a mixture of acetonitrile and water at various compositions. The error bars represent the standard deviation (1 SD) of three replicate samples per experiment. ........ 101
Figure 4-12 Extraction profiles for TATP from selected wipes and swabs using a mixture of methanol and water at various compositions. The error bars represent the standard deviation (1 SD) of three replicate samples per experiment............... 102
Figure 4-13 Extraction profile for chlorate from polyester wipes using various compositions of water and organic solvents (acetone, acetonitrile or methanol). The error bars represent the standard deviation (1 SD) of three replicate samples per experiment. ..................................................................... 103
Figure 4-14 Extraction profiles for nitrate from polyester wipes using various compositions of water and organic solvents (acetone, acetonitrile or methanol). The error bars represent the standard deviation (1 SD) of three replicate samples per experiment. ..................................................................... 104
Figure 4-15 Chemical structure of selected sorbents. ............................................................ 109 Figure 4-16 Breakthrough profile of PETN on the selected SPE sorbents. The error bars
represent the standard deviation (1 SD) of three replicate samples per experiment. ........................................................................................................ 113
Figure 4-17 Breakthrough profile of TNT on the selected SPE sorbents. The error bars represent the standard deviation (1 SD) of three replicate samples per experiment. ........................................................................................................ 114
Figure 4-18 Breakthrough profile of RDX on the selected SPE sorbents. The error bars represent the standard deviation (1SD) of three replicate samples per experiement. ...................................................................................................... 115
xxi
Figure 4-19 Reconstructed ion chromatogram (using ion 43) of the negative control solution and a solution containing TATP (4 µg starting amount) following the clean-up procedure with the additional sodium sulphate drying step. ........ 126
Figure 4-20 Mass spectrum average across the peak between the retention time of 6.72 to 6.76 minutes (see Figure 4-19) of a solution containing TATP after processing with the proposed SPE procedure (top) compared to the mass spectrum of TATP from the library (below). .................................................... 127
Figure 4-21 Total ion chromatogram of the negative control solution and the solution containing RDX (2 µg starting amount) after being subjected to the clean-up procedure with the additional sodium sulphate drying step. ........................ 128
Figure 4-22 Mass spectrum average across the peak between the retention time of 9.06 to 9.08 minutes (see Figure 4-21) of the solution containing RDX after processing with the proposed SPE procedure (top) compared to the mass spectrum of RDX from the library (below)....................................................... 129
Figure 5-1 Liquid chromatogram of a solution containing 0.2 ppm of TNT (peak at 4.32 min.), 2.4 ppm of 2-NT (internal standard; peak at 5.50 min.) and 0.4 ppm of PETN (peak at 6.55 min.). ............................................................................ 135
Figure 5-2 Analytical regression curve for TNT in the range of 0.2 – 3.6 ppm. The dotted lines represent the upper and lower limits of the prediction band for a 95% confidence interval. ........................................................................................... 137
Figure 5-3 Analytical regression curve for PETN in the range of 0.2 – 4 ppm. The dotted lines represent the upper and lower limits of the prediction band for a 95% confidence interval. ........................................................................................... 138
Figure 5-4 An electropherogram of a solution made up from an effluent collected after loading the methanol/water extract from a polyester wipe onto a Nexus SPE cartridge............................................................................................................. 142
Figure 5-5 A liquid chromatogram of a solution made up from an effluent collected after the acetonitrile elution of a Nexus cartridge at the end of the sampling/clean-up protocol. .............................................................................. 143
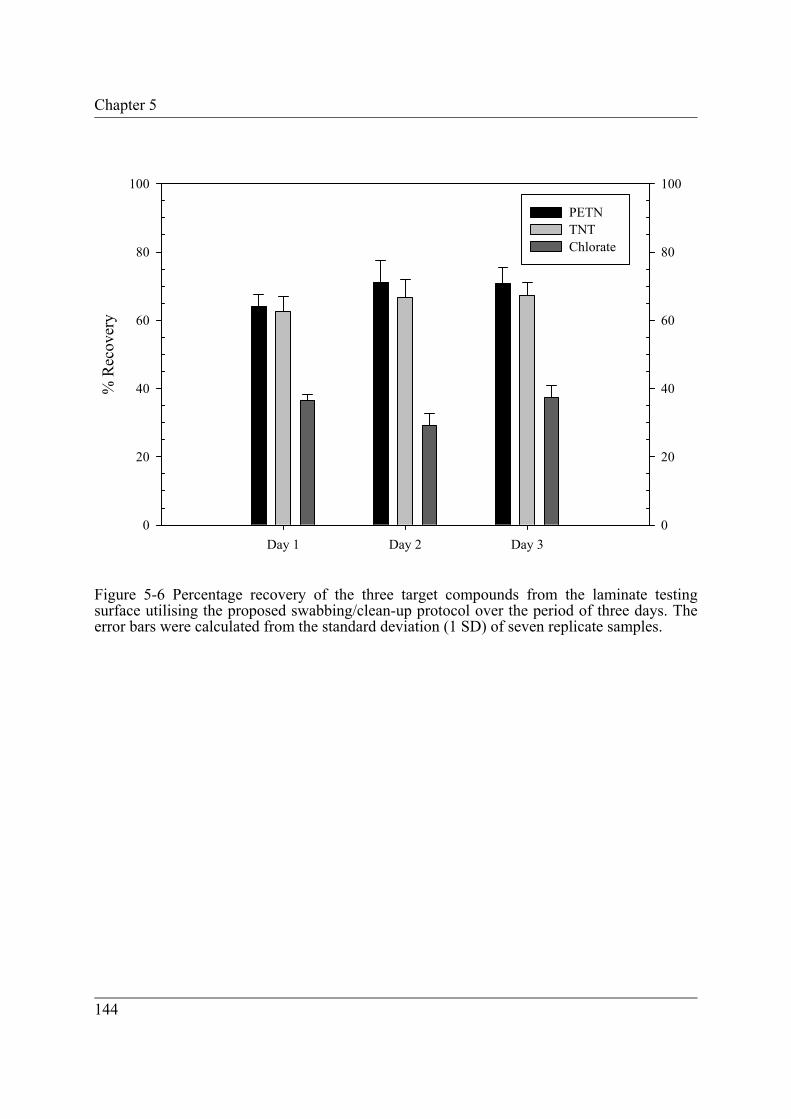
Figure 5-6 Percentage recovery of the three target compounds from the laminate testing surface utilising the proposed swabbing/clean-up protocol over the period of three days. The error bars were calculated from the standard deviation (1 SD) of seven replicate samples.......................................................................... 144
xxii
Figure 5-7 Percentage recovery of the three target compounds, comparing results from the original protocol with those from the modified protocol with an extra step of flushing with deionised water when collecting the effluent for inorganic analysis. The error bars were calculated from the standard deviation (1 SD) of three replicate samples. ..................................................... 145
Figure 5-8 Total ion chromatogram of the solution made up from the effluent after acetonitrile elution from the SPE cartridge coupled with the removal of water using a drying tube containing anhydrous sodium sulphate.................... 147
Figure 5-9 Extracted ion chromatogram of the same solution as depicted in Figure 5-8, using ion 46 (top) for the detection of PETN and ion 210 (below) for the detection of TNT. .............................................................................................. 148
Figure 5-10 Mass spectrum average across the peak between the retention times of 7.39 to 7.43 minutes from the same solution as depicted in Figure 5-8 (top) compared to the mass spectrum of TNT from the library (below).................... 149
Figure 5-11 Mass spectrum average across the peak between the retention times of 8.33 to 8.38 minutes of the same solution as depicted in Figure 5-8 (top) compared to the mass spectrum of a 2 ppm standard solution of PETN analysed under the same instrumental conditions (below)................................ 149
Figure 5-12 Flow chart of the final optimised sampling and clean-up protocol. ................... 150 Figure 6-1 Recovery of PETN spiked in an extract from a blank polyester wipe and
stored at room temperature (top), in the refrigerator (bottom left), and in the freezer (bottom right), measured over a period of 30 days. The error bars represent the standard deviation (1 SD) of three replicate samples per experiment. (The dotted line in the graph for the refrigerator storage indicates where a change in temperature occurred during the course of the experiment.)....................................................................................................... 161
Figure 6-2 Chromatograms of the extracts from polyester wipes stored in the freezer and collected on the thirtieth day of the experiment. a) extract spiked with PETN and prepared on the that day of analysis (i.e. positive control); b) negative control stored in the freezer over a period of 30 days; and c) extract spiked with PETN and stored in the freezer over a period of 30 days. . 162
xxiii
Figure 6-3 Recovery of PETN spiked on polyester wipes and stored at room temperature (top), in the refrigerator (bottom left), and in the freezer (bottom right), measured over a period of 30 days. The error bars represent the standard deviation (1 SD) of three replicate samples per experiment. (The dotted line in the graph for the refrigerator storage indicates where a change in temperature occurred during the course of the experiment.)............................. 163
Figure 6-4 Recovery of PETN deposited on glass slides inserted in a slide mailer, packaged within a heat-sealed nylon bag stored at room temperature and in the refrigerator, measured over a period of 30 days. The error bars represent the standard deviation (1 SD) of three replicate samples per experiment. (The dotted line in the graph for the refrigerator storage indicates where a change in temperature occurred during the course of the experiment.) ............ 164
Figure 6-5 Recovery of TNT spiked in extracts from blank polyester wipes stored at room temperature (top), in the refrigerator (bottom left), and in the freezer (bottom right), measured over a period of 30 days. The error bars represent the standard deviation (1 SD) of three replicate samples per experiment. (The dotted line in the graph for the refrigerator storage indicates where a change in temperature occurred during the course of the experiment). ............ 165
Figure 6-6 Recovery of TNT spiked on polyester wipes stored at room temperature (top), in the refrigerator (bottom left), and in the freezer (bottom right), measured over a period of 30 days. The error bars represent the standard deviation (1 SD) of three replicate samples per experiment. (The dotted line in the graph for the refrigerator storage indicates where a change in temperature occurred during the course of the experiment.)................................................. 166
Figure 6-7 Chromatograms of the samples extracted from polyester wipes containing TNT (TNT solution deposited on the wipes) collected on the thirtieth day of the experiment: a) stored in a clear vial at room temperature; b) stored in an amber vial at room temperature; and c) stored in the freezer............................ 167
Figure 6-8 Recovery of TNT deposited on glass slides inserted in a slide mailer, packaged within a heat-sealed nylon bag stored at room temperature and in the refrigerator, measured over a period of 30 days. The error bars represent the standard deviation (1 SD) of three replicate samples per experiment. (The dotted line in the graph for the refrigerator storage indicates where a change in temperature occurred during the course of the experiment.) ............ 168
xxiv
Figure 6-9 Chromatograms of TNT samples recovered from glass slides in slide mailers packaged within heat-sealed nylon bags and collected on the fifteenth day of the experiment: a) stored at room temperature; b) stored in the refrigerator; and c) positive control prepared on the day of sample analysis.... 169
Figure 6-10 Recovery of TATP spiked in extracts from blank polyester wipes stored at room temperature (top), in the refrigerator (bottom left), and in the freezer (bottom right), measured over a period of 29 days. The error bars represent the standard deviation (1 SD) of three replicate samples per experiment. (The dotted line in the graph for the refrigerator storage indicates where a change in temperature occurred during the course of the experiment.) ............ 171
Figure 6-11 Recovery of TATP spiked on polyester wipes stored at room temperature (top), in the refrigerator (bottom left), and in the freezer (bottom right), measured over a period of 29 days. The error bars represent the standard deviation (1 SD) of three replicate samples per experiment. (The dotted line in the graph for the refrigerator storage indicates where a change in temperature occurred during the course of the experiment.)............................. 172
Figure 6-12 Recovery of TATP deposited on glass slides inserted in slide mailers packaged within heat-sealed nylon bags stored at room temperature and in the refrigerator, measured over a period of 13 days. The error bars represent the standard deviation (1 SD) of three replicate samples per experiment. ........ 173
Figure 6-13 Recovery of TATP deposited on glass slides inserted in slide mailers packaged within heat-sealed nylon bags stored at various temperatures over a period of 5 days. The error bars represent the standard deviation (1 SD) of three replicate samples per experiment. ............................................................ 174
Figure 6-14 Recovery of RDX spiked in extracts from blank polyester wipes stored at room temperature (top), in the refrigerator (bottom left), and in the freezer (bottom right), measured over a period of 30 days. The error bars represent the standard deviation (1 SD) of three replicate samples per experiment. (The dotted line in the graph for the refrigerator storage indicates where a change in temperature occurred during the course of the experiment.) ............ 175
xxv
Figure 6-15 Recovery of RDX spiked on polyester wipes stored at room temperature (top), in the refrigerator (bottom left), and in the freezer (bottom right), measured over a period of 30 days. The error bars represent the standard deviation (1 SD) of three replicate samples per experiment. (The dotted line in the graph for the refrigerator storage indicates where a change in temperature occurred during the course of the experiment.)............................. 176
Figure 6-16 Recovery of RDX deposited on glass slides inserted in slide mailers packaged within heat-sealed nylon bags stored at room temperature and in the refrigerator, measured over a period of 30 days. The error bars represent the standard deviation (1 SD) of three replicate samples per experiment. (The dotted line in the graph for the refrigerator storage indicates where a change in temperature occurred during the course of the experiment.) ............ 177
Figure 6-17 Recovery of chlorate spiked in extracts from blank polyester wipes stored at room temperature (top), in the refrigerator (bottom left), and in the freezer (bottom right), measured over a period of 30 days. The error bars represent the standard deviation (1 SD) of three replicate samples per experiment. (The dotted line in the graph for the refrigerator storage indicates where a change in temperature occurred during the course of the experiment.) ............ 178
Figure 6-18 Recovery of chlorate spiked on polyester wipes stored at room temperature (top), in the refrigerator (bottom left), and in the freezer (bottom right), measured over a period of 30 days. The error bars represent the standard deviation (1 SD) of three replicate samples per experiment. (The dotted line in the graph for the refrigerator storage indicates where a change in temperature occurred during the course of the experiment.)............................. 179
Figure 6-19 Recovery of chlorate deposited on glass slides inserted in slide mailers packaged within heat-sealed nylon bags stored at room temperature and in the refrigerator, measured over a period of 30 days. The error bars represent the standard deviation (1 SD) of three replicate samples per experiment. (The dotted line in the graph for the refrigerator storage indicates where a change in temperature occurred during the course of the experiment.) ............ 180
xxvi
Figure 6-20 Recovery of nitrate spiked in extracts from blank polyester wipes stored at room temperature (top), in the refrigerator (bottom left), and in the freezer (bottom right), measured over a period of 30 days. The error bars represent the standard deviation (1 SD) of three replicate samples per experiment. (The dotted line in the graph for the refrigerator storage indicates where a change in temperature occurred during the course of the experiment.) ............ 181
Figure 6-21 Recovery of nitrate spiked on polyester wipes stored at room temperature (top), in the refrigerator (bottom left), and in the freezer (bottom right), measured over a period of 30 days. The error bars represent the standard deviation (1 SD) of three replicate samples per experiment. (The dotted line in the graph for the refrigerator storage indicates where a change in temperature occurred during the course of the experiment.)............................. 182
Figure 6-22 Recovery of nitrate deposited on glass slides inserted in slide mailers packaged within heat-sealed nylon bags stored at room temperature and in the refrigerator, measured over a period of 30 days. The error bars represent the standard deviation (1 SD) of three replicate samples per experiment. (The dotted line in the graph for the refrigerator storage indicates where a change in temperature occurred during the course of the experiment.) ............ 183
Figure A2-1 Recovery (in percentage) of the three organic explosives from the regenerated cellulose wipes using six extraction solvents. The error bars were calculated from the standard deviation (1 SD) of the four replicate samples per experiment. .................................................................................... 206
Figure A2-2 Recovery (in percentage) of the three organic explosives from the polyester wipes using six extraction solvents. The error bars were calculated from the standard deviation (1 SD) of the four replicate samples per experiment. ......... 207
Figure A2-3 Recovery (in percentage) of the three organic explosives from the cotton swabs using six extraction solvents. The error bars were calculated from the standard deviation (1 SD) of the four replicate samples per experiment. ......... 207
Figure A2-4 Recovery (in percentage) of the three organic explosives from the polyester swabs using six extraction solvents. The error bars were calculated from the standard deviation (1 SD) of the four replicate samples per experiment. ......... 208
xxvii
LIST OF TABLES
Table 2-1 Chromatographic conditions for the analysis of selected high explosives. ............. 18 Table 2-2 Concentration ranges of solutions used for evaluating the linearity of
chromatographic method for the selected organic high explosives..................... 21 Table 2-3 Example of data from the extraction of a swab containing TATP. ......................... 42 Table 2-4 Concentration ranges of solutions used for evaluating the linearity of
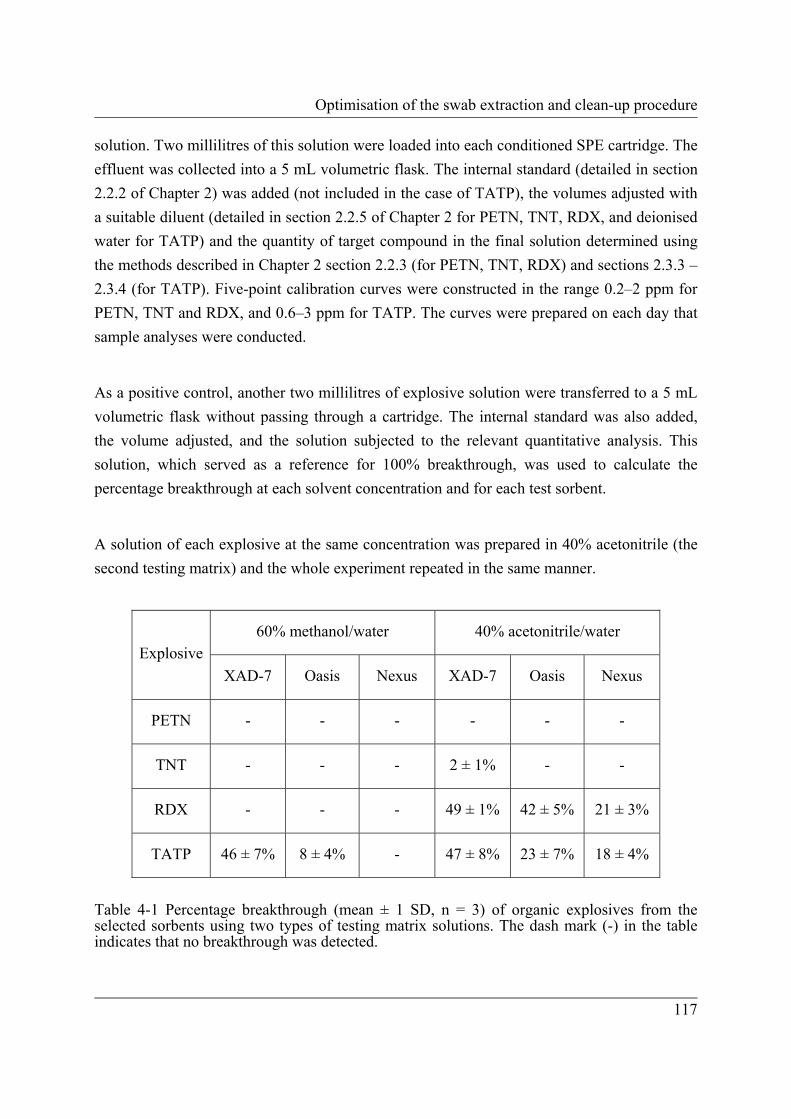
electrophoretic method for the selected inorganic anions. .................................. 47 Table 4-1 Percentage breakthrough (mean ± 1 SD, n = 3) of organic explosives from the
selected sorbents using two types of testing matrix solutions. The dash mark (-) in the table indicates that no breakthrough was detected. ............................ 117
Table 4-2 Cumulative percentages of breakthrough (mean ± 1 SD, n = 3) of organic explosives from the selected sorbents subjected to a series of washings with 60% methanol/water (1 mL per wash). The dash mark (-) in the table indicates that no breakthrough was detected. .................................................... 119
Table 4-3 Percentage of recovery (mean ± 1 SD, n = 3) of each organic explosives from the Nexus cartridge when eluted with each of three testing solvents (500 µL per fraction). The dash mark (-) in the table indicates that no target compound was detected in that fraction. ........................................................... 120
Table 4-4 Percentage recovery of the six target explosives following the proposed clean-up procedure. ..................................................................................................... 125
Table 5-1 Concentration ranges of solutions used for evaluating the linearity of the liquid chromatographic method for the analysis of samples containing TNT and PETN (with each solution also containing 2-NT as an internal standard at a fixed concentration of 2.4 ppm). ....................................................................... 136
Table A2-1 Chromatographic conditions for the analysis of each selected organic explosives .......................................................................................................... 204
Table A3-1 the type of indoor surfaces and the number of wipes collected. ......................... 211 Table A3-2 The type of outdoor surfaces and the number of wipes collected....................... 212
xxviii
xxix
LIST OF ABBREVIATIONS
AN Ammonium nitrate BGE Background electrolyte CE Capillary electrophoresis DFLEX Diffusive flammable liquid extraction device DNB m-Dinitrobenzene DNN 1,3-Dinitronaphthalene DSTL Defence Science and Technology Laboratory, UK EGDN Ethyleneglycol dinitrate FINEX Forensic International Network for Explosives Investigation FT-IR Fourier transform infrared spectroscopy GC-ECD Gas chromatography/electron capture detector GC-MS Gas chromatography/mass spectrometry GC-TEA Gas chromatography/thermal energy analyser detector HMTD Hexamethylene triperoxide diamine HMX High melting explosive or Her Majesty's Explosive (1,3,5,7-tetranitro-1,3,5,7-
tetraazacyclooctane or octahydro-1,3,5,7-tetranitro-1,3,5,7-tetrazocine) HPLC High performance liquid chromatography IC Ion chromatography IMS Ion mobility spectrometry IR Infrared spectroscopy IS Internal standard NATA National Association of Testing Authorities NG Nitroglycerine NMR Nuclear magnetic resonance spectrometry NT Nitrotoluene PETN Pentaerythritol tetranitrate PTFE Poly(tetrafluoroethylene) RCMP Royal Canadian Mounted Police RDX Research Department Explosive or Royal Demolition Explosive (1,3,5-trinitro-
1,3,5-triazacyclohexane or hexahydro-1,3,5-trinitro-1,3,5-triazine) SEM-EDX Scanning electron microscopy/energy dispersive X-ray analysis SFE Supercritical fluid extraction SPE Solid phase extraction
The ongoing misuse of explosives over the last decade, in the taking of life and the destruction of property, has created a considerable demand for improved detection and identification techniques in the forensic arena. Domestic crime involving explosives, and major terrorist incidents such as the Bali bombing in 2002 and the bombing of the London transport system in 2005, have shown a trend towards high-energy improvised explosive compounds and mixtures. A number of compounds of significant concern can be easily prepared from readily available chemical products in routine use. Examples include organic peroxides, e.g. triacetone triperoxide (TATP), and home-made inorganic/organic mixtures such as chlorate/sugar and ammonium nitrate/fuel oil.
Organic peroxides are sensitive compounds that have totally different physical and chemical properties from the commercial and military explosives that were more frequently encountered in the past. Furthermore, a combination of organic and inorganic compounds used to manufacture improvised explosive mixtures render a more complex mixture in both pre- and post-blast residues. These raise questions as to whether current sampling methods that only target either organic or inorganic compounds are still applicable for the recovery of residues generated from these high-energy improvised explosive mixtures. Therefore, it is necessary to revise the standard procedure to ensure that all types of explosives that are currently of threat nationally and internationally can be recovered, detected and identified.
This chapter commences with an introduction to explosive compounds, sample collection and analytical protocols currently utilised by forensic laboratories. This is followed by a discussion of the specific problems/issues with current procedures in light of new and emerging explosives, as well as the objectives and structure of this research.
Chapter 1
2
NO2O2N
NO2
NO2
m-dinitrobenzene 1,3-dinitronaphthalene
1.1 Types of explosives
There are a number of criteria used to categorise explosives. Based on their primary usage, they can be classified into military, commercial and improvised explosives. According to their velocity of explosion, they can be divided into high explosives (reaction occurs at supersonic speed) and low explosives (reaction at less than the speed of sound). High explosives can be further subdivided into primary and secondary explosives, according to their ease of detonation when subjected to a stimulus such as heat, shock or friction. However, in this study, explosives are classified by their chemical structure. The explosives of interest, which are likely to be encountered in contemporary forensic casework, can be divided into the groups described below.
1.1.1 Nitroaromatics
The nitro derivatives of benzene and toluene, usually containing two or three nitro groups (C–NO2), form the majority of this group, e.g. 2,4,6-trinitrotoluene (TNT). Other aromatic compounds that have nitro groups and show some explosive properties, such as dinitro- and trinitronaphthalene, are also included within this category. A high degree of chemical stability means that nitroaromatics have a low sensitivity to friction and impact (i.e. they are secondary high explosives), and they generally have a longer shelf-life than the other groups of explosives.
Figure 1-1 Examples of chemical structures of some nitroaromatics
1.1.2 Nitrate esters
Members of this group of explosives are actually alkyl esters of nitric acid. Because the nitro group in these compounds is connected to the carbon atom via an oxygen atom (–C–O–NO2), they can be susceptible to undergoing hydrolytic decomposition and conversion to alcohol.
Introduction
3
Many nitrate ester explosives, e.g. nitroglycerine (NG) and pentaerythritol tetranitrate (PETN), contain the same number of nitro-ester functional groups as the number of carbon atoms in their molecules. This is why they are among the most powerful explosives. When compared with nitroaromatics, nitrate esters are more sensitive to shock, friction and high temperature.
Figure 1-2 Examples of chemical structures of some nitrate esters
1.1.3 Nitramines
Explosives in this group are comprised of the C–N–NO2 functional group. Examples of compounds in this group are 1,3,5-trinitro-1,3,5-triazacyclohexane (RDX) and 1,3,5,7-tetranitro-1,3,5,7-tetraazacyclooctane (HMX). The degree of chemical stability and sensitivity to impact and friction of nitramines lies between those of nitroaromatics and nitrate esters.
Figure 1-3 Examples of chemical structures of some nitramines
1.1.4 Organic peroxides
For a long period of time, there has been considerable interest in the explosion that can occur by the rupture of a peroxidic bond (–O–O–) in certain organic molecules. Many of these compounds are relatively unstable, volatile and highly sensitive to impact and friction, leading
ONO2
ONO2
O2NO
Nitroglycerine
O2NOO
ONO2
Diethylene glycol dinitrate
N
N N
NO2N NO2
NO2O2N
NH
NH NH2O2N
HMX Nitroguanidine
Chapter 1
4
to no practical application for their legitimate use as an explosive. However, the combination of the ease of preparation from commonly available chemicals, and the devastating effect created by the detonation of these compounds, makes them attractive for use in improvised explosive devices for criminal or terrorist purposes. In Australia, triacetone triperoxide (TATP) has been reported in six criminal incidents between 1980 and 2001 [Oxley & Smith 2006, p. 115]. Hexamethylene triperoxide diamine (HMTD) is another organic peroxide that has been reported and investigated in the areas of detection and analysis during the last decade.
Figure 1-4 Chemical structure of hexamethylene triperoxide diamine
1.1.5 Nitrates, chlorates and perchlorates
Most inorganic salts containing nitrate (NO3-), chlorate (ClO3
-) or perchlorate (ClO4-) anions
are not explosives in themselves. Ammonium nitrate and ammonium perchlorate, however, demonstrate some explosive properties. The compounds in this group are generally used as an oxidant in an explosive mixture (i.e. mixed with a fuel) rather than as a single component to create an explosion.
The characteristic properties of each group mentioned above have been summarised from the four volume comprehensive textbook of Urbański [1964, 1965, 1967, 1984]. Further details concerning their preparation, and the physical and chemical properties of each group of explosives as well as compounds containing other type of functional groups not mentioned but capable of producing an explosion (such as azides and fulminates), can be found in the original textbook and the very informative set of ten volumes of the Encyclopedia of Explosives and related items [Fedoroff et al. 1960, Fedoroff & Sheffield 1962, 1966, 1969, 1972, 1974, 1975, Kaye 1978, 1980, 1983].
N
O O
O
N
O
OO
HMTD
Introduction
5
1.2 Forensic analysis of explosive residues
1.2.1 Types of samples submitted for analysis
Samples submitted to the forensic laboratory for the recovery and analysis of explosive residues can be divided into three categories.
The first group consists of intact bulk explosive samples (i.e. visible to the naked eye). These samples can be recovered from a suspect’s premises or a bomb factory suspected of being related to an actual incident. In this case, the samples are analysed and compared to traces recovered from samples collected from the primary crime scene.
The second group includes items/debris recovered from the scene where an explosion has occurred, i.e. post-blast debris. Detection and identification of trace (i.e. invisible to the naked eye) unconsumed explosives or reaction products on or in the debris collected from the scene can provide crucial information concerning the original composition of the explosive. The identification of the type of explosive can guide the investigation with respect to reconstructing the device and ultimately determining who was responsible for the explosion. In some cases, the result of finding a certain compound (or mixture of compounds) may indicate whether that incident could be related to terrorist activity (e.g. to a particular terrorist group) or not. Items could also be collected from a suspect’s premises/vehicle requiring analysis for trace explosives in order to establish a possible association with explosives activity and, if explosives are detected, whether they are the same type of explosive as that utilised in the incident.
The third type of samples that may submitted for analysis are swabs or other sampling media. The swabs can be collected from surfaces or objects within or associated with a primary scene (i.e. scene where an explosion took place) that are suspected of bearing residues but cannot be relocated to the laboratory for examination. Swabs can also be collected from surfaces/objects at premises or vehicles that may be related to possible suspects. In addition, swabs can also be collected from the suspects themselves, specifically their hands. The result of finding an explosive compound in this type of sample could indicate the possession or handling of explosives and possible involvement with a bombing incident. Sometimes, such samples may help to establish a connection between different cases.
Chapter 1
6
Apart from sampling at the scene, swabs are also collected in the laboratory from the items submitted for analysis, whether they were recovered from the scene of the explosion, such as clothing or the components of an IED, or from premises/vehicles or people suspected of being involved.
1.2.2 Explosive residue analysis protocols
When samples reach the forensic laboratory, standard protocols for the analysis of explosive residues will be applied. These will be slightly different between each laboratory depending on the facilities and the analytical instrumentation available. However, in general, the protocols will follow a similar path which starts at search, recovery, analysis and then identification. In the case of post-blast debris, the analysis of a volatile substance [e.g. explosives such as ethyleneglycol dinitrate (EGDN) or TATP] that might be contained in the exhibit will be carried out first, followed by a visual and microscopic search for explosive particles/crystals. Because the physical examination of debris is a time consuming task, many laboratories also apply a sensitive instrumental technique such as ion mobility spectrometry (IMS) in screening for the presence of explosive materials in the debris. Only the exhibits that generate a positive response will then be subjected to further examination. Particles recovered by microscopic examination will be identified by instrumental techniques such as infrared spectroscopy (IR), X-ray fluorescence (XRF), X-ray diffraction (XRD) and scanning electron microscopy/energy dispersive X-ray analysis (SEM-EDX).
Following the microscopic search, the extraction of debris would be the next step in an attempt to recover any explosive materials from the exhibit. As post-blast debris can consist of a highly contaminated and complex matrices, a clean-up procedure for the extract generally has to be incorporated into the protocol before instrumental analysis to minimise interference from co-extracted compounds.
For samples in the form of sampling devices used to collect traces of explosives either from a post-blast scene or from a contact surface (e.g. swabs or particle filters from vacuum sampling), the recovery of explosive compounds from the devices by extraction (utilising suitable solvent/s) would be the first step to be conducted. This would be followed by an extract clean-up procedure before subjecting the sample to instrumental analysis.
Introduction
7
Examples of protocols for the systematic analysis of explosive residues and details of instrumental techniques available for the identification of trace explosive materials can be found in the excellent review by Beveridge [1992], the textbook by Yinon and Zitrin [1993], and a recent chapter on the investigation of explosions in the publication edited by Freckelton and Selby [2010, Chapter 84].
1.2.3 Specific issues with current sampling protocols
The collection of trace explosive residues by swabbing is usually carried out in two steps with two different solvents, one organic solvent (to capture organic compounds) and the other water (to capture inorganic compounds). In some cases, sampling with a dry swab is also applied in order to maximise the probability of recovering both organic and inorganic residues. This approach not only creates a number of swabs for subsequent analysis in the laboratory but, more importantly, the selection of solvent to moisten the swab and the sequence for conducting the sampling will strongly affect the recovery and final identification of any explosive compounds that may be present in the residue. In most cases, where there is no prior knowledge of the type of explosive used, the current method of two or three separate sampling pathways that separately target the organic or inorganic compounds may pose a problem; certain compounds in the residue may not be recovered and identified as a result of the improper selection of solvent and/or application of the wrong sequence.
Whilst the general development and optimisation of screening tests and analytical methods for explosives has occurred over the past decade, there is still a demand for a sampling protocol specifically developed and optimised for recovering a wide range of explosives, including those traditionally encountered in forensic casework (i.e. commercial and military explosives) and new emerging threat materials such as organic peroxides. A sampling protocol that utilises a combined organic/inorganic swab would be a preferable solution rather than having two or three separate sampling pathways as discussed above. The advantage of recovering both organic and inorganic compounds in a single step would not only be to solve the difficulty of attaining a representative sampling, but it would also reduce the number of samples submitted to the laboratory for further analysis. This would reduce the time spent analysing samples in each case.
In addition to the sampling method, success in the analysis of explosive residues also relies on other elements within the whole procedure. Therefore, it is necessary to re-evaluate and revise
Chapter 1
8
current procedures for swab extraction, clean-up and storage requirements for both swabs and solvent extracts. These procedures need to be compatible with the application of a universal swab for the simultaneous recovery of both organic and inorganic explosives that may be present in the residues.
1.3 Survey on the swabbing protocols for the recovery and analysis of explosive residues
This research focused on the review, evaluation and optimisation of specific phases of the explosive residue analysis process in order to develop a universal swabbing protocol for collecting explosives residues. There is currently no internationally accepted standard protocol for the collection of explosive residues by swabbing. There is also some disagreement in the literature regarding types of swabs, which solvent to employ, and whether or not organic and inorganic residues can be collected with a single swab (discussed in Chapter 3). Similarly, a wide range of different clean-up protocols for swab extracts have been proposed (discussed in Chapter 4). Moreover, the ideal storage conditions for swabs and associated extracts have not been established because there is little information available on the stability of explosives on swabbing materials and in solution. In order to obtain background information for setting up the experiments in this study, a questionnaire was distributed to forensic laboratories that engage in the analysis of explosive residues. The majority of the representatives from laboratories who took part in this survey are members of the Forensic International Network for Explosives Investigation (FINEX). Twenty one responses were received; seven from Australia and New Zealand, two from Canada, eleven from Europe and one from the Middle East. The questions in the survey focused on the materials and solvents used for the swabbing of explosive residues, the method used to extract explosive compounds out of the swab, the container used and the timeframe for storage of swabs and extracts, and the analytical technique used for the identification of compounds in the swab extracts. The full questionnaire used in the survey and the results are shown in Appendix 1.
Introduction
9
1.4 Anticipated outcomes
• The primary aim of this study is to develop an optimised sampling protocol (including the identification of the most suitable swab, solvent, and extraction/clean-up method) that will maximise the potential for recovering, detecting and identifying a broad range of explosives and explosive residues (including more recently encountered improvised explosive compounds such as organic peroxides).
• The study may lead to the development of a new explosive sampling kit that could become a recommended standard in the forensic industry.
• Additional outcomes will include a better understanding of sample breakdown, the maximum period of time that explosive traces can still be detected on various surfaces, and possible recommendations for improved storage to minimise the loss of target compounds. This aspect has become critical due to the emergence of new explosives where such factors are largely unknown. Results of this study may have an impact on laboratory work flow including exhibit management, triage and storage to ensure that any explosives present remain intact for present day analysis and also for potential cold case reviews in future years.
1.5 Structure of this research
For this research, six compounds with the potential to be encountered in casework were selected from each of the aforementioned groups of explosives. These compounds were selected as representative target compounds for the development and optimisation of sampling protocols:
The chemical structures of these compounds are shown in Figure 1-5.
Figure 1-5 Chemical structures of the six representative compounds
In order to evaluate different types of swabbing devices, extraction and clean-up procedures, it is necessary to quantify the chosen target compounds at each step in the process. Therefore, the first phase of this research involved the selection and optimisation of quantitative methods for the analysis of the representative compounds. These methods had to be fully validated to demonstrate that they could provide reliable quantitative information over a concentration range typically encountered in operational casework (i.e. low concentration ranges were deliberately selected as being more realistic of casework situations). The selection and evaluation of quantitative methods for the analysis of the representative explosives are detailed in Chapter 2.
Development of a universal swabbing procedure that would be suitable for the collection of both organic and inorganic explosive residues was the next task. The performance in the collection of the representative explosive compounds on selected types of surfaces using
CH3
O2N
NO2
NO2
TNT
ONO2
O2NO
O2NO
ONO2
PETN
N
N
N
NO2
NO2O2N
RDX
O
O
O
O
O
O
CH3
CH3
CH3CH3
CH3 CH3
TATP
NH4NO3 NaClO3
Introduction
11
commercially available alcohol wipes was evaluated and compared with results obtained from conventional cotton and polyester swabs pre-moistened with various solvents. Results were also compared with those obtained by solvent washing. Chapter 3 covers all details and discussion of this part of the project.
The next element in the development of the universal swabbing protocol was optimising the procedure for swab extraction and clean-up. A number of solid-phase extraction cartridges, both commercially available and prepared in-house, were evaluated and optimised to ensure compatibility with subsequent instrumental analyses. A study to ascertain the best solvent composition that could extract both organic and inorganic residue from the swabs and provide good recovery of all representative compounds at the end of the clean-up procedure was also included. This part of the investigation is discussed in Chapter 4.
After the swabbing and extraction/clean-up procedure had been optimised, the proposed protocol was applied to the recovery and analysis of residues from a representative mixture of organic/inorganic explosives. This was designed to demonstrate the feasibility of the recommended protocol. Results can be found in Chapter 5.
Next, the stability of the representative compounds on the swabbing device and in the swab extracts needed to be assessed in order to establish storage requirements for both swabs and extracts. The use of clear and amber glass vials as storage containers was evaluated, together with storage at three different temperatures (room temperature, in the refrigerator, and in the freezer). Quantitative analyses were undertaken to determine the amount of each representative compound remaining on the swab and in the extracts over various timeframes. Also, with the demand for further research, particularly with respect to the retention of inorganic residues and organic peroxides on substrates, the retention of selected explosives on a glass surface under two different storage conditions (room temperature and in the refrigerator) was incorporated in the study. This was done to provide an estimation of the maximum time over which the explosive material could still be detected and recovered from a stored exhibit. All results and discussion on these aspects are reported in Chapter 6.
Chapter 7 provides a summary of the findings in each part of this research and contains information and recommendations for the application of the final protocol as well as considerations for future research.
Chapter 1
12
1.6 References
Beveridge, A.D. 1992, 'Development in the detection and identification of explosive residues', Forensic Science Review, vol. 4, no. 1, pp. 17-49.
Fedoroff, B.T., Aaronson, H.A., Reese, E.F., Sheffield, O.E. & Clift, G.D. 1960, Encyclopedia of explosives and related items, volume 1, New Jersey, USA: Picatinny Arsenal.
Fedoroff, B.T. & Sheffield, O.E. 1962, Encyclopedia of explosives and related items, volume 2, New Jersey, USA: Picatinny Arsenal.
Fedoroff, B.T. & Sheffield, O.E. 1966, Encyclopedia of explosives and related items, volume 3, New Jersey, USA: Picatinny Arsenal.
Fedoroff, B.T. & Sheffield, O.E. 1969, Encyclopedia of explosives and related items, volume 4, New Jersey, USA: Picatinny Arsenal.
Fedoroff, B.T. & Sheffield, O.E. 1972, Encyclopedia of explosives and related items, volume 5, New Jersey, USA: Picatinny Arsenal.
Fedoroff, B.T. & Sheffield, O.E. 1974, Encyclopedia of explosives and related items, volume 6, New Jersey, USA: Picatinny Arsenal.
Fedoroff, B.T. & Sheffield, O.E. 1975, Encyclopedia of explosives and related items, volume 7, New Jersey, USA: Picatinny Arsenal.
Kaye, S.M. 1978, Encyclopedia of explosives and related items, volume 8, New Jersey, USA: Picatinny Arsenal.
Kaye, S.M. 1980, Encyclopedia of explosives and related items, volume 9, New Jersey, USA: Picatinny Arsenal.
Kaye, S.M. 1983, Encyclopedia of explosives and related items, volume 10, New Jersey, USA: Picatinny Arsenal.
Oxley, J. & Smith, J. 2006, 'Peroxide explosives', in Detection and disposal of improvised explosives, Schubert, H. & Kuznetsov, A., eds. Dordrecht, Netherlands: Springer, pp. 113-121.
Urbański, T. 1964, Chemistry and technology of explosives, volume 1, Oxford: Pergamon press.
Introduction
13
Urbański, T. 1965, Chemistry and technology of explosives, volume 2, Oxford: Pergamon press.
Urbański, T. 1967, Chemistry and technology of explosives, volume 3, Oxford: Pergamon press.
Urbański, T. 1984, Chemistry and technology of explosives, volume 4, Oxford: Pergamon press.
Yinon, J. & Zitrin, S. 1993, Modern methods and applications in analysis of explosives, Chichester: John Wiley & Sons.
14
15
CHAPTER 2 QUANTITATIVE METHODS FOR THE ANALYSIS OF REPRESENTATIVE EXPLOSIVES
2.1 Introduction
During the optimisation of selected parameters of the explosive residue analysis protocol, it is critical to accurately determine the amount of each target compound on the swabbing devices or in the swab extracts. In order to achieve this, the selected analytical techniques have to provide a reliable quantitative determination. This chapter details the development and validation of a quantitative method for the analysis of each explosive of interest. All conventional organic high explosives (i.e. RDX, TNT and PETN) were analysed utilising reversed phase high performance liquid chromatography (HPLC). The organic peroxide, triacetone triperoxide (TATP), was converted to hydrogen peroxide by acid catalysed degradation and subsequently quantified by colorimetry with iron(II) thiocyanate as a reagent. The quantitative analyses of both selected inorganic anions (i.e. nitrate and chlorate) were carried out using capillary electrophoresis (CE). Sample preparation details are not addressed in this chapter but they can be found in other relevant chapters (Chapters 3–6) of this thesis.
2.2 Quantitative method for the analysis of RDX, TNT and PETN
2.2.1 Method selection and optimisation
With the combination of the high resolution of a capillary column and the high sensitivity of a mass spectrometer, gas chromatography-mass spectrometry (GC-MS) has become a common instrumental technique for the identification of explosives in most forensic laboratories worldwide. Therefore, GC-MS was chosen as the first technique to be evaluated. A set of
Chapter 2
16
solutions of RDX, TNT and PETN were prepared by dilution of the certified explosive standards (detailed in section 2.2.2) in ethyl acetate, covering the range 2 – 15 ppm. The analytical parameters of the Perkin Elmer Autosystem XL gas chromatograph and TurboMass Upgrade mass spectrometer were optimised and the established quantitative method applied in both full-scan and selected ion monitoring (SIM) modes using musk tibertine as an internal standard. It was found that the relationship between the instrumental response and the concentration of each target compound was non-linear. This resulted from the considerable difference in the mass between the chosen target ion from explosive compounds and the ion from the internal standard. Also, there were no other suitable ions to be chosen as a target ion for quantitative analysis. In addition, and more importantly, a high variation was observed in the signal for the same set of calibration solutions analysed at the beginning and at the end of the same sequence (especially in the case of PETN at low concentrations). This was possibly due to the configuration of the instrument in that a sample can experience high temperatures in the sample carousel while waiting for analysis (as the carousel on this instrument is located directly on top of the oven). As a consequence of these observations, GC-MS was determined to be unsuitable as a quantitative method for this study.
High performance liquid chromatography (HPLC) was the next technique considered. There are no high temperature compartments, such as the injection port in a GC-MS, and no requirement of high temperature for the separation, which makes the technique more compatible given the inherent thermal instability of explosives. Initially, there was an attempt to develop a method that was able to analyse RDX, TNT and PETN using the same chromatographic conditions by optimising the composition of the mobile phase and the column temperature; however, it was difficult to obtain a good separation of all three explosives while ensuring that the analysis time was not too long. A gradient elution was not an option as it would generate a higher background in the analysis of PETN, which required low-wavelength detection. Consequently, a separate method for each explosive was developed and the analyses were carried out under different chromatographic conditions. The criteria for development of the final method for each explosive included the sensitivity of detection for each target compounds, the analysis time, and the possibility of applying the same internal standard. The full details of the final chromatographic conditions for each organic explosive are provided in Table 2.1.
Quantitative Methods for the Analysis of Representative Explosives
17
2.2.2 Chemicals
Hexahydro-1,3,5-trinitro-1,3,5-triazine (RDX), 2,4,6-trinitrotoluene (TNT), and pentaerythritol tetranitrate (PETN) at a certified concentration of 1000 μg/mL in acetonitrile and m-dinitrobenzene (99.5% certified purity) were obtained from ChemService, Inc. (West Chester, PA, USA). m-Dinitrobenzene was prepared as a 1000 ppm stock solution in LiChroSolv® acetonitrile (gradient grade for liquid chromatography supplied by Merck Pty. Ltd.,Kilsyth, VIC, Australia) and then a pre-determined volume was added into the working solution as an internal standard in the quantitative analysis of RDX and TNT. 1,3-Dinitronaphthalene (97% purity) was purchased from Sigma-Aldrich Pty. Ltd. (Castle Hill, NSW, Australia) for use as an internal standard in the quantitative analysis of PETN. 1,3-Dinitronaphthalene was also prepared as a stock solution at a concentration of 1000 ppm in acetonitrile. Supragradient HPLC grade methanol (Scharlau) was purchased from Chem-Supply (Gillman, SA, Australia). High purity water was obtained from a Satorius arium 611 water purification system. Both methanol and water were filtered under vacuum through a 47 mm nylon filter membrane with a pore size 0.45 μm (supplied by Grace Davison Discovery Sciences, Rowville, VIC, Australia) prior to use.
2.2.3 Instrumentation
The analyses were performed on an Agilent 1120 high performance liquid chromatography system comprising a quaternary pump, vacuum degasser, standard autosampler, thermostatted column compartment and a diode array detector. Instrumental control, data acquisition and analysis were accomplished using EZChrom Elite™ Chromatography Data System software version 3.3.2.
Methanol/water was chosen as the mobile phase for chromatographic analysis due to a worldwide shortage of acetonitrile at the time of performing this research. An isocratic run at a flow rate of 1 mL/min on a 4.6 × 150 mm Zorbax Eclipse XDB-C18 analytical column with particle size of 5 μm was applied for each separation of all three high explosives. The full conditions for the analysis of each explosive are provided in Table 2.1.
Chapter 2
18
Minutes0 1 2 3 4 5 6 7 8 9 10
mA
U
-0.5
0.0
0.5
1.0
1.5
2.0
2.5
3.0
3.5
4.0
4.5
5.0
5.5
6.0
mA
U
-0.5
0.0
0.5
1.0
1.5
2.0
2.5
3.0
3.5
4.0
4.5
5.0
5.5
6.0
4.17
3
7.40
0DAD: Signal A, 250 nm/Bw:10 nm Ref 360 nm/Bw:100 nm
Retention Time
RDX
DNB (IS)
Parameters RDX
Analysis TNT
Analysis PETN
Analysis Injection volume (μl) 10 10 10 Percentage of methanol in mobile phase 45 50 60 Separation Temperature (ºC) 25 30 30
Table 2-1 Chromatographic conditions for the analysis of selected high explosives.
2.2.4 Results
Examples of chromatograms obtained utilising the procedure outlined are shown in Figures 2-1 to 2-3.
Figure 2-1 Chromatogram of a solution containing 0.1 ppm of RDX (peak at 4.17 min.) and 0.6 ppm of DNB (internal standard; peak at 7.40 min.).
Quantitative Methods for the Analysis of Representative Explosives
19
Minutes0 1 2 3 4 5 6 7 8 9 10
mA
U
0
1
2
3
4
5
6
7
8
9
10
11
mA
U
0
1
2
3
4
5
6
7
8
9
10
11
5.35
3
7.84
7
DAD: Signal A, 250 nm/Bw:10 nm Ref 360 nm/Bw:100 nmRetention Time
TNT
DNB (IS)
Figure 2-2 Chromatogram of a solution containing 0.1 ppm of TNT (peak at 7.85 min.) and 1.4 ppm of DNB (internal standard; peak at 5.35 min.).
Chapter 2
20
Minutes0 1 2 3 4 5 6 7 8 9 10 11 12
mA
U
-3.0
-2.5
-2.0
-1.5
-1.0
-0.5
0.0
0.5
1.0
1.5
2.0
2.5
3.0
3.5
4.0
mA
U
-3.0
-2.5
-2.0
-1.5
-1.0
-0.5
0.0
0.5
1.0
1.5
2.0
2.5
3.0
3.5
4.0
6.42
7
9.84
0
DAD: Signal A, 212 nm/Bw:4 nm Ref 300 nm/Bw:100 nmRetention Time
PETN
DNN (IS)
Figure 2-3 Chromatogram of a solution containing 0.4 ppm PETN (peak at 6.43 min.) and 0.8 ppm DNN (internal standard; peak at 9.84 min.). The peak at approximately 2.7 minute is a system peak (see section 2.2.5).
2.2.5 Linearity of the method
To verify the linear relationship between the instrumental response (the peak area ratio) and the amount of explosives in the final solution of the swab extract, calibration curves were constructed. The following methanol and water mixtures were utilised to generate the required dilutions of the explosives: a 1:1 mixture of methanol and water for the analysis of TNT and PETN; and a 1:2 mixture of methanol and water for the analysis of RDX. Different compositions of diluents were utilised to ensure that the strength of the working solution was not higher than that of the mobile phase as this can cause a distortion in the peak shape. This was also conducted in order to minimise the size of the system peak (which can be seen in Figure 2.3 at a retention time of around 2.7 minutes), which correlated with the amount of methanol in the diluents.
Quantitative Methods for the Analysis of Representative Explosives
21
Two sets of solutions were prepared to evaluate the linearity covering the range of concentrations of explosives evaluated in this thesis. These ranges were selected to ensure that concentrations likely to be encountered in forensic casework were covered. Each working solution was analysed in duplicate (triplicate in the case of PETN) and in a random order following the guidelines outlined in NATA Technical Note 17 [2009] . The compositions of the final working solutions are detailed in Table 2.2.
Explosives
Concentration of internal standard in final solution (ppm)
Concentration of explosives in final standard solution (ppm)
RDX Set 1: 2 Set 2: 0.6
Set 1: 0.04, 0.1, 0.2, 1.0, 1.8, 2.6, 3.4 and 4.2 Set 2: 0.04, 0.1, 0.2, 0.4, 0.8, 1.2, 1.6 and 2.0
TNT Set 1: 3 Set 2: 1.4
Set 1: 0.2, 0.4, 1.2, 2.0, 2.8, 3.6, 4.4, 5.2 and 6.0 Set 2: 0.02, 0.04, 0.1, 0.2, 0.4, 0.8, 1.2, 1.6 and 2.0
PETN Set 1: 1.5 Set 2: 0.8
Set 1: 0.12, 0.16, 0.2, 0.4, 1.2, 2, 2.8, 3.6, 4.4, 5.2 and 6.0
Set 2: 0.1, 0.12, 0.16, 0.2, 0.4, 0.8, 1.2, 1.6 and 2.0 Table 2-2 Concentration ranges of solutions used for evaluating the linearity of chromatographic method for the selected organic high explosives.
To ascertain whether the analytical curve would fit a linear model, scatter plots were constructed and linear regression calculations applied. Residual plots were examined and the significance of addition of a polynomial term to the equation also tested along with the determination of a 95% confidence interval for the coefficient of that polynomial term [Kleinbaum et al. 1998, p.285, 289]. All regressions were carried out using SigmaPlot software version 10.0. The resulting analytical curves for the selected high explosives are shown in Figures 2-4 to 2-9.
The relationship between the instrument response and all selected concentration ranges was determined to be linear. The standard error of the regression (sy/x), ranging from 0.007 to 0.018, was considerably low. The results from the partial F test indicated that adding the polynomial term to the model equation did not significantly improve the prediction. In addition, the coefficient for the polynomial term was found to include a zero value within the
Chapter 2
22
RDX Set 1
Concentration (ppm)
0.0 1.0 2.0 3.0 4.0
Peak
are
a ra
tio
0.0
0.2
0.4
0.6
0.8
R2 = 0.9995 sy/x = 0.0068
95% confidence interval, which means that the polynomial term could be cancelled out of the equation. Only the regression curve for RDX Set 1 did not pass the test and the coefficient did not include a zero. However, considering the very low sy/x (0.0068) and the very high R2 term (0.9995) when fitting with a linear model, and the minimal improvement when fitting against a quadratic model (sy/x = 0.0041, R2 = 0.9998), the linear model was chosen because of its simplicity for further calculations.
Figure 2-4 Analytical regression curve for RDX in the range of 0.04 – 4.2 ppm (Set 1). The dotted lines represent the upper and lower limits of the prediction band for a 95% confidence interval.
Quantitative Methods for the Analysis of Representative Explosives
23
RDX Set 2
Concentration (ppm)
0.0 0.5 1.0 1.5 2.0
Peak
are
a ra
tio
0.0
0.2
0.4
0.6
0.8
1.0
1.2
1.4
R2 = 0.9991 sy/x = 0.0151
Figure 2-5 Analytical regression curve for RDX in the range of 0.04 – 2 ppm (Set 2). The dotted lines represent the upper and lower limits of the prediction band for a 95% confidence interval.
Chapter 2
24
TNT Set 1
Concentration (ppm)
0.0 1.0 2.0 3.0 4.0 5.0 6.0
Peak
are
a ra
tio
0.0
0.2
0.4
0.6
0.8
1.0
1.2
R2 = 0.9984 sy/x = 0.0177
Figure 2-6 Analytical regression curve for TNT in the range of 0.2 – 6 ppm (Set 1). The dotted lines represent the upper and lower limits of the prediction band for a 95% confidence interval.
Quantitative Methods for the Analysis of Representative Explosives
25
TNT Set 2
Concentration (ppm)
0.0 0.5 1.0 1.5 2.0
Peak
are
a ra
tio
0.0
0.2
0.4
0.6
0.8
1.0
R2 = 0.9991 sy/x = 0.0111
Figure 2-7 Analytical regression curve for TNT in the range of 0.02 – 2 ppm (Set 2). The dotted lines represent the upper and lower limits of the prediction band for a 95% confidence interval.
Chapter 2
26
PETN Set 1
Concentration (ppm)
0.0 1.0 2.0 3.0 4.0 5.0 6.0
Peak
are
a ra
tio
0.0
0.2
0.4
0.6
0.8
1.0
R2 = 0.9976 sy/x = 0.0175
Figure 2-8 Analytical regression curve for PETN in the range of 0.12 – 6 ppm (Set 1). The dotted lines represent the upper and lower limits of the prediction band for a 95% confidence interval.
Quantitative Methods for the Analysis of Representative Explosives
27
PETN Set 2
Concentration (ppm)
0.0 0.5 1.0 1.5 2.0
Peak
are
a ra
tio
0.0
0.2
0.4
0.6
R2 = 0.9958 sy/x = 0.0157
Figure 2-9 Analytical regression curve for PETN in the range of 0.1 – 2 ppm (Set 2). The dotted lines represent the upper and lower limits of the prediction band for a 95% confidence interval.
2.2.6 Conclusions
High performance liquid chromatography proved successful in providing quantitative analyses of all three organic high explosives. The relationship between instrument response (peak area ratio) and the concentration of explosive in testing solution was demonstrated to be linear in the range of 0.04 – 4.2 ppm for RDX, 0.02 – 6.0 ppm for TNT and 0.1 – 6 ppm for PETN.
Chapter 2
28
2.3 Quantitative method for the analysis of triacetone triperoxide (TATP)
2.3.1 Introduction
As a result of an increase in awareness of TATP being used in acts of terrorism, there have been numerous studies dealing with the analysis of this type of explosive published over the last decade. However, most of these studies have focused on the detection and identification of bulk quantities of suspected material. While some methods have been developed that could be used for the quantitative analysis of trace quantities of TATP, this was generally only achievable by using sophisticated equipment not located in all operational forensic laboratories. This section will discuss an investigation to establish a method for the quantification of trace amounts of TATP (1 – 10 ppm range) that could be performed utilising instrumentation commonly found in a forensic laboratory. One requirement was that the technique had to be universal in terms of being effective regardless of the amount of water that may be present in the sample (given that the technique needed to function for swabs taken using water/organic solvent mixtures).
The quantitative analysis of trace amounts of TATP is a challenging task. The lack of a chromophore in the structure yields no significant UV absorption and that means it is unlikely to produce fluorescence. Moreover, this compound does not show an oxidizing power at the same level as hydrogen peroxide and other organic peroxides. For example, an acidified solution of potassium iodide is not oxidized to iodine by TATP. The reaction only occurs when hydrogen iodide-glacial acetic acid is used as a reagent [Milas & Golubović 1959]. At room temperature, TATP does not react with common reducing agents such as iron(II) salts and tin(II) chloride. Even in the presence of a strong reducing agent such as zinc metal or 10% Pd-activated carbon, no reaction is observed [Bellamy 1999, Oxley et al. 2009].
Several analytical methods developed for the analysis of hydrogen peroxide, based on the generation of a fluorogenic molecule, have been investigated for their potential for the analysis of TATP [Germain & Knapp 2008, Malashikhin & Finney 2008]. Nonetheless, TATP was not able to be analysed using these sensitive methods without the aid of acid decomposition or exposure to UV irradiation. Such pre-treatment steps have been mentioned as a requirement for the successful analysis of TATP in several reviews focused on analytical
Quantitative Methods for the Analysis of Representative Explosives
The finding of researchers at Tel-Aviv University, Israel [Sella & Shabat 2008], is one of the few achievements where acid or UV pre-treatment was unnecessary. They synthesized a self-immolative dendrimer that reacted with TATP to release amine molecules that caused a shift in fluorescence spectra. However, two hours of reaction time and a multi-step synthesis of the probe were the major drawbacks with the proposed approach. Recent findings of the reaction of TATP with bromide ion have been applied to establish an electroanalytical method [Xie & Cheng 2010]. A successful quantitative analysis of TATP with a detection limit in the micromolar range could be attained from the determination of unreacted bromide.
The computational study of complexation between certain metal cations and TATP in the gas phase [Dubnikova et al. 2002] is another avenue to consider for developing a direct method for TATP analysis. With the application of this concept, the successful detection of TATP in the gas phase using an indium oxide sensor was recently reported by Zhang and colleagues [Zhang, Zhang & Chen 2010]. Several mass spectrometric studies [Cotte-Rodríguez et al. 2008, Sigman et al. 2008] also indicated that TATP could form adducts with ammonium and sodium ions in the gas phase; however, no publication has been found that investigates the complexation of TATP in solution. If some metal cations could interact with the electron cloud around the TATP ring, the flexibility of the ring might be decreased and lead to the production of fluorescence. In this section of the study, several approaches were explored with the objective of establishing a quantitative method for the analysis of TATP. In accordance with the finding of the computational study by Dubnikova and colleagues [2002], indium and zinc were chosen as they were likely to form a stable complex with TATP. Also, several colorimetric methods for the detection of hydrogen peroxide, in conjunction with the acid-catalysed decomposition of TATP, were tested for their potential use in the analysis of TATP in swab extracts.
2.3.2 Method selection
The first approach was based on the principle that the complexation of TATP with metal cations may generate fluorescence. As excitation by absorption in the UV or visible light region is generally a requirement for producing a fluorescence emission, the absorption spectra of aqueous solutions of the selected metal cations and TATP were initially examined.
Chapter 2
30
A 4 ppm aqueous solution of TATP was prepared by dilution of the certified standard solution detailed in section 2.3.3. The solutions of metal cations at three concentrations (1, 10 and 50 ppm) were used in the preliminary investigation. A solution of indium was prepared by dilution of a 1000 ppm (in 2% HCl) certified standard solution (obtained from Ultra Scientific, N. Kingstown, RI, USA). Zinc chloride (obtained from Merck Pty. Ltd.,Kilsyth, VIC, Australia) was used to prepare a 1000 ppm stock solution of zinc and then a working solution was prepared by dilution from this stock solution. The solutions of either indium or zinc or TATP were colourless, thus there was no absorption in the visible region. TATP has no chromophore, consequently no significant absorption was observed throughout the UV-visible range. When the TATP and metal cation solutions were mixed together (at different mole ratio), it was found that no change in the absorption spectra were observed in every mole ratio testing. To prevent the hydrolysis of indium (which occurs at a pH higher than approximately 3), the testing solution was strongly acidic. However, this acidity may have caused the cleavage of the TATP ring structure, resulting in no significant absorption being observed. Although the test with zinc was conducted in a non-acidic medium, there was no sign of the absorption that could be used as an excitation for fluorescence. Nevertheless, a conclusion cannot be drawn that there was no complexation as the interaction may have been too low to be detectable. Further studies need to be conducted utilising other spectroscopic techniques, such as NMR or Raman, which might provide more information. Due to time constraints and limited access to other spectroscopic instruments, it was decided to discontinue the complexation study as a means of quantifying TATP in solution.
The conversion of TATP to hydrogen peroxide by the action of acid and the subsequent colorimetric determination of the liberated hydrogen peroxide was the next approach to be investigated. 50% aqueous sulfuric acid was chosen to be used as a reagent to decompose TATP according to the suggestion in the work of Itzhaky and Keinan [2004]. Two colorimetric reactions were selected i.e., the reaction between titanium and hydrogen peroxide and the reaction between copper(II) and hydrogen peroxide which generated copper(I) to form a complex with neocuproine.
The development of an orange-yellow colour when mixing hydrogen peroxide and an aqueous solution of titanium in an acid medium was discovered more than a century ago and this characteristic reaction has been utilised and has become a well-known colorimetric method for the determination of either titanium or hydrogen peroxide in various matrices. The method is simple and the use of a commercially available mixture of titanium (IV) oxysulfate –
Quantitative Methods for the Analysis of Representative Explosives
31
sulfuric acid makes this method convenient and with a reduced analysis time. In the past, a lengthy procedure was required for the preparation of the reagent and adjustment of the acidity and the amount of titanium in the testing solution in order to achieve the optimum value for a successful analysis. The simplicity and availability of the reagent was not the main reason for choosing this reaction but more importantly the necessity of a low pH for the analysis should make this method compatible with the decomposition step which also requires an acid to convert TATP to hydrogen peroxide.
As the reagent already contains acid, the analysis of an aqueous solution of TATP was firstly conducted without the acid pre-treatment step. It was found that the concentration of acid in the titanium (IV) oxysulfate – sulfuric acid solution (Fluka, purchased from Sigma-Aldrich Pty. Ltd., Castle Hill, NSW, Australia) was not enough to convert TATP to hydrogen peroxide. The colour difference between the testing solution (10 ppm TATP) and the reagent blank was indistinguishable (spectra c and d, respectively, in Figure 2.10). When a 10 ppm TATP solution had been treated with 50% sulfuric acid before adding the reagent, a very pale yellow colour was developed (Spectrum b in Figure 2.10). (Note that Spectrum a in Figure 2.10 represents a 150 ppm hydrogen peroxide solution that was used as a positive control.) This indicated that the method was not sensitive enough to detect TATP in an aqueous solution within the concentration range of interest.
Chapter 2
32
Figure 2-10 UV-visible absorption spectra of a mixture between 1 mL of titanium (IV) oxysulfate – sulfuric acid solution (reagent) and 1.5 mL of sample solution (acid pre-treatment, where applied, was with 0.5 mL 50% H2SO4 for 2 minutes before adding the reagent): a) 150 ppm H2O2 (positive control): b) 10 ppm TATP: c) 10 ppm TATP without acid pre-treatment; and d) reagent blank.
The complex of neocuproine and copper(I), which is the product from the reduction of copper(II) by hydrogen peroxide [Baga et al. 1988], was the second colorimetric method evaluated. The method is simple and relatively sensitive, with hydrogen peroxide in the micromolar range being readily detected. Preparation of the reagent is also easy and all required chemicals are commercially available. Nevertheless, one prerequisite for a successful analysis is that the pH of the testing solution must be between 5 and 9. As acid pre-treatment was required to convert TATP to hydrogen peroxide, a neutralisation step had to be included in the analysis. This extra step created the difficulty in adjusting the pH of the solution to fall within the required range. The pH of the solution after pre-treatment with 50% sulfuric acid was approximately 1. A strong alkaline solution, 6M sodium hydroxide, was chosen in order to keep the volume of the final solution, after neutralisation, to a minimum. Nonetheless, a
Wavelength (nm)
400 450 500 550 600
Abs
orba
nce
0.0
0.2
0.4
0.6
0.8
1.0
1.2
1.4
a b c d
Quantitative Methods for the Analysis of Representative Explosives
33
small excess of such a highly concentrated base at the end of neutralisation caused the pH of the solution to be too basic, leading to the precipitation of the reagent. There was an attempt using a strong base at a lower concentration to complete the neutralisation, followed by the addition of a phosphate buffer. Although the pH of the final testing solution could be adjusted to be within the desired range, the volume of the final solution was increased to a level that compromised the overall sensitivity of the method. This approach was therefore abandoned. However, during the preparation of this thesis, Eren and colleagues [Eren et al. 2010] published the application of the copper(I)-neocuproine complex for the determination of peroxide-based explosives, but success in the analysis of TATP in solution still required a complicated neutralisation step using a mixture of 4 M NaOH, 0.1 M NaOH and 1 M ammonium acetate.
As observed with the formation of the neocuproine and copper (I) complex, the majority of sensitive colorimetric analytical methods for hydrogen peroxide involve pH adjustment of the sample solution to within a certain range. In order to avoid the problem of incorporating such a neutralisation step, the direction of the study shifted towards finding a quantitative method that could be carried out in an acidic medium.
The reaction between iron(II) and hydrogen peroxide in the presence of thiocyanate ion is one of the most sensitive analytical methods for the detection of hydrogen peroxide and it demands a low pH (approximately 1-2) to stabilise the reaction product. Moreover, not only hydrogen peroxide but also several organic peroxides have been demonstrated to be quantified successfully by this method [Egerton et al. 1954]. This reaction was the third method evaluated, with initial results being particularly promising (Figure 2-11). It was found that the analysis could be carried out immediately after the acid decomposition step. With this benefit and the initial results in mind, the acids previously reported for TATP decomposition (i.e. 1:1 mixture of glacial acid and 50% sulfuric acid; 50% sulfuric acid [Itzhaky & Keinan 2004]; conc. HCl [Laine, Roske & Cheng 2008] and 6M HCl [Munoz et al. 2007]) were re-examined.
Chapter 2
34
Figure 2-11 UV-visible absorption spectra of a mixture between 1 mL of ferrous thiocyanate solution (reagent) and 1.5 mL of an aqueous solution containing 10 ppm TATP (following a 2-minute pretreatment with 0.5 mL of the acid solution): a) pretreatment with 50% sulfuric acid; c) no acid pretreatment. A solution of 1 ppm hydrogen peroxide was used as a positive control (Spectrum b) and a reagent blank is shown as spectrum d.
Wavelength (nm)
300 400 500 600 700
Abs
orba
nce
0.0
0.2
0.4
0.6
0.8
1.0
ab cd
Quantitative Methods for the Analysis of Representative Explosives
35
Figure 2-12 UV-visible absorption spectra of a mixture between 1 mL of ferrous thiocyanate solution (reagent) and 1.5 mL of an aqueous solution containing 10 ppm TATP (following a 2-minute pretreatment with 0.5 mL of the relevant acid solution): a) pretreatment with 50% sulfuric acid; b) pretreatment with 1:1 of glacial acid and 50% sulfuric acid; c) pretreatment with conc. HCl; and d) pretreatment with 6M HCl
As shown in Figure 2-12, there is no significant difference in the conversion of TATP to hydrogen peroxide using each of the evaluated acid pre-treatments. However, sulfuric acid was considered as the reagent to pursue during method development because it generated the lowest background absorption. Details of the optimization of the pre-treatment step and the establishment of an analytical method for TATP quantitation using ferrous thiocyanate are discussed in the following sections (2.3.3 – 2.3.7).
2.3.3 Chemicals
A certified 100 μg/mL solution of TATP in acetonitrile was obtained from AccuStandard (New Haven, CT, USA). Concentrated sulfuric acid (UNIVAR grade) was purchased from Ajax Finechem Pty, Ltd. (Taren Point, NSW, Australia). The colorimetric reagent was
Wavelength (nm)
300 400 500 600 700
Abs
orba
nce
0.0
0.2
0.4
0.6
0.8
1.0
a bcd
Chapter 2
36
prepared by dissolving 3.19 g of potassium thiocyanate (≥ 96% purity, May & Baker, Dagenham, England) and 3.525 g of Ammonium iron(II) sulfate hexahydrate (99% purity, Sigma-Aldrich, Castle Hill, NSW, Australia) in 50 mL of 1% sulfuric acid. This ratio of thiocyanate to ferrous ion was influenced by the work of Egerton et al. [1954], with only the source of the ferrous ion and thiocyante ion being changed to the aforementioned inorganic salts. The red colour developed after reagent preparation was removed by extraction with two portions of n-pentanol (GPR grade, BDH, Poole, England). A resulting colourless or very pale pink coloured reagent was then added to the sample solution. High purity water was obtained from a Satorius arium 611 water purification system.
2.3.4 Instrumentation
All spectroscopic measurements were carried out on a Jasco V-630 UV-VIS spectrophotometer using a pair of matched semi-micro open-top fluorimeter quartz cells (10 mm pathlength, 1.4 ml nominal volume, Starna). Jasco Spectra Manager® Version 2.05.03 software was used to facilitate data acquisition and analysis.
2.3.5 Method optimisation and results
A 10 ppm aqueous solution of TATP was used as the test solution throughout the optimisation experiments. The first parameter in the acid pre-treatment step to be optimised was the concentration of the acid. Two millilitres of the test solution was mixed with 0.5 mL of sulfuric acid at different concentrations for 2 minutes, followed by the addition of 1 mL of the colorimetric reagent. The acid concentrations evaluated were: 50% v/v; 30% v/v; and 10% v/v. As can be seen from the results in Figure 2-13, the higher concentration of acid (50% v/v) provided a better TATP conversion, which was consistent with the recommendation by Itzhaky and Keinan [2004].
Quantitative Methods for the Analysis of Representative Explosives
37
Figure 2-13 Effect of sulfuric acid concentration (in the TATP decomposition step) on the absorbance of the treated test solution: a) 50% v/v; b) 30% v/v; and c) 10% v/v.
The volume of acid was the next variable optimised. The experiment involved two millilitres of test solution, pretreated with three different volumes – i.e. 0.5, 1 and 2 mL – of 50% v/v H2SO4 for 2 minutes, followed by the addition of 1 mL of the colorimetric reagent. It was found that the absorbance of the reaction product decreased when a higher amount of acid was utilised (Figure 2-14). Therefore, the volume and concentration of acid utilised in the preliminary study addressed in section 2.3.1 (i.e. 0.5 mL of 50% H2SO4) was utilised for the remainder of the method development process.
Wavelength (nm)
300 400 500 600 700
Abs
orba
nce
0.0
0.1
0.2
0.3
0.4
0.5
abc
Chapter 2
38
Figure 2-14 Effect of the volume of acid solution used in the pretreatment step on the absorbance of the treated test solution: a) 0.5 mL; b) 1 mL; and c) 2 mL.
The last parameter optimised was the reaction time for the acid decomposition. The experiments involved two millilitres of test solution, pretreated with 0.5 mL of 50% H2SO4 at different times – i.e. 1 minute, 2 minutes and 5 minutes – followed by the addition of 1 mL of the colorimetric reagent. According to the results depicted in Figure 2-15, there was a slight increase in absorbance over the period from one and five minutes. The reaction time of five minutes was identified as being optimal as the highest absorbance was obtained at this time.
The volume of colorimetric reagent used for each assay was kept at 1 mL because a larger volume of reagent was found to reduce the absorbance of the final solution (and hence reduce overall sensitivity).
Wavelength (nm)
300 400 500 600 700
Abs
orba
nce
0.0
0.1
0.2
0.3
0.4
0.5
abc
Quantitative Methods for the Analysis of Representative Explosives
39
Figure 2-15 Effect of reaction time in the acid pretreatment step on the final absorbance of the treated test solution: a) 1 minute; b) 2 minutes; and c) 5 minutes.
The final conditions identified as being optimal for the acid catalysed decomposition of TATP were as follows: (i) 2 mL of test solution mixed with 0.5 mL of 50% v/v sulfuric acid; (ii) acid decomposition allowed to proceed at room temperature for 5 minutes; (iii) addition of 1 mL of the colorimetric reagent. The absorbance of the final solution was recorded in triplicate at 465 nm against Milli-Q water.
The major drawback of this method was the oxidation of the colorimetric reagent (ferrous thiocyanate solution) by atmospheric oxygen. Although the reagent was freshly prepared and extracted as per the above procedure, the formation of a red coloured reagent blank while waiting for the analysis was unavoidable, even with parafilm sealing of the test tube. Thus, the increase in absorbance of the reagent blank was studied to identify a way to correct the absorbance of the treated test solution. Figure 2-16 demonstrates that the relationship between
Wavelength (nm)
300 400 500 600 700
Abs
orba
nce
0.0
0.1
0.2
0.3
0.4
abc
Chapter 2
40
the increase in absorbance and time is essentially linear. Thus, measuring the blank at the beginning, in between the sequence of samples, and at the end of the analysis whilst recording the time of each measurement could be used to determine the correction factor for the absorbance of the treated test solution.
Figure 2-16 Absorbance of reagent blank measured at 465 nm every 10 seconds.
The effect of the presence of organic solvents in the sample on the absorbance of the treated test solution was also studied as a mixture of water and organic solvent was envisaged as being used for the extraction of both the organic and inorganic explosives from the swabs. Two millilitres of Milli-Q water containing 20% v/v of the selected organic solvent were mixed with 0.5 mL of 50% H2SO4 for 5 minutes, followed by the addition of 1 mL of colorimetric reagent and waiting for 10 minutes before recording the absorbance. Of the organic solvents evaluated (i.e. acetone, methanol, and acetonitrile), methanol was found to produce the highest background. However, within a period of ten minutes, the absorbance produced by all of the organic solvents was found to be lower than the increase of the reagent
Time (sec)
0 200 400 600 800 1000 1200 1400
Abs
orba
nce
0.00
0.02
0.04
0.06
0.00
0.02
0.04
0.06
Quantitative Methods for the Analysis of Representative Explosives
41
blank absorbance caused by the action of atmospheric oxygen (Figure 2-17). Thus, the corrected absorbance for each treated test solution could be calculated by subtracting the absorbance from a negative control and the blank absorbance (known from measuring the blank at the beginning and at the end of each analysis). An example of the absorbance data for the solvent extraction of a swab containing TATP is provided in Table 2-3, including calculations demonstrating the application of the absorbance correction factor.
Figure 2-17 Effect of organic solvent on the background absorbance of the reagent blank: a) reagent blank without organic solvent at time zero; b) with acetonitrile; c) with acetone; d) with methanol; and e) blank without organic solvent at 10 minutes.
Blank 2 (Milli-Q water + acid + reagent) 0.1162 12.42 pm Table 2-3 Example of data from the extraction of a swab containing TATP.
The increment in blank absorbance (abs unit/min) = (0.1162-0.1074)/5 = 0.00176
The increment in absorbance from the negative control = 0.1506-(0.1074+0.00176) = 0.0414
The corrected absorbance of sample = 0.4862-0.0414-[0.1074+(2×0.00176)] = 0.3339
2.3.6 Linearity of the method
A set of aqueous solutions of TATP with concentrations of 0, 1, 2, 4, 6, 8, 10, 12 and 16 μg/mL (ppm) were prepared and analysed in random order using the optimised colorimetric procedure described above. The verification of a linear relationship between the corrected absorbance and the concentration of TATP in each sample was carried out in the same way as described in section 2.2.5. The results from the statistical test did not indicate a better fit with a non-linear model compared with a linear model. Consequently, the analytical curve constructed from the corrected absorbance of a TATP solution within the range from 0 – 16 ppm could be described by a linear model as depicted in Figure 2-18.
Quantitative Methods for the Analysis of Representative Explosives
43
Concentration (ppm)
0 2 4 6 8 10 12 14 16
Cor
rect
ed a
bsor
banc
e
0.0
0.2
0.4
0.6
0.8
1.0
1.2
1.4
R2 = 0.9993 sy/x = 0.0126
Figure 2-18 Analytical curve for TATP test solutions in the range of 0 – 16 ppm. The dotted lines represent the upper and lower limits of the prediction band for a 95% confidence interval.
2.3.7 Conclusions
Quantitative analysis of TATP in an aqueous solution was successful by conversion to hydrogen peroxide using 50% sulfuric acid at room temperature for 5 minutes, followed by colorimetric determination with ferrous thiocyanate. Although the reagent was easily oxidised by atmospheric oxygen, the quantification was still able to be achieved using a correction factor. The relationship between the corrected instrument response and concentration of TATP in an aqueous solution was demonstrated to be linear in the range from 0 – 16 ppm.
Chapter 2
44
2.4 Quantitative method for the analysis of chlorate and nitrate
2.4.1 Method selection and optimisation
Ion chromatography (IC) and capillary electrophoresis (CE) are techniques that play a major role in inorganic quantitative analysis nowadays. However, the popularity of CE as a method of choice has been increasing considerably because of the benefits of fast separations and lower operating costs compared to IC. The main reason for choosing CE as a quantitative method for inorganic representative compounds (chlorate and nitrate) in this research came from the work of Warren et al. [1999]. The authors experienced difficulties analysing samples containing organic/water using ion chromatography. Peak broadening and non-linear calibrations were reported when utilising IC but no such effects in CE analysis. As the mixture of organic solvent and water was going to be used for swab extractions in this research, CE was chosen rather than IC to avoid problems that might be encountered with the organic/water matrix.
Chlorate and nitrate were analysed by CE in indirect photometric detection mode using a chromate background electrolyte adapted from the work of the University of Tasmania [Hutchinson et al. 2007]. Sulfate and thiocyanate were chosen to be used as internal standards in the quantitative analysis of chlorate and nitrate, respectively, with the reason that these anions have mobility and a spectroscopic property close to the target anions (chlorate, nitrate). Nitrate has UV absorption at a wavelength below 250 nm, thus the direct photometric detection was also evaluated. It was found that the standard error of the regression (sy/x) of the calibration curve derived from the data acquired in the indirect mode was lower, therefore both chlorate and nitrate were quantified in indirect photometric detection mode. The final electrophoretic procedures are detailed in section 2.4.3.
2.4.2 Chemicals
Most chemicals were purchased from Sigma-Aldrich Pty. Ltd. (Castle Hill, NSW, Australia) unless otherwise stated. Sodium chlorate (99.8% purity), ammonium nitrate (99.5% purity, ACS reagent grade), anhydrous sodium sulfate (99.7% purity, ACS reagent grade) and sodium thiocyanate (99% purity, reagent grade) were used to prepare a single anion stock standard solution at a concentration of 1000 mg/L. A 0.1 M sodium hydroxide solution was prepared for preconditioning the capillary by diluting 1.0 N NaOH solution obtained from
Quantitative Methods for the Analysis of Representative Explosives
45
Agilent Technologies Australia (Forest Hill, VIC, Australia). Hexadimethrine bromide (96% purity) was used to prepare a 1% aqueous solution to coat the internal wall of the capillary. The background electrolyte was prepared from chromium(VI) oxide (99.9% purity), sodium chromate tetrahydrate (99% purity) and Trizma® base (99.9% purity) with the final composition of 10 mM CrO3, 10 mM Na2CrO4 and 40 mM TRIS. High purity water was obtained from a Satorius arium 611 water purification system.
2.4.3 Instrumentation
The analyses of chlorate and nitrate anion were performed on an Agilent 7100 capillary electrophoresis system equipped with a diode array detector. Instrumental control, data acquisition and analysis were accomplished using 3D-CE ChemStation software version Rev. B.04.02.
The separation of both target anions was carried out using a 50 μm internal diameter undeactivated fused-silica capillary (supplied by Agilent Technologies Australia, Forest Hill, VIC, Australia). The capillary was cut to the total length of 64.5 cm (56 cm to detector) and was used in conjunction with the appropriate capillary alignment interfaces. Electrophoretic procedure started with the conditioning of the capillary prior to use by flushing with 0.1 M NaOH for 10 minutes, water for 5 minutes, a 1% w/v hexadimethrine bromide solution for 10 minutes, and then background electrolyte (BGE) for 3 minutes. Before the injection of sample in each run, the capillary was conditioned by flushing the BGE for 2 minutes. Injections were carried out hydrodynamically with a pressure of 30 mbar for 30 seconds. A voltage of -25kV was applied across the capillary during all separations, with temperature maintained at 25ºC. Indirect photometric detection of both chlorate and nitrate were performed at a wavelength of 270 nm with a bandwidth of 4 nm and the reference wavelength was turned off.
2.4.4 Results
Examples of electropherograms obtained utilising the condition outlined above are shown in Figures 2-19 and 2-20.
Chapter 2
46
min0 0.5 1 1.5 2 2.5 3 3.5 4 4.5
3.816 sulfate (IS)
4.047 chlorate
0
0.5
1
1.5
2
2.5
mAU
min0 0.5 1 1.5 2 2.5 3 3.5 4 4.5
mAU
-1
-0.5
0
0.5
1
1.5
2
nitrate 3.580
thiocyanate (IS) 3.805
Figure 2-19 Electropherogram of a solution containing 2 ppm of chlorate (peak at 4.05 min.) and 6 ppm of sulfate (internal standard; peak at 3.82 min.)
Figure 2-20 Electropherogram of a solution containing 2 ppm of nitrate (peak at 3.58 min.) and 15 ppm of thiocyanate (internal standard; peak at 3.81 min.)
Quantitative Methods for the Analysis of Representative Explosives
47
2.4.5 Linearity of the method
Two sets of solutions (see Table 2-4 for the composition in each set) were prepared to evaluate the linearity of the analytical method. The chosen ranges were based on discussions with scientists who had conducted the analysis of explosive residues during the Bali bombings in 2002. Each working solution was analysed in triplicate and in a random order.
Anions
Concentration of internal standard in final solution (ppm)
Concentration of anions in final standard solution (ppm)
chlorate Set 1: 25 Set 2: 6
Set 1: 0.98, 2.0, 3.9, 5.9, 9.8, 13.7, 17.6, 21.5, 25.4 and 29.3
Set 2: 0.98, 2.0, 3.9, 4.9, and 5.9
nitrate Set 1: 31 Set 2: 15
Set 1: 5.1, 10.1, 15.2, 20.2, 25.3, 30.3, 35.4 and 40.4 Set 2: 1.0, 2.0, 4.0, 8.1, 12.1, 16.2 and 20.2
Table 2-4 Concentration ranges of solutions used for evaluating the linearity of electrophoretic method for the selected inorganic anions.
Statistical tests mentioned in section 2.2.5 were again applied to determine whether a non-linear model would provide a significant improvement in fitting analytical curves. Results from the test verified the linear relationship between the instrumental response (corrected area ratio) and the concentration over the range detailed in Table 2.4 for both chlorate and nitrate. The analytical curves for anions of interest are shown in Figures 2-21 to 2-24.
Chapter 2
48
Chlorate Set 1
Concentration (ppm)
0 5 10 15 20 25 30
Cor
rect
ed a
rea
ratio
0.0
0.2
0.4
0.6
R2 = 0.9984 sy/x = 0.0092
Figure 2-21 Analytical regression curve for chlorate in the range of 1 – 29 ppm (Set 1). The dotted lines represent the upper and lower limits of the prediction band for a 95% confidence interval.
Quantitative Methods for the Analysis of Representative Explosives
49
Chlorate Set 2
Concentration (ppm)
0 1 2 3 4 5 6
Cor
rect
ed a
rea
ratio
0.0
0.1
0.2
0.3
0.4
0.5
0.6
R2 = 0.9974 sy/x = 0.0084
Figure 2-22 Analytical regression curve for chlorate in the range of 1 – 6 ppm (Set 2). The dotted lines represent the upper and lower limits of the prediction band for a 95% confidence interval.
Chapter 2
50
Figure 2-23 Analytical regression curve for nitrate in the range of 5 – 40 ppm (Set 1). The dotted lines represent the upper and lower limits of the prediction band for a 95% confidence interval.
Nitrate Set 1
Concentration (ppm)
0 10 20 30 40
Cor
rect
ed a
rea
ratio
0.0
0.2
0.4
0.6
0.8
1.0
1.2
R2 = 0.9988 sy/x = 0.013
Quantitative Methods for the Analysis of Representative Explosives
51
Figure 2-24 Analytical regression curve for nitrate in the range of 1 – 20 ppm (Set 2). The dotted lines represent the upper and lower limits of the prediction band for a 95% confidence interval.
2.4.6 Conclusions
Chlorate and nitrate were both successfully quantified using capillary electrophoresis with indirect photometric detection. The linear range of the method was 1 – 29 ppm for chlorate and 1 – 40 ppm for nitrate.
2.5 References
Almog, J. & Zitrin, S. 2009, 'Colorimetric detection of explosives ', in Aspects of Explosives Detection, Marshall, M. & Oxley, J.C., eds. Amsterdam: Elsevier.
Baga, A.N., Johnson, G.R.A., Nazhat, N.B. & Saadalla-Nazhat, R.A. 1988, 'A simple spectrophotometric determination of hydrogen peroxide at low concentrations in aqueous solution', Analytica Chimica Acta, vol. 204, pp. 349-353.
Nitrate Set 2
Concentration (ppm)
0 5 10 15 20
Cor
rect
ed a
rea
ratio
0.0
0.2
0.4
0.6
0.8
1.0
1.2
R2 = 0.9990 sy/x = 0.0132
Chapter 2
52
Bellamy, A.J. 1999, 'Triacetone triperoxide: Its chemical destruction', Journal of Forensic Science, vol. 44, no. 3, pp. 603-608.
Burks, R.M. & Hage, D.S. 2009, 'Current trends in the detection of peroxide-based explosives', Analytical and Bioanalytical Chemistry, vol. 395, no. 2, pp. 301-313.
Cotte-Rodríguez, I., Hernández-Soto, H., Chen, H. & Cooks, R.G. 2008, 'In situ trace detection of peroxide explosives by desorption electrospray ionization and desorption atmospheric pressure chemical ionization', Analytical Chemistry, vol. 80, no. 5, pp. 1512-1519.
Dubnikova, F., Kosloff, R., Zeiri, Y. & Karpas, Z. 2002, 'Novel approach to the detection of triacetone triperoxide (TATP): Its structure and its complexes with ions', Journal of Physical Chemistry A, vol. 106, no. 19, pp. 4951-4956.
Egerton, A.C., Everett, A.J., Minkoff, G.J., Rudrakanchana, S. & Salooja, K.C. 1954, 'The analysis of combustion products I. Some improvements in the methods of analysis of peroxides', Analytica Chimica Acta, vol. 10, pp. 422-428.
Eren, Ş., Üzer, A., Can, Z., Kapudan, T., Erçağ, E. & Apak, R. 2010, 'Determination of peroxide-based explosives with copper(II)–neocuproine assay combined with a molecular spectroscopic sensor', Analyst, vol. 135, no. 8, pp. 2085-2091.
Germain, M.E. & Knapp, M.J. 2008, 'Turn-on fluorescence detection of H2O2 and TATP', Inorganic Chemistry, vol. 47, no. 21, pp. 9748-9750.
Hutchinson, J.P., Evenhuis, C.J., Johns, C., Kazarian, A.A., Breadmore, M.C., Macka, M., Hilder, E.F., Guijt, R.M., Dicinoski, G.W. & Haddad, P.R. 2007, 'Identification of inorganic improvised explosive devices by analysis of postblast residues using portable capillary electrophoresis instrumentation and indirect photometric detection with a light-emitting diode', Analytical Chemistry, vol. 79, no. 18, pp. 7005-7013.
Itzhaky, H. & Keinan, E. 2004, Method and Kit for the Detection of Explosives, US 6767717.
Laine, D.F., Roske, C.W. & Cheng, I.F. 2008, 'Electrochemical detection of triacetone triperoxide employing the electrocatalytic reaction of iron(II/III)-ethylenediaminetetraacetate and hydrogen peroxide', Analytica Chimica Acta, vol. 608, no. 1, pp. 56-60.
Malashikhin, S. & Finney, N.S. 2008, 'Fluorescent signaling based on sulfoxide profluorophores: Application to the visual detection of the explosive TATP', Journal of the American Chemical Society, vol. 130, no. 39, pp. 12846-12847.
Quantitative Methods for the Analysis of Representative Explosives
53
Milas, N.A. & Golubović, A. 1959, 'Studies in organic peroxides. XXIV. Preparation, separation and identification of peroxides derived from diethyl ketone and hydrogen peroxide', Journal of the American Chemical Society, vol. 81, no. 13, pp. 3361-3364.
Munoz, R.A.A., Lu, D., Cagan, A. & Wang, J. 2007, '‘One-step’ simplified electrochemical sensing of TATP based on its acid treatment', Analyst, vol. 132, no. 6, pp. 560-565.
National Association of Testing Authorities. 2009, Guidelines for the validation and verificaton of chemical test methods, Technical Note 17, NATA, Australia.
Oxley, J.C., Smith, J.L., Huang, J. & Luo, W. 2009, 'Destruction of peroxide explosives', Journal of Forensic Science, vol. 54, no. 5, pp. 1029-1033.
Schulte-Ladbeck, R., Vogel, M. & Karst, U. 2006, 'Recent methods for the determination of peroxide-based explosives', Analytical and Bioanalytical Chemistry, vol. 386, no. 3, pp. 559-565.
Sella, E. & Shabat, D. 2008, 'Self-immolative dendritic probe for direct detection of triacetone triperoxide', Chemical Communications, vol. no. 44, pp. 5701-5703.
Sigman, M.E., Clark, C.D., Caiano, T. & Mullen, R. 2008, 'Analysis of triacetone triperoxide (TATP) and TATP synthetic intermediates by electrospray ionization mass spectrometry', Rapid Communications in Mass Spectrometry, vol. 22, no. 2, pp. 84-90.
Warren, D., Hiley, R.W., Phillips, S.A. & Ritchie, K. 1999, 'Novel technique for the combined recovery, extraction and clean-up of forensic organic and inorganic trace explosives samples', Science & Justice, vol. 39, no. 1, pp. 11-18.
Xie, Y. & Cheng, F. 2010, 'Selective and rapid detection of triacetone triperoxide by double-step chronoamperometry', Microchemical Journal, vol. 94, no. 2, pp. 166-170.
Zhang, W.-H., Zhang, W.-D. & Chen, L.-Y. 2010, 'Highly sensitive detection of explosive triacetone triperoxide by an In2O3 sensor', Nanotechnology, vol. 21, no. 31, p. 315502.
54
55
CHAPTER 3 EVALUATION OF VARIOUS SAMPLING MEDIA – THE SEARCH FOR A UNIVERSAL SWAB FOR COLLECTING EXPLOSIVE RESIDUES
The sampling approach taken is the initial and most critical step in the protocol for the analysis of explosive residues. The success of the whole analysis strongly relies on the careful selection of sampling method. Where explosive residues are suspected to reside on a particular surface, there are several sampling methods that can be applied depending on the type of surface. The swabbing technique performs well on human skin and smooth, non-porous surfaces such as metal, glass, and painted wood. For porous surfaces such as fabric and vehicle interiors, vacuum lifting is a more effective method for sample collection. In those cases where swabs are collected, apart from the surface type, there are two other factors that play an important role in the collection efficiency: (i) the nature of sampling media; and (ii) the swabbing solvent used.
Many materials have been evaluated and suggested as potential sampling media for the efficient recovery of explosive residues, namely: rayon [Twibell et al. 1984]; polypropylene filter cloth [Lloyd 1986]; Micropore tape [Neudorfl, McCooeye & Elias 1993]; acrilan fibre [Wallace & McKeown 1993]; Teflon tubing [Sigman & Ma 1999]; filter paper [Oxley et al. 2003]; PTFE wipe [Waddell et al. 2005]; and double-sided adhesive coated stubs [Zeichner et al. 2009]. However, according to the responses collated from the survey (mentioned in Chapter 1; refer also to Appendix 1), swabbing with a cotton-based material is still widely used in the majority of forensic laboratories, possibly because of the low cost and availability of the material and its ease of use.
The collection of trace explosive residues by swabbing is usually carried out by wetting the sampling media with a solvent. There is a wide range of solvents reported to facilitate the transfer of explosive residues onto the sampling media. These include: diethyl ether [Yallop 1980, p. 181-185, Douse 1982]; methyl tert-butyl ether [Douse 1985]; methanol [Laposata
Chapter 3
56
1985, Neudorfl, McCooeye & Elias 1993, Blackwood et al. 1995]; ethanol [Twibell et al. 1982, Russell 1984, Crowson et al. 1996]; isopropanol [Wallace & McKeown 1993]; and acetonitrile [Oxley et al. 2003]. Nevertheless, without prior knowledge of the type of explosive that may be present, acetone appears to be a good choice to moisten the swab because most explosives dissolve well in this all-purpose solvent. The disadvantage of using acetone is that it cannot be used on a surface coated with varnish or paint (as acetone will often dissolve the surface coating, thus generating a complex and dirty matrix for analysis). Additionally, a major drawback is that acetone can collect a considerable amount of interfering material onto the swab which causes difficulties in the subsequent analysis and identification steps. Using a dry swab has been considered and proposed as a solution to this problem; however, studies have proven that swabs wetted with a solvent provide a better recovery of explosives compared to dry swabs [Twibell et al. 1982, Hobbs & Conde 1998]. The use of a solvent may also prevent the loss of volatile compounds from the sampling media during the storage of the sample prior to instrumental analysis.
Despite the fact that the collection of a swab is a critical step that can determine the success of the whole analysis, surprisingly few studies have been carried out to compare different sampling media and solvents in order to optimise the swabbing procedure. The only detailed work in this area found in a peer reviewed journal was conducted by the Home Office Forensic Science Laboratory, UK, in the 1980s [Twibell et al. 1982]; however, this report only addressed the investigation of one particular explosive (nitroglycerine). With the great diversity of compounds that can be used in explosive devices nowadays, more comprehensive work in this area is required to develop a universal sampling procedure that can effectively recover both organic and inorganic explosive residues.
The concept of a universal sampling protocol was introduced at the 10th International Association of Forensic Science Conference in 1984 by the London Metropolitan Police Forensic Science Laboratory [Russell 1984]. Nonetheless, their main objective was to combine and simplify a sampling kit that could be applied to the collection of both firearm and explosives residues, rather than targeting an organic/inorganic explosives mixture. In 1999, the Forensic Explosive Laboratory in the UK published their sampling procedure for the recovery of both organic and inorganic explosives using a single cotton swab wetted with an ethanol/water mixture [Warren et al. 1999]. A different approach to collect both organic and inorganic explosive traces by swabbing with only water was also introduced [Thompson et al. 1999]. However, the benefit derived by collecting less co-extracted interfering
Evaluation of various sampling media – the search for a universal swab
57
compounds, was outweighed by poor sample recovery. An improvement in recovery was achieved when the wetting solvent was changed to a mixture of isopropanol and water (8:2 v/v).
The use of an isopropanol/water mixture as a swabbing solvent had previously been introduced by the Home Office Forensic Science Laboratory, UK [Lloyd & King 1990]; however, no clear explanation for using a water/organic solvent mixture was provided. It is speculated that the purpose of adding water to the mixture was to adjust the polarity of the extract so that it would be compatible with the requirement of the subsequent clean-up procedure and with the final instrumental analysis by high-performance liquid chromatography with electrochemical detection. Cotton swabs moistened with isopropanol/water (75:25 v/v) have also been applied in the recovery of organic components of propellant powders found in gunshot residue [Laza et al. 2007]. Isopropanol was mentioned as a replacement for methanol because of its lower toxicity, but equally no reason was provided for using a mixture of an organic solvent with water as a swabbing solvent.
The ratio of isopropanol and water in the mixture proposed by these authors is quite similar to the solvent composition in pre-packaged skin cleansing alcohol wipes, which are readily available through pharmacists. Therefore, these commercially available sterile wipes could potentially be used as a universal swab for the recovery of both organic and inorganic explosive residues in a single step. As each wipe is saturated with isopropanol/water (7:3) and individually sealed in a separate pack, a container filled with a flammable solvent would no longer be needed in field sampling kits. Consequently, a smaller sized sampling kit could be implemented and, more importantly, the sampling kit could be carried in hand luggage on commercial aircrafts in the event of an operational deployment.
Although the use of alcohol wipes has already been demonstrated as providing good recovery of some organic explosives and stabilizers in gunshot residues on human skin [Perret et al. 2008] and also for collecting TATP residues from various surfaces [Romolo et al. 2010], the capability of alcohol wipes as a universal swab for collecting both organic and inorganic explosives in a single step has not been investigated or reported. This research evaluated alcohol wipes for their recovery of six representative compounds from various kinds of surfaces. The collection efficiency of alcohol wipes was compared to results obtained from conventional cotton and polyester swabs pre-moistened with various solvents. The polyester
Chapter 3
58
swab was included in this study as a result of research conducted by the Royal Canadian Mounted Police (RCMP) on the topic of “best swab from all instrumental backgrounds’ point of view” (mentioned as an unpublished work in the proceedings of the 14th Interpol International Forensic Science Symposium). One type of polyester swab was selected from a list provided by the RCMP (Wendy Norman), on the basis of its availability in Australia and the size of its tip, which is comparable to the size of the tip of the cotton swabs used in this study.
This chapter is divided into four parts starting with the characterisation of the fibre material of the selected sampling media. This is followed by a description of the experiments used to ascertain the best organic solvent for the extraction of organic explosive compounds out of the selected wipes and swabs. The third part of this chapter addresses the most efficient swabbing system for cotton and polyester swabs and the final part provides comparative results between the collection efficiency of wipes and swabs.
3.1 Characterisation of fibre material in the selected sampling media
3.1.1 Experimental
3.1.1.1 Materials
Skin cleansing alcohol wipes were purchased from two sources. Kendall Webcol™ wipes (dimensions: 3.3 × 3.1 cm) were obtained from a local pharmacist (Discount Pharmacy, Macquarie, ACT, Australia) and Mini Liv-wipes (dimensions: 3.3 × 3 cm) were purchased from Livingstone International Pty. Ltd. (Rosebery, NSW, Australia). Cotton tipped applicators (wooden shaft length: 150 mm) were also purchased from Livingstone International. ITW Texwipe® Alpha® swabs (long handle) were supplied by BACS Contamination Control (Chatswood, NSW, Australia).
3.1.1.2 Sample preparation
Samples of the two brands of alcohol wipes were allowed to dry in a fume cupboard. Each wipe was then washed by rolling into a cylinder and transferring into a 4 mL glass vial filled
Evaluation of various sampling media – the search for a universal swab
59
with HPLC grade methanol (purchased from Chem-Supply, Gillman, SA, Australia). The vials were capped, sealed with Parafilm® and then sonicated in an ultrasonic bath for 10 minutes. The wipe was taken out and allowed to completely dry in the fume cupboard and then stored in a paper envelop ready for analysis by Fourier transform infrared microscopy. For the other two swabs, there was no pre-treatment conducted before the analysis. Several fibre strands were taken randomly from the wipes and swabs. Each strand was cut into a small section, flattened with a small metal roller, and then placed onto a sodium chloride disc. Infrared spectra of the fibres were obtained in the transmission mode using a Thermo Nicolet Nexus™ 670 FT-IR Spectrometer with an attached Thermo Nicolet Continuµm infrared microscope (64 scans; 4 cm-1 resolution). Instrumental control, data acquisition and analysis were accomplished using Thermo Electron OMNIC™ software version 7.3.
Several fibre strands from the wipes and swabs were also mounted onto glass slides and examined under a conventional light microscope.
3.1.2 Results
The sample fibre from the Kendall Webcol™ alcohol wipe was identified as regenerated cellulose. The fibre from the Mini Liv-wipe was identified as polyester. The resulting infrared spectra are shown in Figures 3-1 and 3-2, respectively.
Chapter 3
60
Figure 3-1 Infrared spectrum of a fibre taken from the Kendall Webcol™ alcohol wipe (top spectrum) compared with the best match spectrum from the library (regenerated cellulose; bottom spectrum).
Kendall Webcol washed
40
50
60
70
80
90
100
%T
PNAME=RAYON NO TRADE NAME A0225 1985 NORTH AMERICAN RAYON
Evaluation of various sampling media – the search for a universal swab
61
Figure 3-2 Infrared spectrum of a fibre taken from the Mini Liv-wipe alcohol swab (top spectrum) compared with the best match spectrum from the library (polyester; bottom spectrum).
For the cotton tipped applicator, the confirmation of the fibre material was achieved by the result of a characteristic ribbon-like feature from microscopy and by comparing the IR result with the spectrum obtained from a known cotton fibre, as shown in Figure 3-3. The fibre taken from the ITW Texwipe® Alpha® swab was identified as polyester by comparison with a library reference spectrum (Figure 3-4).
Figure 3-3 Infrared spectrum of a fibre taken from the cotton applicator (top spectrum) compared with that from a known cotton fibre (bottom spectrum).
Evaluation of various sampling media – the search for a universal swab
63
Figure 3-4 Infrared spectrum of a fibre taken from the ITW Texwipe® Alpha® swab (top spectrum) compared with the best match library spectrum (polyester; bottom spectrum).
3.1.3 Conclusions
The fibre materials for the selected sampling media were all identified. The two selected alcohol wipes were made from two different types of fibre, i.e. regenerated cellulose and polyester. The swab materials were confirmed as cotton and polyester as reported by the manufacturers.
3.2 Solvent extraction for representative organic explosives
Before the collection efficiency of the selected sampling media was evaluated, the method for extraction of the target compounds from the sampling media had to be established. Solvent extraction is a simple process, with no requirement for sophisticated equipment. For inorganic compounds, extraction with deionised water is common practice in most laboratories; however, it is different in the case of organic compounds. The solvent for extraction is usually
the same as the swabbing solvent for the reason of simplicity in the protocol. As detailed at the beginning of this chapter, a variety of solvents is generally utilised for sampling, thus no one specific solvent is generally accepted and widely used as in the case for extraction of inorganic compounds.
Five organic solvents (acetone, acetonitrile, methanol, ethanol and isopropanol), which were all reported as swabbing solvents in the survey responses, were subjected to a preliminary evaluation for their extraction efficiency using three target compounds (PETN, TNT and RDX). The results are reported in Appendix 2. It was found that there were no significant differences in the extraction of the target compounds from all the selected wipes and swabs using acetone, acetonitrile and methanol.
The extraction efficiencies for the four representative organic compounds (i.e. PETN, TNT, RDX and TATP) from the selected sampling media, utilising the three short-listed solvents (acetone, acetonitrile and methanol), were investigated. These experiments are addressed in the following section.
3.2.1 Experimental
3.2.1.1 Materials and chemicals
The details of selected wipes and swabs are provided in section 3.1.1.1. The certified solutions of explosives and other chemicals required for the quantitative analyses are detailed in sections 2.2.2 and 2.3.2 (Chapter 2). A certified solution of TATP in acetonitrile (concentration of 995 µg/mL, AccuStandard, New Haven, CT, USA) was utilised for the experiments in this section.
HPLC grade acetone (LAB-SCAN Analytical Sciences, Bangkok, Thailand), HPLC grade acetonitrile (LiChroSolv®, Merck Pty, Ltd., Kilsyth, VIC, Australia), and HPLC grade methanol (Chem-Supply, Gillman, SA, Australia) were used as extracting solvents.
3.2.1.2 Sample preparation
15 µL the solution of PETN or TNT or RDX, which was equivalent to 15 µg of the target compound, was applied to the wipes and swabs. The sampling media were then allowed to
Evaluation of various sampling media – the search for a universal swab
65
dry in a fume cupboard for 15 minutes before being transferred into a 4 mL clear glass vial. In the case of TATP, 30 µL of solution (equivalent to approximately 30 µg) was transferred to the selected wipes, which were first dried in a fume cupboard for 15 minutes before adding the explosive solution, and then each wipe transferred into a vial. As the selected swabs were obtained in a dry state, the 30 µL of TATP solution was added directly onto the dry swab and then the swab transferred immediately to a glass vial. From the preliminary study at the beginning of the research, it was found that the persistence of TATP on dry wipes and swabs was less than 5 minutes. Thus, no further air drying was undertaken after adding the TATP solution onto the sampling media.
To each glass vial, one millilitre of extraction solvent was added. The vials were then sealed with Parafilm® and the extraction carried out by sonication in an ultrasonic bath for 10 minutes. There were three repeats and one negative control for each test solvent on each sampling media, with four target explosives (making a total of 192 samples).
After ten minutes of extraction, the vials were allowed to cool to room temperature. The wipes were pounded with the tip of a glass Pasteur pipette and the extract was subsequently drawn through the wipe and transferred into a 5 mL volumetric flask. In the case of swabs, the tip of a glass Pasteur pipette was punctured into the tip of the swab and the extract was drawn through the tip of swab and transferred into a 5 mL volumetric flask. An internal standard (detailed in section 2.2.2 of Chapter 2) was added (not included in the case of TATP) and the volume was made up with a suitable diluent (methanol/water for PETN, RDX and TNT; detailed in section 2.2.5 of Chapter 2, and deionised water for TATP). The amount of target compound in the final solution was quantified using the quantitative method as detailed in section 2.2.3 of Chapter 2 for PETN, TNT, RDX, and in section 2.3.3 to 2.3.5 of Chapter 2 for TATP. Two modifications were made to the instrumental conditions for the analysis of the PETN samples with acetone as the extracting solvent: (i) the separation temperature was changed to 25°C to avoid the tailing of the acetone peak; and (ii) the reference wavelength was set to 380 nm with a bandwidth of 100 nm instead of 300 nm due to the UV absorption of acetone. The five-point calibration curves for quantitative analyses, which covered the concentration range of 0.2–3 ppm for PETN, TNT and RDX, and the range of 1–6 ppm for TATP, were prepared on each day that sample analyses were conducted.
Chapter 3
66
3.2.2 Results
RC wipe
Solvent
Acetone ACN MeOH
% R
ecov
ery
0
20
40
60
80
100
0
20
40
60
80
100
PolyEs wipe
Solvent
Acetone ACN MeOH0
20
40
60
80
100
% R
ecov
ery
0
20
40
60
80
100
Cotton Swab
Solvent
Acetone ACN MeOH
% R
ecov
ery
0
20
40
60
80
100
0
20
40
60
80
100
PolyEs Swab
Solvent
Acetone ACN MeOH0
20
40
60
80
100
% R
ecov
ery
0
20
40
60
80
100
Figure 3-5 Recovery (in percentage) of four organic explosives from the selected wipes and swabs using three organic extraction solvents. The error bars were calculated from the standard deviation (1 SD) of the three replicate samples per experiment.
As demonstrated in Figure 3-5, more than 70% of each target compound was recovered from the selected wipes and swabs with the three solvents tested. There was no significant difference in the extraction of the same target compound among the three testing solvents, except for the extraction of TNT from the regenerated cellulose wipe. It was found that poor recovery was obtained when extracting with acetone. This low recovery was also observed when the experiment was repeated on two other days. There is no obvious explanation for this finding and, therefore, further investigation is required. With the better recovery obtained using other solvents, acetone was ruled out as an extracting solvent for this study. Although
Evaluation of various sampling media – the search for a universal swab
67
there was no significant difference between acetonitrile and methanol as a solvent for extraction, methanol was chosen for subsequent studies because it was the same solvent used in the mobile phase for the HPLC analysis. In addition, there was a global acetonitrile shortage at the time of the study.
3.2.3 Conclusions
Utilising the three testing solvents (i.e. acetone, acetonitrile and methanol), the four representative organic explosives (i.e. PETN, TNT, RDX and TATP) were able to be extracted from all of the selected wipes and swabs at a high percentage of recovery in most cases. However, poor recovery of TNT from the regenerated cellulose wipes was observed when acetone was used as the extracting solvent. Methanol was selected for subsequent use as the solvent for extraction, rather than acetonitrile, as it was compatible with the mobile phase used in the quantitative HPLC method and due to the acetonitrile shortage at that time.
3.3 Evaluation of a sampling system utilising a combined swab for both organic and inorganic explosive residues.
The performance of cotton tip applicators and polyester swabs, both dry and wetted with a solvent, in the recovery of organic and inorganic explosive compounds from different test surfaces was investigated. The recovery of three target organic compounds (PETN, TNT and RDX) from two testing surfaces (glass and plastic), using two types of swabs moistened with three organic solvents (acetone, acetonitrile and methanol), was firstly assessed. The best systems for each type of swab were then compared with the results using a dry swab, a swab wetted with deionised water, and a swab wetted with a mixture of alcohol and water in the recovery of all six representative compounds (both organic and inorganic explosives). The two mixtures of alcohol and water used in the tests were ethanol/water (1:1), as mentioned in the work by the Forensic Explosive Laboratory in the UK [Warren et al. 1999] and isopropanol/water (7:3), which is the same composition as in the commercially available pre-packaged alcohol wipes.
The value for “collection efficiency” was used to determine the best swabbing system. If the total quantity of explosive deposited on the testing surface was collected onto the swab, then the collection efficiency is pronounced to be 100 percent. The amount of explosive on the
Chapter 3
68
swab was calculated from the amount of explosive in the final solution after the extraction and corrected with the extraction efficiency of that solvent for the particular swab (determined in section 3.2 for organic explosives). According to in-house testing, the extraction efficiencies for the two selected inorganic compounds using deionised water with cotton and polyester swabs were found to be 66 and 97 % for chlorate and 75 and 96% for nitrate, respectively.
3.3.1 Evaluation of three organic solvents for the recovery of selected organic explosives from test surfaces utilising cotton and polyester swabs
3.3.1.1 Materials and chemicals
The details for the swabs, the solution of organic explosives, and the other chemicals required for the quantitative analyses are listed in section 3.2.1.1. Also, the details of the acetone, acetonitrile and methanol employed as the swabbing solvents can be found in section 3.2.1.1.
Two types of surfaces were used for testing the collection efficiency of the selected swabs – pathological grade premium microscope glass slides (dimensions: 7.6 × 2.5 cm, supplied by Livingstone International Pty. Ltd., Rosebery, NSW, Australia) and clear polyethylene film (dimensions: 7.5 × 6 cm) cut from from resealable plastic bag (supplied by Dowlings Canberra Pty. Ltd., Fyshwick, ACT, Australia). There were no treatments to the surfaces before use.
3.3.1.2 Sample preparation
15 µL of the explosives solution (PETN or TNT or RDX) were deposited onto the glass slide and allowed to dry in a fume cupboard for 4 minutes. For the plastic surface, it was found that the solution of explosive did not completely dry and therefore failed to generate a satisfactory deposit of explosive on the surface. Consequently, an alcohol wipe was first applied to wet the surface and then the explosive solution added while the surface was still wet. The plastic surface was then allowed to dry in a fume cupboard for 4 minutes.
Cotton or polyester swabs moistened with acetone, acetonitrile or methanol were then utilised to collect the residues. The collection was conducted by rolling the tip of the swab while rubbing on the surface to ensure that the entire surface area of the tip was used. The testing surface was swabbed in one direction without re-swabbing over the same area. Each swab was
Evaluation of various sampling media – the search for a universal swab
69
then transferred to a 4 mL clear glass vials. One millilitre of methanol was added to each vial and the extraction and subsequent quantitative analysis were carried in the same manner as in section 3.2.1.2. The five-point calibration curves covered the concentration range of 0.2–3 ppm for PETN, TNT and RDX were used for the quantitative analysis. The curves were prepared on each day that sample analyses were conducted. There were three samples repeats plus one negative control for each type of surface, for each swab type, and for each solvent system.
3.3.1.3 Results
The results from the first assessment using the three organic solvents with cotton and polyester swabs on glass and plastic surfaces are shown in Figures 3-6 and 3-7. High recoveries of the targeted compounds were obtained when a cotton swab was used on a glass surface, with insignificant difference among the three testing solvents. Lower recoveries were reported when plastic was utilised as the test surface. This was the result of different methods for the deposition of explosives during the sample preparation. As a consequence of the need to wet the plastic surface before adding the explosive solution, the deposition of explosives was found to “spatter” over the testing surface rather than form a single confined spot as occurred on the glass surface. In addition, the swabbing area on the plastic surface was approximately two times larger than on the glass surface; hance, some of the compound might not have been recovered, resulting in lower recovery.
Chapter 3
70
Cotton - glass
Solvent
Acetone ACN MeOH
%C
olle
ctio
n ef
ficie
ncy
0
20
40
60
80
100
0
20
40
60
80
100
Cotton - plastic
Solvent
Acetone ACN MeOH0
20
40
60
80
100
% C
olle
ctio
n ef
ficie
ncy
0
20
40
60
80
100PETN TNT RDX
Figure 3-6 Collection efficiency for the recovery of PETN, TNT and RDX from two testing surfaces (glass and plastic) using cotton swabs with three different organic solvents. The error bars were calculated from the standard deviation (1 SD) of the three replicate samples per experiment.
There was some variation in the recovery of target compounds from the plastic surface using cotton swabs with the three different solvents. Swabbing with acetone collected more PETN and RDX (when compared to acetonitrile and methanol), while the best recovery of TNT was achieved by swabbing with methanol. Acetonitrile provided the best compromise for the recovery of all three target compounds.
Evaluation of various sampling media – the search for a universal swab
71
Polyester - glass
Solvent
Acetone ACN MeOH
% C
olle
ctio
n ef
ficie
ncy
0
20
40
60
80
100
0
20
40
60
80
100
Polyester - plastic
Solvent
Acetone ACN MeOH0
20
40
60
80
100
%C
olle
ctio
n ef
ficie
ncy
0
20
40
60
80
100PETN TNT RDX
Figure 3-7 Collection efficiency for the recovery of PETN, TNT and RDX from two testing surfaces (glass and plastic) using polyester swabs with three different organic solvents. The error bars were calculated from the standard deviation (1 SD) of the three replicate samples per experiment.
For the polyester swabs, a high recovery of target compounds from the glass surface was also achieved with the three testing solvents (Figure 3-7). A difference in the recovery of target compounds from the plastic surface using polyester swabs was also found. However, using acetonitrile as a swabbing solvent seems to provide the best overall recovery for the three target compounds.
The efficiencies of cotton and polyester swabs wetted with acetonitrile for the recovery of both organic and inorganic explosives were studied. These experiments are addressed in the following section, along with experiments evaluating the use of an alcohol and water mixture as the swabbing solvent.
3.3.2 Evaluation of a swabbing system for a combined organic/inorganic swab for the recovery of explosive residues
3.3.2.1 Materials and chemicals
The details of swabs, testing surfaces, solutions of organic explosives, and other chemicals required for the quantitative analyses of organic explosives are provided in section 3.3.1.1.
Chapter 3
72
A stock solution of chlorate at a concentration of 2000 ppm in HPLC grade methanol was prepared from sodium chlorate (99.8% purity, Sigma-Aldrich Pty. Ltd., Castle Hill, NSW, Australia). A stock solution of nitrate at a concentration of 3000 ppm in HPLC grade methanol was prepared from ammonium nitrate (99.5% purity, ACS reagent grade, Sigma-Aldrich Pty. Ltd.). Chemicals required for the quantitative analyses of chlorate and nitrate are provided in section 2.4.2 (Chapter 2).
Analytical grade absolute ethanol (LabServ™, Biolab Australia Ltd., Clayton, VIC, Australia) was used to prepare a mixture of ethanol/water (1:1). HPLC grade isopropanol (Ajax Finechem Pty., Ltd., Taren Point, NSW, Australia) was used to prepare a mixture of isopropanol/water (7:3). High purity deionised water was obtained from a Satorius arium 611 water purification system.
3.3.2.2 Sample preparation
The preparation of a deposit of explosives onto both testing surfaces as described in section 3.3.1.2 was carried out with the amount of each explosive being as follows: 15 µL of the solution of PETN or TNT or RDX or chlorate; 20 µL for nitrate; and 30 µL for TATP (equivalent to 15 µg of PETN or TNT or RDX; 30 µg of TATP or chlorate; 60 µg of nitrate).
Cotton or polyester swabs in the dry state (without solvent) and moistened with acetonitrile, ethanol/water (1:1), isopropanol/water (7:3) and 100% deionised water were utilised for the collection of target compounds from the testing surfaces.
The surface sampling and extraction were carried out in the same way as mentioned in section 3.3.1.2, with a slight change in the solvent for swab extraction. In this part of the study, methanol was used for the extraction of the organic compounds, while deionised water was used for extraction of the inorganic compounds. The amount of organic target compound in the final solution was quantified using the same method described in section 3.2.1.2 and the analytical methods detailed in section 2.4.3 of Chapter 2 were used for the quantification of the amount of nitrate and chlorate in the final solution.
For the quantitative analyses, five-point calibration curves were used. These curves covered the concentration range of 0.2–3 ppm for PETN, TNT and RDX, 0.6–6 ppm for TATP, 1–6
Evaluation of various sampling media – the search for a universal swab
73
ppm for chlorate, and 1–12 ppm for nitrate. The curves were prepared on each day that samples analyses were conducted. Three replicate samples plus one negative control were employed for each type of surface, for each swab type, and for each solvent system evaluated.
3.3.2.3 Results
As demonstrated in Figure 3-8, dry cotton swabs were not effective in the recovery of both organic and inorganic compounds from glass surfaces. The highest recovery of most of the target compounds was achieved by swabbing with acetonitrile (except for the recovery of chlorate). A high recovery of all target compounds was also obtained using both mixtures of alcohol and water as the swabbing solvent. On the contrary, swabbing with dry cotton swabs performed well on the plastic surfaces with the highest recovery for most of the target compounds, especially TATP (Figure 3-9). A very low recovery of TATP was observed when isopropanol/water and pure deionised water were used as swabbing solvents.
Chapter 3
74
Cotton - Glass
Solvent
Dry ACN EtOH/W IPA/W Water
% c
olle
ctio
n ef
ficie
ncy
0
20
40
60
80
100
0
20
40
60
80
100
PETN TNT RDX TATP Chlorate Nitrate
Figure 3-8 Collection efficiency for the recovery of the six target compounds from the glass surface using cotton swabs with different swabbing solvents. The error bars were calculated from the standard deviation (1 SD) of the three replicate samples per experiment.
Evaluation of various sampling media – the search for a universal swab
75
Cotton - Plastic
Solvent
Dry ACN EtOH/W IPA/W Water
% c
olle
ctio
n ef
ficie
ncy
0
20
40
60
80
100
0
20
40
60
80
100
PETN TNT RDX TATP Chlorate Nitrate
* *
Figure 3-9 Collection efficiency for the recovery of the six target compounds from the plastic surface using cotton swabs with different swabbing solvents. The error bars were calculated from the standard deviation (1 SD) of the three replicate samples per experiment. The asterisk indicates where the amount of the target compound in the final solution was found to be lower than the limit of quantification of the analytical method employed.
Considering the results obtained using cotton swabs with various swabbing solvents, acetonitrile provided a good recovery for most of target compounds on both testing surfaces. An inconclusive result was obtained when a dry cotton swab was used. An evaluation of the recovery of target compounds on other types of surface is required to verify the efficiency of this swabbing system. As a result, dry cotton swabs and swabs moistened with acetonitrile were used for the evaluation in the next part of the study on more different types of surfaces.
With polyester swabs, the recovery of most of the target compounds (except TATP) using only deionised water as a swabbing solvent gave a surprisingly good result on both testing surfaces (Figures 3-10 and 3-11). Dry polyester swabs did not perform well, especially on the plastic surface where poor recoveries for TNT and TATP were found. Using the mixture of alcohol and water as a swabbing solvent provided a good recovery of all target compounds from the glass surface. However, there were some variations in the recovery among each target compound on the plastic surface. Overall, swabbing with acetonitrile was again
Chapter 3
76
demonstrated to be an efficient method on both testing surfaces and this was therefore considered to be the best compromise swabbing system for use with polyester swabs. In most case, swabbing on a glass surface with a solvent was found to improve the collection efficiency. The exception was with PETN. With PETN and when using a mixture of alcohol/water or using water alone, a marginally lower collection efficiency was observed compared to dry swabbing (see Figures 3-8 and 3-10). This may indicate that the swabbing solvent not only functions as a wetting agent but also contributes to overall recovery. Increasing the polarity of the swabbing solvent may cause a lower recovery due to the hydrophobicity of PETN (the octanol/water partition coefficient, Kow, is approximately 1–2 orders of magnitude higher than that for TNT and RDX [Tachon et al. 2008]).
Solvent effects are difficult to explain and confirm using the results from the plastic surface as the final recovery is influenced by the inconsistency in deposition of the target compounds on this surface (mentioned in section 3.3.1.3) and the semi-porous nature of the plastic film, which were not factors that were encountered with the glass surface.
Nevertheless, the solvent effect is not the only factor that determines the final collection efficiency. There are a number of factors involved in the swabbing process that combine to achieve the best collection efficiency. The sampling area (per swab) should not be too large. The morphology of the swabbing device should provide enough contact area when used with the right amount of applied force to create friction against the surface. A combination of correct solvent polarity and friction will promote detachment of the explosive particles from the surface. The morphology of the sampling media, and possibly the solvent, will then play a role in the capture of these detached particles by the sampling media.
Evaluation of various sampling media – the search for a universal swab
77
Polyester - Glass
Solvent
Dry ACN EtOH/W IPA/W Water
% c
olle
ctio
n ef
ficie
ncy
0
20
40
60
80
100
0
20
40
60
80
100
PETN TNT RDX TATP Chlorate Nitrate
Figure 3-10 Collection efficiency in the recovery of the six target compounds from the glass surface using polyester swabs with different swabbing solvents. The error bars were calculated from the standard deviation (1 SD) of the three replicate samples for each experiment.
Chapter 3
78
Polyester - Plastic
Solvent
Dry ACN EtOH/W IPA/W Water
% c
olle
ctio
n ef
ficie
ncy
0
20
40
60
80
100
0
20
40
60
80
100
PETN TNT RDX TATP Chlorate Nitrate
Figure 3-11 Collection efficiency for the recovery of the six target compounds from the plastic surface using polyester swabs with different swabbing solvents. The error bars were calculated from the standard deviation (1 SD) of the three replicate samples per experiment.
3.3.2.4 Conclusions
Acetonitrile was found to be an effective swabbing solvent for collecting both organic and inorganic explosive residues from all surface types tested, using either cotton or polyester swabs. The use of dry cotton swabs requires further study with other types of testing surfaces.
3.4 Evaluation of alcohol wipes for use as a universal swab for collecting explosive residues.
The last section of this chapter details the investigation of the potential use of alcohol wipes as a universal swab for the recovery of both organic and inorganic explosive residues in a single step. The collection efficiency of the two selected alcohol wipes as a sampling media were compared with the results obtained from the cotton and polyester swabs moistened with
Evaluation of various sampling media – the search for a universal swab
79
acetonitrile. Dry cotton swabs were also included in the comparison because of the inconclusive result referred to in the previous section. The recovery using direct solvent washing of the test surface was also used as a reference in the comparison to determine the most effective sampling media. It provided a value for the maximum recovery that could be obtained on that particular surface. Glass, plastic, aluminium foil and laminate were used as testing surfaces in this part of the study.
3.4.1 Experimental
3.4.1.1 Materials and chemicals
The details of sampling media (swabs and wipes), swabbing solvent, solutions of organic and inorganic explosives, and the other chemicals required for the quantitative analyses are provided in section 3.3.2.1.
Pathological grade premium microscope glass slides (dimensions: 7.6 × 2.5 cm, supplied by Livingstone International Pty. Ltd., Rosebery, NSW, Australia), clear polyethylene film (dimensions: 7.5 × 6 cm) cut from resealable plastic bags (supplied by Dowlings Canberra Pty. Ltd., Fyshwick, ACT, Australia), sheets of heavy duty catering aluminium foil (dimensions: 7.5 × 6 cm, obtained from Confoil Containers, Bayswater, VIC Australia) and laminate sheets (dimensions: 7.5 × 6 cm, Laminex® 200 White with natural finish; supplied by The Laminex group Pty. Ltd., Fyshwick, ACT, Australia) were used as the test surfaces. There was no pre-treatment on the glass and plastic surfaces before use. However, for the sheets of aluminium foil and laminate, the surface was cleaned using alcohol wipes and allowed to completely dry at room temperature before use in the testing.
3.4.1.2 Sample preparation
The same amount of explosive solution as mentioned in section 3.3.2.2 was applied to each test surface. For the plastic surface, the surface was wetted using alcohol wipes before adding the solution of explosive as mentioned in section 3.3.1.2. Each testing surface, after application of the explosive solution, was allowed to dry in a cupboard for 7 minutes. Selected swabs and wipes were applied to collect the residue and these swabs/wipes were then transferred to a glass vial. The subsequent extraction and quantification steps were carried out in the same way as detailed in section 3.3.2.2.
Chapter 3
80
Direct surface washing was carried out using 1 mL of methanol (for the organic target compounds) or deionised water (for the inorganic compounds). A glass funnel was used to collect the liquid and direct it into a 5 mL volumetric flask. Suitable internal standards were added (except for the case of TATP), and the solutions were then made up with suitable diluents and analysed as detailed in section 3.3.2.2
3.4.2 Results
As shown in Figure 3-12, most of the wipes and swabs performed well, with insignificant differences in the collection efficiency for both organic and inorganic compounds from glass surfaces. A low recovery of TATP was only encountered when using dry cotton swabs. The collection efficiencies for both the swabs and wipes were comparable to the values obtained using direct solvent washing. This indicated that the possible maximum recovery on the test surface (glass) was achieved by most of the selected sampling media.
Evaluation of various sampling media – the search for a universal swab
81
Glass
Was
h
RC
wip
es
Poly
Es w
ipes
Dry
cot
ton
AC
N c
otto
n
AC
N P
olyE
S
% c
olle
ctio
n ef
ficie
ncy
0
20
40
60
80
100
0
20
40
60
80
100
PETN TNT RDX TATP Chlorate Nitrate
Figure 3-12 Collection efficiency in the recovery of the six target compounds from glass surface using direct solvent washing and sampling by selected wipes and swabs with different swabbing solvents. The error bars were calculated from the standard deviation (1 SD) of the three replicate samples per experiment.
Dry cotton swabs produced a lower recovery of PETN, TNT and RDX from the aluminium foil test surface compared to other swabbing systems. Both alcohol wipes performed well in the recovery of both organic and inorganic compounds (Figure 3-13).
Chapter 3
82
Al foil
Was
h
RC
wip
es
Poly
Es w
ipes
Dry
cot
ton
AC
N c
otto
n
AC
N P
olyE
s
% c
olle
ctio
n ef
ficie
ncy
0
20
40
60
80
100
0
20
40
60
80
100
PETN TNT RDX TATP Chlorate Nitrate
Figure 3-13 Collection efficiency for the recovery of the six target compounds from aluminium foil sheets using direct solvent washing and sampling by selected wipes and swabs with different swabbing solvents. The error bars were calculated from the standard deviation (1 SD) of the three replicate samples per experiment.
Good recoveries of both organic and inorganic target compounds from the plastic sheet were also obtained using alcohol wipes. Although the collection efficiency of TATP was less than 40%, when compared to the value obtained by solvent washing it indicated that the possible maximum recovery was obtained. A lower recovery of chlorate was found when using both types of swabs compared to the result from the wipes (Figure 3-14). Sampling with dry cotton swabs also produced the lowest recovery of PETN and TNT.
Evaluation of various sampling media – the search for a universal swab
83
Plastic
Was
h
RC
wip
es
Poly
Es w
ipes
Dry
cot
ton
AC
N c
otto
n
AC
N P
olyE
s
% c
olle
ctio
n ef
ficie
ncy
0
20
40
60
80
100
0
20
40
60
80
100
PETN TNT RDX TATP Chlorate Nitrate
Figure 3-14 Collection efficiency for the recovery of the six target compounds from plastic sheets using direct solvent washing and sampling by selected wipes and swabs with different swabbing solvents. The error bars were calculated from the standard deviation (1 SD) of the three replicate samples per experiment.
The question regarding the efficiency of the dry cotton swabs was clearly answered with the results from the laminate surfaces. The lowest recoveries of most of the target compounds were obtained when using the dry cotton swabs (Figure 3-15). The highest recoveries for all the target compounds were still found when using both types of alcohol wipes as the sampling media. As already mentioned for the plastic surfaces, the collection efficiency of both types of swabs for the recovery of chlorate was found to be lower compared to alcohol wipes.
Chapter 3
84
Laminate
Was
h
RC
wip
es
Poly
Es w
ipes
Dry
cot
ton
AC
N c
otto
n
AC
N P
olyE
s
% c
olle
ctio
n ef
ficie
ncy
0
20
40
60
80
100
0
20
40
60
80
100
PETN TNT RDX TATP Chlorate Nitrate
Figure 3-15 Collection efficiency in the recovery of the six target compounds from laminate sheets using direct solvent washing and sampling by selected wipes and swabs with different swabbing solvents. The error bars were calculated from the standard deviation (1 SD) of the three replicate samples per experiment.
3.4.3 Conclusions
The selected alcohol wipes demonstrated better overall performance in the recovery of both the organic and inorganic compounds from each of the test surfaces compared to the results obtained using swabs. This type of sampling media shows significant potential for use as a combined organic/inorganic swab for explosive residue collection and subsequent analysis.
The evaluation of dry cotton swabs ceased at this point due to the results of the experiments on the additional test surfaces. The results indicated that it was not an effective swabbing system for the collection of both organic and inorganic explosive residues on common substrates.
Evaluation of various sampling media – the search for a universal swab
85
3.5 References
Blackwood, L.G., Gresham, G.L., Larson, R.A. & Rae, C. 1995, 'Surface contamination of electronic threat devices prepared with composition C-4 plastic explosives', Paper presented at The 5th international symposium on analysis and detection of explosives, Washington, D.C., 4-8 December 1995.
Crowson, C.A., Cullum, H.E., Hiley, R.W. & Lowe, A.M. 1996, 'A survey of high explosives traces in public places', Journal of Forensic Science, vol. 41, no. 6, pp. 980-989.
Douse, J.M.F. 1982, 'Trace analysis of explosives in handswabs extracts using Amberlite XAD-7 porous polymer beads, silica capillary column gas chromatography with electron-capture detection and thin-layer chromatography', Journal of Chromatography, vol. 234, no. 2, pp. 415-425.
Douse, J.M.F. 1985, 'Trace analysis of explosives at the low nanogram level in handswab extracts using columns of Amberlite XAD-7 porous polymer beads and silica capillary column gas chromatography with thermal energy analysis and electron capture detection', Journal of Chromatography, vol. 328, pp. 155-165.
Hobbs, J.R. & Conde, E.P. 1998, 'Methodologies for sampling explosives on surfaces', Paper presented at The 6th International Symposium on Analysis and Detection of Explosives Prague, Czech Republic, 6-10 July 1998.
Laposata, E.A. 1985, 'Collection of trace evidence from bombing victims at autopsy', Journal of Forensic Science, vol. 30, no. 3, pp. 789-797.
Laza, D., Nys, B., De Kinder, J., Kirsch-De Mesmaeker, A. & Moucheron, C. 2007, 'Development of a quantitative LC-MS/MS method for the analysis of common propellant powder stabilizers in gunshot residue', Journal of Forensic Science, vol. 52, no. 4, pp. 842-850.
Lloyd, J.B.F. 1986, 'Liquid chromatography of firearms propellants traces', Journal of Energetic Materials, vol. 4, no. 1-4, pp. 239-271.
Lloyd, J.B.F. & King, R.M. 1990, 'One-pot processing of swabs for organic explosives and firearms residue traces', Journal of Forensic Science, vol. 35, no. 4, pp. 956-959.
Neudorfl, P., Mccooeye, M.A. & Elias, L. 1993, 'Testing protocol for surface-sampling detectors', in Advances in analysis and detection of explosives : proceedings of the 4th International Symposium on Analysis and Detection of Explosives, September 7-10, 1992, Jerusalem, Israel, Yinon, J., ed. Dordrecht, Netherland: Kluwer Academic, pp. 373-384.
Oxley, J.C., Smith, J.L., Resende, E., Pearce, E. & Chamberlain, T. 2003, 'Trends in explosive contamination', Journal of Forensic Science, vol. 48, no. 2, pp. 334-342.
Chapter 3
86
Perret, D., Marchese, S., Gentili, A., Curini, R., Terracciano, A., Bafile, E. & Romolo, F. 2008, 'LC–MS–MS Determination of stabilizers and explosives residues in hand-swabs', Chromatographia, vol. 68, no. 7-8, pp. 517-524.
Romolo, F.S., Cassioli, L., Grossi, S., Cinelli, G., Notardonato, I. & Russo, M.V. 2010, 'Surface-sampling and analysis of TATP by gas chromatography/mass spectrometry', Paper presented at The 10th International Symposium on the Analysis and Detection of Explosives, Canberra, Australia, 22-25 November 2010.
Russell, L.W. 1984, 'The universal hand-swab — Does it exist ?', Journal of the Forensic Science Society, vol. 24, no. 4, p. 349.
Sigman, M.E. & Ma, C.-Y. 1999, 'In-injection port thermal desorption for explosives trace evidence analysis', Analytical Chemistry, vol. 71, no. 19, pp. 4119-4124.
Tachon, R., Pichon, V., Le Borgne, M.B. & Minet, J.-J. 2008, 'Comparison of solid-phase extraction sorbents for sample clean-up in the analysis of organic explosives', Journal of Chromatography A, vol. 1185, no. 1, pp. 1-8.
Thompson, R.Q., Fetterolf, D.D., Miller, M.L. & Mothershead, R.F. 1999, 'Aqueous recovery from cotton swabs of organic explosives residue followed by solid phase extraction', Journal of Forensic Science, vol. 44, no. 4, pp. 795-804.
Twibell, J.D., Home, J.M., Smalldon, K.W., Higgs, D.G. & Hayes, T.S. 1982, 'Assessment of solvents for the recovery of nitroglycerine from hands using cotton swabs', Journal of Forensic Science, vol. 27, no. 4, pp. 792-800.
Twibell, J.D., Turner, S.L., Smalldon, K.W. & Higgs, D.G. 1984, 'The persistence of military explosives on hands', Journal of Forensic Science, vol. 29, no. 1, pp. 284-290.
Waddell, R., Dale, D.E., Monagle, M. & Smith, S.A. 2005, 'Determination of nitroaromatic and nitramine explosives from a PTFE wipe using thermal desorption-gas chromatography with electron-capture detection', Journal of Chromatography A, vol. 1062, no. 1, pp. 125-131.
Wallace, J.S. & Mckeown, W.J. 1993, 'Sampling procedures for firearms and/or explosives residues ', Journal of the Forensic Science Society, vol. 33, no. 2, pp. 107-116.
Warren, D., Hiley, R.W., Phillips, S.A. & Ritchie, K. 1999, 'Novel technique for the combined recovery, extraction and clean-up of forensic organic and inorganic trace explosives samples', Science & Justice, vol. 39, no. 1, pp. 11-18.
Zeichner, A., Abramovich-Bar, S., Tamiri, T. & Almog, J. 2009, 'A feasibility study on the use of double-sided adhesive coated stubs for sampling of explosive traces from hands', Forensic Science International, vol. 184, no. 1-3, pp. 42-46.
87
CHAPTER 4 OPTIMISATION OF THE SWAB EXTRACTION AND CLEAN-UP PROCEDURE
In the previous chapter, several swabs and wipes were evaluated for their potential use in the collection of both organic and inorganic explosive residues. The next stage in the development of a complete universal sampling protocol is to optimise all subsequent steps of the protocol to ensure that all of the target explosives collected onto the sampling medium are transferred into the extract. Any co-extracted interfering compounds are then removed before the extract is subjected to the final instrumental analysis for identification.
This chapter is comprised of two sections. The first part involves the determination of the composition of the mixture of various organic solvents and water for a single step extraction of both organic and inorganic explosives from the sampling media. The second part describes the evaluation and optimisation of the clean-up procedure for the swab extracts utilising several commercially available solid-phase extraction (SPE) cartridges.
4.1 A single step swab extraction for the combined recovery of organic and inorganic explosives
By using a universal swabbing system, both organic and inorganic explosive residues are targeted for collection on a single swab. The traditional sequential extraction method using the different polarity solvents is not ideal, as the loss of certain compounds or groups of compounds is likely to occur especially if the wrong sequence of extraction is applied. In order to achieve an effective single step solvent extraction for both organic and inorganic compounds from a sampling media, the composition of the extracting solvent needs to be investigated and optimised.
Chapter 4
88
Solvents containing water and various percentages of organic solvents (i.e. acetone, acetonitrile or methanol) were used in this study. The three organic solvents have already demonstrated their high extraction efficiency for the four representative organic compounds (Chapter 3, section 3.2). Six different compositions of the extracting solvent (0, 20, 40, 60, 80 and 100% v/v of organic solvent with water) were used to extract the representative explosive compounds from all of the selected wipes and swabs. Unfortunately, due to time constraints, the extraction of the two representative inorganic explosives was only performed from polyester wipes. There were several reasons for selecting polyester wipe. As shown in section 3.4 of Chapter 3, the wipes demonstrated a better performance than the swabs in the recovery of both organic and inorganic compounds. In a comparison between the two types of alcohol wipes, the polyester wipe was found to be more robust and not as easily ripped as the regenerated cellulose wipe. In addition, the polyester wipes could be further compacted in the glass vials, thus occupying less volume, and resulting in a higher recovery. The processing of a wipe inside the glass vial was also easier due to the extra space. The unexplained low recovery of TNT from regenerated cellulose wipes utilising acetone was also taken into account in making the decision to test the recovery of inorganic compounds only from the polyester wipes.
4.1.1 Experimental
4.1.1.1 Materials and chemicals
Details of all the sampling media (wipes and swabs), standard solutions of organic explosives, the three organic solvents used for extraction and the other chemicals required for the quantitative analyses have already been provided in section 3.2.1.1 of Chapter 3. The preparation of the stock solution of inorganic compounds was detailed in section 3.3.2.1 of Chapter 3. High purity water, obtained from a Satorius arium 611 water purification system, was used to prepare the mixtures of extracting solvents.
4.1.1.2 Sample preparation
The details of the sample preparation and the quantification of the organic compounds were the same as those described in section 3.2.1.2 of Chapter 3.
Optimisation of the swab extraction and clean-up procedure
89
For evaluation of the extraction of the inorganic compounds, 15 µL of a stock solution of chlorate at a concentration of 2000 ppm in methanol or a 20 µL of stock solution of nitrate at a concentration of 3000 ppm in methanol was deposited onto a polyester wipe (equivalent to 30 µg of chlorate and 60 µg of nitrate, respectively). The wipes were allowed to dry in a fume cupboard for 15 minutes and each wipe was then transferred into a 4 mL clear glass vial. The extracting solvent was then added to each glass vial and the extraction and quantification of the target compound were carried out in the same manner as described in section 3.2.1.2. The five-point calibration curve for quantitative analyses covered the concentration range of 1–6 ppm for chlorate and 1–12 ppm for nitrate. The curves were prepared each day that sample analyses were conducted.
There were three replicate samples and one negative control for each composition of extracting solvent tested with each wipe or swab.
4.1.2 Results
In the attempted extraction of PETN from all the selected sampling media, it was found that the percentage recovery increased as the proportion of organic solvent in the extracting solvent became higher. Using a mixture of acetone and water, the maximum recovery from both the polyester wipe and the swab was reached when the composition of the extracting solvent contained more than 40% acetone. For the regenerated cellulose wipe and cotton swab, 60% or more of acetone was required in order to obtain a good recovery (Figure 4-1).
Chapter 4
90
PETN - RC wipe
% Acetone
0 20 40 60 80 100
% R
ecov
ery
0
20
40
60
80
100
0
20
40
60
80
100
PETN - PolyEs wipe
% Acetone
0 20 40 60 80 1000
20
40
60
80
100
% R
ecov
ery
0
20
40
60
80
100
PETN - Cotton swab
% Acetone
0 20 40 60 80 100
% R
ecov
ery
0
20
40
60
80
100
0
20
40
60
80
100
PETN - PolyEs swab
% Acetone
0 20 40 60 80 1000
20
40
60
80
100
% R
ecov
ery
0
20
40
60
80
100
Figure 4-1 Extraction profiles for PETN from selected wipes and swabs using a mixture of acetone and water at various compositions. The error bars represent the standard deviation (1 SD) of three replicate samples per experiment.
Optimisation of the swab extraction and clean-up procedure
91
Using an extracting solvent that contained 40% or more of acetonitrile in water was found to provide the maximum recovery for PETN from all the wipes and swabs (Figure 4-2). However, in the case of methanol, a proportion of 60% or more of methanol was required in the extracting solvent in order to achieve maximum recovery (Figure 4-3).
PETN - RC wipe
% ACN
0 20 40 60 80 100
% R
ecov
ery
0
20
40
60
80
100
0
20
40
60
80
100
PETN - PolyEs wipe
% ACN
0 20 40 60 80 1000
20
40
60
80
100
% R
ecov
ery
0
20
40
60
80
100
PETN - Cotton swab
% ACN
0 20 40 60 80 100
% R
ecov
ery
0
20
40
60
80
100
0
20
40
60
80
100
PETN - PolyEs swab
% ACN
0 20 40 60 80 1000
20
40
60
80
100
% R
ecov
ery
0
20
40
60
80
100
Figure 4-2 Extraction profiles for PETN from selected wipes and swabs using a mixture of acetonitrile and water at various compositions. The error bars represent the standard deviation (1 SD) of three replicate samples per experiment.
Chapter 4
92
PETN - RC wipe
% MeOH
0 20 40 60 80 100
% R
ecov
ery
0
20
40
60
80
100
0
20
40
60
80
100
PETN - PolyEs Wipe
% MeOH
0 20 40 60 80 1000
20
40
60
80
100
% R
ecov
ery
0
20
40
60
80
100
PETN - Cotton swab
% MeOH
0 20 40 60 80 100
% R
ecov
ery
0
20
40
60
80
100
0
20
40
60
80
100
PETN - PolyEs swab
% MeOH
0 20 40 60 80 1000
20
40
60
80
100
% R
ecov
ery
0
20
40
60
80
100
Figure 4-3 Extraction profiles for PETN from selected wipes and swabs using a mixture of methanol and water at various compositions. The error bars represent the standard deviation (1 SD) of three replicate samples per experiment.
Optimisation of the swab extraction and clean-up procedure
93
An anomolous extraction profile was observed in the attempted recovery of TNT from the regenerated cellulose wipes using a mixture of acetone and water. There was a slight increase in recovery when a higher portion of acetone in the extracting solvent was applied. However, when the composition of the solvent was greater than 80% acetone, a considerable drop in recovery was observed (Figure 4-4). This low recovery was still observed when the extraction was repeated on two other occasions. From these results, there is an indication of some interaction (such as selective binding) between TNT and regenerated cellulose. It appears that the extracting solvent needs to have a relatively high polarity in order to break this interaction. Attempts to extract with acetone from different suppliers and also the use of a sequential extraction using acetone followed by acetonitrile gave inconclusive results. This requires further investigation in order to determine the nature of this phenomenon.
Chapter 4
94
TNT - RC wipe
% Acetone
0 20 40 60 80 100
% R
ecov
ery
0
20
40
60
80
100
0
20
40
60
80
100TNT - PolyEs wipe
% Acetone
0 20 40 60 80 1000
20
40
60
80
100
% R
ecov
ery
0
20
40
60
80
100
TNT - Cotton swab
% Acetone
0 20 40 60 80 100
% R
ecov
ery
0
20
40
60
80
100
0
20
40
60
80
100TNT - PolyEs swab
% Acetone
0 20 40 60 80 1000
20
40
60
80
100
% R
ecov
ery
0
20
40
60
80
100
Figure 4-4 Extraction profiles for TNT from selected wipes and swabs using a mixture of acetone and water at various compositions. The error bars represent the standard deviation (1 SD) of three replicate samples per experiment. For the 80 and 100 % acetone recoveries from regenerated cellulose wipes, the error bars represent the standard deviation (1 SD) from six and nine replicate samples, respectively.
An increase in the recovery of TNT from cotton swabs was observed as the proportion of acetone in the extracting solvent increased. Maximum recovery could be achieved when a solvent containing more than 80% acetone was applied. In the cases of both the polyester wipe and swab, there was no significant change in the recovery of TNT across the testing range of acetone/water compositions (Figure 4-4).
Optimisation of the swab extraction and clean-up procedure
95
TNT - RC wipe
% ACN
0 20 40 60 80 100
% R
ecov
ery
0
20
40
60
80
100
0
20
40
60
80
100
TNT - PolyEs wipe
% ACN
0 20 40 60 80 1000
20
40
60
80
100
% R
ecov
ery
0
20
40
60
80
100
TNT - Cotton swab
% ACN
0 20 40 60 80 100
% R
ecov
ery
0
20
40
60
80
100
0
20
40
60
80
100
TNT - PolyEs swab
% ACN
0 20 40 60 80 1000
20
40
60
80
100
% R
ecov
ery
0
20
40
60
80
100
Figure 4-5 Extraction profiles for TNT from selected wipes and swabs using a mixture of acetonitrile and water at various compositions. The error bars represent the standard deviation (1 SD) of three replicate samples per experiment.
A slight improvement in the recovery of TNT from most of the wipes and swabs was observed when the extracting solvent contained a higher proportion of acetonitrile or methanol (Figures 4-5 and 4-6). The high recovery of TNT (more than 60%) using only deionised water (i.e. 100% water) as an extracting solvent should also be highlighted. This result correlates with the intermediate hydrophobicity of TNT (log Kow = 1.6). Also, the high recovery of RDX when extracted with deionised water (Figures 4-7 – 4-9) could be explained in the same way based on its low hydrophobicity (log Kow = 0.87).
Chapter 4
96
TNT - RC wipe
% MeOH
0 20 40 60 80 100
% R
ecov
ery
0
20
40
60
80
100
0
20
40
60
80
100TNT - PolyEs wipe
% MeOH
0 20 40 60 80 1000
20
40
60
80
100
% R
ecov
ery
0
20
40
60
80
100
TNT - Cotton swab
% MeOH
0 20 40 60 80 100
% R
ecov
ery
0
20
40
60
80
100
0
20
40
60
80
100
TNT - PolyEs swab
% MeOH
0 20 40 60 80 1000
20
40
60
80
100
% R
ecov
ery
0
20
40
60
80
100
Figure 4-6 Extraction profiles for TNT from selected wipes and swabs using a mixture of methanol and water at various compositions. The error bars represent the standard deviation (1 SD) of three replicate samples per experiment.
Optimisation of the swab extraction and clean-up procedure
97
A very good recovery of RDX from both types of alcohol wipes and the polyester swab was observed regardless of the composition of the extracting solvent and the type of organic solvent used (Figures 4-7 to 4-9). With respect to the extraction of RDX from cotton swabs, an improvement in recovery was found when an extracting solvent with a higher portion of acetone or acetonitrile were utilised. This was not the case with methanol, where no significant change in recovery was obtained when extracting with different compositions of that solvent.
RDX - RC wipe
% Acetone
0 20 40 60 80 100
% R
ecov
ery
0
20
40
60
80
100
0
20
40
60
80
100
RDX - PolyEs wipe
% Acetone
0 20 40 60 80 1000
20
40
60
80
100
% R
ecov
ery
0
20
40
60
80
100
RDX - Cotton swab
% Acetone
0 20 40 60 80 100
% R
ecov
ery
0
20
40
60
80
100
0
20
40
60
80
100RDX - PolyEs swab
% Acetone
0 20 40 60 80 1000
20
40
60
80
100
% R
ecov
ery
0
20
40
60
80
100
Figure 4-7 Extraction profiles for RDX from selected wipes and swabs using a mixture of acetone and water at various compositions. The error bars represent the standard deviation (1 SD) of three replicate samples per experiment.
Chapter 4
98
RDX - RC wipe
% ACN
0 20 40 60 80 100
% R
ecov
ery
0
20
40
60
80
100
0
20
40
60
80
100
RDX - PolyEs wipe
% ACN
0 20 40 60 80 1000
20
40
60
80
100
% R
ecov
ery
0
20
40
60
80
100
RDX - Cotton swab
% ACN
0 20 40 60 80 100
% R
ecov
ery
0
20
40
60
80
100
0
20
40
60
80
100
RDX - PolyEs swab
% ACN
0 20 40 60 80 1000
20
40
60
80
100
% R
ecov
ery
0
20
40
60
80
100
Figure 4-8 Extraction profiles for RDX from selected wipes and swabs using a mixture of acetonitrile and water at various compositions. The error bars represent the standard deviation (1 SD) of three replicate samples per experiment.
Optimisation of the swab extraction and clean-up procedure
99
RDX - RC wipe
% MeOH
0 20 40 60 80 100
% R
ecov
ery
0
20
40
60
80
100
0
20
40
60
80
100
RDX - PolyEs wipe
% MeOH
0 20 40 60 80 1000
20
40
60
80
100
% R
ecov
ery
0
20
40
60
80
100
RDX - Cotton swab
% MeOH
0 20 40 60 80 100
% R
ecov
ery
0
20
40
60
80
100
0
20
40
60
80
100
RDX - PolyEs swab
% MeOH
0 20 40 60 80 1000
20
40
60
80
100
% R
ecov
ery
0
20
40
60
80
100
Figure 4-9 Extraction profiles for RDX from selected wipes and swabs using a mixture of methanol and water at various compositions. The error bars represent the standard deviation (1 SD) of three replicate samples per experiment.
Chapter 4
100
In general, an improvement in the extraction efficiency of TATP was found to be correlated to the higher portion of organic solvent in the extracting solvent. However, the magnitude of the improvement was found to be strongly dependant on the type of sampling media used. A small change in the level of improvement was found in the case of an extraction from a polyester swab while a considerable change in recovery was observed in the extraction from a cotton swab (Figures 4-10 to 4-12).
TATP - RC wipe
% Acetone
0 20 40 60 80 100
% R
ecov
ery
0
20
40
60
80
100
0
20
40
60
80
100
TATP - PolyEs wipe
% Acetone
0 20 40 60 80 1000
20
40
60
80
100
% R
ecov
ery
0
20
40
60
80
100
TATP - Cotton swab
% Acetone
0 20 40 60 80 100
% R
ecov
ery
0
20
40
60
80
100
0
20
40
60
80
100
TATP - PolyEs swab
% Acetone
0 20 40 60 80 1000
20
40
60
80
100
% R
ecov
ery
0
20
40
60
80
100
Figure 4-10 Extraction profiles for TATP from selected wipes and swabs using a mixture of acetone and water at various compositions. The error bars represent the standard deviation (1 SD) of three replicate samples per experiment.
Optimisation of the swab extraction and clean-up procedure
101
TATP - RC wipe
% ACN
0 20 40 60 80 100
% R
ecov
ery
0
20
40
60
80
100
0
20
40
60
80
100
TATP - PolyEs wipe
% ACN
0 20 40 60 80 1000
20
40
60
80
100
% R
ecov
ery
0
20
40
60
80
100
TATP - Cotton swab
% ACN
0 20 40 60 80 100
% R
ecov
ery
0
20
40
60
80
100
0
20
40
60
80
100
TATP - PolyEs swab
% ACN
0 20 40 60 80 1000
20
40
60
80
100
% R
ecov
ery
0
20
40
60
80
100
Figure 4-11 Extraction profiles for TATP from selected wipes and swabs using a mixture of acetonitrile and water at various compositions. The error bars represent the standard deviation (1 SD) of three replicate samples per experiment.
Chapter 4
102
TATP - RC wipe
% MeOH
0 20 40 60 80 100
% R
ecov
ery
0
20
40
60
80
100
0
20
40
60
80
100
TATP - PolyEs wipe
% MeOH
0 20 40 60 80 1000
20
40
60
80
100
% R
ecov
ery
0
20
40
60
80
100
TATP - Cotton swab
% MeOH
0 20 40 60 80 100
% R
ecov
ery
0
20
40
60
80
100
0
20
40
60
80
100
TATP - PolyEs swab
% MeOH
0 20 40 60 80 1000
20
40
60
80
100
% R
ecov
ery
0
20
40
60
80
100
Figure 4-12 Extraction profiles for TATP from selected wipes and swabs using a mixture of methanol and water at various compositions. The error bars represent the standard deviation (1 SD) of three replicate samples per experiment.
Due to time constraints, the effect of the composition of extracting solvent on the extraction efficiency of the two representative inorganic compounds (chlorate and nitrate) was conducted only with the polyester wipes. The reasons for selecting polyester have already been mentioned at the beginning of section 4.1.
The extraction profile for chlorate from polyester wipes was found to fluctuate with the increase in the amount of acetone in the extracting solvent. First, a decrease in recovery was found when the range of acetone in the extracting solvent was from zero to approximately 40%. Then the recovery gradually improved, and this continued until the extracting solvent contained more than 60% acetone. A sharp drop in recovery was then observed when extracting with a solvent containing more than 80% acetone (Figure 4-13). A similar extraction profile was also obtained when using a mixture of acetonitrile and water. However,
Optimisation of the swab extraction and clean-up procedure
103
no change in recovery was observed when extracting with various compositions of a mixture containing methanol and water (Figure 4-13).
Chlorate - PolyEs wipe
% Acetone
0 20 40 60 80 100
% R
ecov
ery
0
20
40
60
80
100
0
20
40
60
80
100
Chlorate - PolyEs wipe
% ACN
0 20 40 60 80 1000
20
40
60
80
100
% R
ecov
ery
0
20
40
60
80
100
Chlorate - PolyEs Wipe
% MeOH
0 20 40 60 80 100
% R
ecov
ery
0
20
40
60
80
100
0
20
40
60
80
100
Figure 4-13 Extraction profile for chlorate from polyester wipes using various compositions of water and organic solvents (acetone, acetonitrile or methanol). The error bars represent the standard deviation (1 SD) of three replicate samples per experiment.
Chapter 4
104
There was no difference in the recovery of nitrate from the polyester wipes using an extracting solvent containing acetone in the zero to 80% range. However, a sudden drop in recovery was observed when 100% acetone was used as a solvent. The same extraction profile was also obtained using a mixture of acetonitrile and water (Figure 4-14). That sharp drop in recovery was not observed in the case of methanol.
The sudden decrease in recoveries when extracting the two inorganic target compounds with pure acetone or acetonitrile results from the limited solubility of sodium chlorate and ammonium nitrate (used in the preparation of the inorganic standard solutions) in those two organic solvents. However, sodium chlorate and ammonium nitrate have good solubility in methanol therefore no change in recoveries was observed when using pure methanol as the extraction solvent.
Nitrate - PolyEs wipe
% Acetone
0 20 40 60 80 100
% R
ecov
ery
0
20
40
60
80
100
0
20
40
60
80
100
Nitrate - PolyEs wipe
% ACN
0 20 40 60 80 1000
20
40
60
80
100
% R
ecov
ery
0
20
40
60
80
100
Nitrate - PolyEs Wipe
% MeOH
0 20 40 60 80 100
% R
ecov
ery
0
20
40
60
80
100
0
20
40
60
80
100
Figure 4-14 Extraction profiles for nitrate from polyester wipes using various compositions of water and organic solvents (acetone, acetonitrile or methanol). The error bars represent the standard deviation (1 SD) of three replicate samples per experiment.
Optimisation of the swab extraction and clean-up procedure
105
4.1.3 Conclusions
The recovery of the six representative explosive compounds from the swabs and wipes using a range of water/organic solvent mixtures was studied in order to ascertain the optimum composition for the extracting solvent. Ideally, the composition would efficiently recover both organic and inorganic compounds. In general, the most significant change in the extraction efficiency was observed in the case of PETN. The composition of the extracting solvent had to contain at least 40% by volume of acetone or acetonitrile or 60% by volume of methanol in order to obtain a good recovery. In most cases, these compositions were also found to provide good recovery for TNT, RDX and TATP. For the extraction of the inorganic compounds, recovery dropped dramatically when the extracting solvent contained more than 80% of acetone or acetonitrile. However, this drop in recovery was not observed when using methanol. A mixture of acetone and water generated a parabolic extraction profile for chlorate. The minimum recovery for chlorate was obtained when the extracting solvent contained acetone in a range between 20 and 60%; however, a good recovery of organic explosives was attained in this range. Therefore a mixture containing acetone and water could not be utilised for a single step extraction of both organic and inorganic compounds.
In conclusion, a single step extraction for both organic and inorganic compounds could be achieved using an extracting solvent containing water and at least 40% v/v of acetonitrile or 60% v/v methanol. These solvent compositions were therefore chosen for the optimisation of the clean-up procedure outlined in the next section.
4.2 Evalution and optimisation of a clean-up procedure for extracts obtained from universal swabs
The key to the successful detection of trace quantities of explosives in a highly contaminated environment not only relies on a sensitive analytical technique but also requires compatible clean-up procedures in order to provide purification and concentration of the analyte of interest. The adsorption of trace explosives from a solvent extract onto a solid sorbent is commonly used to achieve this.
An acrylate porous polymer, named Amberlite XAD-7, was first introduced to recover organic explosives from hand swabs in 1982 by the Metropolitan Police Forensic Science
Chapter 4
106
Laboratory [Douse 1982]. A further development of that method in 1985 introduced the use of a form of microcolumn extraction to make the process more convenient [Douse 1985]. With the increasing variety of porous polymer resins available on the market, their potential use in the area of trace explosive analysis was assessed by the Home Office Forensic Science Laboratory, UK [Lloyd 1985]. The conclusion of the Home Office study was that no specific affinity was involved in the purification process. Polar adsorbents should be applicable for the pre-concentration of most polar organic explosives; however, most of the publications on this topic by the same authors in the field of explosive residue analysis only refer to the use of Chromosorb 104 for the clean-up of hand swab extracts [Lloyd 1987, Lloyd & King 1989, Lloyd & King 1990, Lloyd 1991]. Work conducted by the Forensic Explosives Laboratory (Defence Science & Technology Laboratory; DSTL) in the UK also mentions the use of Chromosorb 104 for the clean-up of extracts from combined organic/inorganic swabs, even though the recovery was claimed to be lower than that obtained with XAD-7 [Warren et al. 1999]. No actual data was presented and no explanation was provided to address this inconsistency. However, work conducted by the Israeli Police has demonstrated the successful application of a microcolumn packed with XAD-7 for the purification of extracts recovered from post-explosion debris [Tamiri 1995].
Many studies have evaluated various commercial prepacked solid-phase extraction (SPE) cartridges to establish a clean-up method for explosive residue analysis. Strobel and Tontarski [1983] developed a procedure using a cyclohexyl and cyanopropyl column coupled in tandem. Kolla [1991] claimed that the aforementioned method was not practical. By using only an ordinary ODS column, the author was able to recover RDX, TNT and PETN (with more than 50% recovery) from simulated explosion debris.
With the benefit of good chemical stability and the wide range of selectivity of polymeric sorbents now available in prepacked cartridges, several studies have shifted their interest from typical bonded silica to polymeric resins for the preparation of samples for explosive residue analysis. Thompson and colleagues [1999] compared three hydrophilic polymeric sorbents and found no significant differences in the recovery of explosive standards; however, Oasis HLB (a copolymer between divinylbenzene and N-methylpyrrolidone) was selected due to its ease in optimisation with the author’s automated SPE system. Recently, Tachon and colleagues [2008] compared Oasis HLB with three other reverse-phase SPE sorbents including C18 bonded silica cartridges for the clean-up of a methanolic extract from motor oil spiked with eleven explosive compounds. The results confirmed that the efficiency in
Optimisation of the swab extraction and clean-up procedure
107
retention of high polar explosives, such as nitramines, on polymeric sorbents is better than on bonded silica phases and a cleaner extract could be obtained with an Oasis HLB cartridge.
In this study, a solid-phase extraction technique was not only applied for the removal of co-extracted interfering compounds and the pre-concentration of the compound of interest, but also separation of the swab extract into organic and inorganic compounds. The sorbent inside the SPE cartridge retains organic explosives while inorganic explosive compounds pass through for collection and analysis. Washing solvents can then be flushed through the cartridge to remove interfering compounds and the organic explosives finally elute from the cartridge with the aid of an eluting solvent. The concept of using SPE for the two functions of separation and clean-up of explosive extracts was first proposed by the Forensic Explosive Laboratory in the UK [Warren et al. 1999].
In theory, the composition of a solution before loading it onto a reverse-phase type SPE cartridge should not contain more than 10% of organic solvent in order to promote an adsorption of the analyte. However, as indicated in the previous section, in order to extract both organic and inorganic compounds within a single step, the final swab extract should contain at least 40% of acetonitrile or at least 60% of methanol. Diluting the extract with water is not recommended as it lowers the concentration of the already trace quantity of explosive in the extract. Also, there is a greater chance of the compound of interest being lost due to breakthrough as a consequence of loading the SPE cartridge with a larger volume of solution. Therefore, where the sample matrix contains a large portion of organic solvent, the retention capacity of the cartridge should firstly be assessed. The cartridge that retains organic explosives in a matrix containing a large portion of organic solvent can then be selected for optimisation and the development of a suitable clean-up procedure.
Four commercially available SPE cartridges – namely Oasis HLB, Isolute® C18, Bond-Elut® ENV and ABS ELUT Nexus – were evaluated and compared to results from a cartridge packed with XAD-7, which was prepared in-house. Although previous studies have demonstrated the poor retention capacity of a typical C18 cartridge, the selected Isolute® C18 cartridge contained non end-capped silica, which made it different from other C18s. It was envisaged that the extra retention of a polar organic compound might be achievable with the additional interactions from the residual silanol group.
Chapter 4
108
Bond-Elut® ENV is a high purity styrene-divinylbenzene copolymer which the manufacturer claims has been optimised for the extraction of polar organic residues, such as herbicides, metabolites and explosives. Also, many studies in the area of trace analysis of explosives in environmental samples have demonstrated the successful recovery of a wide range of explosives with this type of polymeric resin [Richard & Junk 1986, Jenkins et al. 1994, Liu et al. 2007].
ABS ELUT Nexus is a copolymer between methyl methacrylate and divinylbenzene. To the best of the author’s knowledge, Nexus is the only commercially available prepacked cartridge that contains an acrylate ester functional group, which is close to the functional group of XAD-7 resin. Also, several studies have demonstrated that this resin has the potential for use in the recovery of explosive compounds either in a gas or liquid phase [Batlle et al. 2003, Jönsson, Gustavsson & van Bavel 2007]. The chemical structures for the selected sorbents are shown in Figure 4-15.
Optimisation of the swab extraction and clean-up procedure
109
Figure 4-15 Chemical structure of selected sorbents.
4.2.1 Assessment of the retention capacity of the selected sorbents
The general method of ascertaining the retention capacity of a SPE cartridge is to determine its breakthrough volume by continuously loading a constant volume of the testing solution until the compound of interest is detected in the effluent. However, this method is unrealistic in the case of swab extracts where the loading volume would be in the range of a couple of millilitres at most. In this study, another approach was applied, wherby a series of washing solutions with different elution strengths was loaded to assess the retention capacity of each SPE cartridge. Three organic explosive compounds (PETN, TNT and RDX) were used to evaluate the retention property of the selected sorbents. Various compositions of a mixture of water and methanol were used as washing solvents. The reason for choosing methanol was its compatibility with the HPLC mobile phase used in the quantification step. Also in a reverse
O
O
O
CH3
O
CH3
CH3
OOCH3
Bond-Elut ENV XAD-7 ABS ELUT Nexus
NO
N O
Oasis HLB
Si OO
Si OH
Si (CH2)17CH3
Isolute C18
Chapter 4
110
phase extraction system, methanol has a lower elution strength compared to acetonitrile and acetone. By using a low elution strength solvent, this might provide the benefit of recognising small differences in the retention behaviour of compounds among the selected sorbents.
4.2.1.1 Materials and chemicals
Isolute® C18 500 mg packed in a 3 mL cartridge was supplied by BioLab Australia Pty., Ltd. (Scoresby, VIC, Australia). Bond-Elut® ENV 60 mg packed in a 3 mL cartridge and ABS ELUT Nexus 60 mg packed in a 3 mL cartridge both were purchased from Varian Australia Pty. Ltd. (Mulgrave, VIC, Australia). Oasis® HLB 60 mg packed in a 3 mL cartridge was purchased from Waters Australia (Rydalmere, NSW, Australia).
XAD-7 was purchased from Grace Davison Discovery Sciences (Rowville, VIC, Australia). The XAD-7 resin was washed by being suspended in deionised water and stirring for one hour. The water was then decanted and the resin suspended in methanol and stirred for another hour. After decanting the methanol, the washing process was repeated in the same manner with acetonitrile and then with acetone. After the final wash with acetone, the resin was allowed to dry in a fume cupboard overnight then the resin was crushed and passed through a sieve. Only the resin with a particle size between 75-150 µm was selected (this was based on the findings published by Douse [1985]). A 60 mg portion of the final resin was finally packed into a 4 mL Extract-Clean™ Empty SPE cartridge which was fitted with 10 µm PTFE frits. Both the empty cartridge and frits were obtained from Grace Davison Discovery Sciences. Although the empty cartridge was labelled as being 4 ml in size, after measuring the dimensions and volume of the packed cartridge, no difference was found in the volumes between the in-house packed XAD cartridge and the prepacked cartridges of other sorbent obtained from the vendors detailed above.
HPLC grade methanol (Scharlau, purchased from Chem-Supply, Gillman, SA, Australia), and high purity water (obtained from a Satorius arium 611 water purification system) were used for the conditioning of the SPE cartridges and in the preparation of the sample matrix and washing solutions. The details of the stock standard solutions of PETN, TNT and RDX, and the other chemicals required for the quantitative analyses have already been described in section 2.2.2 of Chapter 2.
Optimisation of the swab extraction and clean-up procedure
111
4.2.1.2 Experimental method
All selected SPE cartridges were conditioned, in the same manner, by washing with 3 × 1 mL of methanol and then 3 × 1 mL of water before the testing solution was added. An Alltech 16-port vacuum manifold with disposable PTFE needles (supplied by Grace Davison Discovery Sciences) was used to carry out all experiments. Nexus, ENV and Oasis cartridges were processed without the aid of a vacuum and a flow rate of approximately 0.5 – 0.8 mL/min was controlled by adjusting the stopcock of the manifold. Extractions with XAD and C18 required a low vacuum of approximately minus 10 inches of mercury to achieve the same flow rates.
Two millilitres of 10% v/v methanol/water solution, containing 10 µg of PETN, TNT or RDX, was loaded into a conditioned SPE cartridge. The effluent was collected into a 5 ml volumetric flask. An internal standard (detailed in section 2.2.2 of Chapter 2) was added and the volume was made up with a suitable diluent (detailed in section 2.2.3 of Chapter 2). The presence of target compounds in the final solution was checked using the method described in section 2.2.3 of Chapter 2. The same cartridge was then washed with 2 mL of a solution of a 20% methanol/water solution. The effluent was collected into a 5 mL volumetric flask. The internal standard was then added, the volume adjusted with diluent, and the presence of target compounds checked. The experiment was repeated on the same cartridge with a series of washing solvents of increasing methanol concentration, in 10% steps. When the target compound was found in the effluent, the percentage of methanol in the washing solvent for the next wash was changed to 5% higher (rather than 10%) and the experiment was continued until no target compound was detected in the effluent.
There were three replicate samples plus one negative control for each cartridge/target compound combination. Five-point calibration curves were constructed in the range 0.2–2 ppm for all the target compounds. The curves were prepared on each day that analyses were conducted.
4.2.1.3 Results
The quantity of target compound in each fraction collected from each cartridge was used to calculate the percentage breakthrough. If the entire starting amount of 10 µg was found in that fraction then the percent breakthrough was pronounced to be 100%. The results are presented as breakthrough profiles that display plots of the percentage of methanol in the loading
Chapter 4
112
solution versus the cumulative percentage breakthrough from the first collection up to the collection from the fraction in question.
The ideal SPE cartridge that would be suitable for cleaning-up an extract from a universal swab should have a profile where a 100% breakthrough occurs at a very high percentage of methanol. That would indicate that the sorbent has had a strong interaction with the analyte (i.e. the analyte is strongly retained by the sorbent at lower concentrations of methanol).
As demonstrated in Figures 4-16 and 4-17, most of the sorbents retain PETN and TNT well. No breakthrough was observed when the majority of the cartridges were flushed with a solvent containing less than 60% methanol for PETN and less than 55% methanol for TNT. C18 was the only sorbent that could not provide sufficient retention as no PETN could be retained on the cartridge when the cartridge was washed with 60% methanol/water. With respect to TNT on the C18 sorbent, 100% breakthrough was observed when washed with a lower strength of 55% methanol/water.
Optimisation of the swab extraction and clean-up procedure
113
PETN
% Methanol0 10 20 30 40 50 60 70 80 90 100
Cum
ulat
ive
% R
ecov
ery
0
20
40
60
80
100
120
0
20
40
60
80
100
120
XAD-7Isolute C-18BondElut ENVNexusOasis
Figure 4-16 Breakthrough profile of PETN on the selected SPE sorbents. The error bars represent the standard deviation (1 SD) of three replicate samples per experiment.
Chapter 4
114
TNT
% Methanol0 20 40 60 80
Cum
ulat
ive
% R
ecov
ery
0
20
40
60
80
100
0
20
40
60
80
100BondElut-ENVNexusIsolute C-18XAD-7Oasis
Figure 4-17 Breakthrough profile of TNT on the selected SPE sorbents. The error bars represent the standard deviation (1 SD) of three replicate samples per experiment.
The poor retention capacity of C18 was clearly demonstrated in the case of RDX, where 100% of the RDX was eluted from the cartridge when washed with only 40% methanol/water (Figure 4-18). Bond-Elut ENV also demonstrated a limited retention capacity towards RDX. As shown in Figure 4-18, no RDX could be retained on this type of cartridge when flushed with 55% methanol in water.
Considering the profiles obtained from all three explosive compounds, and using the criterion that a considerable breakthrough (more than 50%) should not occur when washing with a mixture of 50% methanol and water, C18 and Bond-Elut ENV were excluded from future consideration in terms of a clean-up procedure for a universal swab extract.
Optimisation of the swab extraction and clean-up procedure
115
RDX
% Methanol0 10 20 30 40 50 60 70 80
Cum
ulat
ive
% B
reak
thro
ugh
0
20
40
60
80
100
0
20
40
60
80
100XAD-7Isolute C18NexusBondElut ENVOasis
Figure 4-18 Breakthrough profile of RDX on the selected SPE sorbents. The error bars represent the standard deviation (1SD) of three replicate samples per experiement.
4.2.1.4 Conclusions
The breakthrough profiles of PETN, TNT and RDX, obtained by flushing five selected SPE cartridges with a series of solutions containing different concentrations of methanol in water, were used to assess retention capacity. Isolute® C18 demonstrated a weak interaction towards all three target compounds. These results, which were consistent with the findings of previously referenced studies, indicated that the residual silanol group of the bonded silica phase did not assist in improving the adsorption of the polar explosive compounds. Although Bond-Elut ENV retained PETN and TNT well, it was excluded as a suitable sorbent as it showed a lower retention capacity towards RDX compared to the other selected sorbents. This limited retention capacity towards a certain type of target compound is not a preferable trait when developing a procedure for targeting a wide range of explosive compounds.
Chapter 4
116
4.2.2 Optimisation and establishment of a clean-up procedure
The development of a solid-phase extraction method generally comprises three major steps, namely loading, washing and elution. During the loading step, the sorbent has to demonstrate that it can retain the compound of interest from a solution that is as similar to a “real” sample matrix as possible. In this instance, two solvent systems that could provide a single step extraction for both organic and inorganic compounds (section 4.1) were used as a testing matrix. A minimum portion of organic solvent in each system (40% acetonitrile/water and 60% methanol/water) was chosen to promote the adsorption of target compounds onto the resin. Four representative organic compounds (PETN, TNT, RDX and TATP) were spiked into each testing matrix to reassess the retention capacity of the three short-listed sorbents (XAD-7, Oasis HLB and Nexus).
The sorbent that demonstrated a high retention capacity towards all four target compounds was subsequently used to determine the maximum volume of washing solution that could be used to remove any interference but not elute the target compound from that sorbent. The final step was to find the type of solvent and the minimum volume that could then be used to elute the target compound from the sorbent. It was important that this final extract was compatible with the subsequent instrumental analysis method, e.g. HPLC or GC/MS.
4.2.2.1 Materials and chemicals
The details of the XAD-7, Oasis HLB and Nexus sorbents have already been mentioned in section 4.2.1.1. Details of the certified solutions of PETN, TNT, RDX and TATP, and also acetonitrile and methanol used to prepare the extracting solvents, are provided in section 3.2.1.1 of Chapter 3. The chemicals required for the quantitative analyses are detailed in sections 2.2.2 and 2.3.2 of Chapter 2.
4.2.2.2 Experimental methods and results
The details regarding conditioning of the selected SPE cartridges and the procedure for the manifold extraction are provided in section 4.2.1.2.
A solution of target explosive in 60% methanol (PETN, TNT, and RDX at a concentration of 3 ppm; TATP at a concentration of 5 ppm) was prepared by dilution from a certified stock
Optimisation of the swab extraction and clean-up procedure
117
solution. Two millilitres of this solution were loaded into each conditioned SPE cartridge. The effluent was collected into a 5 mL volumetric flask. The internal standard (detailed in section 2.2.2 of Chapter 2) was added (not included in the case of TATP), the volumes adjusted with a suitable diluent (detailed in section 2.2.5 of Chapter 2 for PETN, TNT, RDX, and deionised water for TATP) and the quantity of target compound in the final solution determined using the methods described in Chapter 2 section 2.2.3 (for PETN, TNT, RDX) and sections 2.3.3 – 2.3.4 (for TATP). Five-point calibration curves were constructed in the range 0.2–2 ppm for PETN, TNT and RDX, and 0.6–3 ppm for TATP. The curves were prepared on each day that sample analyses were conducted.
As a positive control, another two millilitres of explosive solution were transferred to a 5 mL volumetric flask without passing through a cartridge. The internal standard was also added, the volume adjusted, and the solution subjected to the relevant quantitative analysis. This solution, which served as a reference for 100% breakthrough, was used to calculate the percentage breakthrough at each solvent concentration and for each test sorbent.
A solution of each explosive at the same concentration was prepared in 40% acetonitrile (the second testing matrix) and the whole experiment repeated in the same manner.
Table 4-1 Percentage breakthrough (mean ± 1 SD, n = 3) of organic explosives from the selected sorbents using two types of testing matrix solutions. The dash mark (-) in the table indicates that no breakthrough was detected.
Chapter 4
118
When comparing the retention capacity of the selected sorbent between the two testing matrices, most sorbents performed well with a solution of 60% methanol in water. However, a considerable breakthrough was observed when a 40% acetonitrile/water solution was used as the testing matrix, especially in the case of TATP and RDX (Table 4-1). These results therefore precluded the use of a 40% mixture of acetonitrile/water as an extracting solvent for a universal swab as it is incompatible with the subsequent solid phase extraction procedure. Also, as is clearly shown in Table 4-1, the XAD-7 cartridge demonstrated a limited retention capacity towards TATP in the matrix of 60% methanol/water. Therefore this sorbent was not included in subsequent method development.
Next was the optimisation of the washing step with the two short-listed sorbents (Oasis and Nexus). A solution of 60% methanol in water was utilised as a washing solution in order to simplify the final clean-up procedure.
A solution of explosive in 60% methanol/water (PETN, TNT, and RDX at a concentration of 6 ppm; TATP at a concentration of 10 ppm) was prepared by dilution from a certified stock solution. One millilitre of this explosive solution was loaded onto each conditioned SPE cartridge and the effluent collected into a 5 mL volumetric flask. An internal standard was added, the volume adjusted, and the amount of target compound quantified as previously mentioned. The same cartridge was then washed with 3 × 1 mL of 60% methanol/water. During each wash, the effluent was collected and analysed using the same quantitation method. The percentage of breakthrough was calculated and again compared with the result from the analysis of a test solution that did not pass through a cartridge.
The results in Table 4-2 indicate that the interaction between the target compounds and the Nexus cartridge was stronger than with the Oasis sorbent. Less breakthrough was observed with the Nexus cartridge after the cartridge was washed three times. Thus, Nexus was identified as the most suitable sorbent for use in establishing a final clean-up procedure. The volume of washing solution was subsequently restricted to 2 mL in order to keep the loss (breakthrough) of TATP as low as possible.
Optimisation of the swab extraction and clean-up procedure
119
Oasis Nexus Explosive
load 1st wash
2nd wash
3rd wash load 1st
wash 2nd
wash 3rd
wash
PETN - - - - - - - -
TNT - - - - - - - -
RDX - - 17 ± 7% 72 ± 8% - - - 2 ± 1%
TATP - 7 ± 1% 11 ± 1% 26 ± 8% - - 6 ± 1% 14 ± 4%
Table 4-2 Cumulative percentages of breakthrough (mean ± 1 SD, n = 3) of organic explosives from the selected sorbents subjected to a series of washings with 60% methanol/water (1 mL per wash). The dash mark (-) in the table indicates that no breakthrough was detected.
The final step in the development of a clean-up procedure was to ascertain the type of eluting solvent to recover the target explosives from the SPE cartridge. That solvent had to be able to break the interaction between the sorbent and the target compound utilising a minimum volume (to ensure that a concentrated final extract is obtained). Furthermore, the final extract had to be compatible with the instrumental techniques commonly used for the identification of organic explosives, such as GC/MS. It also had to be compatible with the HPLC quantitative method utilised in this study.
A solution of explosive in 60% methanol/water (PETN, TNT, and RDX at concentrations of 6 ppm, TATP at a concentration of 10 ppm) was prepared by dilution from a certified stock solution. One millilitre of the explosive solution was loaded onto a conditioned SPE cartridge and the effluent discarded. The same cartridge was then washed with 2 × 500 µL of three testing solvents (acetone, acetonitrile and methanol). Each time, the effluent was collected into a 5 mL volumetric flask. An internal standard was added, the volume adjusted and the amount of target compound in the final solution determined as previously described.
Another solution was prepared for use as a reference for 100% elution by transferring the required amount from a certified stock solution of explosive (6 µL for PETN, TNT and RDX; 10 µL for TATP) into a 5 mL volumetric flask which already contained 500 µL of testing
Chapter 4
120
solvent. The internal standard was added (not in the case of TATP), the volume adjusted, and quantitative analysis conducted in the same manner as mentioned above.
Acetone Acetonitrile Methanol
Explosives 1st
fraction 2nd
fraction 1st
fraction 2nd
fraction 1st
fraction 2nd
fraction
PETN - 94 ± 8% - 97 ± 2% - < 17%
TNT - 96 ± 2% - 98 ± 3% - < 17%
RDX - 98 ± 3% - 99 ± 3% - 24 ± 14%
TATP - 87 ± 5% 6 ± 2% 93 ± 5% - 93 ± 7%
Table 4-3 Percentage of recovery (mean ± 1 SD, n = 3) of each organic explosives from the Nexus cartridge when eluted with each of three testing solvents (500 µL per fraction). The dash mark (-) in the table indicates that no target compound was detected in that fraction.
As shown in Table 4-3, most of target compounds were not found in the first fraction. This was a result of the first 500 µL of the eluting solvent replacing the residual loading solvent (60% methanol/water) which was held by the bed of the sorbent. Typically, before the elution step, the SPE cartridge would be dried by passing a stream of air or nitrogen gas through it. However, this step was specifically excluded in this study in order to minimise the loss of TATP that would potentially occur.
The eluting power of acetone and acetonitrile were found to be higher than that of methanol. This was clearly the case for PETN and TNT, where the amount recovered by eluting with methanol was found to be lower than the limit of quantitation of the HPLC method. When comparing acetone and acetonitrile as eluting solvents, there were no significant differences in their efficiency. Nevertheless, acetonitrile was chosen as an eluting solvent for two specific reasons. Firstly, it was more compatible with the HPLC method used for quantitative analysis as acetonitrile has a far lower UV cut-off than acetone. Secondly, the final extract would not be suitable for the identification of TATP by GC/MS if acetone were used in the elution step.
Optimisation of the swab extraction and clean-up procedure
121
This is due to the ambiguity that may arise during the interpretation of results, as the electron impact mass spectrum of TATP at trace levels has similarities with the spectrum of acetone.
By combining the best conditions from each step during the optimisation of solid-phase extraction technique, a clean-up procedure was proposed according to the following details: (i) a solution of explosive compound in 60% methanol/water was loaded onto a conditioned Nexus cartridge; (ii) the cartridge was washed with 2 mL of 60% methanol/water and then 500 µL of acetonitrile was added to flush residual washing solvent from the sorbent bed; (iii) the cartridge was eluted with 500 µL of acetonitrile which was then analysed directly by HPLC or dried over anhydrous sodium sulphate before being subjected to GC/MS analysis.
The efficiency in the recovery of six representative compounds from swab extract processing with the proposed clean-up procedure is assessed in the next section.
4.2.2.3 Conclusions
A clean-up procedure for the extract from a universal swab using a solid-phase extraction technique was clearly established and optimised. The ABS ELUT Nexus cartridge demonstrated a high retention capacity towards all representative organic compounds in a matrix of 60% methanol/water. The high recovery of all target compounds from a simulated solution was achieved with acetonitrile as an eluting solvent.
4.2.3 Testing the clean-up procedure with the extract from a polyester wipe
The performance of the solid-phase extraction procedure developed in the previous section was investigated using six representative target compounds (both organic and inorganic explosives). The testing solutions were prepared by spiking the target compounds into the extract from blank polyester wipes that contained background contaminants from both outdoor and indoor environmental surfaces.
4.2.3.1 Materials and chemicals
The details of the polyester wipes are outlined in section 3.1.1.1 of Chapter 3. The Nexus cartridge, methanol and water used in the experiment are detailed in section 4.2.1.1. HPLC grade LiChroSolv® acetonitrile (purchased from Merck Pty, Ltd., Kilsyth, VIC, Australia)
Chapter 4
122
was used as an eluting solvent from the SPE cartridge. The certified solution of explosives and the other chemicals required for the quantitative analyses are detailed in sections 2.2.2, 2.3.2 and 2.4.2 of Chapter 2.
4.2.3.2 Sample preparation
Information on the types of environmental surfaces sampled and the number of wipes collected is provided in Appendix 3.
One hundred and eighty five background wipes collected from various environmental surfaces, both indoors and outdoors, were each transferred into a 4 mL glass vial and 1 mL of 60% methanol/water added. Each vial was then sealed with Parafilm® and sonicated in an ultrasonic bath for 10 minutes. After the vial cooled down, the extract was taken out using a glass Pasteur pipette (details listed in section 3.2.1.2 of Chapter 3) and transferred into a 250 mL glass bottle. The extracts from each of the wipes were pooled together in that bottle and left overnight in a refrigerator so that any particulate matter could settle to the bottom of the bottle. The extract was then filtered through a 30 mm True™ syringe filter containing 0.45 µm regenerated cellulose (purchased from Grace Davison Discovery Sciences, Rowville, VIC, Australia) and stored in a glass bottle which was kept in a refrigerator ready for use. For simplification, this solution is subsequently referred to as the “background solution”.
A solution of explosive in a background solution at 2 concentrations (2 and 6 ppm for PETN, TNT and RDX; 4 and 10 ppm for TATP; 10 and 20 ppm for chlorate; 30 and 60 ppm for nitrate) was prepared by dilution from a stock solution. One millilitre of organic explosive solution was loaded onto a conditioned Nexus cartridge. The details of the conditioning of the SPE cartridge and the procedure for the manifold extraction are provided in section 4.2.1.2. The cartridge was then washed with 2 mL of 60% methanol/water followed by 500 µL of acetonitrile. The cartridge was finally eluted with 500 µL of acetonitrile and the effluent collected into a 5 mL volumetric flask. The internal standard (detailed in section 2.2.2 of Chapter 2) was added (not in the case of TATP), the volume adjusted with an appropriate diluent (detailed in section 2.2.5 of Chapter 2 for PETN, TNT, and RDX, and deionised water for TATP), and the amount of organic target compound in the final solution quantified using the method described in section 2.2.3 of Chapter 2 for PETN, TNT, and RDX, and in sections 2.3.3 and 2.3.4 of Chapter 2 for TATP. Five-point calibration curves were constructed in the
Optimisation of the swab extraction and clean-up procedure
123
range 0.2–2 ppm for PETN, TNT and RDX, and 0.6–3 ppm for TATP. The curves were prepared on each day that sample analyses were conducted.
For the inorganic explosives, one millilitre of the solution was loaded onto a conditioned Nexus cartridge and the effluent collected into a 5 mL volumetric flask. The internal standard (detailed in section 2.4.2 of Chapter 2) was added, the volume adjusted with deionised water, and the amount of inorganic target compound in the final solution quantified according to the method described in section 2.4.3 of Chapter 2. Five-point calibration curves were constructed in the range 1–6 ppm for chlorate and 1–12 ppm for nitrate. The curves were prepared on each day that sample analyses were conducted. A solution containing the same amount of inorganic compound but not passed through the cartridge was also analysed and used in the calculation of the percentage recovery of the inorganic compounds. (This was used to correct the percentage recovery as the sulphate anion used as the internal standard for the chlorate anion and also nitrate anion itself was found in the background solution.)
In order to test the possibility of using the clean-up method prior to GC/MS analysis, another set of low concentration organic explosive solutions was processed through a Nexus cartridge with an additional drying step. After the washing step and flushing with 500 µL of acetonitrile, a Bond Elut Jr. sodium sulphate drying cartridge (1.4 g; purchased from Varian Australia Pty. Ltd., Mulgrave, VIC, Australia) was attached to the Nexus column, and 500 µL of acetonitrile added and eluted by means of positive pressure with the aid of a syringe plunger. The effluent was collected into a 5 mL volumetric flask, the internal standard added, the volume adjusted, and quantitative analysis performed as mentioned above.
4.2.3.3 Results
As indicated in Table 4-4, the recovery of organic explosives at a low starting concentration was relatively good, with a value of approximately 50% for most of the target compounds. However, the proposed clean-up procedure performed better for the recovery of organic target compounds at higher concentration, where more than 80% recovery was obtained except in the case of TNT (around 60% recovery).
The recovered amount for all of the organic compounds after the clean-up procedure with an additional drying step (sodium sulphate cartridge) was found to be lower than the limit of
Chapter 4
124
quantitation of the analytical method used. This was suspected to be a consequence of using a large amount of sodium sulphate in the drying cartridge (i.e. 1.4 grams). The effect from the use of excess drying agent can be clearly seen as high background noise in Figure 4-21. Nonetheless, the detection of organic explosives using GC/MS after the proposed clean-up procedure is demonstrated to be possible, as the target peak could still be seen in the chromatogram and confirmation of the identity of the compound was achieved by comparison of the MS spectra with the instrument database (refer to results shown in Figures 4-19 to 4-22).
For the inorganic target compounds, the recovery was not adequate. It was subsequently determined that a considerable amount of the inorganic compounds was still retained on the sorbent. A way to improve the recovery of inorganic compounds is addressed in section 5.2 of Chapter 5.
Optimisation of the swab extraction and clean-up procedure
125
Explosive Starting amount (µg in 1 ml of extract) % Recovery (mean ± 1 SD, n =5)
2 with drying cartridge less than 45%
2 80 ± 9 PETN
6 94 ± 7
2 with drying cartridge less than 20%
2 54 ± 6 TNT
6 62 ± 5
2 with drying cartridge less than 20%
2 53 ± 3 RDX
6 91 ± 7
4 with drying cartridge less than 15%
4 50 ± 10 TATP
10 87 ± 16
10 22 ± 4 Chlorate
20 39 ± 9
30 29 ± 11 Nitrate
60 23 ± 3
Table 4-4 Percentage recovery of the six target explosives following the proposed clean-up procedure.
Figure 4-19 Reconstructed ion chromatogram (using ion 43) of the negative control solution and a solution containing TATP (4 µg starting amount) following the clean-up procedure with the additional sodium sulphate drying step.
Instrument: Agilent 7890A GC system equipped with 7693 autosampler and 5975C inert MSD with triple axis detector.
GC condition: Injector temperature 110°C, 1 minute splitless, injection volume of 0.5 µL. He was set in constant flow at 1 mL/min, split vent of 75 mL/min. BPX5 capillary column (12m × 0.22 mm I.D., 0.25 µm film thickness) Oven program 50°C (for 1 min) then increase at 8°C/min to a final of 100°C
(hold for 5 min.). Transfer line at 100°C MS condition: Solvent delay 5 minutes, source temperature 130°C, quadrupole temperature
150°C, scan mass range from 40-250 amu
Optimisation of the swab extraction and clean-up procedure
127
(Text File) Average of 6.719 to 6.756 min.: 311010R008.D\ data.ms
Figure 4-20 Mass spectrum average across the peak between the retention time of 6.72 to 6.76 minutes (see Figure 4-19) of a solution containing TATP after processing with the proposed SPE procedure (top) compared to the mass spectrum of TATP from the library (below).
Chapter 4
128
Figure 4-21 Total ion chromatogram of the negative control solution and the solution containing RDX (2 µg starting amount) after being subjected to the clean-up procedure with the additional sodium sulphate drying step.
GC condition: Injector temperature 170°C, 1 minute splitless, injection volume of 0.5 µL. He was set in constant flow at 1.3 mL/min, split vent of 75 mL/min. BPX5 capillary column (12m × 0.22 mm I.D., 0.25µm film thickness) Oven program 100°C (for 1 min) then increase at 10°C/min to a final of 200°C
(hold for 2 min.). Transfer line at 170°C MS condition: Solvent delay 4 minutes, source temperature 170°C, quadrupole temperature
150°C, scan mass range from 35-300 amu
Time (min)
8.75 8.80 8.85 8.90 8.95 9.00 9.05 9.10 9.15
Abu
ndan
ce
14000
16000
18000
20000
22000 RDX
Optimisation of the swab extraction and clean-up procedure
129
(Text File) Average of 9.055 to 9.083 min.: 311010R004.D\ data.ms
Figure 4-22 Mass spectrum average across the peak between the retention time of 9.06 to 9.08 minutes (see Figure 4-21) of the solution containing RDX after processing with the proposed SPE procedure (top) compared to the mass spectrum of RDX from the library (below).
4.2.3.4 Conclusions
The proposed clean-up procedure demonstrated good recoveries for the tested organic explosives from polyester wipes extracted with 60% methanol/water. The subsequent identification of the organic explosives by GC/MS was possible with an additional sodium sulphate drying step.
A very low recovery was observed for the inorganic target compounds but this result was subsequently improved using the method described in section 5.2 of Chapter 5.
4.3 References
Batlle, R., Carlsson, H., Tollbäck, P., Colmsjö, A. & Crescenzi, C. 2003, 'Enhanced detection of nitroaromatic explosive vapors combining solid-phase extraction-air sampling, supercritical fluid extraction, and large-volume injection-GC', Analytical Chemistry, vol. 75, no. 13, pp. 3137-3144.
Chapter 4
130
Douse, J.M.F. 1982, 'Trace analysis of explosives in handswabs extracts using Amberlite XAD-7 porous polymer beads, silica capillary column gas chromatography with electron-capture detection and thin-layer chromatography', Journal of Chromatography, vol. 234, no. 2, pp. 415-425.
Douse, J.M.F. 1985, 'Trace analysis of explosives at the low nanogram level in handswab extracts using columns of Amberlite XAD-7 porous polymer beads and silica capillary column gas chromatography with thermal energy analysis and electron capture detection', Journal of Chromatography, vol. 328, pp. 155-165.
Jenkins, T.F., Miyares, P.H., Myers, K.F., Mccormick, E.F. & Strong, A.B. 1994, 'Comparison of solid phase extraction with salting-out solvent extraction for preconcentration of nitroaromatic and nitramine explosives from water', Analytica Chimica Acta, vol. 289, no. 1, pp. 69-78.
Jönsson, S., Gustavsson, L. & Van Bavel, B. 2007, 'Analysis of nitroaromatic compounds in complex samples using solid-phase microextraction and isotope dilution quantification gas chromatography–electron-capture negative ionisation mass spectrometry', Journal of Chromatography A, vol. 1164, no. 1-2, pp. 65-73.
Kolla, P. 1991, 'Trace analysis of explosives from complex mixtures with sample pretreatment and selective detection', Journal of Forensic Science, vol. 36, no. 5, pp. 1342-1359.
Liu, J., Severt, S.A., Pan, X., Smith, P.N., Mcmurry, S.T. & Cobb, G.P. 2007, 'Development of an extraction and cleanup procedure for a liquid chromatographic–mass spectrometric method to analyze octahydro-1,3,5,7-tetranitro-1,3,5,7-tetrazocine in eggs', Talanta, vol. 71, no. 2, pp. 627-631.
Lloyd, J.B.F. 1985, 'Adsorption characteristics of organic explosives compounds on adsorbents typically used in clean-up and related trace analysis techniques', Journal of Chromatography, vol. 328, pp. 145-154.
Lloyd, J.B.F. 1987, 'Liquid chromatography with electrochemical detection of explosives and firearms propellant traces', Analytical Proceedings, vol. 24, no. 8, pp. 239-240.
Lloyd, J.B.F. 1991, 'Forensic explosives and firearms traces : Trapping of HPLC peaks for gas chromatography', Journal of Energetic Materials, vol. 9, no. 1, pp. 1-17.
Lloyd, J.B.F. & King, R.M. 1989, 'Detection and persistence of traces of SEMTEX and some other explosives on skin surfaces', Proceedings of the 3rd International Symposium on Analysis and Detection of Explosives, Pfinztal, Germany, 10-13 July 1989, pp. 9-1 - 9-14
Lloyd, J.B.F. & King, R.M. 1990, 'One-pot processing of swabs for organic explosives and firearms residue traces', Journal of Forensic Science, vol. 35, no. 4, pp. 956-959.
Optimisation of the swab extraction and clean-up procedure
131
Richard, J.J. & Junk, G.A. 1986, 'Determination of munitions in water using macroreticular resins', Analytical Chemistry, vol. 58, no. 4, pp. 723-725.
Strobel, R.A. & Tontarski, R.E. 1983, 'Organic solvent extracts of explosive debris: Clean-up procedures using bonded phase sorbents', Proceedings of the International Symposium on the Analysis and Detection of Explosive, Quantico, Virginia, USA, 29-31 March 1983: US Department of Justice, pp. 67-70.
Tachon, R., Pichon, V., Le Borgne, M.B. & Minet, J.-J. 2008, 'Comparison of solid-phase extraction sorbents for sample clean-up in the analysis of organic explosives', Journal of Chromatography A, vol. 1185, no. 1, pp. 1-8.
Tamiri, T. 1995, 'An improved procedure for cleaning post-explosion debris', Paper presented at The 5th International Symposium on Analysis and Detection of Explosives, Washington, D.C., USA, 4-8 December 1995.
Thompson, R.Q., Fetterolf, D.D., Miller, M.L. & Mothershead, R.F. 1999, 'Aqueous recovery from cotton swabs of organic explosives residue followed by solid phase extraction', Journal of Forensic Science, vol. 44, no. 4, pp. 795-804.
Warren, D., Hiley, R.W., Phillips, S.A. & Ritchie, K. 1999, 'Novel technique for the combined recovery, extraction and clean-up of forensic organic and inorganic trace explosives samples', Science & Justice, vol. 39, no. 1, pp. 11-18.
132
133
CHAPTER 5 A UNIVERSAL SWABBING PROTOCOL FOR THE COMBINED RECOVERY OF ORGANIC AND INORGANIC EXPLOSIVE RESIDUES
The development of a universal swabbing protocol in this study started with the evaluation of various sampling media for their potential use to collect both organic and inorganic explosive residues using just one swab. Then, each step of the procedure for the extraction of the chosen universal swab and the clean-up of the swab extract was optimised, while ensuring compatibility with the instrumental analysis methods commonly used for the detection and identification of explosive residues. Finally, in this chapter, the complete swabbing protocol is established, based on findings from the two previous chapters.
A mixture of TNT, PETN and chlorate was used to test the proposed protocol. This mixture represents the combination of compounds that may be encountered in an explosive device, i.e. PETN from the detonating cord, TNT as the booster, with chlorate as a component of the main charge. The proposed swabbing protocol using polyester wipes was applied to recover the mixture from a laminate surface. This type of surface was chosen due to its common occurrence in households and offices around Australia. Also, there is limited information available regarding sampling from laminate surfaces when compared to other common surfaces such as glass and metal. After sampling, the wipe was extracted with 60% v/v methanol/water and loaded onto a Nexus SPE cartridge. The effluent from sample loading was collected and analysed for the inorganic component. The cartridge was then washed with 60% v/v methanol/water and the organic component eluted with acetonitrile. The final acetonitrile extract was then subjected to instrumental analysis.
The repeatability of the protocol was demonstrated by performing the testing over a period of three days. Also, final adjustments to the protocol to attain a good recovery of both organic and inorganic explosive compounds are detailed in this chapter.
Chapter 5
134
5.1 Quantitative method for the analysis of extracts containing both TNT and PETN
Before the full protocol evaluation was carried out, a quantitative method to analyse a sample containing both TNT and PETN needed to be established and validated. The quantitation method detailed in Chapter 2 was only validated for sample solutions comprising one target compound. Therefore, a new quantitative method was required for the analysis of samples from this part of the study.
5.1.1 Chemicals
2,4,6-Trinitrotoluene (TNT) and pentaerythritol tetranitrate (PETN) at a certified concentration of 1000 μg/mL in acetonitrile and 2-nitrotoluene (99.5% certified purity) were all obtained from ChemService, Inc. (West Chester, PA, USA). 2-Nitrotoluene (2-NT) was prepared as a 1000 ppm solution in LiChroSolv® acetonitrile (gradient grade for liquid chromatography, supplied by Merck Pty. Ltd., Kilsyth, VIC, Australia), and then 12 μL of this solution was added to each of the working solutions as an internal standard. HPLC grade methanol (Scharlau) was purchased from Chem-Supply (Gillman, SA, Australia). High purity water was obtained from a Satorius arium 611 water purification system. Both methanol and water were filtered under vacuum through a 47 mm nylon filter membrane with a pore size 0.45 μm (supplied by Grace Davison Discovery Sciences, Rowville, VIC, Australia) prior to use as the mobile phase for liquid chromatographic analysis.
5.1.2 Instrumentation
The analyses were performed on an Agilent 1120 high performance liquid chromatography system comprising a quaternary pump, vacuum degasser, standard autosampler, thermostatted column compartment and a diode array detector. Instrumental control, data acquisition and analysis were accomplished using EZChrom Elite™ Chromatography Data System software version 3.3.2.
An isocratic run using methanol/water (60:40) as the mobile phase at a flow rate of 1 mL/min on a 4.6 × 150 mm Zorbax Eclipse XDB-C18 analytical column with particle size of 5 μm was applied for the separation. 10 µL of sample solution was injected into the HPLC system and the separation performed at 30°C. The detection of the target compounds was achieved by
A universal swabbing protocol
135
Minutes0 1 2 3 4 5 6 7 8 9 10
mA
U
-2.5
0.0
2.5
5.0
7.5
10.0
12.5
15.0
17.5
20.0
22.5
25.0
mA
U
-2.5
0.0
2.5
5.0
7.5
10.0
12.5
15.0
17.5
20.0
22.5
25.0
4.32
0
5.50
0
6.55
3
DAD: Signal A, 212 nm/Bw:4 nm Ref 300 nm/Bw:100 nmRetention Time
monitoring at a wavelength 212 nm with a bandwidth of 4 nm and using a reference wavelength of 300 nm with a bandwidth of 100 nm for baseline correction. An example of the chromatogram obtained utilising the chromatographic conditions outlined above is shown in Figure 5-1.
Figure 5-1 Liquid chromatogram of a solution containing 0.2 ppm of TNT (peak at 4.32 min.), 2.4 ppm of 2-NT (internal standard; peak at 5.50 min.) and 0.4 ppm of PETN (peak at 6.55 min.).
5.1.3 Linearity of the method
A 1:1 mixture of methanol and water was used as a diluent in the preparation of working solutions containing various concentrations of TNT and PETN as detailed in Table 5-1.
PETN TNT
2-NT (IS)
Chapter 5
136
Explosives Concentration of explosives in final standard solution (ppm)
Table 5-1 Concentration ranges of solutions used for evaluating the linearity of the liquid chromatographic method for the analysis of samples containing TNT and PETN (with each solution also containing 2-NT as an internal standard at a fixed concentration of 2.4 ppm).
The verification of a linear relationship between the instrument response (area ratio) and the concentration of explosive compounds in each sample was carried out using the same statistical tests mentioned in section 2.2.5 of Chapter 2. Results from the statistical tests did not indicate a better fit with a non-linear model compared with a linear model for the testing range of PETN (0.2 – 4.0 ppm). However, the analytical curve of TNT could be described by a linear model only in the range from 0.2 – 3.6 ppm. The analytical curves for both target compounds are shown in Figures 5-2 to 5-3.
A universal swabbing protocol
137
Figure 5-2 Analytical regression curve for TNT in the range of 0.2 – 3.6 ppm. The dotted lines represent the upper and lower limits of the prediction band for a 95% confidence interval.
TNT
Concentration (ppm)
0.0 0.5 1.0 1.5 2.0 2.5 3.0 3.5 4.0
Peak
are
a ra
tio
0.0
0.2
0.4
0.6
0.8
1.0
1.2
R2 = 0.9991 sy/x = 0.0106
Chapter 5
138
Figure 5-3 Analytical regression curve for PETN in the range of 0.2 – 4 ppm. The dotted lines represent the upper and lower limits of the prediction band for a 95% confidence interval.
5.1.4 Conclusions
A HPLC quantitative method for the analysis of samples containing both TNT and RDX was successfully developed and the linearity of the analytical curves of the two target compounds were verified in the range of 0.2 – 3.6 ppm for TNT and 0.2 – 4 ppm for PETN.
PETN
Concentration (ppm)
0 1 2 3 4
Peak
are
a ra
tio
0.0
0.1
0.2
0.3
0.4
0.5
R2 = 0.9991 sy/x = 0.0047
A universal swabbing protocol
139
5.2 Feasibility study of the proposed protocol
5.2.1 Materials and chemicals
Mini Liv-wipe alcohol wipes (polyester; dimension 3.3 × 3 cm) were purchased from Livingstone International Pty. Ltd. (Rosebery, NSW, Australia). Laminate sheet (Laminex® 200 White with natural finish) was supplied by The Laminex Group Pty. Ltd. (Fyshwick, ACT, Australia) and was cut to the size of 7.5 × 6 cm. The sheets were cleaned using alcohol wipes and allowed to completely dry at room temperature before use as a test surface. ABS ELUT Nexus solid phase extraction cartridges (60 mg packed in 3 mL cartridge) utilised for extract clean-up were purchased from Varian Australia Pty. Ltd. (Mulgrave, VIC, Australia).
A stock solution of chlorate at a concentration of 2000 ppm in HPLC grade methanol was prepared from sodium chlorate (99.8 % purity) which was purchased from Sigma-Aldrich Pty. Ltd. (Castle Hill, NSW, Australia). Details of the standard solutions of TNT and PETN, the methanol and water for extraction, the acetonitrile as the eluting solvent and the other chemicals required for the quantitative analyses have already been provided in section 5.1.1.1.
5.2.2 Experimental method
15 µL of PETN solution (equivalent to 15 µg) was firstly added onto the test surface, followed by 15 µL of TNT solution (equivalent to 15 µg) and 15 µL of chlorate solution (equivalent to 30 µg), all at the same location on the surface. The substrate was then allowed to dry in a fume cupboard for 5 minutes.
A polyester wipe was then applied with gloved hand to collect the residues. The collection was conducted by wiping the whole surface in one direction without repeat on the same area. The wipe was then transferred into a 4 mL clear glass vial, 1 mL of 60% methanol/water added, and the vial sealed with Parafilm®. The extraction was then carried out by sonication in an ultrasonic bath for 10 minutes. While waiting for the extraction to be completed, the Nexus SPE cartridge was conditioned as described in section 4.2.1.2 of Chapter 4.
When the extraction was completed, the vial was allowed to cool to room temperature. The wipe in the vial was pounded with the tip of a glass Pasteur pipette and the extract drawn through the wipe and transferred into the conditioned Nexus cartridge. The effluent was
Chapter 5
140
collected into a 5 mL volumetric flask. A 30 µL solution of sulphate anion was added to the volumetric flask as an internal standard and the volume made up with deionised water. The amount of chlorate in this final solution was quantified using the method detailed in sections 2.4.2, 2.4.3 of Chapter 2. A five-point calibration curve was constructed in the range 1–6 ppm and the curve prepared on each day that sample analyses were performed.
The Nexus cartridge, after collection of the inorganic fraction, was washed with 2 mL of 60% methanol/water followed by 500 µL of acetonitrile. The cartridge was then finally eluted with 500 µL of acetonitrile and the effluent collected into a 5 mL volumetric flask. 12 µL of 2-NT solution was added as an internal standard. The volume was made up with a 1:1 mixture of methanol and water and the amount of TNT and PETN in this final solution was determined using the method described in section 5.1.1. A five-point calibration curve was constructed in the range 0.2–3.2 ppm for both TNT and PETN. The analytical curves were prepared on each day that sample analyses were performed.
The whole experiment, starting from the wiping of the test surface through the SPE clean-up was repeated over a period of three days. There were seven samples and one negative control, which generated 8 solutions for inorganic analysis and another 8 solutions for organic analysis, on each of the three days.
5.2.2.1 Experimental method for testing the protocol modified by the addition of a deionised water flush
Two sets of laminate samples, containing deposits of the three target compounds PETN, TNT and chlorate, were prepared in the same way as described in section 5.2.2. Each set was comprised of three samples and one negative control.
Polyester wipes were applied to each surface and the wipes extracted using 60% methanol/water in the same way as detailed in section 5.2.2. Nexus SPE cartridges were conditioned as described in section 4.2.1.2 of Chapter 4 while waiting for the sonication step to be completed.
After the extraction was completed, each vial was allowed to cool to room temperature. The wipe in the vial was pounded with the tip of a glass Pasteur pipette and the extract drawn
A universal swabbing protocol
141
through the wipe and transferred into the conditioned Nexus cartridge. For the extracts from sample set 1, the effluent after loading the extract onto the Nexus cartridge was collected in a 5 mL volumetric flask, the internal standard (sulphate anion) was added, the volume was made up with deionised water, and quantitative inorganic analysis carried out as mentioned in section 5.2.2.
For the extracts from sample set 2, the extract was loaded onto the Nexus cartridge and this was followed by the addition of 500 µL of deionised water to the SPE cartridge. The effluent from the combined loading step and water addition was collected and combined in a 5 mL volumetric flask. The internal standard was then added, the volume was made up with deionised water, and then the solution subjected to quantitative inorganic analysis in the same manner as for sample set 1.
Each Nexus cartridge was then washed with 60% methanol/water followed by elusion with acetonitrile as detailed in section 5.2.2. The amount of PETN and TNT in the organic fraction was quantified using the method detailed in section 5.1.1.
The quantitative results from the two sample sets were then compared to ascertain the effect of the additional water flush on the recovery of the target compounds.
5.2.3 Results
The three target compounds were detected utilising the proposed protocol for sampling mixtures containing both organic and inorganic explosive compounds from a laminate surface and subsequent processing of the extract. Chlorate was found in the solution made up from the effluent collected after loading the initial extract onto the SPE cartridge. TNT and PETN were also found in the solution made up from the effluent after the final elution of the SPE cartridge. This demonstrated that the combined recovery of organic and inorganic explosive compounds utilising one alcohol wipe was successful.
Examples of an electropherogram from the inorganic analysis and a liquid chromatogram from the organic analysis of the extract are shown in Figures 5-4 and 5-5 respectively.
Chapter 5
142
Figure 5-4 An electropherogram of a solution made up from an effluent collected after loading the methanol/water extract from a polyester wipe onto a Nexus SPE cartridge.
Sulphate (IS)
chlorate
0 0.5 1 1.5 2 2.5 3 3.5 4 4.5
mAU
0
0.2
0.4
0.6
0.8
1
1.2
1.4
1.6
DAD1, Sig=270,4 Ref=off
A universal swabbing protocol
143
Figure 5-5 A liquid chromatogram of a solution made up from an effluent collected after the acetonitrile elution of a Nexus cartridge at the end of the sampling/clean-up protocol.
A good recovery (more than 60%) of both TNT and PETN was achieved and there was minimal variation among the samples run on the same day and on different days (Figure 5-6). However, a relatively low recovery of chlorate (below 40%) was obtained over the three days of testing. It was later found that a considerable amount of chlorate was retained on the bed of resin in the SPE cartridge. This was confirmed when a higher recovery (from around 30% to over 50%) was obtained when the protocol was modified with an additional step of flushing with 500 µL of deionised water after loading the extract. This extra step did not affect the good recovery of PETN and TNT as demonstrated in Figure 5-7.
Minutes0 1 2 3 4 5 6 7 8 9 10
mA
U
-4
-2
0
2
4
6
8
10
12
14
16
18
20
22
24
mA
U
-4
-2
0
2
4
6
8
10
12
14
16
18
20
22
24
4.33
3
5.51
3
6.56
7
DAD: Signal A, 212 nm/Bw:4 nm Ref 300 nm/Bw:100 nmRetention Time
2-NT (IS)
TNT
PETN
Chapter 5
144
Day 1 Day 2 Day 3
% R
ecov
ery
0
20
40
60
80
100
0
20
40
60
80
100
PETN TNT Chlorate
Figure 5-6 Percentage recovery of the three target compounds from the laminate testing surface utilising the proposed swabbing/clean-up protocol over the period of three days. The error bars were calculated from the standard deviation (1 SD) of seven replicate samples.
A universal swabbing protocol
145
Chlorate PETN TNT
% R
ecov
ery
0
20
40
60
80
100
0
20
40
60
80
100
Without DI flush With DI flush
Figure 5-7 Percentage recovery of the three target compounds, comparing results from the original protocol with those from the modified protocol with an extra step of flushing with deionised water when collecting the effluent for inorganic analysis. The error bars were calculated from the standard deviation (1 SD) of three replicate samples.
With the limited number of publications available that relate to sampling procedures for the combined recovery of organic/inorganic explosive compounds, it is difficult to make a comparison of the effectiveness of the proposed protocol with that of other established protocols utilised in forensic casework. As mentioned in Chapter 4, to the best of our knowledge the only publication that applied the concept of using SPE for separation and clean-up of explosive extracts is the work of the Forensic Explosive Laboratory in the UK [Warren et al. 1999].
The percentage recovery of both organic target compounds (TNT and PETN) from the simulated mixture utilising the modified proposed protocol (approximate 70%) was much higher than the results reported in the work of DSTL (approximate 50%) whereas the percentage recovery of chlorate was found to be lower (approximate 50% in this work
Chapter 5
146
compared to approximate 88% reported in the publication). Nevertheless, the percentage recovery in the work of DSTL was calculated from only the clean-up step and using a simulated solution while in this work the recovery was the overall calculation starting from sampling through to final analysis. Therefore, the recovery of inorganic compounds using the proposed procedure may be comparable to the results obtained using the reported DSTL procedure when such factors are taken into an account.
The detection of the two organic explosives using GC/MS with the proposed protocol was possible with an additional step of using a drying cartridge containing anhydrous sodium sulphate. Examples of results from such GC/MS analyses are shown in Figures 5-8 to 5-11.
A universal swabbing protocol
147
Figure 5-8 Total ion chromatogram of the solution made up from the effluent after acetonitrile elution from the SPE cartridge coupled with the removal of water using a drying tube containing anhydrous sodium sulphate.
Instrument: Agilent 7890A GC system equipped with 7693 autosampler and 5975C inert
MSD with triple axis detector. GC conditions: Injector temperature 165°C, 1 minute splitless, injection volume of 0.5 µL. He was set in constant flow at 1.3 mL/min, split vent of 75 mL/min. BPX5 capillary column (12m × 0.22 mm I.D., 0.25µm film thickness) Oven program 100°C (for 1 min) then increase at 10°C/min to 155°C (hold
for 2 min.) and then increase at 20°C/min to a final of 200°C (hold for 1 min.).
Transfer line at 150°C MS conditions: Solvent delay 4 minutes, source temperature 150°C, quadrupole temperature
150°C, scan mass range from 35-300 amu
Time (min)
7.0 7.2 7.4 7.6 7.8 8.0 8.2 8.4 8.6 8.8
Abu
ndan
ce
14000
16000
18000
20000
22000
24000
26000
28000
30000
32000
TNT
PETN
Chapter 5
148
Ion 46.00 (45.70 to 46.70)
Time (min)
7.0 7.2 7.4 7.6 7.8 8.0 8.2 8.4 8.6 8.8
Abu
ndan
ce
0
500
1000
1500
2000
2500
3000
3500
Ion 210.00 (209.70 to 210.70)
Time (min.)
7.0 7.2 7.4 7.6 7.8 8.0 8.2 8.4 8.6 8.8
Abu
ndan
ce
0
500
1000
1500
2000
2500
3000
3500
Figure 5-9 Extracted ion chromatogram of the same solution as depicted in Figure 5-8, using ion 46 (top) for the detection of PETN and ion 210 (below) for the detection of TNT.
A universal swabbing protocol
149
(Text File) Average of 7.386 to 7.427 min.: 081110RUN004.D\ data.ms
Figure 5-10 Mass spectrum average across the peak between the retention times of 7.39 to 7.43 minutes from the same solution as depicted in Figure 5-8 (top) compared to the mass spectrum of TNT from the library (below).
(Text File) Average of 8.347 to 8.360 min.: 081110RUN004.D\ data.ms
Figure 5-11 Mass spectrum average across the peak between the retention times of 8.33 to 8.38 minutes of the same solution as depicted in Figure 5-8 (top) compared to the mass spectrum of a 2 ppm standard solution of PETN analysed under the same instrumental conditions (below).
Chapter 5
150
5.2.4 Conclusions
The proposed protocol using a polyester wipe as a universal swab was applied for the collection of the residue of a mixture of organic and inorganic explosive compounds deposited on a laminate test surface. The results indicated that all target compounds were recovered within a single wipe and could be detected using the instrumental techniques commonly used for the identification of organic and inorganic explosive compounds. The protocol was also modified in order to improve the recovery of inorganic target compound. The final universal swabbing protocol can be demonstrated as a flow chart depicted in Figure 5-12.
Figure 5-12 Flow chart of the final optimised sampling and clean-up protocol.
Step 1. A polyester alcohol wipe is applied with a gloved hand to the suspect surface to collect any residue from that surface.
Step 2. Each wipe is then transferred into a 4 mL glass vial
A universal swabbing protocol
151
Step 3. One milliliter of 60% methanol/water is added to the vial and the vial is sealed with Parafilm®.
Step 4. Extraction is carried out by sonication in an ultrasonic bath for 10 minutes.
Figure 5-12 (cont’d) Flow chart of the final optimised sampling and clean-up protocol.
Chapter 5
152
Step 5. When the extraction is completed and the vial is allowed to cool to room temperature, the wipe in the vial is then pounded with the tip of a glass Pasteur pipette and the extract drawn through the wipe and transferred directly into the conditioned Nexus cartridge, followed by 500 µL of deionised water
Step 6. Combine the effluent collected from the sample loading and from the deionised water flush and then subject to the analytical method for the detection and identification of inorganic compounds
Figure 5-12 (cont’d) Flow chart of the final optimised sampling and clean-up protocol.
A universal swabbing protocol
153
Step 7. After collection of the inorganic fraction, the cartridge is washed with 2 mL of 60% methanol/water followed by 500 µL of acetonitrile. Discard all the effluent from this step.
Step 8. The cartridge is finally eluted with 500 µL of acetonitrile and the effluent is collected for subsequent analysis of the organic compounds. An additional step of drying the acetonitrile fraction with an anhydrous salt (e.g. sodium sulfate) is necessary if GC-MS is to be used as the final instrumental method. This drying step is not required if an LC method is employed.
Figure 5-12 (cont’d) Flow chart of the final optimised sampling and clean-up protocol.
5.3 References
Warren, D., Hiley, R.W., Phillips, S.A. & Ritchie, K. 1999, 'Novel technique for the combined recovery, extraction and clean-up of forensic organic and inorganic trace explosives samples', Science & Justice, vol. 39, no. 1, pp. 11-18.
154
155
CHAPTER 6 STABILITY OF EXPLOSIVE RESIDUES ON POLYESTER WIPES AND IN METHANOL/WATER EXTRACTS
With the increasing casework and the limited capacity experienced by most operational forensic laboratories, exhibits are sometimes not examined as soon as they are submitted. Therefore, the stability of trace explosives on sampling media after residue collection and prior to sample analysis becomes another crucial factor that has to be considered in the overall analytical protocol.
The investigation of the stability of military explosives present as contamination in water and soil at ammunition sites or manufacturing plants has been extensively conducted as an awareness of the impacts of these compounds on the environment. Details regarding transformation mechanisms for explosive compounds, especially microbial degradation, has been well-documented [Hawari et al. 2000, Spain, Hughes & Knackmuss 2000, Rosser et al. 2001, Monteil-Rivera et al. 2009]. On the contrary, there is limited available information on the stability of trace explosives on sampling media and/or in swab extracts.
Twibell and colleagues [1982] compared the stability of nitroglycerine (NG) on cotton swabs, dampened with various solvents, to when it is dissolved in solution. He pointed out that NG was more stable in solution than on swabs soaked in solvent; particularly if the swabs subsequently dried out. Kolla and Hohenstatt [1993] reported the influence of moisture, UV-light and vapour pressure on the stability of TNT, RDX and PETN on four different substrates (glass, zinc and aluminium plates, and on household dust recovered from a vacuum cleaner). Perret and colleagues [2008] examined the stability of four organic explosives (TNT, RDX, PETN, NG) and two organic stabilizers (diphenylamine and ethyl centralite) in methanol stored at -18°C for one month and observed a loss of NG and TNT after about two weeks while no loss of any of the other compounds of interest was observed.
Chapter 6
156
Douglas and colleagues [2009] investigated the stabilility of nitroaromatic and nitramine explosives at ppb concentrations in 18.2 MΩ deionised water stored in the dark at 20°C. They found that most of the target compounds (except tetryl) were stable in ultraclean water over a period of 80 days. More recently, Pachman and Matyáš [2010] studied the effect of using different acid catalysts in the manufacturing process on the stability of TATP stored in four different solvents at 50°C in the dark over the period of 100 days. They found that TATP samples prepared by using hydrochloric acid as a catalyst were the most stable in all the testing solvents. Also, storage in the dark and at reduced temperatures was suggested in order to increase the stability of the sample. Despite several studies attempting to fill the knowledge gap in this area, information on the stability of explosives over time is still largely inadequate and demands further research.
In this chapter, the stability of the representative compounds on polyester wipes and in the methanol/water extracts was assessed in order to establish storage recommendations in conjunction with the final proposed protocol. All six target compounds were added to a polyester wipe and the wipe stored over 30 days at three different temperatures [room temperature (approximately 20°C), in the refrigerator (approximately 10°C), and in the freezer (approximately minus 21°C)] using clear and amber glass vials as storage containers. Solutions of each representative explosive compound were also prepared in 60% methanol/water and stored under the same condition as the wipes. The amount of each representative compound remaining on the swabs and in the extracts was quantified at set time interval over the course of the one-month experiment. The retention of all six target compounds on a glass surface under two different storage conditions (room temperature and in the refrigerator) was included in the study. This preliminary investigation was to contribute towards an estimation of the maximum time that the explosive material could still be detected and recovered from a stored exhibit. However, testing with other common surfaces should be the subject of future study.
6.1 Experimental
6.1.1 Materials and chemicals
Mini Liv-wipe alcohol swabs (3.3 × 3 cm) were purchased from Livingstone International Pty. Ltd. (Rosebery, NSW, Australia). 4 mL screw-neck clear and amber glass vials with 13
Stability of explosive residues on polyester wipes and in methanol/water extracts
157
mm black solid PP caps with PTFE liners (supplied by Grace Davison Discovery Sciences (Rowville, VIC, Australia) were used as storage containers. Pathological grade premium microscope glass slides (7.6 × 2.5 cm), obtained from Livingstone International Pty. Ltd., were used as substrates to examine the retention of explosive compounds. No surface pre-treatment was employed before use. The glass slides were stored in 5-slide plastic mailers, obtained from LabTek Pty. Ltd. (Brendale, QLD, Australia), which were then packaged in heat-sealed nylon bags. Lascar EL-USB-2-LCD dataloggers (purchased from Farnell Australia, Chester Hill, NSW, Australia) were used to monitor the temperature of each storage environment.
Details of the stock solutions of the organic and inorganic explosives are described in section 3.3.2.1 of Chapter 3. Chemicals required for the quantitative analyses were mentioned in sections 2.2.2 (for PETN, RDX and TNT), 2.3.2 (for TATP) and 2.4.2 (for inorganic anions) of Chapter 2.
Supragradient HPLC grade methanol (Scharlau), purchased from Chem-Supply (Gillman, SA, Australia), and high purity water, obtained from a Satorius arium 611 water purification system, were used in the preparation of 60% methanol/water for swab extraction.
6.1.2 Sample preparation
Three types of samples were prepared for each representative explosive compound and for each storage condition tested; (i) the explosive in solution (simulated swab extract), (ii) the explosive deposited on an alcohol wipe; and (iii) the explosive deposited on a glass surface.
To assess the stability of the target compounds in the swab extracts, each blank polyester wipe was transferred into a clear glass vial and one milliliter of 60% methanol/water was added to each vial. The vials were then sealed with Parafilm® and the extraction carried out by sonication in an ultrasonic bath for 10 minutes. After 10 minutes of extraction, the vials were allowed to cool to room temperature. The wipe was pounded with the tip of a glass Pasteur pipette and the extract was subsequently drawn through the wipe and transferred into either a clear or amber glass vial. An aliquot of explosive stock solution was then added (15 µL for PETN or TNT or RDX or chlorate, 20 µL for nitrate; and 30 µL for TATP). Each vial, which contained only one target compound, was then sealed with Parafilm®. Solutions in clear vials
Chapter 6
158
were stored under three different conditions (room temperature, in the refrigerator, and in the freezer), whilst solutions in amber vials were stored only at room temperature. For the storage at room temperature, the vials were placed on an open book shelf next to a window, which was facing north, in an air-conditioned room. The amount of target compound in each solution was subsequently determined at intervals of 0, 5, 15 and 30 days (with slight changes in the collection days for the TATP and chlorate samples based largely on instrument availability).
Three repeats and one negative control for each target explosive stored under each set of conditions were collected plus one negative control and one positive control which were freshly prepared on the day of sample analyses. To quantify the amount of explosive in the solution, the vials were opened and all the liquid transferred into a 5 mL volumetric flask. An internal standard was added (detailed in section 2.2.2 of Chapter 2 for PETN, TNT, RDX, and in sections 2.4.2 and 2.4.4 of Chapter 2 for inorganic explosives – no internal standard in the case of TATP). The volume was made up with a suitable diluent (methanol/water for PETN, TNT, and RDX; as detailed in section 2.2.5 of Chapter 2, and deionised water for TATP and the inorganics). The amount of target compound in the final solution was quantified using the analytical methods detailed in section 2.2.3 of Chapter 2 for PETN, TNT, RDX, sections 2.3.3 and 2.3.4 of Chapter 2 for TATP, and section 2.4.3 of Chapter 2 for chlorate and nitrate. There was some modification to the analytical procedure for TATP in order to check for the presence of hydrogen peroxide or other compounds that could affect the calculation of the actual amount of TATP left in the solution. First, one millilitre of the final test solution was mixed with one millilitre of colorimetric reagent without the acid degradation step and the absorbance of this solution recorded. If the corrected absorbance was not higher than 0.14 (the threshold value as described in the results section), then the standard analytical method for the determination of TATP with acid degradation was applied. However, if the value exceeded 0.14, which indicated the presence of a large amount of hydrogen peroxide or other interfering compounds, the separation of TATP from the hydrogen peroxide using SPE would be implemented before the acid degradation step. Fortunately, it was found that none of samples generated a corrected absorbance higher than the threshold value and therefore a separation method was not required (and is therefore not described here).
Five-point calibration curves for the quantitative analyses, which covered the concentration range of 0.2–3 ppm for PETN, TNT and RDX, 0.6–6 ppm for TATP, 1–6 ppm for chlorate, and 1–12 ppm for nitrate, were prepared on each day that sample analyses were conducted.
Stability of explosive residues on polyester wipes and in methanol/water extracts
159
For the samples in the form of an explosive on a polyester wipe, an aliquot of the explosive stock solution (15 µL for PETN or TNT or RDX or chlorate, 20 µL for nitrate, and 30 µL for TATP) was deposited directly onto the wipe and then the wipe transferred into either a clear or amber vial (stored as a wet wipe, with only one target compound per wipe). The vials were then sealed and stored as mentioned above.
Three repeats and one negative control were employed for each target explosive stored at each set of conditions, plus one negative control and one positive control which were prepared freshly on the day of the sample analyses. For sample extraction, each vial was opened and then one millilitre of 60% methanol/water added to each. The extraction was conducted in the same way mentioned above. After the extraction was completed and the vials cooled to room temperature, the wipe was pounded and the extract transferred into a 5 mL volumetric flask. The subsequent procedure from the addition of the internal standard through to quantitative analysis of the final solution was carried out as previously mentioned.
The last type of sample used in this study was an explosive deposit on a glass surface. An aliquot of the stock explosive solution (15 µL for PETN, TNT, RDX and chlorate, 20 µL for nitrate, and 30 µL for TATP) was deposited onto the glass slide and allowed to dry in a fume cupboard for 5 minutes (one target compound per slide). The glass slides were then inserted into the plastic slide mailers. In each slide mailer was stored one negative control and three test samples. The slide mailer was packaged in a nylon bag and the bag heat-sealed with a minimum volume of air left in the package. The mailers were stored at room temperature and in the refrigerator. For the repeat 5 days-experiment of TATP (see Figure 6-13), the mailers were storage at room temperature, in the cold room and in two different freezers (at approximately minus 21 and minus 80°C).
On the day of sample analysis, the packages were opened and the glass slides removed from the mailer with the aid of tweezers. A fresh polyester wipe was applied to collect the residue from the surface of each glass slide. The wipe was then transferred into a clear glass vial and one millilitre of 60% methanol/water was added. The extraction and all subsequent analytical procedures were conducted in the same manner as mentioned above.
Chapter 6
160
6.2 Results
As indicated in Figure 6-1, the stability of PETN in the extracts from the polyester wipes was relatively good. No significant loss was observed over a period of 30 days when stored at room temperature. There was a technical problem with the refrigerator used in the study; the average refrigerator temperature increased from 10°C to 16°C as indicated by the dotted line in the graph. Nevertheless, a high recovery of PETN from the sample collected at 30 days was obtained which demonstrated that PETN was stable in the extract, even at higher temperature. However, a sharp drop in recovery was found for the extract stored in the freezer for one month. There was no indication of any degradation of the PETN as no new peak was observed in the chromatograms for these samples (Figure 6-2). The low recovery was possibly the result of the change in solubility of PETN at very low temperature which lead to the adsorption of PETN onto the glass surface. Future investigation is required in order to clarify this phenomenon.
Stability of explosive residues on polyester wipes and in methanol/water extracts
161
Figure 6-1 Recovery of PETN spiked in an extract from a blank polyester wipe and stored at room temperature (top), in the refrigerator (bottom left), and in the freezer (bottom right), measured over a period of 30 days. The error bars represent the standard deviation (1 SD) of three replicate samples per experiment. (The dotted line in the graph for the refrigerator storage indicates where a change in temperature occurred during the course of the experiment.)
Figure 6-2 Chromatograms of the extracts from polyester wipes stored in the freezer and collected on the thirtieth day of the experiment. a) extract spiked with PETN and prepared on the that day of analysis (i.e. positive control); b) negative control stored in the freezer over a period of 30 days; and c) extract spiked with PETN and stored in the freezer over a period of 30 days.
Minutes
1 2 3 4 5 6 7 8 9 10 11 12
mA
U
0
2
4
6
8
10
12
14
16
18
mAU
0
2
4
6
8
10
12
14
16
18
DAD: Signal A, 212 nm/Bw:4 nm Ref 300 nm/Bw:100 nm+30
DAD: Signal A, 212 nm/Bw:4 nm Ref 300 nm/Bw:100 nm30FZ1-E
DAD: Signal A, 212 nm/Bw:4 nm Ref 300 nm/Bw:100 nmB30FZ-E
a
b
c
Stability of explosive residues on polyester wipes and in methanol/water extracts
163
A drop in recovery was also observed in the case of PETN on the wipe stored in the freezer (Figure 6-3). However the magnitude of the loss was not as high as in the case of PETN in the extract. Under other storage conditions, good stability of PETN was observed for both the wipe and the deposit on the glass surface as shown in Figures 6-3 and 6-4.
PETN - Wipe
Clear Vial at 20 ± 3°C
Elapsed time in days
0 5 10 15 20 25 30
% R
ecov
ery
0
20
40
60
80
100
0
20
40
60
80
100
PETN - WipeAmber Vial at 20 ± 3°C
Time (day)
0 5 10 15 20 25 300
20
40
60
80
100
% R
ecov
ery
0
20
40
60
80
100
PETN - Wipe10 ± 2°C (22 days), 16 ± 1°C (8 days)
Time (days)
0 5 10 15 20 25 30
%R
ecov
ery
0
20
40
60
80
100
0
20
40
60
80
100
PETN - Wipe-21 ± 1°C
Time (days)
0 5 10 15 20 25 300
20
40
60
80
100
% R
ecov
ery
0
20
40
60
80
100
Figure 6-3 Recovery of PETN spiked on polyester wipes and stored at room temperature (top), in the refrigerator (bottom left), and in the freezer (bottom right), measured over a period of 30 days. The error bars represent the standard deviation (1 SD) of three replicate samples per experiment. (The dotted line in the graph for the refrigerator storage indicates where a change in temperature occurred during the course of the experiment.)
Figure 6-4 Recovery of PETN deposited on glass slides inserted in a slide mailer, packaged within a heat-sealed nylon bag stored at room temperature and in the refrigerator, measured over a period of 30 days. The error bars represent the standard deviation (1 SD) of three replicate samples per experiment. (The dotted line in the graph for the refrigerator storage indicates where a change in temperature occurred during the course of the experiment.)
The degradation of TNT was found both in the extracts and on the wipes when stored in a clear glass vial at room temperature. However, TNT was relatively stable in the samples stored in amber vials at room temperature and under other storage conditions (Figures 6-5 and 6-6).
Stability of explosive residues on polyester wipes and in methanol/water extracts
Figure 6-5 Recovery of TNT spiked in extracts from blank polyester wipes stored at room temperature (top), in the refrigerator (bottom left), and in the freezer (bottom right), measured over a period of 30 days. The error bars represent the standard deviation (1 SD) of three replicate samples per experiment. (The dotted line in the graph for the refrigerator storage indicates where a change in temperature occurred during the course of the experiment).
Chapter 6
166
TNT - Wipe
Clear Vial at 20 ± 3°C
Elapsed time in days
0 5 10 15 20 25 30
% R
ecov
ery
0
20
40
60
80
100
0
20
40
60
80
100
TNT - WipeAmber Vial at 20 ± 3°C
Elapsed time in days
0 5 10 15 20 25 300
20
40
60
80
100
% R
ecov
ery
0
20
40
60
80
100
TNT - Wipe10 ± 2°C (18 days), 16 ± 1°C (12 days)
Elapsed time in days
0 5 10 15 20 25 30
%R
ecov
ery
0
20
40
60
80
100
0
20
40
60
80
100
TNT - Wipe-21 ± 1°C
Elapsed time in days
0 5 10 15 20 25 300
20
40
60
80
100
% R
ecov
ery
0
20
40
60
80
100
Figure 6-6 Recovery of TNT spiked on polyester wipes stored at room temperature (top), in the refrigerator (bottom left), and in the freezer (bottom right), measured over a period of 30 days. The error bars represent the standard deviation (1 SD) of three replicate samples per experiment. (The dotted line in the graph for the refrigerator storage indicates where a change in temperature occurred during the course of the experiment.)
The chromatograms for the TNT samples stored in clear glass vials at room temperature (both in extracts and on the wipes) provided evidence of degradation as a new peak was found eluting after the TNT peak (Figure 6-7). This new peak could be observed in the chromatogram of TNT samples collected from 5 days onward.
Stability of explosive residues on polyester wipes and in methanol/water extracts
167
Figure 6-7 Chromatograms of the samples extracted from polyester wipes containing TNT (TNT solution deposited on the wipes) collected on the thirtieth day of the experiment: a) stored in a clear vial at room temperature; b) stored in an amber vial at room temperature; and c) stored in the freezer.
Based on the retention time and UV spectrum, the new peak was tentatively characterised as being 2-amino-4,6-dinitrotolune. This reduced amino derivative was reported to be one of the products generated from the microbial degradation of TNT [Esteve-Núñez, Caballero & Ramos 2001]. However, degradation by the action of bacteria is unlikely to occur in this testing environment because of the large amount of alcohol in the extract and on the wipe. In addition, if the biotransformation was the major cause of the loss of TNT then the decrease in recovery should also be observed in the case of storage in amber vials at the same temperature. The results imply that structural changes due to the effect of light (i.e. phototransformation) plays a major role in the decrease in TNT concentration in the samples.
The phototransformation of TNT has been extensively studied. By the action of sunlight or UV irradiation, trinitrobenzyl anion is formed [Burlinson et al. 1979] and this intermediate can be converted to various compounds such as acid, aldehyde, nitrile and nitrophenol depending on the condition and other compounds that might be present in the reaction mixture
20DAD: Signal A, 250 nm/Bw:10 nm Ref 360 nm/Bw:100 nm30RTA1-swab
DAD: Signal A, 250 nm/Bw:10 nm Ref 360 nm/Bw:100 nm30RTC1-swab
DAD: Signal A, 250 nm/Bw:10 nm Ref 360 nm/Bw:100 nm30FZ1-swab
a
b
c
Chapter 6
168
[Godejohann et al. 1998, Yinon 1999, p.188]. Because the new peak observed from samples stored in clear vials at room temperature was not fully characterised, it was difficult to conclusively determine what the actual compound was. Nonetheless, the results from this experiment provided crucial information that TNT could be lost by the influence of light when the extract or the wipe were stored at room temperature in a clear vial. Storage in an amber vial prevented this transformation from occurring.
Figure 6-8 Recovery of TNT deposited on glass slides inserted in a slide mailer, packaged within a heat-sealed nylon bag stored at room temperature and in the refrigerator, measured over a period of 30 days. The error bars represent the standard deviation (1 SD) of three replicate samples per experiment. (The dotted line in the graph for the refrigerator storage indicates where a change in temperature occurred during the course of the experiment.)
As illustrated in Figure 6-8, a loss of TNT deposited on the glass substrate was observed under both storage conditions. However, no new peak was found in the chromatogram as in the previous case of TNT in extracts or on wipes (Figure 6-9).
Stability of explosive residues on polyester wipes and in methanol/water extracts
169
Figure 6-9 Chromatograms of TNT samples recovered from glass slides in slide mailers packaged within heat-sealed nylon bags and collected on the fifteenth day of the experiment: a) stored at room temperature; b) stored in the refrigerator; and c) positive control prepared on the day of sample analysis.
It was speculated that the decreases in recovery was a result of the volatilisation of TNT during the storage; the TNT deposit on the glass substrate was barely visible on the fifteenth and thirtieth day of collection. In general, military explosives such as TNT have a very low vapour pressure which means that only a very low concentration will exist in the gas phase under normal conditions. However, with the trace amount used in these experiments, the loss of TNT through a process of volatilisation (and redeposition elsewhere within the packaging) may be possible. Again, this emphasizes the need for more studies in this area to obtain further information on the retention of trace explosives on various substrates during storage.
Before discussion of the results obtained from the TATP samples, a change in the analytical procedure for the TATP samples needs to be explained. During the storage of TATP samples, there is a possibility that hydrogen peroxide might be formed as a degradation product, rendering the need to modify the current quantitative method which is based on the conversion of TATP to hydrogen peroxide. As hydrogen peroxide can react with the reagent
9DAD: Signal A , 250 nm/Bw:10 nm Ref 360 nm/Bw:100 nm15FD1surf
DAD: Signal A, 250 nm/Bw:10 nm Ref 360 nm/Bw:100 nm15RT1surf
DAD: Signal A, 250 nm/Bw:10 nm Ref 360 nm/Bw:100 nm+15surf
a
c
b
Chapter 6
170
without the requirement of an acid, the additional step of measuring the absorbance from the reaction between the sample and colorimetric reagent (without the acid degradation step) could provide the correction factor for the hydrogen peroxide that might be generated during the storage.
A set of solutions containing mixtures of known amounts of TATP and hydrogen peroxide and a set of solutions containing known amounts of TATP without hydrogen peroxide were prepared. The effect of hydrogen peroxide in the mixture on the calculation of the recovery of TATP was investigated. It was found that the additional measurement before the acid degradation step could provide a satisfactory correction to obtain the actual amount of TATP in the mixture. However, if the absorbance from the sample before the acid degradation step exceeded 0.14, there was found to be a large error in the calculated amount of TATP in the mixture and required the separation of hydrogen peroxide from the TATP samples. In fact more than 98% of TATP samples did not require a correction at all as the absorbance, measured before acid degradation step, of TATP samples at time zero was found to be approximately the same as samples analysed on the twenty ninth day of storage.
As shown in Figures 6-10 and 6-11, TATP was relatively stable in the extracts and on the wipes. With the modification to the quantitative method as described, it is unlikely that the calculated recovery was affected by small amounts of hydrogen peroxide that may have been generated during the storage. The TATP results from both the extracts and the (wet) wipes indicate that the preferred way for the storage of TATP was in solution or on moistened swabs/wipes. This was supported by the results regarding the retention of TATP on the glass substrate (Figure 6-12), where a major loss of TATP was observed that occurred within 6 days, even with samples stored in the refrigerator. It was found that the way to minimise the loss of TATP through volatilisation was through storage at a very low temperature (e.g. minus 80°C) as illustrated in the results in Figure 6-13.
Stability of explosive residues on polyester wipes and in methanol/water extracts
171
Figure 6-10 Recovery of TATP spiked in extracts from blank polyester wipes stored at room temperature (top), in the refrigerator (bottom left), and in the freezer (bottom right), measured over a period of 29 days. The error bars represent the standard deviation (1 SD) of three replicate samples per experiment. (The dotted line in the graph for the refrigerator storage indicates where a change in temperature occurred during the course of the experiment.)
Figure 6-11 Recovery of TATP spiked on polyester wipes stored at room temperature (top), in the refrigerator (bottom left), and in the freezer (bottom right), measured over a period of 29 days. The error bars represent the standard deviation (1 SD) of three replicate samples per experiment. (The dotted line in the graph for the refrigerator storage indicates where a change in temperature occurred during the course of the experiment.)
Stability of explosive residues on polyester wipes and in methanol/water extracts
173
TATP - Glass Slide
20 ± 3°C
Elapsed time in days
0 2 4 6 8 10 12 14
% R
ecov
ery
0
20
40
60
80
100
0
20
40
60
80
100
TATP - Glass Slide10 ± 2°C
Elapsed time in days
0 2 4 6 8 10 12 140
20
40
60
80
100
%R
ecov
ery
0
20
40
60
80
100
Figure 6-12 Recovery of TATP deposited on glass slides inserted in slide mailers packaged within heat-sealed nylon bags stored at room temperature and in the refrigerator, measured over a period of 13 days. The error bars represent the standard deviation (1 SD) of three replicate samples per experiment.
Chapter 6
174
TATP - glass slide
Tim
e Ze
ro
5 da
ys m
inus
80°
C
5 da
ys m
inus
20°
C
5 da
ys 4
°C
5 da
ys 1
8°C
% R
ecov
ery
0
20
40
60
80
100
0
20
40
60
80
100
Figure 6-13 Recovery of TATP deposited on glass slides inserted in slide mailers packaged within heat-sealed nylon bags stored at various temperatures over a period of 5 days. The error bars represent the standard deviation (1 SD) of three replicate samples per experiment.
RDX and the two inorganic compounds were found to be stable both in extracts and on the wipes under all storage conditions as depicted in Figures 6-14 to 6-22. Due to technical problems with the refrigerator employed in this study, the nitrate samples deposited on glass slide and all RDX samples retained for 30 days under refrigerator storage conditions were not available for analysis.
Stability of explosive residues on polyester wipes and in methanol/water extracts
175
Figure 6-14 Recovery of RDX spiked in extracts from blank polyester wipes stored at room temperature (top), in the refrigerator (bottom left), and in the freezer (bottom right), measured over a period of 30 days. The error bars represent the standard deviation (1 SD) of three replicate samples per experiment. (The dotted line in the graph for the refrigerator storage indicates where a change in temperature occurred during the course of the experiment.)
Figure 6-15 Recovery of RDX spiked on polyester wipes stored at room temperature (top), in the refrigerator (bottom left), and in the freezer (bottom right), measured over a period of 30 days. The error bars represent the standard deviation (1 SD) of three replicate samples per experiment. (The dotted line in the graph for the refrigerator storage indicates where a change in temperature occurred during the course of the experiment.)
RDX - WipeClear Vial at 20 ± 3°C
Elapsed time in days
0 5 10 15 20 25 30
% R
ecov
ery
0
20
40
60
80
100
0
20
40
60
80
100
RDX - WipeAmber Vial at 20 ± 3°C
Elapsed time in days
0 5 10 15 20 25 300
20
40
60
80
100
% R
ecov
ery
0
20
40
60
80
100
RDX - Wipe10 ± 2°C (5 days), 16 ± 1°C (10 days)
Elapsed time in days
0 5 10 15 20 25 30
%R
ecov
ery
0
20
40
60
80
100
0
20
40
60
80
100
RDX - Wipe-21 ± 1°C
Elpased time in days
0 5 10 15 20 25 300
20
40
60
80
100
% R
ecov
ery
0
20
40
60
80
100
Stability of explosive residues on polyester wipes and in methanol/water extracts
177
Figure 6-16 Recovery of RDX deposited on glass slides inserted in slide mailers packaged within heat-sealed nylon bags stored at room temperature and in the refrigerator, measured over a period of 30 days. The error bars represent the standard deviation (1 SD) of three replicate samples per experiment. (The dotted line in the graph for the refrigerator storage indicates where a change in temperature occurred during the course of the experiment.)
Figure 6-17 Recovery of chlorate spiked in extracts from blank polyester wipes stored at room temperature (top), in the refrigerator (bottom left), and in the freezer (bottom right), measured over a period of 30 days. The error bars represent the standard deviation (1 SD) of three replicate samples per experiment. (The dotted line in the graph for the refrigerator storage indicates where a change in temperature occurred during the course of the experiment.)
Stability of explosive residues on polyester wipes and in methanol/water extracts
179
Figure 6-18 Recovery of chlorate spiked on polyester wipes stored at room temperature (top), in the refrigerator (bottom left), and in the freezer (bottom right), measured over a period of 30 days. The error bars represent the standard deviation (1 SD) of three replicate samples per experiment. (The dotted line in the graph for the refrigerator storage indicates where a change in temperature occurred during the course of the experiment.)
Figure 6-19 Recovery of chlorate deposited on glass slides inserted in slide mailers packaged within heat-sealed nylon bags stored at room temperature and in the refrigerator, measured over a period of 30 days. The error bars represent the standard deviation (1 SD) of three replicate samples per experiment. (The dotted line in the graph for the refrigerator storage indicates where a change in temperature occurred during the course of the experiment.)
Stability of explosive residues on polyester wipes and in methanol/water extracts
181
Figure 6-20 Recovery of nitrate spiked in extracts from blank polyester wipes stored at room temperature (top), in the refrigerator (bottom left), and in the freezer (bottom right), measured over a period of 30 days. The error bars represent the standard deviation (1 SD) of three replicate samples per experiment. (The dotted line in the graph for the refrigerator storage indicates where a change in temperature occurred during the course of the experiment.)
Figure 6-21 Recovery of nitrate spiked on polyester wipes stored at room temperature (top), in the refrigerator (bottom left), and in the freezer (bottom right), measured over a period of 30 days. The error bars represent the standard deviation (1 SD) of three replicate samples per experiment. (The dotted line in the graph for the refrigerator storage indicates where a change in temperature occurred during the course of the experiment.)
Stability of explosive residues on polyester wipes and in methanol/water extracts
183
Figure 6-22 Recovery of nitrate deposited on glass slides inserted in slide mailers packaged within heat-sealed nylon bags stored at room temperature and in the refrigerator, measured over a period of 30 days. The error bars represent the standard deviation (1 SD) of three replicate samples per experiment. (The dotted line in the graph for the refrigerator storage indicates where a change in temperature occurred during the course of the experiment.)
6.3 Conclusions
The results from the stability study covering all six representative compounds suggested that, after sampling, the swab or wipe should be stored in a dark and low temperature environment. Storage at room temperature over a period of up to one month could be possible provided that an amber vial is used as a container. This would minimise the loss of nitroaromatics such as TNT that might occur through the action of light. The extract, after processing using the proposed protocol, should also be stored under dark and low temperature conditions. As there was a question regarding the loss of PETN stored in the freezer, an ordinary glass container should not be used for long-term storage of the extracts under very low temperature condition. The final recommendation for the storage of extracts is to consider the use of plastic or silanised glass vials as a container if further investigations confirm that adsorption on the glass surface of the container is the major cause of the decrease in the amount of recovered PETN.
The results regarding the retention of the six target compounds on the glass substrate suggested that exhibits should be stored at the lowest temperature possible to minimise the loss of TNT or TATP that might be contained in the sample. Nevertheless, it was clear that all
six representative compounds demonstrated a better stability on the wipes than on the glass surface. Therefore, storage as a wipe (or storage of the extract from the wipe) would be a preferable to storage of the whole exhibit.
6.4 References
Burlinson, N.E., Sitzman, M.E., Kaplan, L.A. & Kayser, E. 1979, 'Photochemical generation of the 2,4,6-trinitrobenzyl anion', Journal of Organic Chemistry, vol. 44, no. 21, pp. 3695-3698.
Douglas, T.A., Johnson, L., Walsh, M. & Collins, C. 2009, 'A time series investigation of the stability of nitramine and nitroaromatic explosives in surface water samples at ambient temperature', Chemosphere, vol. 76, no. 1, pp. 1-8.
Esteve-Núñez, A., Caballero, A. & Ramos, J.L. 2001, 'Biological degradation of 2,4,6-trinitrotoluene', Microbiology and Molecular Biology Reviews, vol. 65, no. 3, pp. 335-352.
Godejohann, M., Astratov, M., Preiss, A., Levsen, K. & Mügge, C. 1998, 'Application of continuous-flow HPLC-proton-nuclear magnetic resonance spectroscopy and HPLC-thermospray-mass spectroscopy for the structural elucidation of phototransformation products of 2,4,6-trinitrotoluene', Analytical Chemistry, vol. 70, no. 19, pp. 4104-4110.
Hawari, J., Beaudet, S., Halasz, A., Thiboutot, S. & Ampleman, G. 2000, 'Microbial degradation of explosives: biotransformation versus mineralization', Applied Microbiology and Biotechnology, vol. 54, no. 5, pp. 605-618.
Kolla, P. & Hohenstatt, P. 1993, 'Stability of explosives traces on different supports', Forensic Science International, vol. 60, no. 1-2, pp. 127-137.
Monteil-Rivera, F., Halasz, A., Groom, C., Zhao, J.-S., Thiboutot, S., Ampleman, G. & Hawari, J. 2009, 'Fate and transport of explosives in the environment a chemist’s view', in Ecotoxicology of explosives, Sunahara, G.I., Lotufo, G., Kuperman, R.G. & Hawari, J., eds. Boca Raton: CRC Press, pp. 5-33.
Pachman, J. & Matyáš, R. 2010, 'Study of TATP: Stability of TATP solutions', Forensic International, doi:10.1016/j.forsciint.2010.10.010
Perret, D., Marchese, S., Gentili, A., Curini, R., Terracciano, A., Bafile, E. & Romolo, F. 2008, 'LC–MS–MS Determination of stabilizers and explosives residues in hand-swabs', Chromatographia, vol. 68, no. 7-8, pp. 517-524.
Stability of explosive residues on polyester wipes and in methanol/water extracts
185
Rosser, S.J., Basran, A., Travis, E.R., French, C.E. & Bruce, N.C. 2001, 'Microbial transformations of explosives', Advances in Applied Microbiology, vol. 49, pp. 1-35.
Spain, J.C., Hughes, J.B. & Knackmuss, H.-J., eds. 2000, Biodegradation of nitroaromatic compounds and explosives, Boca Raton: Lewis Publishers.
Twibell, J.D., Home, J.M., Smalldon, K.W., Higgs, D.G. & Hayes, T.S. 1982, 'Assessment of solvents for the recovery of nitroglycerine from hands using cotton swabs', Journal of Forensic Science, vol. 27, no. 4, pp. 792-800.
Yinon, J. 1999, Forensic and Environmental Detection of Explosives, Chichester: John Wiley & Sons.
186
187
CHAPTER 7 SUMMARY AND FUTURE DIRECTIONS
7.1 Summary of the study
The criminal use of improvised organic/inorganic explosive mixtures is on the increase and has the potential to pose serious problems for modern day forensic casework in terms of the current sequential sampling methods that separately target organic and inorganic compounds. This potential exists in instances where both organic and inorganic potential constituents are not targeted. The aim of this research was to develop and evaluate a universal sampling procedure for explosive residues using a combined swab to maximise the opportunity for a recovering – in a single step – the broad range of explosive compounds (both organic and inorganic) that might be present in any residues deposited on a suspect surface. During the research, each element of the protocol was examined, starting from initial sampling (using a swab or wipe), the extraction of any explosive traces out of the sampling media, and then clean-up of the subsequent extract. Each step was optimised to ensure that all representative compounds, both organic and inorganic, could be efficiently and effectively recovered, detected and identified.
Commercially available skin cleansing alcohol wipes were extensively investigated for their potential use as a universal swab. These sterile wipes have a number of advantages for operational use. They are affordable, easy to handle, and pose no OH&S issues. More importantly is the format of individually sealed packs that can be readily transported on commercial aircraft. As these wipes are pre-saturated with a suitable solvent (70% isopropanol in water), no separate bulk solvent is required for their use as residue collection media.
Six compounds with the potential to be encountered in casework (TNT, RDX, PETN, TATP, ammonium nitrate, and sodium chlorate) were selected as representative target compounds for
Chapter 7
188
the evaluation of the alcohol wipes as a sampling media. The chosen alcohol wipes demonstrated better overall performance in the recovery of both the organic and inorganic representative compounds from each of the test surfaces compared to the results obtained using conventional cotton and polyester swabs pre-moistened with various solvents.
A range of mixture between water and three organic solvents (acetone, acetonitrile and methanol) were tested as solvents for a single-step extraction. A mixture of 60% methanol in water was found to be the best compromise extraction solvent for the recovery of both organic and inorganic compounds from the alcohol wipes. This solvent was also found to be compatible with the subsequently optimised clean-up procedure.
The separation of the extract from the alcohol wipe into organic and inorganic fractions was achieved by means of solid-phase extraction (SPE). During the first stage of the clean-up procedure, the organic explosive compounds are retained on the SPE cartridge while any inorganic compounds pass through for collection and identification. After the cartridge is washed to remove interfering compounds, the organic explosives are finally eluted from the cartridge with the aid of an eluting solvent. Of the five SPE cartridges evaluated, the ABS ELUT Nexus cartridge was found to be the most suitable for cleaning-up the extracts from the alcohol wipes. Each step of the universal sampling protocol developed in this study, including the optimised clean-up procedure, is summarised in the following flow chart.
1. A polyester alcohol wipe is applied with a gloved hand to the suspect surface to collect any residue from that surface. Each wipe is then transferred into a 4 mL glass vial that is capped for storage.
Summary and future directions
189
2. One milliliter of 60% methanol/water is added to the vial and the vial is sealed with Parafilm®.
3. Extraction is carried out by sonication in an ultrasonic bath for 10 minutes. While waiting for the extraction to be completed, a Nexus SPE cartridge is conditioned by washing with 3 × 1 mL of methanol and then 3 × 1 mL of deionised water.
5. After collection of the inorganic fraction, the cartridge is washed with 2 mL of 60% methanol/water followed by 500 µL of acetonitrile. All the effluent from this step is discarded.
4. When the extraction is completed, the vial is allowed to cool to room temperature. The wipe in the vial is then pounded with the tip of a glass Pasteur pipette and the extract drawn through the wipe and transferred directly into the conditioned Nexus cartridge followed by 500 µL of deionised water. All the effluent collected from the sample loading and from the deionised water flush is combined and subjected to analysis for the detection and identification of inorganic compounds.
Chapter 7
190
Due to the limited number of publications available that relate to sampling procedures for the combined recovery of organic/inorganic explosive compounds, it is difficult to assess the relative effectiveness of the proposed protocol compared to other established protocols utilised in forensic casework. Nevertheless, the good recovery for both organic (approximate 70%) and inorganic (approximate 50%) target compounds, which were both tested within realistic concentration ranges, indicates that the proposed protocol is feasible for the efficient and effective recovery of explosive residues.
The stability of the representative explosive compounds on the polyester wipes and in the extracts was found to be relatively good over a period of 30 days when stored in glass vials at low temperature (refrigerator or freezer). Sampling wipes and extracts can also be stored at room temperature provided that amber glass vials are used as the storage container to prevent the loss of nitroaromatics through phototransformation.
It was found that TNT and TATP deposits on a glass substrate have a low retention which is consistent with the previous studies [Kolla & Hohenstatt 1993, Arai & Nakamura 1997]. As these phenomena was observed even when stored in a sealed container at low temperature (refrigerator or freezer), this suggests that very low storage temperatures are required if exhibits are retained that may have traces of such substances. Preferably, such exhibits should be swabbed as soon as possible and the swabs/wipes (or their extracts) stored in glass vials at low temperature.
Overall, this study has lead to the development of an optimised sampling and clean-up protocol for the simultaneous collection of both organic and inorganic explosive residues. The relevant parameters in each step of protocol were comprehensively investigated and filled a
6. The cartridge is finally eluted with 500 µL of acetonitrile and the effluent is collected for subsequent analysis of the organic compounds. An additional step of drying the acetonitrile fraction with an anhydrous salt (e.g. sodium sulphate) is necessary if GC-MS is to be used as the final instrumental method. This drying step is not required if an LC method is employed.
Summary and future directions
191
critical gap which was not addressed in other previous study, particularly the type of solvent and the composition for extraction of explosive compounds from sampling media, also the recovery of explosive compounds from other type of common surface such as laminate sheet. In addition, new information has been generated regarding the stability of representative target compounds on a test substrate (glass), on polyester wipes, and in wipe extracts. A number of recommendations have been made that, if implemented by operational forensic laboratories, could maximise the recovery of explosive traces on surfaces of interest.
7.2 Future directions
There were several findings from this study that remain inconclusive due to time constraints and/or a lack of supporting information. Particular matters that could be pursued in subsequent studies are listed below.
• The low extraction recovery of TNT from regenerated cellulose wipes using acetone as a solvent needs to be further investigated. It needs to be established whether a low recovery would still be obtained using acetone purchased from other suppliers. There may also be specific interactions between TNT and the regenerated cellulose media that may have caused the low extraction efficiency observed.
• The application of a mixture of ethanol/water as an extraction solvent for alcohol wipes justifies investigation given that the toxicity of methanol is a concern. The extraction profiles for both organic and inorganic explosives from alcohol wipes using this solvent system need to be established and the compatibility of this solvent system with the subsequent SPE procedure also requires further study.
• Polar hydrophilic polymeric SPE cartridges that became commercially available during this study should be evaluated and compared with the Nexus cartridge, particularly if these new phases contain ester functional groups.
• In term of identifying inorganic compounds using ion chromatography, the large amount of methanol in the fraction collected from the SPE step may not be compatible with this analytical method. The effect of methanol on the performance of ion
Chapter 7
192
chromatographic techniques needs to be investigated and changes made to the analytical protocol as required.
• The feasibility of the proposed protocol also requires validation for the recovery of residues from the detonation of simulated explosive devices containing various mixtures of organic and inorganic compounds.
• The application of the proposed protocol in the recovery of other types of organic peroxides, such as HMTD or MEKP, is another area for further exploration given the significant variations in properties for members of this class of explosive.
• Longer storage times need to be investigated for a better understanding of sample breakdown and reduced target compound recovery. Also, the stability of explosive compounds stored in silanised glassware or in plastic containers also needs to be investigated in order to ascertain whether adsorption onto the surface of the containers may contribute to reduced recovery as was observed with solutions of PETN stored in the freezer.
7.3 References
Arai, H. & Nakamura, J. 1997, 'Analysis of Triacetonetriperoxide', in Current Topics in Forensic Science: Proceedings of the 14th Meeting of the International Association of Forensic Sciences, August 26-30, 1996, Tokyo, Japan, Takatori, T. & Takasu, A., eds. Ottawa, Canada: Shunderson Communications, pp. 209-211.
Kolla, P. & Hohenstatt, P. 1993, 'Stability of explosives traces on different supports', Forensic
Science International, vol. 60, no. 1-2, pp. 127-137.
193
APPENDICES
194
195
APPENDIX 1 SURVEY ON THE COLLECTION, SAMPLE PREPARATION AND ANALYSIS OF EXPLOSIVE RESIDUES
The purpose of conducting this survey was to gather information on the swabbing procedures that are currently used for recovery of explosive residues by a representative number of forensic laboratories (both domestic and international). The details of the method for swab processing, the type of container used, the typical timeframe for storage, and the analytical techniques used for the identification of compounds in the swab extracts were all covered by the questions contained within the survey. The questionnaire, which was distributed to a range of laboratories that engage in the analysis of explosive residues, is shown below together with details of the responses provided to each question. The survey was sent to 76 laboratories and 21 responses were received (a response rate of 28%).
Survey on the Collection, Sample Preparation and Analysis of Explosive Residues
Laboratory: ……………………………………………………………………….….……
Completed by: ………………………………………………………………….…………
Email address: ……………………………………………………………….……………
Date: ………………………..
1. What material does your lab use for the swabbing of explosive residues? Cotton wool Cotton swab Pre-manufactured kit (please specify the vendor: ………………………………..) Other (please specify: …………………………………………………………….)
Cotton wool – 3; Cotton swab – 13; Pre-manufactured kit – 3 (two made in-house, one used acrylan in the kit and another used cotton wool, the third response specified a swab supplied
Appendix 1
196
by Copan with no details of the material); Non-woven gauze – 2 (one made from cotton and another was a mixture between rayon and polyester); Polyester or rayon swab – 1.
One laboratory did not provide an answer, with the reason being that the lab only performs the analysis not the collection. The total number detailed above is more than twenty one (the total number of response received) as some laboratories selected more than one answer.
2. Before the swabbing material is used in casework, are there any cleanup procedures or special treatments applied to them?
No Yes (please specify: …………………………………………………………….)
No – 14 Yes, cleaning with the same solvent as the swabbing solvent – 1; cleaning with a different solvent from the swabbing solvent – 2; Soxhlet with double distilled water – 1.
There were two strange answers to this question. One lab mentioned cleaning with water and soap and another lab responded with “possible filtration” as an answer. Again, one lab did not answer for the reason mentioned above.
3. How is the swabbing material stored before use? …………………………………………………………………………………………………..
In their original package – 8. Heat sealed foil – 2 (one used an in-house pre-manufactured kit, another used a cotton swab and answered yes in Q2). Heat sealed nylon bag – 2 (both used cotton wool and only one answered yes in Q2). Plastic bag – 5 (three used wool or gauze as the swabbing material; two used a cotton swab, one of the two using a cotton swab and answered yes in Q2). Glass vial/jar – 3 (all three responses used cotton swabs and only one answered yes in Q2). No answer – 1, for the reason mentioned above.
Survey on the collection, sample preparation and analysis of explosive residues
197
4. What solvent is used to moisten the swabbing material for collecting residues? Methanol Acetone Ethanol Acetonitrile Water Dry swab (no solvent) Other solvent (please specify: …………………..…….)
If more than one swabbing process is used (eg. separate swabs for organic and inorganic residues) then please provide additional information: ……………………………………………………………………………….………………
Acetone (org) / Water (inorg) – 4. Acetonitrile (org) / Water (inorg) – 4. Methanol (org) / Water (inorg) – 1. Methanol (org) / Water or dry swab (inorg) – 1. Methanol (org) / Water (inorg) / Ethanol for human skin / Dry for sooth – 1. Acetone (org) / Water (inorg) / Ethanol-water only for polymeric surfaces – 1. Acetone or Acetonitrile (org) / Water (inorg) – 1. Dry as a first priority, Acetone (org) / Water (inorg) – 1. Dry as a first priority, Methanol (org) / Water (inorg) – 1. 50% Ethanol-water for combined organic/inorganic – 1. Isopropanol – 1. The following responses selected more than one solvent but did not detail which solvent they use for organics and which solvent for inorganics: Acetone, Dry Methanol, Dry Dry, water Acetonitrile, water, dry
Appendix 1
198
5. How are swabs stored after sampling (prior to analysis)? ……………………………………………………………………………………………….…..
The majority of the answers indicated the same container for storage of the swabbing material before use. Where the container indicated was different, glass vials were the common container for keeping swabbing material after sampling. In term of temperature for storage, only a few responses detailed this in their answer and both fridge and freezer were mentioned as options in an approximately equal ratio.
6. What is the typical storage time between swabbing and preparation/analysis? …………………………………………………………………………………………….……..
A period of several weeks was the common estimated time. One day was found in the response from two laboratories and one lab provided an exact storage time of 4 hours maximum. Another lab indicated that the estimated storage times depended on whether the swab is wet or dry; maximum one day for a wet swab and could be up to several weeks for a dry swab. One response indicated “still in question”.
7. How are extracts stored after analysis (e.g. archive samples)? ……………………………………………………………………………….…………………..
The most common answer for this question was “glass vial in the fridge”. One response mentioned “glass vial stored at room temperature”. Storage in the freezer was the answer from four responses and one of these four labs stored only the extracts that gave positive identification for explosives. Two laboratories indicated that they do not archive samples and they returned extracts with the exhibits to police or clients. One lab provided the maximum storage time of one month and then also returned the extracts with the exhibits. Two labs do not archive and they destroyed the sample and the extract. Another lab stored for 6 months and then destroyed all extracts and exhibits.
Survey on the collection, sample preparation and analysis of explosive residues
199
8. What technique is used to extract explosive compounds from the swab? SPE (please specify the packing: ………………………...……………………………) Headspace with SPME (please specify the fibre: ………...…………………………...) SFE Solvent extraction (please specify the solvent: ……….......……………....…………...) Other techniques (please specify: ........……………………......……………................)
Solvent extract using the same solvent as the swabbing solvent was the most common answer received for this question. Five laboratories use different solvent systems for the extraction. SPE was included in the answer for six responses. Four laboratories picked SPME and one of these four lab mentioned that they used SPME as the primary techniques. One response specified the utilisation of DFLEX (charcoal strips) only for the recovery of nitroglycerine and TATP. One laboratory indicated that SFE was also one of the options for swab extraction.
9. Indicate other treatments applied to the extract (e.g. volume reduction, additional clean-up techniques, etc.)
…...………………………………………………………………………………………………
Volume reduction was found in most answers to this question. Four laboratories mentioned that they filtered the extract and then performed a volume reduction. One response mentioned TLC as a clean-up technique and another response indicated that they added an internal standard to the extract.
10. Are there preliminary screening techniques applied to the extract prior to full instrumental analysis?
No Yes (please specify: …………………………………………………………….)
No – 9. Spot test – 6 (three of these six used spot test for only inorganic extract); TLC – 3 (one of these three only used TLC for screening non-volatile compounds such as nitrocellulose); HPLC-DAD – 1; Ionscan or EGIS for organic extracts – 2
Appendix 1
200
11. What techniques are commonly used in your lab for the identification of explosive compounds from swab extracts?
GC-MS GC-MS-MS GC-TEA GC-ECD LC-MS LC-MS-MS LC-Diode Array IC CE-Diode Array CE-MS Other (please specify: ………………………………………………….………..)
Wide ranging responses were encountered for this question. Nonetheless, there were some interesting observation from the answers received, listed as follows: Less than three techniques selected – 3/ Including Ionscan or EGIS – 2. No mass spectrometric techniques selected – 1. GC-MS not included – 3 (one of this three did not select any GC technique). LC-MS-MS – 7 (one did not included LC-MS). Neither IC or CE selected – 3 (one of this three selected only GC-MS). Both CE and IC included – 5. Only CE included – 1. Mentioned IC-MS – 2 (both also selected IC).
Survey on the collection, sample preparation and analysis of explosive residues
201
12. How many samples are run in each batch/sequence and what is the analysis time per sample?
In general, one batch or sequence is comprised of 10 to 15 samples (not including blanks and standards) and one sample takes from 15 to 45 minutes (not including sample preparation), depending on the technique. One response indicated that the analysis of one sample by GC-MS took one hour.
13. Are quantitative analyses included in your examination protocol? No Yes (please specify: ……………………………………………………………….)
No – 15.
Yes – 4 (two of this four mentioned only for bulk analysis).
Semi-quantitative – 1.
Not applicable – 1 (the lab only carried out the collection but sent to another lab for analysis).
Appendix 1
202
14. Apart from swabbing, are there other techniques applied in your lab for collecting explosive residues?
No Yes (please specify: ……………………………………………………………….)
There was a wide range techniques mentioned in the answer, including visual examination, solvent washing and vacuum lifting. However, five responses selected “no” as their answer to this question.
Thank you for your time in completing this survey. DUE: Friday 21st of March 2008
Please send the completed form to: Sarah Benson Forensic Operations, Australian Federal Police GPO Box 401, Canberra ACT 2601, Australia Email: [email protected] Fax: +61 2 6223 3270
203
APPENDIX 2 PRELIMINARY STUDY ON THE EFFICIENCY OF VARIOUS SOLVENTS FOR THE EXTRACTION OF ORGANIC EXPLOSIVES
Acetone, acetonitrile, methanol, ethanol, isopropanol and deionised water, which were all reported as swabbing solvents in the survey responses, were used in the extraction of three target compounds (PETN, TNT and RDX) from all selected sampling media (both wipes and swabs). Their extraction efficiency was assessed in a preliminary fashion in order to cut down on the number of variables for the subsequent investigation detailed in section 3.2 of Chapter 3.
A2.1 Experimental
A2.1.1 Materials and chemicals
The details of selected wipes and swabs are provided in section 3.1.1.1 of Chapter 3.
Hexahydro-1,3,5-trinitro-1,3,5-triazine (RDX), 2,4,6-trinitrotoluene (TNT), and pentaerythritol tetranitrate (PETN) at a certified concentration of 1000 μg/ml in acetonitrile and m-dinitrobenzene (99.5% certified purity) were obtained from ChemService, Inc. (West Chester, PA, USA). m-Dinitrobenzene (DNB) were prepared as a 1000 ppm solution in LiChroSolv® acetonitrile (gradient grade for liquid chromatography), which was supplied by Merck Pty. Ltd. (Kilsyth, VIC, Australia) and then 5 µL of this solution added into each sample solution as an internal standard for quantitative analysis. Acetonitrile and high purity water, obtained from a Satorius arium 611 water purification system, were filtered under vacuum through a 47 mm nylon filter membrane with a pore size 0.45 μm (supplied by Grace Davison Discovery Sciences, Rowville, VIC, Australia) prior to use in the HPLC mobile phase.
Appendix 2
204
HPLC grade acetone (LAB-SCAN Analytical Sciences, Bangkok, Thailand), HPLC grade acetonitrile (LiChroSolv®, Merck Pty, Ltd., Kilsyth, VIC, Australia), Analytical grade absolute ethanol (LabServ™, Biolab Australia Ltd., Clayton, VIC, Australia), HPLC grade methanol and HPLC grade isopropanol (both supplied by Ajax Finechem Pty., Ltd. Taren Point, NSW, Australia), and high purity deionised water were used as extracting solvents.
A2.1.2 Instrumentation
The analyses were performed on a chromatographic system consisting of a Waters 600E multisolvent delivery system, vacuum degasser, Waters 717plus autosampler and Waters 996 PDA detector. Instrumental control, data acquisition and analysis were accomplished using Empower 2 software.
An isocratic run at a flow rate of 1 mL/min on a 4.6 × 250 mm Nucleosil 100 (C18) analytical column with particle size of 10 µm was applied for each separation. The detection was accomplished by collecting the spectrum in the range 205–320 nm at a spectral resolution of 1.2 nm. The full conditions for the analysis of each explosive are provide in the table below.
Parameters RDX
Analysis TNT
Analysis PETN
Analysis
Injection volume (μL) 30 30 30
Percentage of acetonitrile in mobile phase 55 55 60
Wavelength for extracted chromatogram (nm) 235 230 215
Table A2-1 Chromatographic conditions for the analysis of each selected organic explosives
A2.1.3 Sample preparation
A 35 µL solution of PETN, TNT and RDX, which was equivalent to 35 µg of each target compound, was applied to each wipe and swab. The sampling media was then allowed to dry in a fume cupboard for 15 minutes before being transferred into a 4 mL clear glass vial. To each glass vial, one millilitre of extraction solvent was added. The vials were then sealed with Parafilm® and the extraction carried out by sonication in an ultrasonic bath for 10 minutes.
Preliminary study on the efficiency of various solvent
205
After 10 minutes of extraction, the vials were allowed to cool to room temperature. The wipes were pounded with the tip of a glass Pasteur pipette and the extract was subsequently drawn through the wipe and transferred into a 5 mL volumetric flask. In the case of swabs, the tip of a glass Pasteur pipette was punctured into the tip of the swab and the extract drawn through the swab material and transferred into a 5 mL volumetric flask. 5 µL of DNB solution was added as an internal standard and the volume made up with a mixture of acetonitrile and water (1:3). The amount of target compound in this final solution was quantified using the chromatographic method mentioned above. Seven-point calibration curves for the quantitative analyses, which covered the concentration range 0.4–10 ppm for all target compounds, were prepared on each day that sample analyses were conducted. Each standard solution was analysed in duplicate and in a random order. The linearity of the curve on each day was verified by examination of the residual plots of the analytical curves. The standard error of the regression (sy/x) was found to be in the range from 0.086 to 0.3545, with a high R2 term of 0.9919 – 0.9995 for all curves constructed. The sample solutions for RDX and TNT were analysed in duplicate, whereas triplicate analyses were conducted in the case of PETN. There were four repeats and one negative control for each test solvent on each sampling media, with three target compounds.
Appendix 2
206
RC wipe
Solvent
Acetone ACN MeOH EtOH IPA Water
% R
ecov
ery
0
20
40
60
80
100
0
20
40
60
80
100
PETN TNT RDX
A2.2 Results
Figure A2-1 Recovery (in percentage) of the three organic explosives from the regenerated cellulose wipes using six extraction solvents. The error bars were calculated from the standard deviation (1 SD) of the four replicate samples per experiment.
Preliminary study on the efficiency of various solvent
207
PolyEs wipe
Solvent
Acetone ACN MeOH EtOH IPA Water
% R
ecov
ery
0
20
40
60
80
100
0
20
40
60
80
100
PETN TNT RDX
Figure A2-2 Recovery (in percentage) of the three organic explosives from the polyester wipes using six extraction solvents. The error bars were calculated from the standard deviation (1 SD) of the four replicate samples per experiment.
Cotton
Solvent
Acetone ACN MeOH EtOH IPA Water
% R
ecov
ery
0
20
40
60
80
100
0
20
40
60
80
100
PETN TNT RDX
Figure A2-3 Recovery (in percentage) of the three organic explosives from the cotton swabs using six extraction solvents. The error bars were calculated from the standard deviation (1 SD) of the four replicate samples per experiment.
Appendix 2
208
PolyEs Swab
Solvent
Acetone ACN MeOH EtOH IPA Water
% R
ecov
ery
0
20
40
60
80
100
0
20
40
60
80
100
PETN TNT RDX
Figure A2-4 Recovery (in percentage) of the three organic explosives from the polyester swabs using six extraction solvents. The error bars were calculated from the standard deviation (1 SD) of the four replicate samples per experiment.
In general, a good recovery (more than 60 %) was obtained from all selected wipes and swabs with most of the solvents tested. There was a high variation among the samples extracted with isopropanol, especially in the case of TNT for most wipes and swabs. As a result, extraction with isopropanol was not included in the further study. Surprisingly, the extraction efficiency of deionised water was very good for TNT and RDX. However, the poor recovery of PETN when extracted with water preventing the application of this solvent. Low recovery was also found in the extraction of TNT from regenerated cellulose wipes with acetone. This finding was re-examined and discussed in section 3.2.2 of Chapter 3 and 4.1.2 of Chapter 4.
From consideration of the results from the selected sampling media, acetone, acetonitrile and methanol were chosen for further investigation (detailed in section 3.2 of Chapter 3), based on the overall good extraction efficiency and the popularity of these solvents (according to the results received from the survey).
Preliminary study on the efficiency of various solvent
209
A2.3 Conclusions
A good recovery of the three target compounds was obtained from most of the selected sampling media when acetone, acetonitrile, methanol and ethanol were used as an extraction solvent. However according to the survey responses, only acetone, acetonitrile and methanol were commonly used as extraction solvents therefore these three were chosen for further evaluation.
210
211
APPENDIX 3 INFORMATION ON THE TYPES OF ENVIRONMENTAL SURFACES SAMPLED FOR TESTING THE PROPOSED CLEAN-UP PROCEDURE
The performance of the proposed clean-up procedure needed to be evaluated with real-world samples containing environmental contaminants. In order to obtain a testing sample that had a matrix as close as possible to “real” samples submitted for explosives residue analysis, various types of outdoor and indoor surfaces were sampling using polyester wipes. These were subsequently used to generate a “background” extract that could be used to determine the recovery of target compound after being subjected to the proposed solid phase extraction procedure. The details of the surfaces, and the number of wipes collected on each surface, are shown in the following tables.
Surfaces Number of wipes collected
Laminate kitchen top from 2 premises in different suburbs
11
Keyboard in shared computer room 5
Door knob from three different doors in a “high traffic area”
5
Desk and arm rest from two lecture theatres 54
Total 75
Table A3-1 the type of indoor surfaces and the number of wipes collected.
Appendix 3
212
Surfaces Number of wipes collected
Metal - Alloys wheels from 5 cars, the
owners of 2 of these 5 cars living in the same premises
- Garden shed and garage doors from 4 premises in different suburbs
- Outdoor furniture (bare metal) from 2 premises in different suburbs
- Outdoor furniture (painted metal) from one location
23
17 5
7
Glass - Outdoor furniture from 2 premises
in different suburbs - Windows from 2 premises in
different suburbs
4
9
Plastic - Outdoor furniture from 2 premises
in different suburbs - Key pad of the ATM from one
location - Window display
11
2
4
Traffic signs around the university 25
Total 107
Table A3-2 The type of outdoor surfaces and the number of wipes collected.