51
Export market appraisal for broccoli and cauliflower Peter Gartrell Department of Agriculture & Food Western Australia Project Number: VG05028

Export market appraisal for broccoli and cauliflower
Peter Gartrell
Department of Agriculture & Food Western Australia
Project Number: VG05028

VG05028 This report is published by Horticulture Australia Ltd to pass on information concerning horticultural research and development undertaken for the vegetables industry. The research contained in this report was funded by Horticulture Australia Ltd with the financial support of the vegetable industry. All expressions of opinion are not to be regarded as expressing the opinion of Horticulture Australia Ltd or any authority of the Australian Government. The Company and the Australian Government accept no responsibility for any of the opinions or the accuracy of the information contained in this report and readers should rely upon their own enquiries in making decisions concerning their own interests. ISBN 0 7341 2093 1 Published and distributed by: Horticulture Australia Ltd Level 7 179 Elizabeth Street Sydney NSW 2000 Telephone: (02) 8295 2300 Fax: (02) 8295 2399 © Copyright 2009

VG05028 Export Market Situation Analysis for the Australian Cauliflower and Broccoli Industry
1
Export Market Situation Analysis for the
Australian Cauliflower and Broccoli Industry
Peter Gartrell Department of Agriculture and Food, Western Australia Final Report for Project VG05028 March 2009

VG05028 Export Market Situation Analysis for the Australian Cauliflower and Broccoli Industry
2
Project Team
Project Leader Peter Gartrell Regional Economist Department of Agriculture and Food WA PO Box 1231 Bunbury WA 6231 Tel – (08) 97806100 Fax – (08) 97806136 Email – [email protected] Team Members
Rachel Lancaster Dennis Phillips Research Officer Development Officer Department of Agriculture and Food WA PO Box 1231 Bunbury WA 6231
Department of Agriculture and Food WA Locked Bag 4 Bentley Delivery Centre WA 6983
Administrator
John Elliot Development Officer Department of Agriculture and Food WA Locked Bag 4 Bentley Delivery Centre WA 6983
Project Manager
Wayne Prowse Export Development Manager Horticulture Australia Limited Level 7, 179 Elizabeth Street Sydney NSW 2000 Email – [email protected]

VG05028 Export Market Situation Analysis for the Australian Cauliflower and Broccoli Industry
3
Funding Sources
Funding for the investigation conducted by this project was provided by Horticulture Australia Limited (HAL) and the Department of Agriculture and Food, Western Australia.
Important Disclaimer
Any recommendations contained in this publication do not necessarily represent current HAL Limited policy. No person should act on the basis of the contents of this publication, whether as to matters of fact or opinion or other content, without first obtaining specific, independent professional advice in respect of the matters set out in this publication.
The Chief Executive Officer of the Department of Agriculture and Food and the State of Western Australia accept no liability whatsoever by reason of negligence or otherwise arising from the use or release of this information or any part of it.

VG05028 Export Market Situation Analysis for the Australian Cauliflower and Broccoli Industry
1
Index Page Number
Index 1
List of figures and tables 2
1. Media Summary 4
2. Technical Summary 5
3. Introduction, background and objective 6
4. Materials and methods
4.1 Overview 7
4.2 Methodology 8
5. Research and analysis
5.1 Australian industry evaluation 8
5.2 Australian market performance 14
5.3 World market profile 23
5.4 Export market brief 27
5.5 Competitor analysis 35
6. Position statement and discussion 38
7. Recommendations 44
8. References and further reading 46

VG05028 Export Market Situation Analysis for the Australian Cauliflower and Broccoli Industry
2
List of figures and tables
Title Page
1 Australian total and domestic production of cauliflower and broccoli. 9
2 Australian production of cauliflower by State 2000-2007 9
3 Cauliflower production share by State for 2007 11
4 Australian production of broccoli by State 2000-2007 11
5 Broccoli production share by State for 2007 12
6 Cauliflower yields by Australian States 13
7 Broccoli yield by Australian States 14
8 Australian production, export volumes and values for cauliflower and broccoli 15
9 Annual export volumes and price 2000 to 2008 15
10 Trade weighted index for Australian exchange rate and average export price for
cauliflower and broccoli
16
11 Annual cauliflower export volumes by State 17
12 Average FOB export price for Australian cauliflower 17
13 Monthly cauliflower export volume for 2001 18
14 Monthly cauliflower export volumes by State for 2008 and Australia 2001 19
15 Annual broccoli export volumes by State 19
16 Average FOB export price for Australian broccoli 20
17 Monthly broccoli export volume for 2001 21
18 Monthly broccoli export volumes by State for 2008 and Australia 2001 21
19 Australian population and apparent consumption of cauliflower and broccoli
2000-2007
22
20 World production of cauliflower and broccoli 23
21 Selected countries export : production ratio for cauliflower and broccoli 24
22 Apparent consumption trend for cauliflower and broccoli for selected countries
and the world average (1990 – 2006)
25
23 Apparent consumption and GDP for India and China 25
24 Apparent consumption and GDP for Australia and the United Kingdom 26

VG05028 Export Market Situation Analysis for the Australian Cauliflower and Broccoli Industry
3
Title Page
25 Annual Australian exchange rate history for selected countries 26
26 Singapore imports of broccoli from Australia and China 28
27 Singapore imports of cauliflower from Australia and China 28
28 Malaysian import volumes and price for cauliflower and broccoli 30
29 Japanese import volume and price for broccoli 31
30 Japanese domestic wholesale price for broccoli 32
31 Japanese broccoli import price and volume from China and US 32
32 Australian monthly exports of broccoli to the UAE 33
33 Import volume and price for cauliflower and broccoli for the UAE (2005) 34
34 Import volume and price for Dubai Direct 35
35 Cost of production outline for Australian broccoli and cauliflower 36

VG05028 Export Market Situation Analysis for the Australian Cauliflower and Broccoli Industry
4
1. Media summary
The Australian fresh broccoli and cauliflower industries have experienced significant displacement in export markets. Exports for both products have declined rapidly in recent years. Export volumes of have collectively fallen by 92 per cent since its peak in 2001. Broccoli and cauliflower exports have primarily targeted the South East Asian and Japanese markets. Price is the key criteria in any export trade. Qualities such as shelf life and safety play a small part in markets such as Malaysia. More affluent consumers, such Singapore, have maintained a base level of demand for these criteria and the associated price premium. Australia still commands one third of the Singapore market for broccoli despite its apparent 100 per cent premium in price. The most significant shift in market dynamics has been the emergence of the Chinese vegetable industry. China now produces 45 per cent of the world’s cauliflower and broccoli. Its production has grown 51 per cent since the year 2000. Not surprisingly this corresponds to its increased export market presence. During this time countries such as Australia and the United States have reduced their exports, as a percentage of production, from approximately 30 to 5 per cent. China has a relatively low cost labour supply and subsequently a lower cost of production. Production growth and price competitiveness has been further spurred by government incentives such as tax relief and infrastructure support, particularly for export based business. Australian costs of production have been driven up primarily by wage, energy and fertilizer cost increases. Broccoli and cauliflower production systems have relatively high labour and low levels of mechanization throughout the supply chain. Exchange rates have further exacerbated export costs in recent times. Some gains in agronomic performance have softened these cost impacts. Australia’s collective yield performance for cauliflower and broccoli has increased by 1.5 per cent per annum since the year 2000. This includes the environmentally induced, substandard performances encountered by the traditionally largest producing State of Victoria. Australia’s production base for these products has collectively remained stable. Since the year 2000, cauliflower has declined 8.7 per cent in volume whilst broccoli has conversely increased 17.5 per cent. This increase in production, coupled with significant declines in exports, reveals a significant increase in apparent domestic consumption of approximately 3 per cent per annum. This exceeds the annual population growth of 1.4 per cent. The Australian cauliflower and broccoli industries need to consolidate by focusing on its strengths, particularly for the domestic and Singapore markets. Greater emphasis on cost competitiveness through agronomic and structural change is required. Continual monitoring of production and market competitiveness is required to steer these investments.

VG05028 Export Market Situation Analysis for the Australian Cauliflower and Broccoli Industry
5
2. Technical summary
From the year 2000 to 2007 Australian production of cauliflower fell by 8.7 per cent whilst broccoli increased by 17.5 per cent. Production has been dominated by Victoria and Queensland. In 2007 they collectively represented about two thirds of production of each product. Yield performances have been increasing by about 1.5 per cent per annum since 2000, despite some substandard performances in Victoria in recent times.
Australian domestic consumption has increased 20 percent or 0.89 kg per person since 2000. Apparent consumption of fresh cauliflower increased from 2.84 to 3.25 kg per capita. Fresh broccoli increased from 1.58 to 2.07 kg per capita. Domestic trends have dampened the impact of the decline in exports, particularly so for broccoli.
Cauliflower and broccoli exports represented approximately 30 per cent of production in the export peak of 2001. By 2007 this had declined to below 2 per cent. Export volumes of cauliflower and broccoli have collectively fallen by 92 per cent. Export value of fresh cauliflower and broccoli declined by $25.4m and $8.7m respectively from 2000 to 2008. Export FOB price for cauliflower increased by $0.44 per kilogram (36 per cent) and broccoli increased by $0.94 per kilogram (60 per cent). The price increase is the result of more favorable markets being maintained and increased opportunistic trade.
World production of cauliflower and broccoli was estimated to be 1.9 million metric tonnes in 2007. Since 2000 world production has increased 3.9 per cent per annum. China and India are the leading producers of cauliflower and broccoli with approximately 70 per cent of world production.
The export markets evaluated for broccoli and cauliflower included Singapore, Malaysia, the UAE and Japan. Collectively they showed unquestionable market dominance by Chinese exporters. It is clear that China has directly substituted Australian supplies. Chinese exports of these vegetables have grown value of market share from 15 per cent in 2003 to over 45 per cent in 2007. Chinese price is consistently 35 to 65 per cent cheaper than the Australian cost of supply in to the same markets. For some markets it is not possible to extract information at an individual product level. Cauliflower and broccoli are often aggregated making it difficult to ascertain the market trends. General data is often untimely and questionably accurate.
Exchange rates, Chinese cost of production, its government support and its proximity to Australia’s traditional markets have severely reduced Australian competitiveness. Labour and general input costs are significantly lower in China. The Australian cauliflower and broccoli industries need to consolidate by focusing on its strengths, particularly for the domestic and Singapore markets. Greater emphasis on cost competitiveness through agronomic and structural change is required. Continual monitoring of production and market competitiveness is required to steer these investments.
VG05028 Export Market Situation Analysis for the Australian Cauliflower and Broccoli Industry
6
3. Introduction, background and objectives The aims of the project were to identify the export market position for Australian fresh broccoli and cauliflower. The information produced by the project would provide an indication of markets which may be profitable destinations for the export produce. Markets that would be studied in detail include those in the Middle East (specifically the United Arab Emirates) and other traditional markets. Total production of Australian broccoli was estimated at 55,000 tonnes in 2003. This was an increase of approximately 38 per cent or 15,000 tonnes per annum from 5 years earlier. The main States for broccoli production were Queensland and Victoria. Together they accounted for over half of Australia’s production and nearly 40 per cent of exports. Total production of Australian cauliflower was estimated at 73,000 tonnes in 2003. This was an increase of approximately 12 per cent or 8,000 tonnes per annum from 5 years earlier. The main production States for cauliflower were Western Australia and Victoria with just over 50 per cent of production. Queensland was also a significant producer with 22 per cent of Australian production. Western Australia was clearly the most significant exporter with 84 per cent of exports. Australia exported approximately 5,000 tonnes of broccoli and 9,000 tonnes of cauliflower at the inception of the project. These markets were collectively valued at $23 million at that time. 5 years prior to the study their collective exports were 29,000 tonnes at a value of $40 million. Broccoli exports had declined almost 35 per cent or 4,000 tonnes per annum. Cauliflower had declined by a similar amount representing a 23 per cent decline over the 5 year period. Broccoli is exported to several countries, however almost three quarters of exports comprised the three main markets, being Japan (22 per cent), Singapore (39 per cent) and Malaysia (11 per cent). Cauliflower produced for export is reliant on limited markets in the South East Asian region, in particular, Singapore and Malaysia, with 94 per cent of exports being sent to these two countries. The decline in exports of both broccoli and cauliflower is obviously of concern to the brassica industry. A major cause of the decline, in addition to the high Australian dollar, is the increase in competition in Singapore and Malaysia from Chinese supplies. The quantity of Chinese product in these markets has risen substantially over the past three years, with continually improving quality and relatively low prices. The increased competition requires the brassica industry to look at other markets and mechanisms where Australian cauliflower and broccoli can be competitive. Primarily the objectives of the project were to provide an analysis of production and market performance for Australian broccoli and cauliflower industries. The project aimed to outline potential new markets and the competitive environment. It would also examine niche opportunities for fresh produce supplies into these and existing markets. As the project progressed the scope was reduced in light of the initial findings. It was decided, in

VG05028 Export Market Situation Analysis for the Australian Cauliflower and Broccoli Industry
7
consultation with the funding bodies (Horticulture Australia and the Department of Agriculture and Food, WA), that the project be halted prematurely and reported. It was considered that investment in detailed market studies would be withdrawn in light of the initial findings.
4. Materials and methods
4.1 Overview A brief situation analysis was conducted and identified significant decline in the export market performance for cauliflower and broccoli. Opportunities to reinvigorate existing markets, and define new markets, were identified as an industry priority. A specialist team was identified and consulted. The project aim was to identity the competitive position for Australian product, particularly in the Middle East. The desktop survey of select countries aimed to identify markets which may have profitable potential for fresh Australian broccoli and cauliflower. An outline of the competitor’s active in these markets, with particular reference to those who are actively displacing Australian exports. The main output from this project will be a document that will outline the market opportunity for broccoli and cauliflower in the Middle East and Asian export markets. This will contain an interpretation of statistical information on the price and volume from suppliers to the selected markets. After the release of the document, industry will be able to use the data to reposition planning in relation to export markets for fresh cauliflower and broccoli. The outcome for this project is expected to be a more informed approach to supply chain assessment to assist in a directional guide for Australian cauliflower and broccoli producers. The initial objective of the project was to address the export decline of cauliflower and broccoli exports for Australian producers. From this outline, provide direction to reinvigorate the industry with the identification of new direction to capture export opportunities. From the primary capture of desktop data, priority market for examination would be identified. This was to be done by gathering relevant information on existing and potential markets. The information gathered would then be used to determine the markets most likely to be able to accept Australian product at an acceptable price for the producer. Employment of consultants in these identified markets would then sieve out the potential supply chain and its relevant components. Areas of investigation include indicative prices, product specifications, specific barriers or opportunities for trade, packaging requirements and alternative product handling options. The findings of the study were aimed to produce a handbook as a guide to the identified opportunities. This was revised to provide a situation analysis of the Australian cauliflower and broccoli export industries.
VG05028 Export Market Situation Analysis for the Australian Cauliflower and Broccoli Industry
8
4.2 Methodology The trade data for cauliflower and broccoli and its potential competitors for the Middle East and traditional markets would be examined to outline market history and position. The countries which have the most potential would be selected for more detailed study. Countries in North and South East Asia will be examined to determine if these have reasonable potential, however the Middle East will be the main focus of the project. Information collected would include current import data, current market suppliers and their capacities and trends. The future capacity of countries to continue imports or act as re-exporters of Australian product would also be examined. In the markets selected for more detailed examination, factors which would be considered include gathering wholesale data in small increments, determining the product specifications and packaging requirements of the importing countries, indicative prices and identification of potential contacts in the countries examined. The importance of aspects of Australian product such as low chemical application and product traceability will also be assessed. The size and diversity of the market segments in these countries would also be examined as this can have an impact on the price received for the product. Market segments include the wholesale markets, supermarkets, food service sector and processing sectors. A critical part of the project is the investigation of the actual state of markets compared to the statistical data collected throughout the project. It is intended where possible, to employ or identify local consultants in the target countries who can ‘ground truth’ the information gained from the statistics. This is necessary as various countries report their statistics by different methods, which can make the direct comparison of the information difficult. The consultants would also be able to provide contact details for companies interested in obtaining Australian product. The information gathered will be compiled into a reference report. The report will be freely available. The report can be used by those who may wish to investigate further the export of broccoli and cauliflower to new and traditional markets. An offer will be made to interested exporters and other industry personnel who may wish to further discuss the statistical information in the report. This could be presented at a national vegetable industry conference.
5. Research and analysis
5.1 Australian industry evaluation Total production of Australian cauliflower and broccoli has collectively shown a marginal fall since the year 2000. Broccoli production peaked during this period but declined in the later part to close at 46,031 tonnes per annum. This was an increase of 6,847 tonnes or 17.5 per cent (Figure 1). Over the same period cauliflower declined from 76,437 to 69,792 tonnes per annum. This is a decline of 6,644 tones or 8.7 per cent. Average annual production for cauliflower and broccoli since 2000 was 76,726 and 48,509 per annum.

VG05028 Export Market Situation Analysis for the Australian Cauliflower and Broccoli Industry
9
Figure 1 : Australian total and domestic production of cauliflower and broccoli
-
10,000
20,000
30,000
40,000
50,000
60,000
70,000
80,000
90,000
100,000
2000 2001 2002 2003 2004 2005 2006 2007
Vo
lum
e -
ton
nes
Cauliflower Production Broccoli ProductionCauliflower domestic Broccoli domestic
Australian Bureau of Statistics
Figure 2 : Australian production of cauliflower by State 2000-2007
-
5,000
10,000
15,000
20,000
25,000
30,000
35,000
2000 2001 2002 2003 2004 2005 2006 2007
Pro
du
ctio
n -
to
nn
es
WA NSW Vic Qld Other
Australian Bureau of Statistics

VG05028 Export Market Situation Analysis for the Australian Cauliflower and Broccoli Industry
10
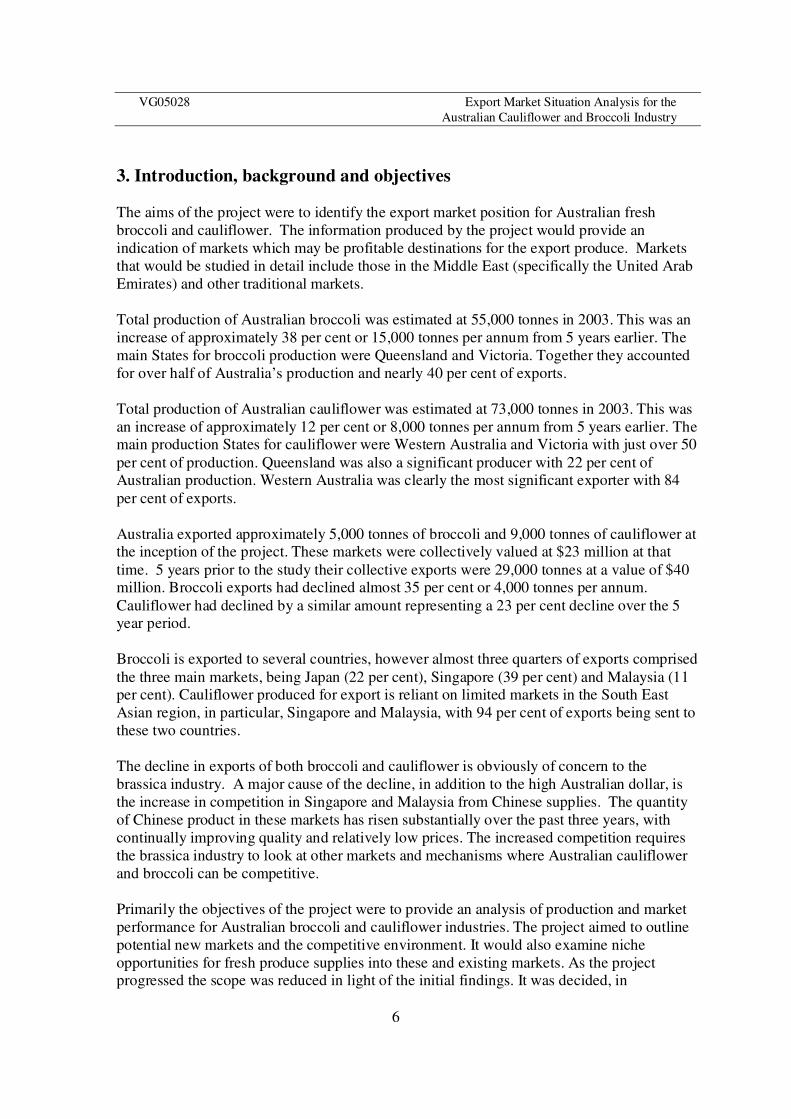
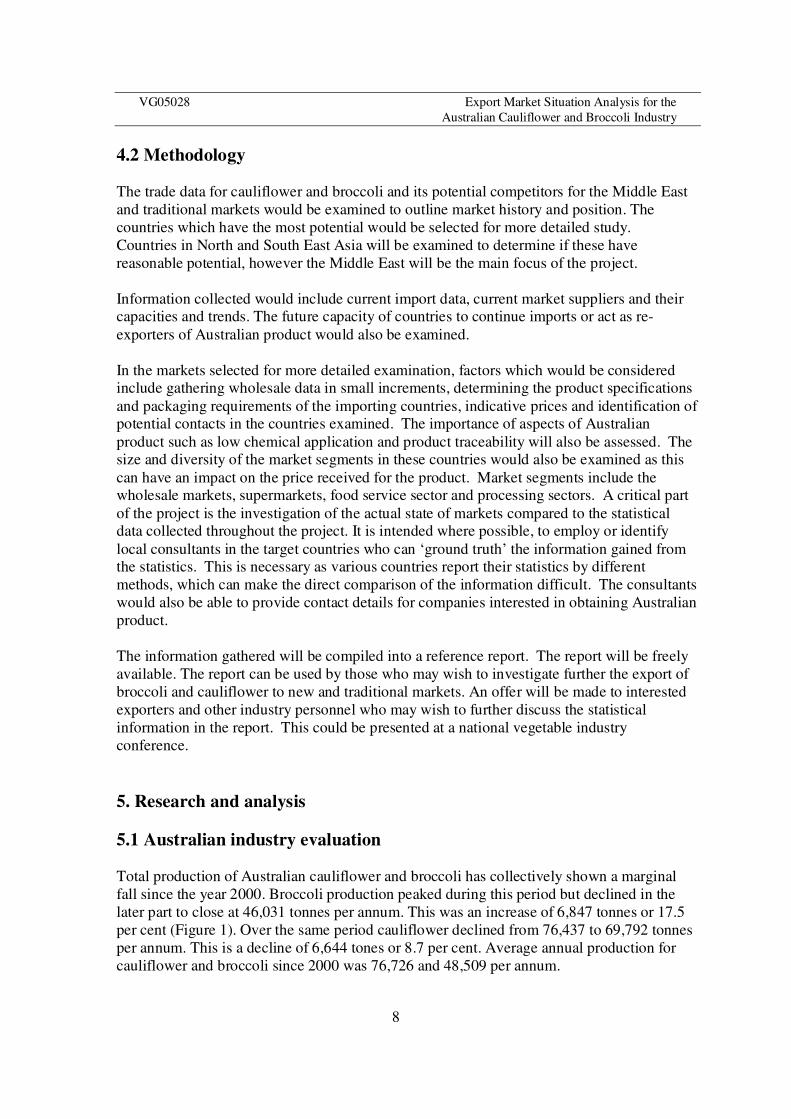
Apparent domestic supply of cauliflower increased 26.6 per cent, or 14,592 tonnes, at an average supply level of 64,925 tonnes per annum. Average domestic supply of cauliflower was 85 per cent of production. Broccoli domestic supply increased at nearly doubled that of cauliflower to realize an increased supply of 13,605 tonnes, or 44.6 per cent growth, since 2000. Annual supply averaged 41,879 tonnes per annum or 86 per cent of production for the period. The convergence of the production and domestic supply lines (Figure 1) highlight the fall in Australian fresh exports of cauliflower and broccoli. Cauliflower production in Australia has been led by Victoria which averaged approximately 21,000 tonnes or 27 per cent per annum since 2000. Recent market and environmental constraints have realized a decline in Victorian production with Queensland, and to a lesser extent Western Australia, responding to fill the void. New South Wales has a very domestically focused supply industry. It has remained relatively fairly static over this period. Western Australia has realized significant decline. It has fallen from 24 per cent of the national crop to only 12 per cent in 2007. This has been largely due to South East Asian market trade decline. Some recovery has been realized with increased interstate trade. Some of the increase could be partly attributed to product specifications for domestic versus export produce. That is the product now being traded domestically is recorded at greater weights due to the presentation of the product. Queensland has increased production of cauliflower by approximately 4,500 tonnes or 30 per cent to become the leading supplier of Australian cauliflower with 29 per cent of the national crop (Figure 3). The other smaller producing States have realized significant gains since 2000. This is from a modest average base of 13,393 tonnes per annum but is none the less significant. These have increased from 12.7 to 20.8 per cent of cauliflower production. South Australia and Tasmania share this segment in almost equal proportions. Australian production of broccoli is dominated by Victoria with more than half of Australian production. Victorian broccoli production has increased by around 10 per cent since 2000 equivalent to the national rate of growth. New South Wales has shown the greatest level of growth whilst all other States slowed after significant gains during the mid 2000’s. Domestic trade has dominated the growth in the broccoli industry and assisted in the alleviation of export declines. Domestic trade now accounts for about 44,000 tonnes per annum which is approximately 95 per cent of production. This up from the 77 per cent of production being for domestic use, back in 2000/01.
VG05028 Export Market Situation Analysis for the Australian Cauliflower and Broccoli Industry
11
Figure 3 : Cauliflower production share by State for 2007
Qld
29%
SA
11%
NSW
14%
Vic.
25%
Tas.
9%
WA
12%
Australian Bureau of Statistics
Figure 4 : Australian production of broccoli by State 2000-2007
-
5,000
10,000
15,000
20,000
25,000
30,000
2000 2001 2002 2003 2004 2005 2006 2007
Pro
du
ctio
n -
to
nn
es
WA NSW Vic Qld Other
Australian Bureau of Statistics

VG05028 Export Market Situation Analysis for the Australian Cauliflower and Broccoli Industry
12
Queensland accounted for 20 per cent of broccoli production in 2007. This State realized significant growth which saw it over double in the first 5 years, but retreated rapidly as export demand and domestic supplies slowed. At the same time Western Australia accounted for 8 per cent of production, but this varies significantly over time. Using 2000/01 production averages, Western Australia varied from a 10 per cent fall to a doubling of production during that 8 year period. Figure 5: Broccoli production share by State for 2007
Tas.
10%NSW
8%
Vic.
52%
Qld
20%
SA
2%
WA
8%
Australian Bureau of Statistics
The planted area of Australian cauliflower has averaged 3,700 hectares over the 2000 to 2008 period. The area planted, as a general trend, has declined over this period in the order of 10 to 15 per cent. During the same period apparent yield has increased by 20 to 25 per cent. Yields were around 18 tonnes per hectare and increased to just above 22 tonnes.

VG05028 Export Market Situation Analysis for the Australian Cauliflower and Broccoli Industry
13
Figure 6 : Cauliflower yields by Australian States
10.0
15.0
20.0
25.0
30.0
35.0
2000 2001 2002 2003 2004 2005 2006 2007
Yie
ld -
to
nn
es p
er h
ecta
re
WA NSW Vic QLD
Australian Bureau of Statistics
Victoria’s cauliflower’s poor yield performance in 2007 reduced the Australian average by over 1 tonne per hectare for the end of the period. Victoria had 38 per cent of area and only 24 per cent of production. New South Wales yields have generally been greater than those recorded for other States. This reflects the market presentation of domestic produce versus export. Domestic product per unit records a greater weight largely due to sales with leaves on, and the less stringent size and quality requirements relative to some export markets. This may also partly explain the sudden rise in Western Australian yield as the export supply ratio falls. It could also be argued that the more marginal producers of cauliflower have exited the market in the wake of increase cost/price pressure Australian planted area for broccoli has remained relatively stable since 2000. Apparent yield has increased over this period by 10 and 15 per cent on average. Yield for the whole period average 7.0 tonnes per hectare. This is an increase of 0.4 tonnes per hectare from the first half of the period 2000 to 2008 to the later. Inversely to cauliflower, Western Australia realizes a variable but superior yield performance than the other States. A typical yield range within each State varies by 2 to 2.5 tonnes between years. Western Australia’s short term average yield is 9.6 tonnes per hectare. Queensland and Victoria are relatively more stable and average in the vicinity of 7 tonnes per hectare. Given that these two States represent two thirds of supply they will dictate the national performance average. The New South Wales short term yield average is 4.4 tonnes per hectare. This is over half the performance of the leading State and substantially below the average. It is widely variable with a range of 1.5 to 7.2 tonnes per hectare as a State average yield.

VG05028 Export Market Situation Analysis for the Australian Cauliflower and Broccoli Industry
14
Figure 7 : Broccoli yield by Australian States
0.0
2.0
4.0
6.0
8.0
10.0
12.0
14.0
2000 2001 2002 2003 2004 2005 2006 2007
Yie
ld -
to
nnes
per
hec
tare
WA NSW Vic QLD
Australian Bureau of Statistics
5.2 Australian market performance Production of cauliflower and broccoli in Australia has remained relatively stable since the year 2000. Inversely the export markets for both products have declined severely. Australian export volumes of cauliflower and broccoli from 2000 to 2009 declined by almost 30,000 tonnes or 33.5 per cent per annum. This equates to a collective loss in annual export earnings of $34.2 million per year over that period. Exports as a percentage of production fell from approximately 28 per cent in 2002/03 to 2 per cent in 2007. FOB (Free on Board) price receipts remained relatively static until 2005 and then escalated rapidly. This is a result of the broader market presence being redefined to relatively more expensive and opportunistic market participant. The increased use of air freight to fill these niche markets has contributed to further increase the cost of supply.

VG05028 Export Market Situation Analysis for the Australian Cauliflower and Broccoli Industry
15
Figure 8 : Australian production, export volumes and values for cauliflower and broccoli
-
10,000
20,000
30,000
40,000
50,000
60,000
70,000
80,000
90,000
100,000
2000 2001 2002 2003 2004 2005 2006 2007
Volu
me
- to
nn
es
Cauli Prod Broc Prod Cauli Export Broc Export
Australian Bureau of Statistics
Figure 9 : Annual export volumes and price 2000 to 2008
-
5,000
10,000
15,000
20,000
25,000
30,000
2000 2001 2002 2003 2004 2005 2006 2007 2008
Vo
lum
e -
ton
nes
0.00
0.50
1.00
1.50
2.00
2.50
3.00
Ex
po
rt P
rice
- F
OB
($
A)
Cauli Export Broc Export Cauli Price Broc Price
Australian Bureau of Statistics
VG05028 Export Market Situation Analysis for the Australian Cauliflower and Broccoli Industry
16
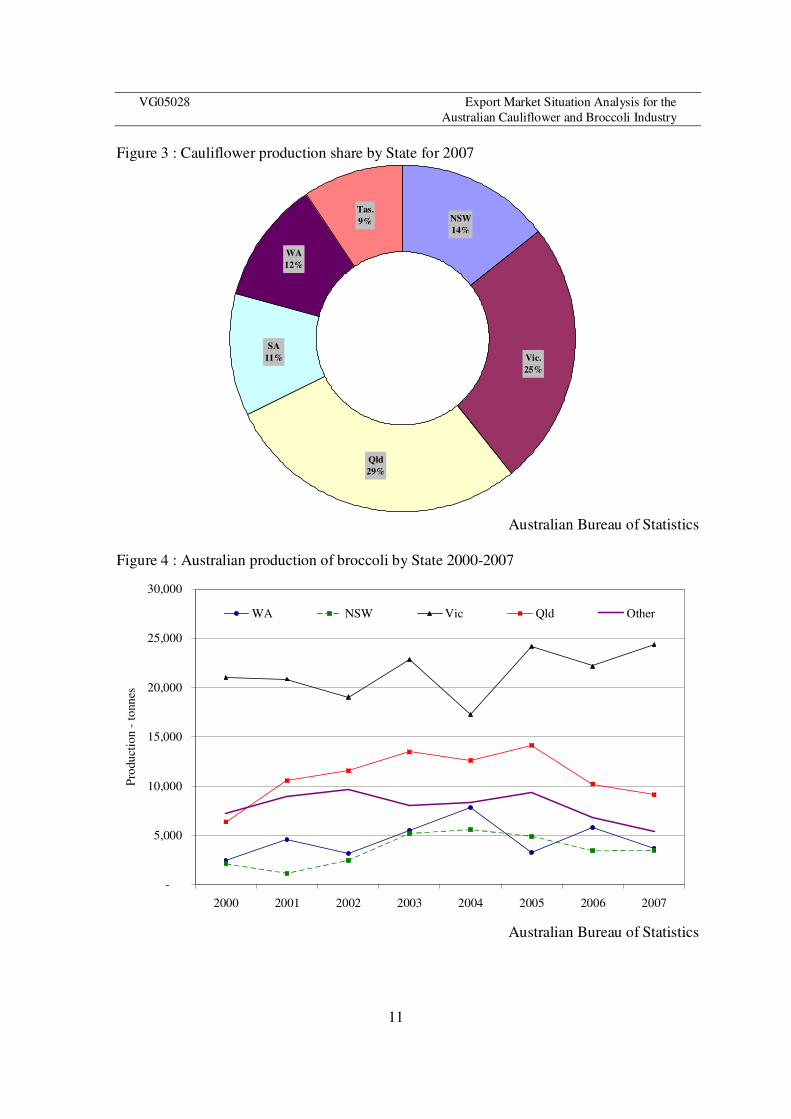
Price competitiveness, and not capacity, has largely eroded export market participation. The agents for this change are increased supply from competitors and currency exchange rates. China has increased its participation in export with a much cheaper production base. This coupled with significant increases in the Australian exchange rate has greatly reduced its price competitiveness. There is a recognizable correlation between export FOB prices and shifts in exchange rate (Figure 10). Figure 10 : Trade weighted index for Australian exchange rate and average export price for
cauliflower and broccoli
-
10
20
30
40
50
60
70
80
2000 2001 2002 2003 2004 2005 2006 2007 2008
Ex
chan
ge
Rat
e In
dex
0.00
0.50
1.00
1.50
2.00
2.50
3.00
Exp
ort
Pri
ce -
FO
B ($
A)
TWI Cauli Price Broc Price
Reserve Bank of Australia - Australian Bureau of Statistics
Cauliflower exports have declined by about 21,000 tonnes at a rate of 39.5 per cent per annum. Australian export volumes have fallen from 28.3 to 0.6 per cent of production. Total value of cauliflower export fell 37 per cent per annum from $26.1 million in 2000 to $0.7 million in 2008. This rapid decline is primarily due to Western Australia’s South East Asian market displacement. Western Australia dominated Australian cauliflower exports with over 80 per cent of exports. Western Australia still exports 40 per cent of Australian supplies, but from a very low base of 159 tonnes. This in stark contrast to the 24,595 tonnes exported in 2001. That is a 51 per cent annual decline in cauliflower exports. The majority of export declines are realized from loss of market share an all destinations, particularly Singapore and Malaysia. Queensland and Victoria have declined 21 per cent per annum from a much lower base. Collectively these States have declined from an approximate annual average export of 2,000 to 200 tonnes. For these States export reliance has fallen from approximately four to one per cent of production.

VG05028 Export Market Situation Analysis for the Australian Cauliflower and Broccoli Industry
17
Figure 11 : Annual cauliflower export volumes by State
0
5,000
10,000
15,000
20,000
25,000
2000 2001 2002 2003 2004 2005 2006 2007 2008
Ex
po
rt v
olu
me
- to
nnes
WA NSW Vic QLD
Australian Bureau of Statistics
Figure 12 : Average FOB export price for Australian cauliflower
0.30
0.80
1.30
1.80
2.30
2.80
2000 2001 2002 2003 2004 2005 2006 2007 2008
Av
erag
e E
xpo
rt P
rice
- F
OB
($A
)
WA NSW Vic
QLD Other
Australian Bureau of Statistics

VG05028 Export Market Situation Analysis for the Australian Cauliflower and Broccoli Industry
18
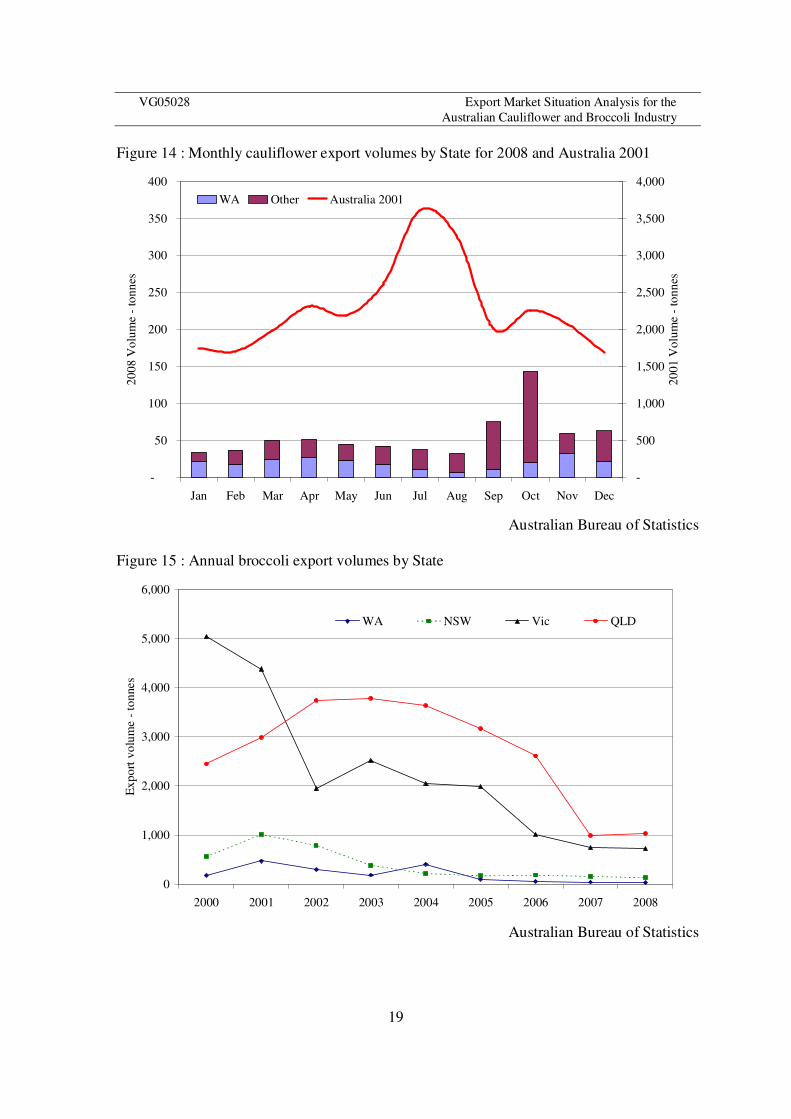
Annual average FOB price for Australian cauliflower has increased steadily since 2000. The major producing States of Western Australia and Queensland have realized steady increases in FOB price over time. For other minor export participants the FOB prices fluctuate considerably. This reflects both the volatile nature of opportunistic marketing and the reliability of data and error on small collections. Monthly export trade volumes of cauliflower from Australia typically peaked during the winter months June to August. Cauliflower produce specifications are generally larger at this time. This realizes less cost per unit of production and marginally less costs in irrigation supply. For all of 2001 (Figure 13) Western Australian exports were consistently ranged between 1,500 to 2,500 tonnes per month. This was the peak calendar year for export volume of Australian cauliflower. Other exporting States participated during the late winter early spring time. Supply would tend to peak at this time. With declining exports, the shape of monthly exports has averaged 30 tonnes in 2008 with a peak period in early spring (Figure 14). This is dominated by Queensland supplies with 45 per cent of annual supply. Singapore and Malaysia are still the primary export markets with 50 per cent of export value. Brunei and Indonesia collectively bring export representation to 70 per cent. In 2001 94 per cent of export went to Singapore and Malaysia. Over two thirds of that trade was with Malaysia. Figure 13 : Monthly cauliflower export volume for 2001
-
500
1,000
1,500
2,000
2,500
3,000
Jan Feb Mar Apr May Jun Jul Aug Sep Oct Nov Dec
Volu
me
- to
nn
es
WAOther States
Australian Bureau of Statistics
VG05028 Export Market Situation Analysis for the Australian Cauliflower and Broccoli Industry
19
Figure 14 : Monthly cauliflower export volumes by State for 2008 and Australia 2001
-
50
100
150
200
250
300
350
400
Jan Feb Mar Apr May Jun Jul Aug Sep Oct Nov Dec
20
08 V
olu
me
- to
nn
es
-
500
1,000
1,500
2,000
2,500
3,000
3,500
4,000
20
01 V
olu
me
- to
nn
es
WA Other Australia 2001
Australian Bureau of Statistics
Figure 15 : Annual broccoli export volumes by State
0
1,000
2,000
3,000
4,000
5,000
6,000
2000 2001 2002 2003 2004 2005 2006 2007 2008
Ex
po
rt v
olu
me
- to
nnes
WA NSW Vic QLD
Australian Bureau of Statistics
VG05028 Export Market Situation Analysis for the Australian Cauliflower and Broccoli Industry
20
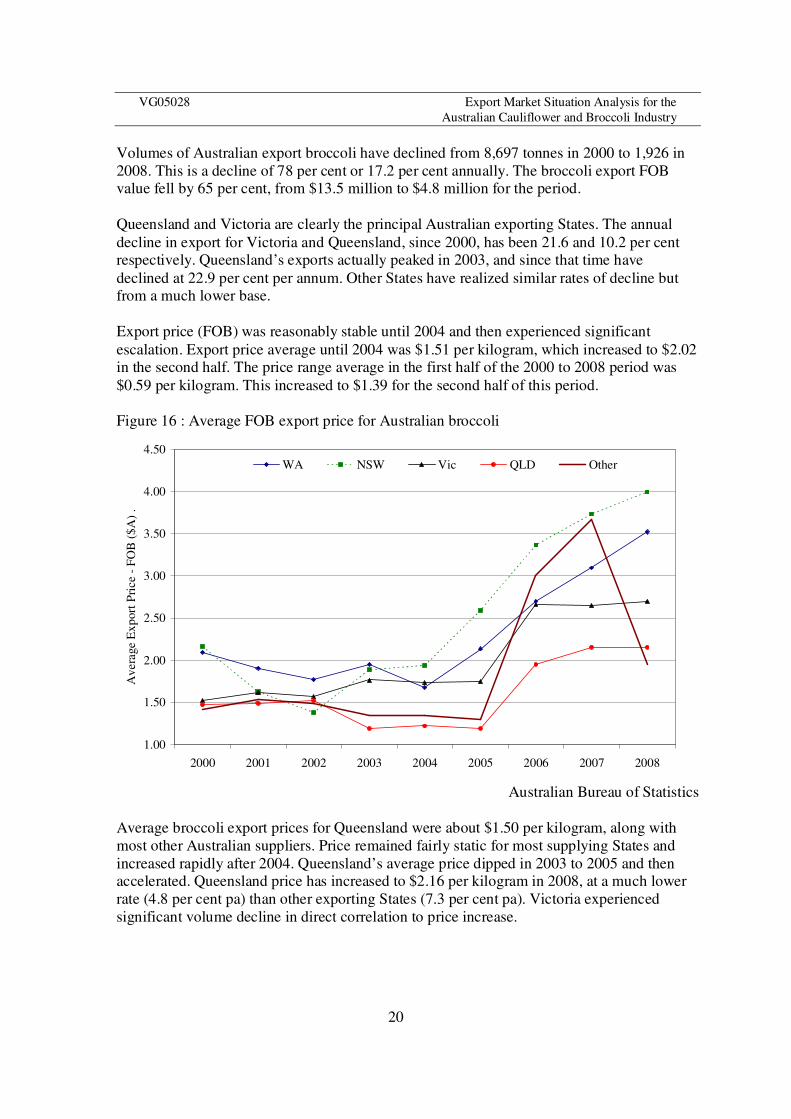
Volumes of Australian export broccoli have declined from 8,697 tonnes in 2000 to 1,926 in 2008. This is a decline of 78 per cent or 17.2 per cent annually. The broccoli export FOB value fell by 65 per cent, from $13.5 million to $4.8 million for the period. Queensland and Victoria are clearly the principal Australian exporting States. The annual decline in export for Victoria and Queensland, since 2000, has been 21.6 and 10.2 per cent respectively. Queensland’s exports actually peaked in 2003, and since that time have declined at 22.9 per cent per annum. Other States have realized similar rates of decline but from a much lower base. Export price (FOB) was reasonably stable until 2004 and then experienced significant escalation. Export price average until 2004 was $1.51 per kilogram, which increased to $2.02 in the second half. The price range average in the first half of the 2000 to 2008 period was $0.59 per kilogram. This increased to $1.39 for the second half of this period. Figure 16 : Average FOB export price for Australian broccoli
1.00
1.50
2.00
2.50
3.00
3.50
4.00
4.50
2000 2001 2002 2003 2004 2005 2006 2007 2008
Av
erag
e E
xp
ort
Pri
ce -
FO
B (
$A
) .
WA NSW Vic QLD Other
Australian Bureau of Statistics
Average broccoli export prices for Queensland were about $1.50 per kilogram, along with most other Australian suppliers. Price remained fairly static for most supplying States and increased rapidly after 2004. Queensland’s average price dipped in 2003 to 2005 and then accelerated. Queensland price has increased to $2.16 per kilogram in 2008, at a much lower rate (4.8 per cent pa) than other exporting States (7.3 per cent pa). Victoria experienced significant volume decline in direct correlation to price increase.

VG05028 Export Market Situation Analysis for the Australian Cauliflower and Broccoli Industry
21
Figure 17 : Monthly broccoli export volume for 2001
-
100
200
300
400
500
600
700
800
900
1,000
Jan Feb Mar Apr May Jun Jul Aug Sep Oct Nov Dec
Volu
me
- to
nn
es
QLD VIC Other
Australia Bureau of Statistics
Figure 18 : Monthly broccoli export volumes by State for 2008 and Australia 2001
-
200
400
600
800
1,000
1,200
1,400
Jan Feb Mar Apr May Jun Jul Aug Sep Oct Nov Dec
Volu
me
- to
nn
es
QLD VIC Other Australia 2001
Australian Bureau of Statistics

VG05028 Export Market Situation Analysis for the Australian Cauliflower and Broccoli Industry
22
Annual exports of Australian broccoli peaked in 2001. At this time a clear supply pattern was evident. Australia realized low trade levels during the summer months. Queensland predominantly exported in the winter early spring periods and was flanked by Victorian supplies (Figure 17). Total Australian supply peaked during the winter months. Average monthly supplies were approximately 1,200 tonnes from April to October and 350 tonnes per month for the balance of the year. A similar pattern remained in 2008 but from a much lower base. During 2008 the monthly average volume for April to October was 220 tonnes whilst the balance was 76 tonnes per month. Australian population has increased from 19.3 million people in 2000 to 21.2 million in 2007. This is an average growth rate of 1.36 per cent per annum. For the same period apparent cauliflower consumption grew at a greater rate of 2.05 per cent per annum. This was up from 2.82 kilograms per capita in 2000 to 3.28 kilograms in 2007. Broccoli for the same time period was up 4.00 per cent per annum. In 2000 the apparent consumption was 1.58 kilograms per capita. This increased to 2.08 kilograms per capita in 2007. It is not possible to capture the domestic trade data accurately. The numerous, undocumented in-state trade avenues and interstate trade data make analyses of State based consumption difficult. Average annual Consumer Price Index (CPI) has averaged 3.0 per cent since 2001. The apparent vegetable price index has been approximately 4.1 per cent per annum. Applying these to wholesale market data suggests that broccoli has tracked with CPI but slightly behind the vegetable price index. Cauliflower wholesale price, in Western Australia for example, is approximately 16.6 per cent behind the CPI from 2001 to 2008. Figure 19 : Australian population and apparent consumption of cauliflower and broccoli
2000-2007
-
5,000
10,000
15,000
20,000
25,000
2000 2001 2002 2003 2004 2005 2006 2007
Au
stra
lian
po
pu
lati
on
- 0
00's
0.0
0.5
1.0
1.5
2.0
2.5
3.0
3.5
4.0
Ap
par
ent
con
sum
pti
on
- k
g/h
d .
Population Cauliflower Broccoli
Australian Bureau of Statistics

VG05028 Export Market Situation Analysis for the Australian Cauliflower and Broccoli Industry
23
5.3 World market profile World production of cauliflower and broccoli was estimated to be 1.9 million metric tonnes in 2007. International trade is estimated at $800 million per annum. Since 1980 world production has increased at 2.1 per cent. From the year 2000 it has accelerated to 3.9 per cent per annum. China and India are the leading producers of cauliflower and broccoli with approximately 70 per cent of world production and approximately 40 per cent of population. On a per capita basis China produces approximately 5.6 kilograms. Australia by comparison produces 6.5 kilograms per head per capita Since 1980 Chinese and Indian production has been increasing at 6.4 and 0.6 per cent per annum respectively. Since 2000 India has increased at 1.6 per cent whilst China has recorded an annual production increase of 6.9 per cent. Since 1992, China’s growth is unparalleled by any other producing nation or the world as a collective (Figure 20). Figure 20 : World production of cauliflower and broccoli
-
1,000,000
2,000,000
3,000,000
4,000,000
5,000,000
6,000,000
7,000,000
8,000,000
9,000,000
10,000,000
1980
1982
1984
1986
1988
1990
1992
1994
1996
1998
2000
2002
2004
2006
Pro
du
cti
on
- t
on
nes
China India World Balance
FAO
Chinese production has increased 51 per cent since 2000. Unsurprisingly this resulted in an increase in Chinese exports from this time. Chinese exports represented approximately 2 to 3 per cent of its production. From 1990 to 2000 countries such as Australia and the United States of America increased their exports as a percentage of domestic production. From 2000 these fell in direct correlation to increases in Chinese exports (Figure 21). India’s participation in export is extremely low.

VG05028 Export Market Situation Analysis for the Australian Cauliflower and Broccoli Industry
24
Figure 21 : Selected countries export : production ratio for cauliflower and broccoli
0%
5%
10%
15%
20%
25%
30%
35%
40%
1990 1991 1992 1993 1994 1995 1996 1997 1998 1999 2000 2001 2002 2003 2004 2005 2006
Pro
du
cti
on
Ex
porte
d -
per
cen
tage
Australia China India United States of America
FAO
The apparent world consumption is approximately 2.9 kilograms per capita. The apparent consumption in China has increased rapidly since 1990 (Figure 22). This is up from 1.6 to 6.0 kilograms per head from 1990 to 2007. China’s domestic consumption has increased 138 per cent since the year 2000. Over the same period population has increased by 3.7 per cent. Australian and United States consumption by comparison is 5.3 and 3.9 kilograms per head. Gross Domestic Product (GDP) per capita measures can be litmus to the demand shifts for various products. As per capita GDP increases consumption patterns change. In less developed countries the fundamental food products, such as cauliflower and broccoli, increase. GDP and consumption trends for China and India reasonably demonstrate this (Figure 23). When income or GDP increases, it will reach a level where substitution of basic products will take place. Generally more developed and growing economies will show a plateau or decline in basic produce demand. Price drivers will also alter consumption patterns. To a lesser extent product perception, such as product image or health benefits, can influence consumption. Australia and the United Kingdom have shown increases in GDP over the past two decades (Figure 24). Over this period consumption declined and then rose toward the end of this period. This could be due to the relative price competitiveness of these products since the year 2000. It also coincides with a lot of positive, health related publicity for both products.

VG05028 Export Market Situation Analysis for the Australian Cauliflower and Broccoli Industry
25
Figure 22 : Apparent consumption trend for cauliflower and broccoli for selected countries and the world average (1990 – 2006)
1.0
2.0
3.0
4.0
5.0
6.0
7.0
1990 1991 1992 1993 1994 1995 1996 1997 1998 1999 2000 2001 2002 2003 2004 2005 2006
App
aren
t C
on
sum
pti
on -
kg
/cap
ita/
ann
um
Australia China United Kingdom World
FAO
Figure 23 : Apparent consumption and GDP for India and China
1.0
2.0
3.0
4.0
5.0
6.0
7.0
8.0
1990 1992 1994 1996 1998 2000 2002 2004 2006
App
aren
t C
on
sum
pti
on -
kg
/cap
ita/
ann
um
-
500
1,000
1,500
2,000
2,500
GD
P -
$U
S
per
cap
ita
China India China GDP India GDP
China GDP trendline
China consumption trenline
India GDP trendline
India consumption trendline
FAO

VG05028 Export Market Situation Analysis for the Australian Cauliflower and Broccoli Industry
26
Figure 24 : Apparent consumption and GDP for Australia and the United Kingdom
1.0
2.0
3.0
4.0
5.0
6.0
7.0
8.0
1990 1992 1994 1996 1998 2000 2002 2004 2006
Ap
par
ent
Co
nsu
mp
tio
n -
kg
/cap
ita/
ann
um
-
5,000
10,000
15,000
20,000
25,000
30,000
35,000
40,000
45,000
GD
P -
per
cap
ita
Aust UK UK GDP Aust GDP
UK GDP trendline
Aust GDP Trendline
UK consumption trendline
Aust consumption trendline
FAO - USDA
Figure 25 : Annual Australian exchange rate history for selected countries
0.00
1.00
2.00
3.00
4.00
5.00
6.00
7.00
2000 2001 2002 2003 2004 2005 2006 2007 2008 Jan-09
Au
stra
lian
Doll
ar B
uy
ing
40.00
45.00
50.00
55.00
60.00
65.00
70.00
75.00
Tra
de
Wei
ghte
d I
nd
ex
US Malay ChinaSingapore TWI
Reserve Bank of Australia

VG05028 Export Market Situation Analysis for the Australian Cauliflower and Broccoli Industry
27
Many traditional markets and competitor currencies are closely linked to the United States of America (US) dollar. Exchange rates are a critical component of international trade competitiveness. The Australian dollar has fluctuated widely in recent times from around $0.50 to $0.95 US. As the Australian dollar increases against the target market currency produce price will be relatively higher for the importer. This is particularly so where the importing country and competitor suppliers are on a similar currency base. This is fundamentally the case with China and Malaysia. Conversely the cost of freight and some inputs for production should theoretically be improved.
5.4 Export market brief Australia’s primary fresh vegetable export markets include Singapore, Malaysia, Hong Kong, Japan and in more recent times the Middle East. The South East Asian destinations have been attractive due to their need to import many food products outside their producing capacity. As these economies have grown, so have their capacity to pay. The demand for quality and timeliness of produce has increased over time. This is not to under estimate the strong focus on produce price. Australia’s proximity to these markets and attention to quality parameters have realized a market opportunity. During the 1980’s, Australia began to increase exports as Taiwan lost capacity and became less price competitive. Australian presence in these markets peaked around 2001. At this time China responded to fiscal and policy signals to increase vegetable exports.
Singapore Singapore was historically the South East Asian trading hub for a significant amount of fresh produce. Re exports have declined as trade logistics have matured. Singapore has been a primary market for Australian cauliflower and broccoli. Up until the mid 1980’s Australia held 60 per cent of the market, Taiwan held the balance. During the mid to late 1990’s Australia held over 90 per cent of the cauliflower market. Singapore has a population of approximately 4.4 million people with a per capita GDP of nearly $US 35,000. Vegetable trade in 2008 was $390 million of which $19 million was cauliflower and broccoli. Cauliflower and broccoli accounted for $7 and $12 million respectively in 2008. Approximately $1million was re exported, primarily to Malaysia. This is a mature market for these products. Consumption and thus market growth has slowed significantly over the past decade. Consumption in of cauliflower in 1995 was approximately 1.6 kilograms per head. A decade later it was the virtually the same. Broccoli consumption has grown to 1.67 kilograms per capita in 2008.

VG05028 Export Market Situation Analysis for the Australian Cauliflower and Broccoli Industry
28
Figure 26 : Singapore imports of cauliflower from Australia and China
0.60
0.80
1.00
1.20
1.40
1.60
1.80
2.00
2003 2004 2005 2006 2007 2008
CIF
Pri
ce -
$A
/ k
g
-
1,000
2,000
3,000
4,000
5,000
6,000
7,000
Vo
lum
e -
ton
nes
China Vol Australia Vol China Australia
GTIS
Figure 27 : Singapore imports of broccoli from Australia and China
0.60
1.10
1.60
2.10
2.60
3.10
2003 2004 2005 2006 2007 2008
CIF
Pri
ce -
$A
/ k
g
-
1,000
2,000
3,000
4,000
5,000
6,000
7,000
8,000
Vo
lum
e -
ton
nes
China Vol Australia Vol China Australia
GTIS
VG05028 Export Market Situation Analysis for the Australian Cauliflower and Broccoli Industry
29
In 2008 over 95 per cent of Singapore’s cauliflower imports were supplied by China. Australia has decreased from 75 per cent of supply in 2003, to 2 per cent in 2008. Malaysia now exports double the volume of cauliflower to Singapore than Australia; this is primarily Chinese re exports. Broccoli imports for Singapore have increased steadily over the past decade. Market growth was 3.6 per cent per annum over the past decade. During this time, Australia has lost significant market share. Australian share is down to 15 per cent of volume, an annual decline of 13 per cent. This is a direct correlation with the Chinese increase in the market. China now supplies 82 per cent of Singapore’s broccoli. Singapore is a developed economy with high quality demands and is a health and safety conscious consumer. The market has a strong Chinese heritage and linkage. Quarantine restrictions are very low. These factors provide Chinese importers with a good opportunity, in conjunction with their competitive pricing. Some health, safety and consistency of supply have provided some limited opportunity in trade for Australian exporters. Singapore has a relative geographic advantage as an export destination, particularly for Western Australia. Produce is primarily a sea freighted from Australia for cost management reasons, generally with out major compromise in quality. Chinese competitors are geographically better positioned but the freight cost is only marginally less. Timeliness and frequency of shipping is improved. Strong links have been developed over time in many fresh food items. This provides some level of access with these existing linkages.
Malaysia The population of Malaysia exceeds 26 million people. GDP per capita is estimated at $US7,000 or approximately 20 per cent of that for Singaporeans. With a lower GDP or country wealth it is a more price sensitive market. Surveys show that price is the most important factor with a majority of Malaysian consumers. While Malaysia has a large population, the niche or wealthier segment is quite small. It is therefore difficult to target and these products do not carry a prestige image. Health and safety information regarding food is not readily promoted. Like Singapore, there is a strong Chinese link and influence in Malaysia. Quarantine requirements are relatively relaxed for Malaysia’s fresh produce imports. These are two elements that assist Chinese trade in Malaysia. Both the Malaysian and Chinese economies are closely linked to the US currency. Most cross currency confusion, risks and impacts are relatively diffused by this commonality. The Malaysian imports of vegetables in 2007 totaled more than $550 million and just over one million tonnes. Over 33,000 tonnes (3 per cent) of vegetable imports were cauliflower and broccoli. This market has grown at 7.4 per cent per annum since 2003. Taiwan used to be the most significant supplier of cauliflower and broccoli up until the early 1980’s, similar to the history with Singapore. Taiwan held the balance of trade for

VG05028 Export Market Situation Analysis for the Australian Cauliflower and Broccoli Industry
30
cauliflower for longer than it did in Singapore. The price point of Taiwanese cauliflower was more competitive but lost market share due to capacity. In recent times China has expanded its market share for cauliflower and broccoli from 53 per cent in 2003 up to 95 per cent in 2008. Australia has conversely declined from 43 per cent to down 2 per cent in 2008. Malaysia represents 62 per cent of the value of Chinese cauliflower exports at an FOB value of $16.2 million in 2008. Broccoli represented $8.7 million or 23 per cent of the value of Chinese exports. From 2003 through to 2008 the CIF price for Chinese cauliflower and broccoli increased in response to other suppliers. Both Malaysia and China have currencies exchanges largely dictated by the US exchange rate. The change in price would therefore be due to an opportunistic response, a reflection of supply shift or an increase in costs such as freight. Australian prices have increased in parallel with its strengthening dollar. The fall in other supplier prices in response to the withdrawal of European and US suppliers. These supplies have been substituted by imports from South Africa and smaller Asian suppliers. South Africa has predominantly supplied during the second quarter of the previous 5 years. Other suppliers have remained at a low base of approximately 1,000 tonnes per annum. Figure 28 : Malaysian import volumes and price for cauliflower and broccoli
-
5,000,000
10,000,000
15,000,000
20,000,000
25,000,000
30,000,000
35,000,000
2002 2003 2004 2005 2006 2007
Impo
rt V
olu
me
- to
nnes
0.00
0.50
1.00
1.50
2.00
2.50
3.00
Imp
ort
pri
ce -
$au
per
kil
og
ram
China Australia Other
China price Aust price Other price
GTIS
Japan Japan’s population is approximately 130 million people with a GDP per capita of an estimated $US 34,000. Vegetable consumption per capita in Japan is remarkably high but a wide range of vegetable products are consumed. Based on wholesale data consumption of

VG05028 Export Market Situation Analysis for the Australian Cauliflower and Broccoli Industry
31
cauliflower and broccoli is approximately 0.24 and 0.76 kilograms per person per year. This does not represent all trade but is indicative of its lower per capita consumption. Japanese imports of cauliflower and broccoli have been declining over recent years. Only a very small amount of cauliflower is imported. This has fallen from 108 tonnes in 2005 down to 18 tonnes in 2007. Supply specifications for cauliflower are typically for a much smaller product than that of other Asian markets. This contributes to a higher cost product given the yield dilution to achieve these specifications. Broccoli imports have declined from 66,000 tonnes in 2003 to 32,400 tonnes in 2008. That is a decline of 13.3 per cent per annum. The United States of American is the primary supplier with 98 per cent of imports in 2008 up from 89 per cent in 2003. China has had a significant presence during the recent past, but has reduced rapidly in 2007/08 (Figure 29). Chinese price has remained fairly stable whilst US price has declined from an average of $2.36 to $2.04 per kilogram. The Australia average price has increased significantly based on very small volumes. Figure 29 : Japanese import volume and price for broccoli
-
10,000
20,000
30,000
40,000
50,000
60,000
70,000
2003 2004 2005 2006 2007 2008
Volu
me
- to
nn
es
0.00
0.50
1.00
1.50
2.00
2.50
3.00
3.50
4.00
4.50
5.00
Pri
ce -
$au
/kg
China AustraliaOther Log. (Australia price)Log. (Other price) Log. (China price)
GTIS
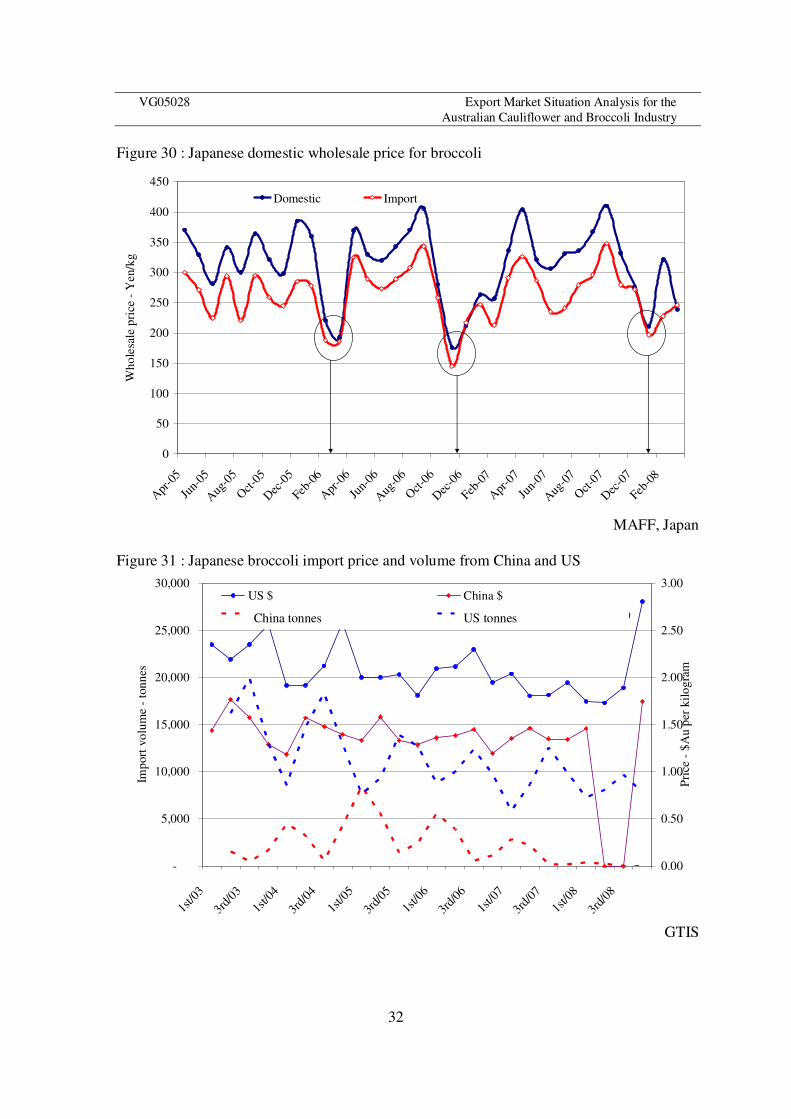
Broccoli price is variable through out the year with notable troughs in the early part of each year (Figure 30). The margin between the import and domestic price suggests a premium due cost of supply or consumer preference. United States imports also mirror this with volume falls during the first quarter of each year (Figure 31). China used to increases its market presence at this time. Price margin between China and the US has averaged 65 cents per kilogram, yet Chinese volumes have declined at a greater rate. This suggests that price is not the primary driver in this market.
VG05028 Export Market Situation Analysis for the Australian Cauliflower and Broccoli Industry
32
Figure 30 : Japanese domestic wholesale price for broccoli
0
50
100
150
200
250
300
350
400
450
Apr
-05
Jun-
05
Aug
-05
Oct
-05
Dec
-05
Feb-0
6
Apr
-06
Jun-
06
Aug
-06
Oct
-06
Dec
-06
Feb-0
7
Apr
-07
Jun-
07
Aug
-07
Oct
-07
Dec
-07
Feb-0
8
Wh
ole
sale
pri
ce -
Yen
/kg
Domestic Import
MAFF, Japan
Figure 31 : Japanese broccoli import price and volume from China and US
-
5,000
10,000
15,000
20,000
25,000
30,000
1st/0
3
3rd/
03
1st/0
4
3rd/
04
1st/0
5
3rd/
05
1st/0
6
3rd/
06
1st/0
7
3rd/
07
1st/0
8
3rd/
08
Imp
ort
vo
lum
e -
ton
nes
0.00
0.50
1.00
1.50
2.00
2.50
3.00
Pri
ce -
$A
u p
er k
ilo
gra
m
US $ China $
2 per. Mov. Avg. ( China) 2 per. Mov. Avg. ( United States)
GTIS
US tonnes China tonnes

VG05028 Export Market Situation Analysis for the Australian Cauliflower and Broccoli Industry
33
United Arab Emirates The UAE comprises seven emirates including Dubai. The UAE has approximately 4.3 million people, Dubai 1.4 million. GDP per capita for the UAE was about $US 42,000. Dubai was chosen as the litmus indicator of this market. It has a higher income profile and expatriate population. It has a high immigrant labour force, most notably Indian. There is also an additional demand from a growing tourism population. The local production of vegetables is very limited and is therefore reliant on imports. Dubai is very often the distribution hub for other Gulf countries. The US, China, Chile, South Africa and Europe are all very active in this market. It is therefore still a very competitive market environment, but it is expanding and evolving. Figure 32 : Australian monthly exports of broccoli to the UAE
0
10
20
30
40
50
60
70
80
90
100
2000 Jan2001 Jan
2002 Jan2003 Jan
2004 Jan2005 Jan
2006 Jan2007 Jan
2008 Jan
Vo
lum
e -
To
nn
es
0.00
1.00
2.00
3.00
4.00
5.00
6.00
Pri
ce -
$A
u p
er k
ilo
gra
m
Volume PricePoly. (Price) Poly. (Volume)
Australian Bureau of Statistics
Australian exports of broccoli have grown approximately 12.5 per cent per year since 2003, but are based on the low volume of 2003 of 237 tonnes. The total value of cauliflower and broccoli from Australia was $Au 1.2 million in 2008. Cauliflower represented small quantities of this trade in the recent past and was nil for 2007 and 2008. The UAE imported $Au620 million or just over one million tonnes of fresh vegetables in 2007. Just over 15 per cent of this was then re exported to near neighbour countries such as Iraq, Iran, Kuwait, Oman, Qatar and Saudi Arabia. In 2007 the UAE exported 1,100 tonnes of its own vegetables, mainly to Oman and Qatar.

VG05028 Export Market Situation Analysis for the Australian Cauliflower and Broccoli Industry
34
Dubai has little production capacity, but the 2005 census shows that cauliflower production was in excess of 9,000 tonnes and $Au 5.6 million. Total vegetable production area was over 13,000 hectares and $Au 235 million. Figure 33 : Import volume and price for cauliflower and broccoli for the UAE (2005)
-
1,000
2,000
3,000
4,000
5,000
6,000
7,000
8,000
9,000
10,000
Jordan Saudi Arabia Syria Lebanon Iran Other
Vo
lum
e -
ton
nes
0.00
0.50
1.00
1.50
2.00
2.50
3.00
3.50
4.00
Pri
ce -
$A
u p
er k
ilog
ram
Broccoli Volume Cauliflower Volume
Broccoli Price Cauliflower Price
Ministry of Economy, UAE
Cauliflower and broccoli imports for the UAE are approximately 15,000 tonnes per annum. This is approximately 3,000 tonnes of broccoli and 12,000 tonnes of cauliflower. Very minor amounts of these products are re exported. Supplies of broccoli and cauliflower come predominantly from other Middle Eastern sources. Jordan is the major primary produce supplier. In 2006 Jordan exported 24,000 tonnes of brassica, of which 45 per cent was sent to the UAE. This was a total FOB value of $Au4.5 million or $Au0.20 per kilogram. Given its relative geographic position, it is a low cost provider to this market. Average retail price of cauliflower in 2007 for the UAE was $Au1.65 per kilogram. Australian price has continued to escalate but has been able to maintain and even expand its market share. This is generally an extremely opportunistic and niche supply. The air freight percentage of Australian broccoli exports has increased each year. In 2006/07 100 per cent of broccoli was air freighted from Australia. By comparison China freight was all by sea.

VG05028 Export Market Situation Analysis for the Australian Cauliflower and Broccoli Industry
35
Figure 34 : Broccoli import volume and price for Dubai Direct
-
100
200
300
400
500
600
700
800
900
1,000
2001 2002 2003 2004 2005 2006 2007
Vo
lum
e -
ton
nes
0.00
0.50
1.00
1.50
2.00
2.50
3.00
3.50
4.00
4.50
5.00
Pri
ce -
$A
per
kil
og
ram
China Australia Other
Other price Aust Price China Price
Dubai Direct
5.5 Competitive position statement
Volatile exchange rates, along with the increased cost of labour and other farm inputs, have had a significant impact on the Australian industry’s export competitiveness. Competitor suppliers have increased productive capacity and investment impetus. Collectively this scenario has aggressively eroded Australia’s market share for cauliflower and broccoli in its traditional export markets.
The Australia horticulture industry has tended to cope with cost price squeeze scenarios by increasing productivity or improving efficiency. These adjustments require an investment of time and finance. The scope and scale of recent changes have been greater than these incremental gains over recent years.
Australia’s primary competition in the cauliflower and broccoli export markets is China. China is the world’s largest producer of vegetables. China is a giant in the world vegetable industry. It produced approximately 8.5 million tonnes of cauliflower and broccoli in 2007. Production is geographically diverse, which spreads supply timing and risk. China is amongst the worlds lowest cost producers of vegetables. Low input costs, favorable exchange rates and government support policies provide a constructive platform for expansion through price competitiveness.

VG05028 Export Market Situation Analysis for the Australian Cauliflower and Broccoli Industry
36
Exchange rates and China’s comparative costs of production have severely impacted Australia’s price competitiveness. In order to better understand Australia’s cost competitiveness an analysis of costs chain elements were extracted and compared to competitor CIF price receipts. Australia’s indicative farm gate cost of production ranged from 31 to 44 cents per kg for cauliflower and 55 to 106 cents for broccoli. Post harvest costs for cauliflower ranged from 40 to 51 cents per kg and 65 to 71 cents for broccoli. Freight varied between source and destination. The data used was publicly available and is very generic. It does not account for seasonal performance or other agronomic and structural cost variations. Using Singapore as an example, CIF cost price for cauliflower exceeded the average Chinese CIF price receipts by 21 to 28 per cent. For broccoli it was 61 to 79 per cent. These percentages are the premiums price over Chinese produce that are required to breakeven. This dictates a premium of approximately 65 and 110 per cent of cost to provide financial incentive for industry participants.
Figure 35 : Cost of production outline for Australian broccoli and cauliflower
Western Australia New South Wales Queensland
Cauliflower Broccoli Cauliflower Broccoli Cauli Broccoli
Yield kg/ha 23,490 10,100 18,000 6,400 8,600
COP Plants/seed 3,190 3,557 1,045 2,400 3,000
$/ha Fertiliser/pests 1,600 1,860 784 1,534 “
Irrigation 550 260 90 150 “
Cultural 762 426 278 540 602
Other 915 905 160 56 700
Labour 1,999 2,200 3,510 2,088 2,500
Farm Gate Cost $/kg 0.38 0.91 0.33 1.06 0.79
Post harvest Packaging 0.13 0.23 0.11 0.28 0.23
Freight 0.13 0.21 0.08 0.15 0.21
Labour/energy/O’head 0.25 0.28 0.27 0.22 0.28
FOB Cost $/kg 0.89 1.62 0.78 1.70 1.50
Freight cost - Singapore 0.28 0.45 0.34 0.52 0.81
CIF Cost $/kg 1.17 2.07 1.11 2.22 2.31
% China CIF Singapore 128% 161% 121% 172% 179%
NSW Department of Agriculture; Queensland Department of Primary Industries; Department of Agriculture and Food, WA
China’s cost of production, that is Free on Board (FOB), is much lower than that of Australian producers for most fresh produce. This is primarily attributable to costs of labour.

VG05028 Export Market Situation Analysis for the Australian Cauliflower and Broccoli Industry
37
Many activities remain very labour intensive for this reason. As a percentage of production costs, labour is the most significant cost in Chinese production. Australian broccoli FOB cost is approximately $1.60 per kilogram. Chinese FOB price, not cost, for broccoli is indicatively $0.32 per kilogram or $0.25 at the point of wholesale. Chinese average price receipts for broccoli in Singapore are $1.38 per kilogram CIF compared to Australia’s $2.88 in 2008. Price differentiation of this magnitude is difficult to substantiate in a marginally differentiated product such as broccoli.
China has significant investment in on farm packing facilities. Approximately 80 per cent of vegetable production is performed by small family based businesses. The balance is a more corporate style structure with technologies, scale and investment to rival most developed world production systems. These style businesses have been partially escalated by government policy. The fundamental goals are to ensure that rural labour and its contribution to GDP are maximized. Examples of local and National government support mechanisms include taxation relief specific to vegetable producers (esp. export), subsidized inputs cost, on farm and general infrastructure subsidies and investments, rebates and finance discounts for large scale product managers, fully funded training, research and development. For the foreseeable future it is highly likely that the governments will continue to support the development of the vegetable industry and its associated infrastructures.
Freight is a significant component of export. Air freight is generally suitable for high value produce that can absorb the premium price paid (eg live seafood). Sea freight is most suited to produce such as cauliflower and broccoli. This mode is more affordable but a less timely method of transfer. The export markets of South East Asia are relatively close to Australia which increases competitiveness with suppliers such as South America. China holds a freight cost advantage for many of Australia’s traditional markets. The freight costs from China to key markets are lower but in the main are fairly inconsequential in comparison to other cost chain advantages. The timeliness of China’s shipping freight services is more frequent and the transit times are less. Environmental and resource restrictions could offer some obstacles for export expansion in China. In some areas water resources and land use changes will be evident, but in the main not a significant barrier. Issues such as environmental degradation and chemical residues are apparent. Chemical residue detections in produce have been evident. This is a market problem in terms of market access and consumer sentiment. With careful management and investment this could provide an opportunity for Chinese trade if it is rectified. Improved quality assurance programs are being implemented by the more corporate style businesses in China. China’s increasing domestic demand is not expected to exceed production capacity in the short to medium term. Domestic price for vegetables has increased significantly above the base CPI (Consumer Price Index) in recent years. Domestic price is very competitive with export prices received. Consumption of cauliflower and broccoli is already at developed world levels. Consumption per capita could reasonably be expected to slow or even plateau as substitution by the higher income earners occurs.

VG05028 Export Market Situation Analysis for the Australian Cauliflower and Broccoli Industry
38
Australian cauliflower and broccoli industries hold some competitive advantages. Timing and consistency of supply is one example. Cauliflower production, in Western Australia in particular, managed whole of year supply. Whilst this is theoretically true, there is still a lot of division, particularly between States. Single source supplies are attractive to large retail chains in the goal of reducing category management cost and externalize the risk of supply. Quality assurance and compliance systems are another market instrument that Australian industry does possess. Whilst it adds some cost to the supply, it can also open the doors to risk evasive supermarket retailers. This is particularly useful in the wealthier and more health conscious markets. It does require some parallel promotion. This is often expensive and thus very small levels of investment have been made in this area. Some economies of scale, in terms of total export value, are required for such a task.
Other significant competitors include South Africa, New Zealand, USA and European countries. These are faced with the same levels of price disparity when compared to China. India does have the second highest production levels of cauliflower and broccoli. For the same reasons as China it should be carefully monitored as a potential competitor. Infrastructure, resources and investment base are very different to those that China enjoys, it does however have the base underlying capacity with labour cost and market proximity.
In some markets such as the UAE / Middle East, near neighbour suppliers, such as Jordan, must be monitored and understood. Jordan’s export price for cauliflower to the UAE has increased by 5.5 per cent per annum for the past decade. During the same period the productivity levels have improved and domestic prices have increased 5.3 per cent per annum. Jordan produces almost 80,000 tonnes of cauliflower and broccoli per year. This is similar to the annual production of Australia from a country with one third of the population. This demonstrates its export capacity and financial incentive. Freight advantage for Jordan is much greater.
6. Position statement and discussion The Australian cauliflower and broccoli industries have experienced unprecedented declines in exports since 2001. Exports for cauliflower fell by 21,000 tonnes and broccoli by 6,700 tonnes since the year 2000. Production has collectively remained static. Cauliflower production declined 6,600 tonnes, whilst broccoli increased 6,800 tonnes since the year 2000. Broccoli production in Australia has realized growth in the order of 2.3 per cent per annum since the year 2000. Broccoli exports represented 8,800 tonnes or 19 per cent of production in 2000 to 2003. This fell to approximately 1,900 tonnes or 3 per cent by 2008. Broccoli exports experienced a brief growth in exports during this period largely from trade from out of Queensland. Victoria realized a decline over that same period and continued to fall from 5,000 to 800 tonnes per annum export. This could be partly attributed to Victorian producers being required to reprioritize water resources and competitive improvements in Queensland. The reduction in supply corresponded with increased domestic price and an increase in inter

VG05028 Export Market Situation Analysis for the Australian Cauliflower and Broccoli Industry
39
State trade. Marked increases in production in New South Wales at this time were all directed to domestic supply. The main export markets serviced by Australia were Singapore and Japan. During the export peak in 2003, approximately 40 per cent of all Australian broccoli exports went to Singapore and 20 per cent to Japan. Queensland accounted for over 50 per cent of broccoli exports at this time. Queensland’s trade was primarily 40 per cent Japan and 30 per cent Singapore. This demonstrates the opportunities sort by Queensland for Japanese trade and the reliance of other producing States largely with the Singaporean market. Export price for Australian broccoli has increased inverse to volume decline. This price increase is largely due to the opportunistic position and the niche markets that have been adopted. This reflects the increased cost of production and freight costs. The shift from sea to air freight is made in order to capture the opportunistic high priced but low volume trades. Production and other supply chain input costs, such as labour, energy and fertilizer, have increased markedly over the past few years. The production of cauliflower has decreased by 1.3 per cent per annum since the year 2000. That is down to approximately 69,000 tonnes in 2008 from 76,000 tonnes in 2000. Cauliflower exports averaged 20,900 tonnes or 27 per cent of production in 2000 to 2003. This has declined to 400 tonnes in 2008, which is an average 40 per cent per annum decline since the year 2000. Exports as a percentage of production are now below 1 per cent. All States have declined in their export participation from 2000 to 2008. Western Australia represented the greatest portion of cauliflower exports. It peaked at nearly 25,000 tonnes (90 per cent of exports) but exported less than 200 tonnes in 2008. The main target markets for cauliflower were Singapore and Malaysia which took over 90 per cent of exports. Free on Board (FOB) prices increases mirror the declines in volume exported. The Australian cauliflower and broccoli industry exports have primarily targeted the South East Asian and Japanese markets. The export markets evaluated for broccoli and cauliflower included Singapore, Malaysia, UAE and Japan. Collectively they showed unquestionable market dominance by Chinese exporters. The exception to this was the UAE with Jordan being the principal supplier, though China is slowly increasing market share. Of the selected markets, Chinese exports of these vegetables have grown market share value from 15 per cent in 2003 to over 45 per cent in 2007.
In Singapore for 2007, Australia broccoli supplies held 30 per cent of market value against China’s 66 per cent, despite the 108 per cent apparent price premium. For cauliflower the Australian price premium was 54 per cent and held a market value share of only 3 per cent compared to China’s 89 per cent. The total target export market volume demand increased 4 per cent over the past 5 years. The Malaysian market, for broccoli and cauliflower combined, increased in demand by 46 per cent to 33,300 tonnes from 2003 to 2007. Market price has fallen by 21 per cent over the same period. This demonstrates a very price responsive market compared to the more developed economies such as Singapore.
The Japanese market has reduced its total imports of fresh broccoli and imports very little cauliflower. Chinese supplies have reduced with this shift in demand but at a much lesser rate than Australia. Broccoli imports to Japan are primarily filled by supplies from the United States.
VG05028 Export Market Situation Analysis for the Australian Cauliflower and Broccoli Industry
40
Historically Australian exporters displaced or substituted Taiwanese export suppliers during the 1980’s. Hong Kong did represent significant trade until the mid 1990’s. Declines in exports for Australian cauliflower and broccoli to these destinations can be largely attributed to the increasing capacity and presence of the Chinese suppliers. This was particularly so for Hong Kong after the transfer of sovereignty. Malaysia and Singapore have intrinsic links with the Chinese. This provided an uncomplicated path for trade establishment in these markets. The fundamental catalyst for the decline in Australian exports of cauliflower and broccoli has been the performance and rapid evolution of China’s vegetable export industry. China exports approximately 2 to 3 per cent of production, but represents nearly 20 per cent of world trade. More than 90 per cent of China’s export trade in cauliflower and broccoli is in the Asia region. The primary driver was the Chinese price competitiveness. Fundamentally the production costs for China are comparatively very low. This coupled with lower cost freight and more frequent, short cycle supply capacity has compounded the competitive advantages China enjoys. This was further accelerated by favourable exchange rates and Chinese government support mechanisms. Chinese price receipts are consistently 35 to 65 percent cheaper than Australian supplies in to the same markets. For some markets it is not possible to extract information at an individual product level. Cauliflower and broccoli are often aggregated making it difficult to ascertain the market trends. Some import and export balance sheets are also inaccurate to a significant degree. It is likely that China will remain a significant world producer and exporter of cauliflower and broccoli for the medium term. Production in China is expected to continue expansion albeit at a slightly lower rate. Its relatively low labour costs and government support mechanisms are likely to remain for the foreseeable future. Increasing environmental pressures may curb this progress to some extent. The most likely quarter to slow growth is from market saturation or possibly alternate resource use for more profitable options. Low production costs and increasing scale are the fundamental components of China’s price competitiveness. Price is the critical driver for competitiveness. This is especially so for undifferentiated produce such as fresh cauliflower and broccoli. Production costs are largely driven by labour inputs. This is commonly a cheaper substitute for alternate agronomic approaches or product management technologies. Australian unitary labour price is far greater than that in China. There is considerable scope for Chinese producers to adjust produce management as labour rates increase. China’s production base is structurally diverse. Even though the majority is small family based units, the balance of corporate style producing companies and well coordinated collectives are improving continually. These companies have the capacity to improve their agronomic and supply chain management. This will aim to address the qualitative and quantitative needs of international trade. Conversely Australian producers are smaller scale, fragmented suppliers. There is very little supply chain cohesion between these producers. There are very limited examples of large scale Australian based producers of cauliflower and/or broccoli. Australian companies are increasingly focused on domestic trade opportunities. China’s increased attention to qualitative parameters will negate the few

VG05028 Export Market Situation Analysis for the Australian Cauliflower and Broccoli Industry
41
remaining supply advantages that Australian exporters possess to substantiate a price premium. There are still fundamental risks with chemical residues and other quality issues. Export focused businesses recognize this threat and are actively addressing such issues. Whilst these issues will not be fully resolved, produce subject to these risks will most likely be directed to the sizeable domestic market. Chinese domestic consumption accounts for approximately 97 per cent of its production. It is a significant hedge against any market impediments that may arise in the export arena. This is however a concern for importers. Should crop performance at any given time be curtailed, the more attractive domestic pricing may redirect supplies. These food security issues are of great concern to countries such as Singapore and Japan, which are significantly reliant on food imports. In China, consumption on a per capita basis is already high by world standards. It is reasonable to expect some decrease in demand, particularly from those in the higher income stream. The vast majority of the population is still at a low disposable income level, so this impact should be minor in the short term. Given Australia’s current competitive position for cauliflower and broccoli in its traditional markets, there is a clear need is to identify the complexities driving supply chain costs and capacities for both Australian and Chinese suppliers. The goal is to identify and quantify the financial and logistical requirements to improve market competitiveness. The options are to reduce supply chain cost, identify market niches, differentiate product and/or monitor markets to identify shifts in supply/demand conditions. Supply chain costs are critical to competitiveness. Australia’s labour cost and supply surety is a significant impediment in the supply chain. Costs of labour are far greater than that of our competitors. Compounding this is the aversion to this style of field work, making it periodically difficult to ensure supply of labour. Energy, fertilizer and other input costs are increasing but produce price shifts are not parallel or quick to respond. Coping with this cost price squeeze has been historically managed by using yield improvements to dilute unitary costs. While focusing on cost and production performance is the basis for the supply chain, an evolutionary approach has largely been adopted for the remainder. Industry needs a more accurate and tailored supply chain evaluation. This requires the development of an interrogative financial framework. The framework or model should provide a matrix evaluation of supply across regions and supply periods. A more coordinated approach to supply is required in terms of internal or domestic comparative advantage. In order to impact price competitiveness some fundamental changes will be required. This approach needs to be coupled with a raft of other technologies or logistics to achieve the required sizeable gains in competitiveness. Mechanization in order to reduce labour demand has been examined and is not yet conclusive. Other production inputs, freight efficiency, packaging costs and cool chain management need to be developed, in conjunction with mechanical harvesting, as a package or supply chain solution. Typically over 50 per cent of costs are incurred beyond the farm gate.

VG05028 Export Market Situation Analysis for the Australian Cauliflower and Broccoli Industry
42
By mechanizing such crops there are rotational synergies and other symbiotic economics for other large scale irrigated crops. The typical fragmented and small scaled production in Australia is a fundamental impediment. By moving cauliflower and broccoli into the broader scale cropping systems, such as potato, carrot and onion, could offer some economies of scale advantages. Sales coordination, capacity, capital infrastructure cost dilution, purchasing power and specialized management structures are good example of the advantages offered by economies of scale for these industries. Common obstacles for the adoption of such business models are the capital entry costs (particularly land/water), relative returns to capital, seasonal risk, agronomic rotational complexities coupled with suitable and timely markets.
From the market perspective the Chinese supply drivers need to be quantified and projected with specific reference to cauliflower and broccoli. Domestic demand, production capacity and financial structure (eg exchange rates) typify the variables that need to be evaluated. Much of this analysis is available within sources such as USDA and the AVIDG publications. This information needs to be tailored to the supply situation for broccoli and cauliflower. A pincer style evaluation contrasting the range of probable and potential suppliers and their associated costs is required. This should be couple with an analysis of potential shifts in the demand and supply parameters of China’s industry. The performance of other potential competitors, such as India and smaller Asian countries, should also be monitored. This should include key parameters such as production, export, GDP and consumption trends. The marginal comparison matrix would include supply chain costs by significant producing States (or regions), by seasonality, by selected markets and products. Evaluating the marginal difference, between Australia’s potential supply costs and possible shifts in China’s supply performance, will provide a target scenario for the reinvigoration or protection of the cauliflower and broccoli industries of Australia. Supply management is difficult given the variable nature of agricultural production. This is further complicated by the fractured production and marketing of vegetables. Due to this approach, exporters are often left to negotiate in isolation on a purely on a price basis. The normal market forces then dictate that the primary producer is then a price taker whilst supplies are plentiful. Consolidation and collaboration can to some extent alleviate this predicament. There is a need to evaluate how collaboration and consolidation in Australian could be achieved, as well as quantifying the supply chain development. The willingness, readiness and capacity of industry must be the primary consideration of such measures. Levied funds that are governed by representative industry participants are vital to this end. This has largely been addressed in recent times with initiatives such as the Australian Vegetable Industry Development Group (AVID) and Vegetable Industry Export Network (VIEN). These representatives need the appropriate frameworks and data to make informed decisions. Some current data sources have questionable accuracy and are often not timely in supply. There is a need to improve market and production data gathering and dissemination.

VG05028 Export Market Situation Analysis for the Australian Cauliflower and Broccoli Industry
43
A significant factor in export marketing is exchange rate. It is important that industry understands its impact and it is incorporated into planning. Many traditional market and competitor currencies are closely linked to the United States of America (US) dollar. Exchange rates are a critical component of international trade competitiveness. The Australian dollar has fluctuated widely in recent times from around $0.50 to $0.95 US. The Australian exchange rate has been largely undervalued in recent times ($0.65 US) and many analysts believe that this should be around 10 per cent higher. Analysts also believe that the Chinese currency is undervalued against the US. These analyses vary in discrepancy values from 5 to 40 per cent. The net effect of the Chinese currency realizing such appreciation is that whilst they may become relatively more expensive to purchase, but the relative cost of shipping will decline. The marginal shift in exchange rates alone would not bridge the cost gap that Australian produce incurs. Australian government has a responsibility to facilitate trade and investment related issues. Industry has the responsibility to furnish such agencies with the required support. In some markets, tariffs and other import restrictions for Australian produce is an important part of the cost chain. Government and industry need to work in together in order to effectively accelerate negotiation of such issues. With Australia’s developed economy status, a high and increasing GDP per capita, it would have been reasonable to expect that consumption of cauliflower and broccoli would remain static or decline. Until 2001 this appeared true. From this time apparent consumption per capita has increased 2.75 per cent per annum. The growth in broccoli consumption has been 4 per cent per annum. In the Australian domestic market broccoli has realized increased market share and consumption growth compared to cauliflower. In the early 1990’s consumption was collectively near 6 kilograms per capita, which means over the longer term cauliflower consumption has fallen significantly. The same scenario appears to be the case in the United Kingdom. It is difficult to be conclusive, but factors that have contributed to the increase in consumption include an improved health association with these products and the displaced export capacity. Most brassica products have been reported to have high correlation with anti carcinogenic properties. Broccoli was more broadly available to the Australian consumer in the 1980’s and has gained wide spread and increasing acceptance. There is a need for a clearer understanding of consumer trends in all markets. Product branding is often considered a conduit to better market acceptance. This can work in the Australian domestic market with generic style branding such as local versus Australian versus imported produce. For fresh produce the significant differentiation is the clean, green or safety aspects. The importance and understanding of this for consumers in each market needs to be evaluated before branding/marketing on this basis. The cost of such a campaign should be evaluated against the likely returns. Costs of marketing are high, particularly where your expected total sales are low. Coupled with this whilst Australian cauliflower and broccoli quality is good, it is not necessarily unique. Cost of promoting such differentiation can be high or questionably effective. Industry needs to monitor product transformation trends or opportunities. As an example fresh pre-packed, convenience food may offer some scope. It is generally advisable to steer away from the bulk commodity style processing (Mixed Frozen Vegetables). These prices
VG05028 Export Market Situation Analysis for the Australian Cauliflower and Broccoli Industry
44
are commonly the lowest denomination and require more production scale than is apparent in Australia. The domestic market is the Australian cauliflower and broccoli industries biggest market. This should not be taken for granted. Whilst the export market offers opportunity for expansion, the domestic market is the fundamental base. Export risks are more manageable with greater domestic market dilution. If the domestic market, or share of it, was to decline export risk is increased. Industry must measure its competitive position domestically and protect itself from potential imports. The supply chain analysis model should be structured to include this analysis. Domestic market sales are generally more attractive than exports, but supply and price can be volatile. Supply pressures are generally the only catalyst for fresh vegetable price shift. Quality and point of origin will play a significant role in acceptance. Supermarket chains are the exception to this. The supermarket chains demand price competitive and quality assured produce. Their purchasing power assists them in negotiating these parameters. There are a small number of major super market chains in Australia. These account for the majority of fresh vegetable sales. This perceived lack of competition is frequently cited as a barrier to fair trade for smaller suppliers with little negotiating power.
7. Recommendations The Australian cauliflower and broccoli industries have encountered marked declines in export over the past 5 years. This has been alleviated to some extent with apparent growth in domestic market consumption. Regardless of whether the industry needs to expand, consolidate or withdraw, it needs to informatively measure and plan its position. These industries, and the vegetable industry as a collective, need to quantify and clarify their competitive position for future planning purposes. Industry development frameworks such as VIEN and AVID group are fundamental to the development and coordination of such strategies. It must develop a unified approach for industry based initiatives. A structured framework needs to be developed, adopted and then fine tuned for each industry. This framework must quantify, qualify and test all supply chain parameters and options. Academically an optimal approach to supply can be identified. The true test will be to find mechanisms for industry to apply identified supply models. This is where the industry development groups will again be crucial to industry adjustment. The industry framework or cost/supply chain model should be developed and be able to examine impacts of proposed supply chain shifts or interventions. The impact of proposed research and development could then be partially evaluated before investments are made. The exact structure will change for different industries, but the fundamentals should involve the production, product management and market components of the industry. The lines with in the product management component can be blurred and require particular attention for each structure. Costs of production and product management should be outlined for each target market. These are the elements over which the industry has relative control. A parallel
VG05028 Export Market Situation Analysis for the Australian Cauliflower and Broccoli Industry
45
or conversant model of competitive suppliers should be applied to the same evaluation structure. Cost of production and product management is the front end of the pincer approach to cost/supply chain evaluation. Industry has little control over the environment of the target market component. It does however need to know its position and probable direction. Information for existing and potential markets should be developed and maintained. This should include the monitoring of actual trade results, consumer related issues, in chain needs or change, macro economic trends and the complexities of governance. Priority evaluation of the domestic and remaining export markets should be made. There is a need to be conscious of the timeliness and accuracy of input information. Production and market data requires improved collection and verification from its sources. Some direct industry input could help to reposition some of these indicators. It will sometimes be necessary to make informed judgments and data input into the model with out independent data sources. Cost competitiveness is a fundamental weakness in current export markets. Industry needs to identify and employ cost efficiency gains to compliment the quality parameters and market linkages it currently posses. Target cost chain components should include further examination and development of mechanical harvest systems, post handling, packaging and freight efficiencies. Traditional agronomic development should not be ignored. Marginal gains in saleable yield through better technologies or management can assist in cost competitiveness. Structural issues are difficult to address. These are largely left to the evolutionary process. Through mechanization cauliflower and/or broccoli may be able to enter the broader scale production systems. These brassica crops can offer good rotational advantages to current broader scale irrigated agriculture. It would be further advantageous to examine the relative competitive performance of regions/States across the calendar (esp for export). There are obvious environmental and structural advantages for different zones that need to be more accurately gauged. Market coordination of such an approach may be difficult to develop. China will remain the main competitor for Australian cauliflower and broccoli. The Australian vegetable industry needs to monitor, evaluate and provide an outlook or guidance to developments in the Chinese vegetable industry. This should be done initially from a defensive position and later developed to gauge proactive strategies. Australia’s domestic market should be consolidated as a priority. Investments into consumer trends and the trade environment should be examined. Price sensitive markets like Malaysia will be exceptionally difficult to access for Australian industry. It seems likely that Australia can maintain some market presence in developed economy markets such as Singapore. This will come under increasing pressure as China remedies its quality and safety issues. For the Middle East markets some potential is apparent. A better understanding of the performance and capacity of its Gulf suppliers is required. It appears that broccoli has a better outlook for both the market and production aspects. Any cost competitive strategies and/or market evaluation should be prioritized toward this crop. Australian industry can not wait for China to change; it must manage its capacity and adjust to the market environment as it changes.

VG05028 Export Market Situation Analysis for the Australian Cauliflower and Broccoli Industry
46
8. References and further reading Australian Bureau of Statistics (ABS) – www.abs.gov.au Food Advantage Consulting Services – Horticulture Australia, Global Comparative Analysis – China, 2008 Global Trade Information Services (GTIS) - www.gtis.com Hudson and Howells, Market Information Audit – Vegetables and China, 2007 Fresh Produce Information – www.freshinfo.com Japanese External Trade Organisation - www.jetro.go.jp The World of Vegetables, Rabobank, 2006 Food and Agriculture Organisation of the United Nations (FAO) – www.faostat.fao.org Kearns,B, The Middle East: An overview of the market for Victorian food products, 2006 Department of Statistics, Jordan – www.dos.gov.jo/agr/agr_e/index.htm Warr, S. et al, Changing food consumption and imports in Malaysia, ABARE, 2008 Australian Bureau of Agriculture and Resource Economics – www.abare.gov.au Apted, S. et al, International competitiveness of the Australian vegetable production sector, ABARE, 2006 New South Wales Department of Primary Industries, www.dpi.nsw.gov.au/agriculture/farm-business/budgets Reserve Bank of Australia - www.rba.gov.au/Statistics/ Crooks, S. Australian vegetable growing - economic survey, 2006-07, ABARE, 2009 Department of Agriculture, Fisheries and Forestry – www.daff.gov.au The World Bank – www.worldbank.org Economic Research Service, US Department of Agriculture, www.ers.usda.gov/data/ World Trade Organisation – www.wto.org Department of Statistics, United Arab Emirates – www.economy.ae


