Exposure to mercury among Spanish preschool children: Trend from birth to age four Sabrina Llop a,b,n , Mario Murcia b,a , Xabier Aguinagalde c , Jesus Vioque b,d , Marisa Rebagliato b,e , Amparo Cases a , Carmen Iñiguez a,b , Maria-Jose Lopez-Espinosa a,b , Ascensión Amurrio c , Eva María Navarrete-Muñoz b,d , Ferran Ballester a,b,f a Foundation for the Promotion of Health and Biomedical Research in the Valencian Region, FISABIO-Public Health, Av. Catalunya 21, 46020 Valencia, Spain b Spanish Consortium for Research on Epidemiology and Public Health (CIBERESP), Madrid, Spain c Laboratorio de Salud Pública de Alava, Santiago 11, 01002 Vitoria Gasteiz, Spain d Universidad Miguel Hernandez, Avenida de Alicante KM 87, 03550 Sant Joan d´Alacant, Spain e Medicine Department, Jaume I University, Av. Vicent Sos Baynat, s/n, 12071 Castelló de la Plana, Spain f Faculty of Nursing, University of Valencia, Jaume Roig s/n, 46010 Valencia, Spain article info Article history: Received 27 September 2013 Received in revised form 6 March 2014 Accepted 19 March 2014 Keywords: Mercury Children Fish consumption Swordfish Prenatal exposure Hair samples abstract The purpose of this study is to describe the total hair mercury concentrations and their determinants in preschool Spanish children, as well as to explore the trend in mercury exposure from birth to the age four. This evolution has been scarcely studied in other birth cohort studies. The study population was 580 four year old children participating in the INMA (i.e. Childhood and Environment) birth cohort study in Valencia (2008–2009). Total mercury concentration at age four was measured in hair samples by atomic absorption spectrometry. Fish consumption and other covariates were obtained by questionnaire. Multivariate linear regression models were conducted in order to explore the association between mercury exposure and fish consumption, socio-demographic char- acteristics and prenatal exposure to mercury. The geometric mean was 1.10 mg/g (95%CI: 1.02, 1.19). Nineteen percent of children had mercury concentrations above the equivalent to the Provisional Tolerable Weekly Intake proposed by WHO. Mercury concentration was associated with increasing maternal age, fish consumption and cord blood mercury levels, as well as decreasing parity. Children whose mothers worked had higher mercury levels than those with non working mothers. Swordfish, lean fish and canned fish were the fish categories most associated with hair mercury concentrations. We observed a decreasing trend in mercury concentrations between birth and age four. In conclusion, the children participating in this study had high hair mercury concentrations compared to reported studies on children from other European countries and similar to other countries with high fish consumption. The INMA study design allows the evaluation of the exposure to mercury longitudinally and enables this information to be used for biomonitoring purposes and dietary recommendations. & 2014 Elsevier Inc. All rights reserved. 1. Introduction Mercury is a ubiquitous pollutant that appears naturally, however it has been the anthropological sources which have brought about a significant increase of its concentrations in the environment. Mercury can exist in several forms, but it is organic methylmercury (MeHg) that is one of the most relevant from the public health point of view, due to its neurotoxic effects (Driscoll et al., 2013; World Health Organization (WHO), 2010). Most MeHg originates in aquatic systems where it is formed from the inorganic form through the action of bacteria present in water and sediments (Parks et al., 2013). The dominant pathway of human mercury exposure to MeHg is through eating seafood. Predatory fish such as swordfish, shark, and Contents lists available at ScienceDirect journal homepage: www.elsevier.com/locate/envres Environmental Research http://dx.doi.org/10.1016/j.envres.2014.03.023 0013-9351/& 2014 Elsevier Inc. All rights reserved. Abbreviations: AESAN, Asociación Española de Sanidad Ambiental y nutrición; CI, confidence intervals; Democophes, demostration of a study to coordinate and perform human biomonitoring on a European scale; EFSA, European Food Safety Authority; EPIC, European Investigation into Cancer and Nutrition; GM, geometric mean; Hg, mercury; INMA, Infancia y Medio Ambiente; MeHg, methylmercury; PTWI, provisional tolerable weekly intake; RfD, reference dose; sd, standard deviation; T-Hg, total mercury; US EPA, Environmental Protection Agency in United States; WHO, World Health Organization n Corresponding author at: Foundation for the Promotion of Health and Biome- dical Research in the Valencian Region, FISABIO-Public Health, Av. Catalunya 21, 46020 Valencia, Spain. E-mail address: [email protected](S. Llop). Environmental Research 132 (2014) 83–92
Transcript
Exposure to mercury among Spanish preschool children: Trend frombirth to age four
Sabrina Llop a,b,n, Mario Murcia b,a, Xabier Aguinagalde c, Jesus Vioque b,d,Marisa Rebagliato b,e, Amparo Cases a, Carmen Iñiguez a,b, Maria-Jose Lopez-Espinosa a,b,Ascensión Amurrio c, Eva María Navarrete-Muñoz b,d, Ferran Ballester a,b,f
a Foundation for the Promotion of Health and Biomedical Research in the Valencian Region, FISABIO-Public Health, Av. Catalunya 21, 46020 Valencia, Spainb Spanish Consortium for Research on Epidemiology and Public Health (CIBERESP), Madrid, Spainc Laboratorio de Salud Pública de Alava, Santiago 11, 01002 Vitoria Gasteiz, Spaind Universidad Miguel Hernandez, Avenida de Alicante KM 87, 03550 Sant Joan d´Alacant, Spaine Medicine Department, Jaume I University, Av. Vicent Sos Baynat, s/n, 12071 Castelló de la Plana, Spainf Faculty of Nursing, University of Valencia, Jaume Roig s/n, 46010 Valencia, Spain
a r t i c l e i n f o
Article history:Received 27 September 2013Received in revised form6 March 2014Accepted 19 March 2014
The purpose of this study is to describe the total hair mercury concentrations and their determinants inpreschool Spanish children, as well as to explore the trend in mercury exposure from birth to the agefour. This evolution has been scarcely studied in other birth cohort studies.
The study population was 580 four year old children participating in the INMA (i.e. Childhood andEnvironment) birth cohort study in Valencia (2008–2009). Total mercury concentration at age four wasmeasured in hair samples by atomic absorption spectrometry. Fish consumption and other covariateswere obtained by questionnaire. Multivariate linear regression models were conducted in order toexplore the association between mercury exposure and fish consumption, socio-demographic char-acteristics and prenatal exposure to mercury.
The geometric mean was 1.10 mg/g (95%CI: 1.02, 1.19). Nineteen percent of children had mercuryconcentrations above the equivalent to the Provisional Tolerable Weekly Intake proposed by WHO. Mercuryconcentration was associated with increasing maternal age, fish consumption and cord blood mercury levels,as well as decreasing parity. Children whose mothers worked had higher mercury levels than those with nonworking mothers. Swordfish, lean fish and canned fish were the fish categories most associated with hairmercury concentrations. We observed a decreasing trend in mercury concentrations between birth and agefour. In conclusion, the children participating in this study had high hair mercury concentrations compared toreported studies on children from other European countries and similar to other countries with high fishconsumption. The INMA study design allows the evaluation of the exposure to mercury longitudinally andenables this information to be used for biomonitoring purposes and dietary recommendations.
& 2014 Elsevier Inc. All rights reserved.
1. Introduction
Mercury is a ubiquitous pollutant that appears naturally, howeverit has been the anthropological sources which have brought about asignificant increase of its concentrations in the environment. Mercurycan exist in several forms, but it is organic methylmercury (MeHg)that is one of the most relevant from the public health point ofview, due to its neurotoxic effects (Driscoll et al., 2013; World HealthOrganization (WHO), 2010). Most MeHg originates in aquaticsystems where it is formed from the inorganic form throughthe action of bacteria present in water and sediments (Parks et al.,2013).
The dominant pathway of human mercury exposure to MeHg isthrough eating seafood. Predatory fish such as swordfish, shark, and
Contents lists available at ScienceDirect
journal homepage: www.elsevier.com/locate/envres
Environmental Research
http://dx.doi.org/10.1016/j.envres.2014.03.0230013-9351/& 2014 Elsevier Inc. All rights reserved.
Abbreviations: AESAN, Asociación Española de Sanidad Ambiental y nutrición;CI, confidence intervals; Democophes, demostration of a study to coordinate andperform human biomonitoring on a European scale; EFSA, European Food SafetyAuthority; EPIC, European Investigation into Cancer and Nutrition; GM, geometricmean; Hg, mercury; INMA, Infancia y Medio Ambiente; MeHg, methylmercury; PTWI,provisional tolerable weekly intake; RfD, reference dose; sd, standard deviation; T-Hg,total mercury; US EPA, Environmental Protection Agency in United States; WHO, WorldHealth Organization
n Corresponding author at: Foundation for the Promotion of Health and Biome-dical Research in the Valencian Region, FISABIO-Public Health,Av. Catalunya 21, 46020 Valencia, Spain.
fresh tuna have the highest concentrations of MeHg (Martorell etal., 2011). Moreover, MeHg bioaccessibility in these fish, for exam-ple, swordfish, may reach 94% (Torres-Escribano et al., 2010). In fact,a direct relationship between fish intake and mercury concentra-tions has been observed in different populations (Bjornberg et al.,2003; Freire et al., 2010; Miklavcic et al., 2013; Ramon et al., 2011;Schoeman et al., 2010; Steuerwald et al., 2000). MeHg is effectivelyabsorbed from the gastrointestinal tract and readily crosses theplacenta and blood–brain barrier (World Health Organization(WHO), 2007).
Mercury is known to be neurotoxic to humans and childrenare especially vulnerable to this exposure, since their immunesystem and detoxification mechanisms are not yet fully devel-oped. Moreover, the human brain continues to develop post-natally, since most neurons have been formed by the time ofbirth, and growth of glial cells and myelinisation of axonscontinues for several years (Grandjean and Landrigan, 2006).Other effects have been associated with early exposure tomercury, such as cardiovascular and immunologic disorders(Karagas et al., 2012).
Given that fish has important components of healthy diets,such as omega-3 polyunsaturated fatty acids, iodine, selenium andvitamin D, there is concern that exposure to MeHg at concentra-tions reached by pregnant women and children with regularfish consumption may impair child development despite thesebeneficial nutrients (Institute of Medicine (IOM), 2006).
Results from the birth cohort study conducted in Faroe(Grandjean et al., 1997) provided the basis for the NationalResearch Council's and US Environmental Protection Agency(EPA)'s 2001 validation of a reference dose (RfD) for MeHg intakeof 0.1 μg/kg of body weight per day, as an estimate of a dailyexposure where no appreciable risk of deleterious effects duringa lifetime would occur (US Environmental Protection Agency,2007). This level would correspond to a maternal hair MeHgconcentration of 1.0 mg/g and a MeHg concentration of 5.8 μg/Lin whole cord blood (Budtz-Jorgensen et al., 2000). Other agencieshave recommended regulatory levels that are significantly lessstringent than EPA's RfD. Thus, the Food and Agriculture Organiza-tion (FAO) and the World Health Organization (WHO) revised in2003 and confirmed in 2006 the Provisional Tolerable WeeklyIntake (PTWI) of MeHg to a level of 1.6 μg/kg of body weight perweek (0.23 μg/kg per day) (United Nations EnvironmentProgramme, 2007).
The two biomarkers most frequently used to determineindividual exposures to this contaminant are the mercuryconcentrations in scalp hair and in whole blood (Grandjean etal., 2005). The association between the two exposure biomar-kers was determined in a number of studies (mean ratio rangebetween 140 and 370). The WHO Expert Committee on foodadditives used a value of 250 to represent the overall averageratio (World Health Organization (WHO), 2004).
The INMA study (i.e. Childhood and Environment) is aSpanish birth cohort study that aims to investigate the roleof the most relevant toxicants in the environment on childhealth and development. In previous studies, high levelsof prenatal exposure to mercury were reported in the INMAcohort, with 24% of newborns having concentrations above theWHO PTWI and 64% above the US EPA RfD (Ramon et al., 2008,2011). Despite this, prenatal exposure to mercury was notassociated with a delay in cognitive and psychomotor develop-ment during the second year of age (Llop et al., 2012). Thepurpose of this study is to describe the hair mercury concentra-tion at age four of those children and its relationship with socio-demographic, environmental and dietary factors, as well asto explore the trend in mercury exposure between birth andage four.
2. Materials and methods
2.1. Study population and study design
Subjects were participants in the INMA (Environment and Childhood) Project, amulticenter birth cohort study that aims to investigate the effect of environmentalexposures and diet during pregnancy on fetal and child development in differentgeographic areas of Spain (http://www.proyectoinma.org). The study protocol hasbeen reported elsewhere (Guxens et al., 2012). Briefly, the original population inthis study consisted of 855 women recruited at the first trimester of pregnancy(2003–2005) in the INMA cohort of Valencia (Spain). Excluding the women whowithdrew from the study, were lost to follow-up, and had induced or spontaneousabortions or fetal deaths, we followed up a total sample of 787 (92%) women untildelivery (2004–2006). Their children were enrolled at birth and were followed upuntil the age of four (n¼593; 69%).
The final study population was made up of 580 children with available mercuryconcentrations and covariates data. Informed consent was obtained from allparticipants in each phase, and the study was approved by the hospital ethicscommittee.
2.2. Mercury analysis
Whole blood samples were collected from cord vessels using venipuncturebefore the placenta was delivered and then frozen to �80 1C until analysis. Hairsamples were collected from the occipital scalp when children were 4 years old,placed in a plastic bag and stored at room temperature until analysis.
The analyses of total mercury (T-Hg) were carried out in the Public HealthLaboratory of Alava (Basque Country, Spain) using, for both types of samples, a single-purpose mercury analyzer (AMA 254. Leco Corporation. St. Joseph, Michigan). Thesamples were weighed in a nickel boat and analyzed in the quoted equipment bycatalytic combustion, gold amalgamation, thermal desorption, and atomic absorptionspectrometry. Replicate analyses were made for each sample. The limits of determina-tion of the method (LOD) were 2.0 μg/L for blood samples and 0.01 μg/g for hairsamples. For measurements in cord blood below the LOD (o5%) we used the approachLOD/√2 (Centers for Disease Control and Prevention, 2009).
The laboratory analyzed daily reference materials with each batch of samples,as internal quality control to check the accuracy of the results. The referencematerials used were: Seronorm Trace Elements in Whole Blood (L-2, L-3Billingstad, Norway) for blood samples and NCS ZC 81002b Human hair (Beijing,China) for hair.
Additionally, from 2009 onwards, the Public Health Laboratory of Alavaparticipates regularly (3 times per year) in inter-laboratory comparisons organizedby the New York State Department of Health in the Wadsworth Center withsatisfactory results.
We assumed that a high proportion of the T-Hg measured in our studypopulation was MeHg and used the T-Hg concentrations to calculate the percentageof samples above the EPA's RfDs or the WHO's PTWI.
2.3. Covariates
Women filled in 2 questionnaires during their pregnancy, at the first and the thirdtrimesters of gestation. The questionnaires were administered by trained interviewersand focused on socio-demographic, environmental, and lifestyle information duringpregnancy. The covariates used in this study were maternal and paternal age atconception, maternal and paternal educational level (up to primary, secondary,university), country of birth (Spanish, other), and parity (0, 1, Z2 deliveries).
We defined parental social class according to the most privileged occupation duringpregnancy of the mother or the father using a widely used Spanish adaptation of theinternational ISCO88 coding system (Domingo-Salvany et al., 2000). Class I includedmanagerial jobs, senior technical staff, and commercial managers; class II includedskilled non-manual workers; and class III, manual workers.
In a subsequent interview, when the children were between 11 and 21 monthsof age we obtained information on duration of breastfeeding (0, 40–16, 416–24,424 weeks). Breastfeeding was defined as ingesting breast milk regardless ofwhether or not infants were receiving any other supplementation with food orliquid including nonhuman milk.
When children were age four, we obtained information about maternal andpaternal employment status (working, not working), children had lunch in theschool canteen (yes, no), parental cohabitation (yes, no), and type of zone ofresidence (urban, sub-urban, metropolitan, rural). In addition, a semi-quantitativefood frequency questionnaire (FFQ) of 105 food items was administered in order toassess the usual daily intake for main foods and nutrients among children(available upon request at: http://bibliodieta.umh.es/cfa-105-inma-infancia/). TheFFQ was a modified version from a previous FFQ based on the Harvard ques-tionnaire (Willett et al., 1985) which we developed and validated among mothers ofthe INMA-Valencia study when they were pregnant (Vioque et al., 2013). To adapt itfor children, additional foods items and suitable portion sizes for children 4–5 yearsold were used in the questionnaire.
S. Llop et al. / Environmental Research 132 (2014) 83–9284
Nutritionists collected dietary information by asking mothers or caregivers ofchildren how often, on average, their children had consumed each specific food andserving size during the year previous to the interview. The questionnaire had ninepossible responses, ranging from ‘never or less than once per month’ to ‘six or moreper day’.
Ten food items were used in the FFQ to estimate fish intake. For each participant,the responses for each serving of fish were converted into mean weekly intake tocompute the total fish intake and the intake of specific fish groups: lean fish (twoitems), swordfish, other large oily fish (tuna, bonito, salmon), small oily fish (mackerel,sardine, anchovy), canned fish (tuna, sardine, mackerel), shellfish (two items: crusta-ceans and bivalves) and cephalopods, and processed fish (surimi, fish sticks).
2.4. Statistical analysis
We calculated the geometric mean (GM) and 95% confidence intervals (95%CI)of the T-Hg concentrations according to socio-demographic and environmentalcharacteristics of the study population. All values of hair T-Hg were above the LODof 0.01. For further analysis, the variable T-Hg was log2-transformed due to itsskewed distribution. ANOVAwas carried out to compare the mean log2 T-Hg valuesacross categories of the socio-demographic and environmental characteristics.
Bivariate and multivariate linear regression models were performed in order tostudy the relationship between the hair T-Hg concentrations and the socio-demo-graphic, environmental and dietary factors. Beta coefficients and 95%CI were obtained.The multivariate model was built using all the covariates in the bivariate analysisassociated with a po0.1. Following a backward elimination procedure, all the covariatesassociated with T-Hg concentrations at a level of po0.1 in the likelihood ratio test wereretained in the model. This model included total fish intake, calculated as the sum ofeach individual group (weekly servings). Fish intake was log2 transformed in order toassure linearity. For logarithmic calculations, we assigned the value 0.1 weekly servingsto the category “never or less than once per month”.
The association between intake of each seafood group and hair mercuryconcentrations was also evaluated. In the multivariate model we introduced allfish intake variables. The change (%) in hair mercury concentrations caused by eachfish intake variable was graphically represented. Although fish intake variableswere mutually correlated, we found no collinearity problems among them.
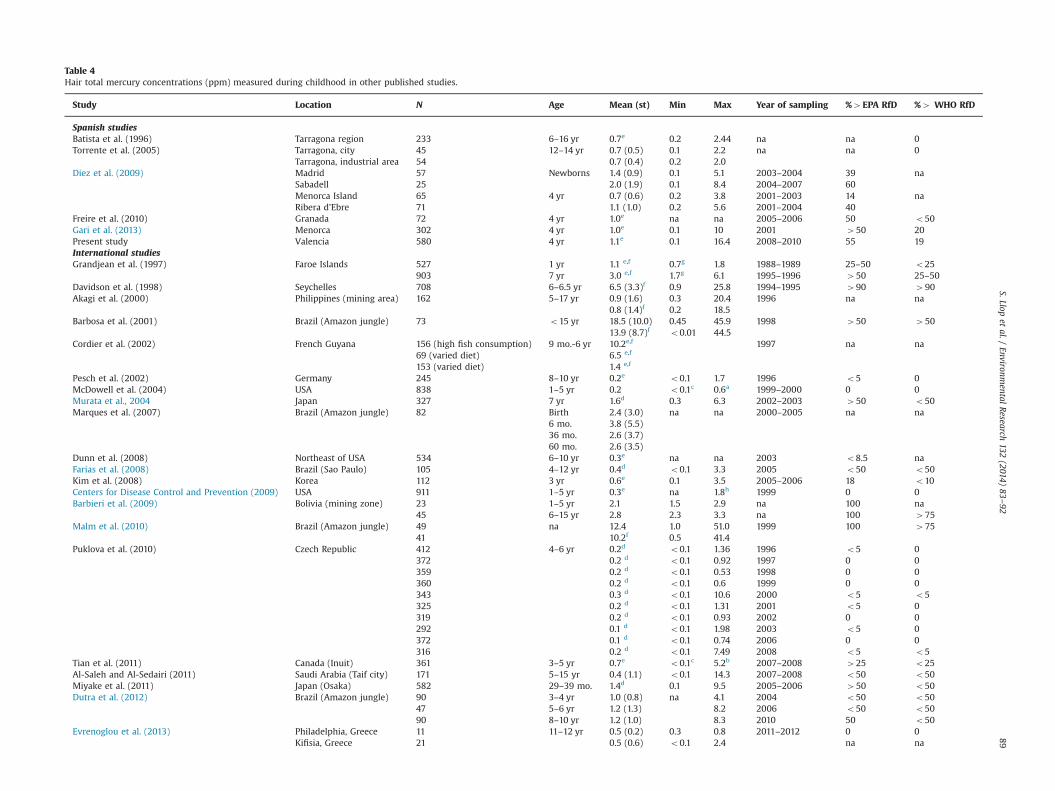
In order to study the mercury concentrations trend from birth to age 4, weapplied the factor proposed by the WHO Expert Committee (hair:blood ratio of250) to the cord blood T-Hg concentrations and obtained the equivalent hairsample T-Hg concentrations (World Health Organization (WHO), 2004). Thedifference between both variables was calculated and a Kernel density diagramwas plotted including both exposure variables.
The analyses were carried out by using the Stata, version 11, statistical package(StataCorp LP, College Station, Texas).
3. Results
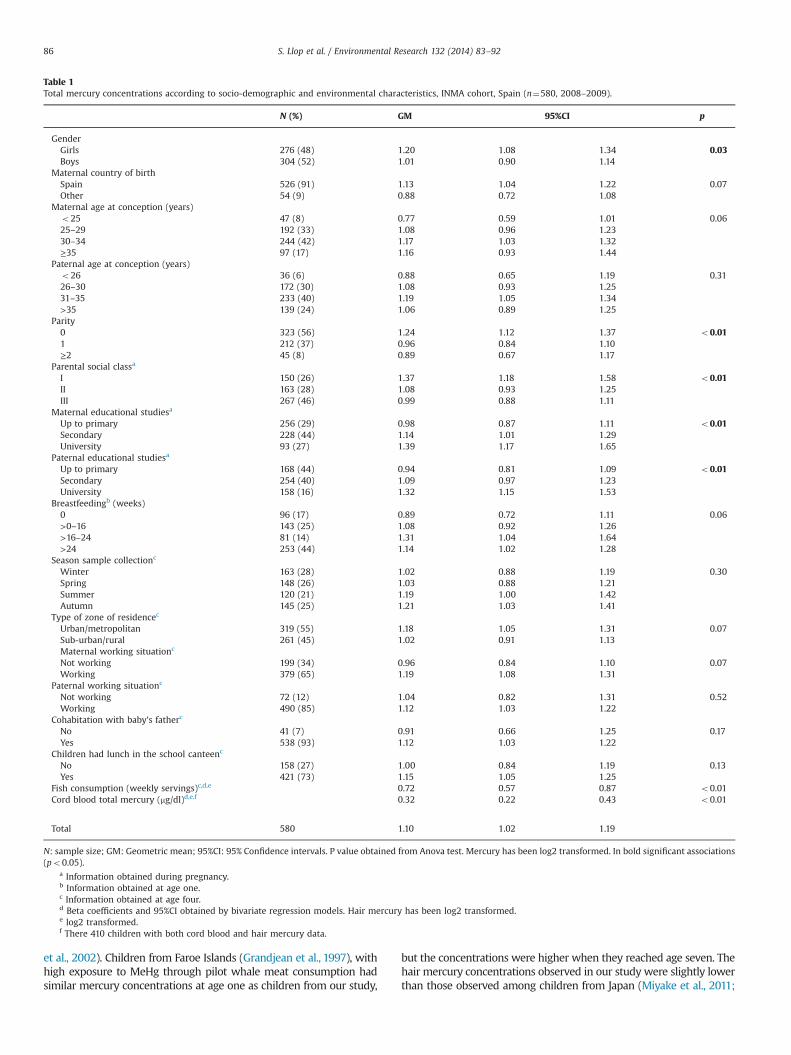
T-Hg concentrations were detected in all hair samples (n¼580).The GM was 1.10 mg/g (95%CI: 1.02, 1.19), with an inter-quartilerange from 0.61 to 1.99 μg/g, and a median of 1.12 μg/g. Fifty-fivepercent of samples exceeded a T-Hg concentration of 1 μg/g and5 samples had concentrations above 10 μg/g. Nineteen percent ofchildren had mercury concentrations above the PTWI proposed bythe WHO (i.e. 2.5 μg/g).
T-Hg concentrations according to socio-demographic and environ-mental characteristics of the study population are shown in Table 1.We found significantly higher Hg concentrations among girls thanboys. Children with foreign mothers had lower T-Hg concentrationscompared to those whose mothers were of Spanish origin. Child T-Hgconcentrations were directly associated with maternal age and inver-sely associated with parity. Children belonging to higher compared tolower social class presented higher T-Hg concentrations. Higher childT-Hg concentrations were associated with higher parental educationallevel, with children of university educated mothers and fathers havinghigher concentrations compared to those whose mothers and fathersfinished only primary school. Children who were breastfed had higherT-Hg concentrations than children who never breastfed. Geographicaldifferences were also found with higher T-Hg concentrations inchildren who lived in urban/metropolitan compared to sub-urban/rural areas. Children with working mothers had higher concentrationscompared to those who did not work.
The mean weekly intake of total fish by the children was 4.0 ser-vings per week, sd: 2.1 (Table 2). The most frequently consumed fish
was lean fish (mean: 1.8 servings/week, sd: 1.4), followed by processedfish (mean: 0.5 servings/week; sd: 2.1), swordfish (mean: 0.4 weeklyservings; sd: 0.6), and canned fish (mean: 0.4 servings/week; sd: 0.6).Hair T-Hg concentrations in children increased as a function of totalfish intake (Fig. 1a). The GM mercury concentrations in children whoate o2 servings/week was 0.57 (95%CI: 0.46, 0.70) and for those whoate 6 or more servings/week was 1.69 (95%CI: 1.41, 2.02). Hair T-Hgconcentrations in children at age four were clearly related to cordblood T-Hg concentrations at birth (Fig. 1b).
Variables associated with T-Hg concentrations in the multi-variate analysis were: maternal age, parity, maternal employment,fish intake and cord blood T-Hg concentrations (Table 3). Hair T-Hgconcentrations were directly associated with total fish intake(β¼0.60; 95%CI: 0.42, 0.77) and cord blood T-Hg concentrations(β¼0.26; 95%CI: 0.16, 0.37).
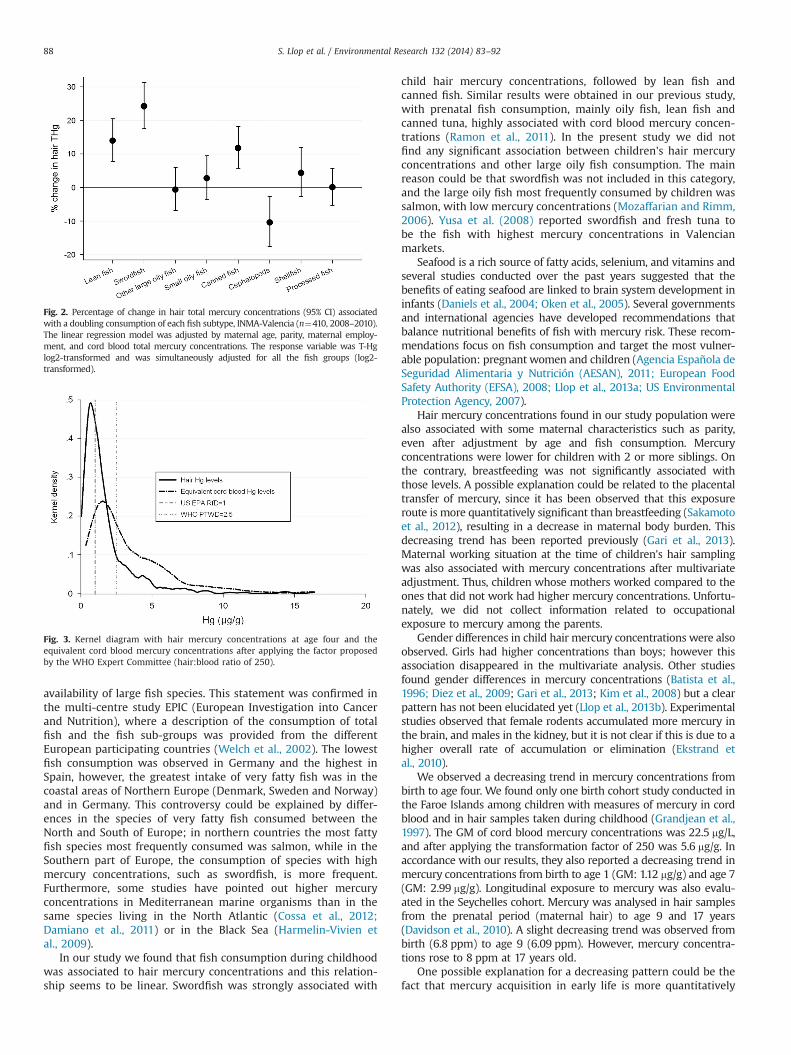
Intake of swordfish, lean fish, and canned fish were the clearesttypes related to mercury concentrations (Fig. 2). A doublingconsumption of swordfish, lean fish and canned fish were asso-ciated with an increase in T-Hg concentrations of 24.6% (95%CI:17.5, 31.3), 14.0% (95%CI: 7.8, 20.5) and 11.8% (95%CI: 5.7, 18.2),respectively.
The mean (sd) of the difference between mercury concentra-tions at birth and at age four was 1.86 (2.89) μg/g with an inter-quartile range from 0.21 to 3.03 μg/g indicating, on average, adecrease in T-Hg concentrations from birth to age four. Fig. 3shows the distribution of hair mercury concentrations in bothinstances. The distribution of the equivalent hair mercury con-centrations at birth leans towards the right (higher concentra-tions) more than hair mercury concentrations at age four.
4. Discussion
A high percentage (55%) of the preschool children participating inthis Spanish birth cohort study had concentrations above the equiva-lent levels to the RfD proposed by the US EPA (1 mg/g) and 19% abovethe PTWI proposed by the WHO (2.5 mg/g). These concentrationswere associated with the children's fish consumption during theprevious year, and especially with swordfish, lean fish and can-ned fish, in this order of magnitude. Maternal age, parity, maternalemployment, and the cord blood mercury concentrations weredirectly associated with hair mercury concentrations at four age.
The recommendations proposed by both the US EPA and the WHOderive from an estimate of exposure to MeHg. In our study wemeasured T-Hg concentrations in both cord blood and hair samples. Ithas been observed that the correlation between T-Hg and MeHg inhair samples taken during childhood is high (r40.8) (Freire et al.,2010) and also in cord blood samples (Sakamoto et al., 2007).Mahaffey et al. (2004) found that at elevated concentrations, as inthe case among our population, more than 90% of T-Hg was MeHg. Inconsequence, we assumed that a high proportion of the T-Hgmeasured in our study population was MeHg and used the T-Hgconcentrations to calculate the percentage of samples above the RfDs.
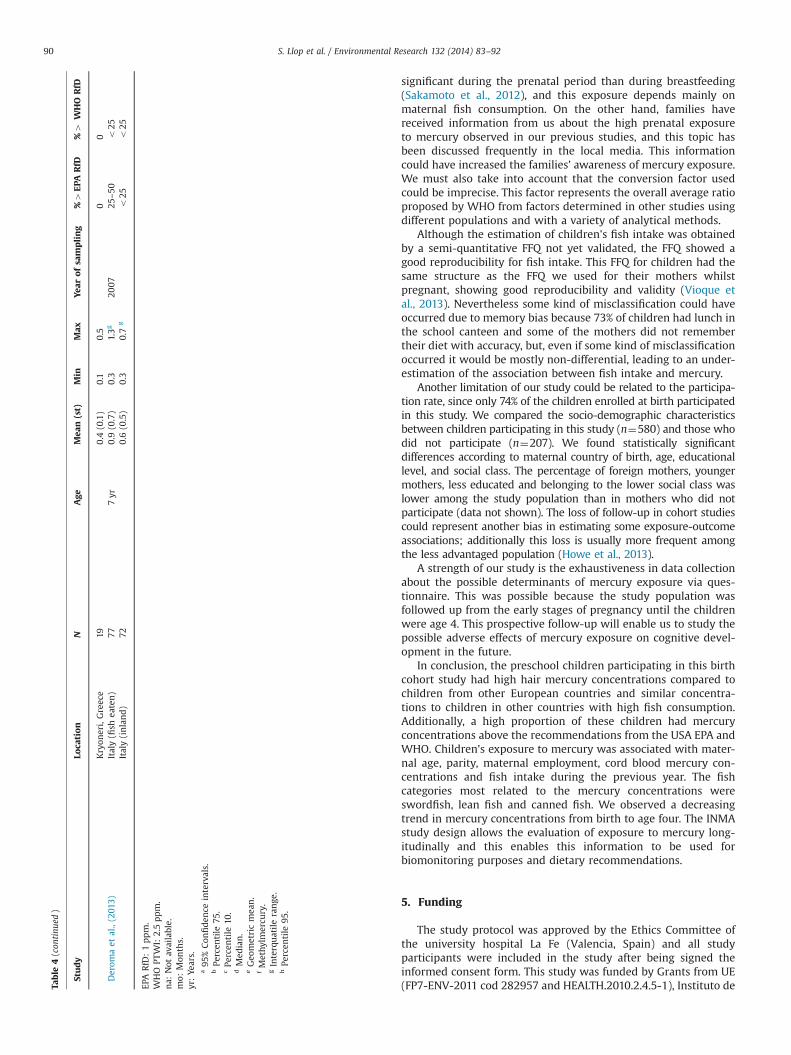
We performed a review of those studies reporting hair mercuryconcentrations in infants, children and adolescents (Table 4). Theconcentrations of four year child hair T-Hg observed in this studywere similar to those found in other Spanish studies (Diez et al.,2009, 2009; Freire et al., 2010; Batista et al., 1996; Torrente et al.,2005). Newborns from Madrid and Sabadell presented the highesthair mercury concentrations reported in Spain, although thesample size was small (Diez et al., 2009).
Regarding other international studies, the highest reported hairmercury concentrations were observed in children from the BrazilianAmazon jungle (Barbosa et al., 2001; Diez et al., 2009; Malm et al.,2010; Marques et al., 2007) Seychelles (Davidson et al., 1998) andchildren with high fish consumption from the French Guyana (Cordier
S. Llop et al. / Environmental Research 132 (2014) 83–92 85
et al., 2002). Children from Faroe Islands (Grandjean et al., 1997), withhigh exposure to MeHg through pilot whale meat consumption hadsimilar mercury concentrations at age one as children from our study,
but the concentrations were higher when they reached age seven. Thehair mercury concentrations observed in our study were slightly lowerthan those observed among children from Japan (Miyake et al., 2011;
Table 1Total mercury concentrations according to socio-demographic and environmental characteristics, INMA cohort, Spain (n¼580, 2008–2009).
Fish consumption (weekly servings)c,d,e 0.72 0.57 0.87 o0.01Cord blood total mercury (mg/dl)d,e,f 0.32 0.22 0.43 o0.01
Total 580 1.10 1.02 1.19
N: sample size; GM: Geometric mean; 95%CI: 95% Confidence intervals. P value obtained from Anova test. Mercury has been log2 transformed. In bold significant associations(po0.05).
a Information obtained during pregnancy.b Information obtained at age one.c Information obtained at age four.d Beta coefficients and 95%CI obtained by bivariate regression models. Hair mercury has been log2 transformed.e log2 transformed.f There 410 children with both cord blood and hair mercury data.
S. Llop et al. / Environmental Research 132 (2014) 83–9286
Murata et al., 2004), but higher than those observed in other Europeancountries such as Germany (Pesch et al., 2002), Czech Republic(Puklova et al., 2010), Greece (Evrenoglou et al., 2013), and Italy(Deroma et al., 2013) and also higher than those observed in childrenfrom the USA (Centers for Disease Control and Prevention, 2009; Dunnet al., 2008; McDowell et al., 2004), Korea (Kim et al., 2008), Inuit fromCanada (Tian et al., 2011) and Saudi Arabia (Al-Saleh and Al-Sedairi,2011). The hair mercury concentrations obtained in this study weresimilar to those observed in children living in a mining communityfrom the Philippines (Akagi et al., 2000).
Recently published data from the multi-country study Demo-cophes in Europe provided data on economic benefits of control-ling mercury exposure in relation to prevention of developmentalneurotoxicity (Bellanger et al., 2013). The authors observed a clearincreasing trend in hair mercury concentrations measured inwomen of reproductive age from North and East to SouthernEuropean countries. They estimated substantial economic benefitsin Europe, mainly in southern countries, by reducing MeHgexposure and also stated that the total benefit from controllingmercury exposure was the highest for Spain, with more than 15million euros per year. The authors attributed this high mercuryexposure in the Mediterranean areas to dietary habits and
Total fish 458 1 4.0 (2.1) 2.5 3.7 5.2 14.3 0.34nn
Sd: standard deviation;max: maximum value.
a The zero value means no fish consumption or a fish consumption below once per month.b Spearman correlation.nn po0.001.n po0.05.
Fig. 1. (a) Relationship between log2 hair total mercury concentrations and log2 total fish consumption, INMA-Valencia (n¼580, 2008–2010). (b) Relationship between log2hair total mercury concentrations and log2 cord blood total mercury, INMA-Valencia (n¼410, 2008–2010).
Table 3Multivariate linear regression models exploring the association between hair totalmercury levels at fourth year of age and socio-demographic and dietary character-istics, INMA cohort, Valencia (2008–2009, n¼410, Spain).
Total fish intakea 0.60 0.42 0.77Cord blood mercury levelsa 0.26 0.16 0.37
Hair mercury concentrations have been log2 transformed.a Log2 transformed.
S. Llop et al. / Environmental Research 132 (2014) 83–92 87
availability of large fish species. This statement was confirmed inthe multi-centre study EPIC (European Investigation into Cancerand Nutrition), where a description of the consumption of totalfish and the fish sub-groups was provided from the differentEuropean participating countries (Welch et al., 2002). The lowestfish consumption was observed in Germany and the highest inSpain, however, the greatest intake of very fatty fish was in thecoastal areas of Northern Europe (Denmark, Sweden and Norway)and in Germany. This controversy could be explained by differ-ences in the species of very fatty fish consumed between theNorth and South of Europe; in northern countries the most fattyfish species most frequently consumed was salmon, while in theSouthern part of Europe, the consumption of species with highmercury concentrations, such as swordfish, is more frequent.Furthermore, some studies have pointed out higher mercuryconcentrations in Mediterranean marine organisms than in thesame species living in the North Atlantic (Cossa et al., 2012;Damiano et al., 2011) or in the Black Sea (Harmelin-Vivien etal., 2009).
In our study we found that fish consumption during childhoodwas associated to hair mercury concentrations and this relation-ship seems to be linear. Swordfish was strongly associated with
child hair mercury concentrations, followed by lean fish andcanned fish. Similar results were obtained in our previous study,with prenatal fish consumption, mainly oily fish, lean fish andcanned tuna, highly associated with cord blood mercury concen-trations (Ramon et al., 2011). In the present study we did notfind any significant association between children's hair mercuryconcentrations and other large oily fish consumption. The mainreason could be that swordfish was not included in this category,and the large oily fish most frequently consumed by children wassalmon, with low mercury concentrations (Mozaffarian and Rimm,2006). Yusa et al. (2008) reported swordfish and fresh tuna tobe the fish with highest mercury concentrations in Valencianmarkets.
Seafood is a rich source of fatty acids, selenium, and vitamins andseveral studies conducted over the past years suggested that thebenefits of eating seafood are linked to brain system development ininfants (Daniels et al., 2004; Oken et al., 2005). Several governmentsand international agencies have developed recommendations thatbalance nutritional benefits of fish with mercury risk. These recom-mendations focus on fish consumption and target the most vulner-able population: pregnant women and children (Agencia Española deSeguridad Alimentaria y Nutrición (AESAN), 2011; European FoodSafety Authority (EFSA), 2008; Llop et al., 2013a; US EnvironmentalProtection Agency, 2007).
Hair mercury concentrations found in our study population werealso associated with some maternal characteristics such as parity,even after adjustment by age and fish consumption. Mercuryconcentrations were lower for children with 2 or more siblings. Onthe contrary, breastfeeding was not significantly associated withthose levels. A possible explanation could be related to the placentaltransfer of mercury, since it has been observed that this exposureroute is more quantitatively significant than breastfeeding (Sakamotoet al., 2012), resulting in a decrease in maternal body burden. Thisdecreasing trend has been reported previously (Gari et al., 2013).Maternal working situation at the time of children's hair samplingwas also associated with mercury concentrations after multivariateadjustment. Thus, children whose mothers worked compared to theones that did not work had higher mercury concentrations. Unfortu-nately, we did not collect information related to occupationalexposure to mercury among the parents.
Gender differences in child hair mercury concentrations were alsoobserved. Girls had higher concentrations than boys; however thisassociation disappeared in the multivariate analysis. Other studiesfound gender differences in mercury concentrations (Batista et al.,1996; Diez et al., 2009; Gari et al., 2013; Kim et al., 2008) but a clearpattern has not been elucidated yet (Llop et al., 2013b). Experimentalstudies observed that female rodents accumulated more mercury inthe brain, and males in the kidney, but it is not clear if this is due to ahigher overall rate of accumulation or elimination (Ekstrand etal., 2010).
We observed a decreasing trend in mercury concentrations frombirth to age four. We found only one birth cohort study conducted inthe Faroe Islands among children with measures of mercury in cordblood and in hair samples taken during childhood (Grandjean et al.,1997). The GM of cord blood mercury concentrations was 22.5 mg/L,and after applying the transformation factor of 250 was 5.6 mg/g. Inaccordance with our results, they also reported a decreasing trend inmercury concentrations from birth to age 1 (GM: 1.12 mg/g) and age 7(GM: 2.99 mg/g). Longitudinal exposure to mercury was also evalu-ated in the Seychelles cohort. Mercury was analysed in hair samplesfrom the prenatal period (maternal hair) to age 9 and 17 years(Davidson et al., 2010). A slight decreasing trend was observed frombirth (6.8 ppm) to age 9 (6.09 ppm). However, mercury concentra-tions rose to 8 ppm at 17 years old.
One possible explanation for a decreasing pattern could be thefact that mercury acquisition in early life is more quantitatively
Fig. 3. Kernel diagram with hair mercury concentrations at age four and theequivalent cord blood mercury concentrations after applying the factor proposedby the WHO Expert Committee (hair:blood ratio of 250).
Fig. 2. Percentage of change in hair total mercury concentrations (95% CI) associatedwith a doubling consumption of each fish subtype, INMA-Valencia (n¼410, 2008–2010).The linear regression model was adjusted by maternal age, parity, maternal employ-ment, and cord blood total mercury concentrations. The response variable was T-Hglog2-transformed and was simultaneously adjusted for all the fish groups (log2-transformed).
S. Llop et al. / Environmental Research 132 (2014) 83–9288
Table 4Hair total mercury concentrations (ppm) measured during childhood in other published studies.
Study Location N Age Mean (st) Min Max Year of sampling %4EPA RfD %4 WHO RfD
Spanish studiesBatista et al. (1996) Tarragona region 233 6–16 yr 0.7e 0.2 2.44 na na 0Torrente et al. (2005) Tarragona, city 45 12–14 yr 0.7 (0.5) 0.1 2.2 na na 0
Tarragona, industrial area 54 0.7 (0.4) 0.2 2.0Diez et al. (2009) Madrid 57 Newborns 1.4 (0.9) 0.1 5.1 2003–2004 39 na
Freire et al. (2010) Granada 72 4 yr 1.0e na na 2005–2006 50 o50Gari et al. (2013) Menorca 302 4 yr 1.0e 0.1 10 2001 450 20Present study Valencia 580 4 yr 1.1e 0.1 16.4 2008–2010 55 19International studiesGrandjean et al. (1997) Faroe Islands 527 1 yr 1.1 e,f 0.7g 1.8 1988–1989 25–50 o25
903 7 yr 3.0 e,f 1.7g 6.1 1995–1996 450 25–50Davidson et al. (1998) Seychelles 708 6–6.5 yr 6.5 (3.3)f 0.9 25.8 1994–1995 490 490Akagi et al. (2000) Philippines (mining area) 162 5–17 yr 0.9 (1.6) 0.3 20.4 1996 na na
0.8 (1.4)f 0.2 18.5Barbosa et al. (2001) Brazil (Amazon jungle) 73 o15 yr 18.5 (10.0) 0.45 45.9 1998 450 450
13.9 (8.7)f o0.01 44.5Cordier et al. (2002) French Guyana 156 (high fish consumption) 9 mo.-6 yr 10.2e,f 1997 na na
69 (varied diet) 6.5 e,f
153 (varied diet) 1.4 e,f
Pesch et al. (2002) Germany 245 8–10 yr 0.2e o0.1 1.7 1996 o5 0McDowell et al. (2004) USA 838 1–5 yr 0.2 o0.1c 0.6a 1999–2000 0 0Murata et al., 2004 Japan 327 7 yr 1.6d 0.3 6.3 2002–2003 450 o50Marques et al. (2007) Brazil (Amazon jungle) 82 Birth 2.4 (3.0) na na 2000–2005 na na
6 mo. 3.8 (5.5)36 mo. 2.6 (3.7)60 mo. 2.6 (3.5)
Dunn et al. (2008) Northeast of USA 534 6–10 yr 0.3e na na 2003 o8.5 naFarias et al. (2008) Brazil (Sao Paulo) 105 4–12 yr 0.4d o0.1 3.3 2005 o50 o50Kim et al. (2008) Korea 112 3 yr 0.6e 0.1 3.5 2005–2006 18 o10Centers for Disease Control and Prevention (2009) USA 911 1–5 yr 0.3e na 1.8h 1999 0 0Barbieri et al. (2009) Bolivia (mining zone) 23 1–5 yr 2.1 1.5 2.9 na 100 na
45 6–15 yr 2.8 2.3 3.3 na 100 475Malm et al. (2010) Brazil (Amazon jungle) 49 na 12.4 1.0 51.0 1999 100 475
41 10.2f 0.5 41.4Puklova et al. (2010) Czech Republic 412 4–6 yr 0.2d o0.1 1.36 1996 o5 0
372 0.2 d o0.1 0.92 1997 0 0359 0.2 d o0.1 0.53 1998 0 0360 0.2 d o0.1 0.6 1999 0 0343 0.3 d o0.1 10.6 2000 o5 o5325 0.2 d o0.1 1.31 2001 o5 0319 0.2 d o0.1 0.93 2002 0 0292 0.1 d o0.1 1.98 2003 o5 0372 0.1 d o0.1 0.74 2006 0 0316 0.2 d o0.1 7.49 2008 o5 o5
Tian et al. (2011) Canada (Inuit) 361 3–5 yr 0.7e o0.1c 5.2b 2007–2008 425 o25Al-Saleh and Al-Sedairi (2011) Saudi Arabia (Taif city) 171 5–15 yr 0.4 (1.1) o0.1 14.3 2007–2008 o50 o50Miyake et al. (2011) Japan (Osaka) 582 29–39 mo. 1.4d 0.1 9.5 2005–2006 450 o50Dutra et al. (2012) Brazil (Amazon jungle) 90 3–4 yr 1.0 (0.8) na 4.1 2004 o50 o50
47 5–6 yr 1.2 (1.3) 8.2 2006 o50 o5090 8–10 yr 1.2 (1.0) 8.3 2010 50 o50
Evrenoglou et al. (2013) Philadelphia, Greece 11 11–12 yr 0.5 (0.2) 0.3 0.8 2011–2012 0 0Kifisia, Greece 21 0.5 (0.6) o0.1 2.4 na na
S.Llopet
al./Environm
entalResearch
132(2014)
83–92
89
significant during the prenatal period than during breastfeeding(Sakamoto et al., 2012), and this exposure depends mainly onmaternal fish consumption. On the other hand, families havereceived information from us about the high prenatal exposureto mercury observed in our previous studies, and this topic hasbeen discussed frequently in the local media. This informationcould have increased the families’ awareness of mercury exposure.We must also take into account that the conversion factor usedcould be imprecise. This factor represents the overall average ratioproposed by WHO from factors determined in other studies usingdifferent populations and with a variety of analytical methods.
Although the estimation of children's fish intake was obtainedby a semi-quantitative FFQ not yet validated, the FFQ showed agood reproducibility for fish intake. This FFQ for children had thesame structure as the FFQ we used for their mothers whilstpregnant, showing good reproducibility and validity (Vioque etal., 2013). Nevertheless some kind of misclassification could haveoccurred due to memory bias because 73% of children had lunch inthe school canteen and some of the mothers did not remembertheir diet with accuracy, but, even if some kind of misclassificationoccurred it would be mostly non-differential, leading to an under-estimation of the association between fish intake and mercury.
Another limitation of our study could be related to the participa-tion rate, since only 74% of the children enrolled at birth participatedin this study. We compared the socio-demographic characteristicsbetween children participating in this study (n¼580) and those whodid not participate (n¼207). We found statistically significantdifferences according to maternal country of birth, age, educationallevel, and social class. The percentage of foreign mothers, youngermothers, less educated and belonging to the lower social class waslower among the study population than in mothers who did notparticipate (data not shown). The loss of follow-up in cohort studiescould represent another bias in estimating some exposure-outcomeassociations; additionally this loss is usually more frequent amongthe less advantaged population (Howe et al., 2013).
A strength of our study is the exhaustiveness in data collectionabout the possible determinants of mercury exposure via ques-tionnaire. This was possible because the study population wasfollowed up from the early stages of pregnancy until the childrenwere age 4. This prospective follow-up will enable us to study thepossible adverse effects of mercury exposure on cognitive devel-opment in the future.
In conclusion, the preschool children participating in this birthcohort study had high hair mercury concentrations compared tochildren from other European countries and similar concentra-tions to children in other countries with high fish consumption.Additionally, a high proportion of these children had mercuryconcentrations above the recommendations from the USA EPA andWHO. Children's exposure to mercury was associated with mater-nal age, parity, maternal employment, cord blood mercury con-centrations and fish intake during the previous year. The fishcategories most related to the mercury concentrations wereswordfish, lean fish and canned fish. We observed a decreasingtrend in mercury concentrations from birth to age four. The INMAstudy design allows the evaluation of exposure to mercury long-itudinally and this enables this information to be used forbiomonitoring purposes and dietary recommendations.
5. Funding
The study protocol was approved by the Ethics Committee ofthe university hospital La Fe (Valencia, Spain) and all studyparticipants were included in the study after being signed theinformed consent form. This study was funded by Grants from UE(FP7-ENV-2011 cod 282957 and HEALTH.2010.2.4.5-1), Instituto deTa
ble
4(con
tinu
ed)
Study
Loca
tion
NAge
Mea
n(st)
Min
Max
Year
ofsampling
%4
EPA
RfD
%4
WHO
RfD
Kryon
eri,Greece
190.4(0.1)
0.1
0.5
00
Derom
aet
al.,(201
3)Italy(fish
eaten)
777yr
0.9(0.7)
0.3
1.3g
2007
25–50
o25
Italy(inland)
720.6(0.5)
0.3
0.7
go
25o
25
EPA
RfD
:1ppm.
WHO
PTW
I:2.5ppm.
na:
Not
available.
mo:
Mon
ths.
yr:Ye
ars.
a95
%Con
fiden
ceintervals.
bPe
rcen
tile
75.
cPe
rcen
tile
10.
dMed
ian.
eGeo
metricmea
n.
fMethy
lmercu
ry.
gInterquatile
range
.hPe
rcen
tile
95.
S. Llop et al. / Environmental Research 132 (2014) 83–9290
Salud Carlos III (Red INMA G03/176, CB06/02/0041, FIS-FEDER 03/1615, 04/1509, 04/1112, 04/1931 , 05/1079, 05/1052, 06/1213, 07/0314, 09/02647, 11/01007, 11/02591, 11/02038, 13/1944 and Pro-grama Miguel Servet: CP11/0178), and the Conselleria de SanitatGeneralitat Valenciana.
Acknowledgments
The authors would particularly like to thank all the participants fortheir generous collaboration. A full roster of the INMA ProjectInvestigators can be found at ⟨http://www.proyectoinma.org/presentacion-inma/listado-investigadores/en_listado-investigadores.html⟩.
Reference
Agencia Española de Seguridad Alimentaria y Nutrición (AESAN), 2011. Recom-mendations for Fish Consumption (Swordfish, Shark, Tuna and Pike) Due to thePresence of Mercury. Available on: ⟨http://www.aesan.msc.es/AESAN/web/rincon_consumidor/seccion/recomendaciones_consumidor.shtml⟩ (accessed 10June 2013).
Akagi, H., Castillo, E.S., Cortes-Maramba, N., Francisco-Rivera, A.T., Timbang, T.D.,2000. Health assessment for mercury exposure among schoolchildren residingnear a gold processing and refining plant in Apokon, Tagum, Davao del Norte,Philippines. Sci. Total Environ. 259, 31–43.
Al-Saleh, I., Al-Sedairi, A.A., 2011. Mercury (Hg) burden in children: the impact ofdental amalgam. Sci. Total Environ. 409, 3003–3015.
Barbieri, F.L, Cournil, A., Gardon, J., 2009. Mercury exposure in a high fish eatingBolivian Amazonian population with intense small-scale gold-mining activities.Int. J. Environ. Health Res 19, 267–277.
Barbosa, A.C., Jardim, W., Dorea, J.G., Fosberg, B., Souza, J., 2001. Hair mercuryspeciation as a function of gender, age, and body mass index in inhabitants ofthe Negro River basin, Amazon, Brazil. Arch. Environ. Contam. Toxicol. 40,439–444.
Batista, J., Schuhmacher, M., Domingo, J.L., Corbella, J., 1996. Mercury in hair for achild population from Tarragona Province, Spain. Sci. Total Environ. 193,143–148.
Bellanger, M., Pichery, C., Aerts, D., Berglund, M., Castano, A., Cejchanova, M.,Crettaz, P., Davidson, F., Esteban, M., Fischer, M.E., Gurzau, A.E., Halzlova, K.,Katsonouri, A., Knudsen, L.E., Kolossa-Gehring, M., Koppen, G., Ligocka, D.,Miklavcic, A., Reis, M.F., Rudnai, P., Tratnik, J.S., Weihe, P., Budtz-Jorgensen, E.,Grandjean, P., 2013. Economic benefits of methylmercury exposure control inEurope: monetary value of neurotoxicity prevention. Environ. Health 12, 3.
Bjornberg, K.A., Vahter, M., Petersson-Grawe, K., Glynn, A., Cnattingius, S., Dar-nerud, P.O., Atuma, S., Aune, M., Becker, W., Berglund, M., 2003. Methyl mercuryand inorganic mercury in Swedish pregnant women and in cord blood:influence of fish consumption. Environ. Health Perspect. 111, 637–641.
Budtz-Jorgensen, E., Grandjean, P., Keiding, N., White, R.F., Weihe, P., 2000. Bench-mark dose calculations of methylmercury-associated neurobehavioural deficits.Toxicol. Lett. 112–113, 193–199.
Centers for Disease Control and Prevention, 2009. CDC's Fourth National Report onHuman Exposure to Environmental Chemicals. Available: ⟨http://www.cdc.gov/exposurereport/pdf/FourthReport.pdf⟩ (accessed 29 April 2013).
Cordier, S., Garel, M., Mandereau, L., Morcel, H., Doineau, P., Gosme-Seguret, S.,Josse, D., White, R., miel-Tison, C., 2002. Neurodevelopmental investigationsamong methylmercury-exposed children in French Guiana. Environ. Res. 89,1–11.
Cossa, D., Harmelin-Vivien, M., Mellon-Duval, C., Loizeau, V., Averty, B., Crochet, S.,Chou, L., Cadiou, J.F., 2012. Influences of bioavailability, trophic position, andgrowth on methylmercury in hakes (Merluccius merluccius) from NorthwesternMediterranean and Northeastern Atlantic. Environ. Sci. Technol. 46, 4885–4893.
Damiano, S., Papetti, P., Menesatti, P., 2011. Accumulation of heavy metals to assessthe health status of swordfish in a comparative analysis of Mediterranean andAtlantic areas. Mar. Pollut. Bull. 62, 1920–1925.
Daniels, J.L., Longnecker, M.P., Rowland, A.S., Golding, J., 2004. Fish intake duringpregnancy and early cognitive development of offspring. Epidemiology 15,394–402.
Davidson, P.W., Leste, A., Benstrong, E., Burns, C.M., Valentin, J., Sloane-Reeves, J.,Huang, L.S., Miller, W.A., Gunzler, D., van, W.E., Watson, G.E., Zareba, G.,Shamlaye, C.F., Myers, G.J., 2010. Fish consumption, mercury exposure, andtheir associations with scholastic achievement in the Seychelles Child Devel-opment Study. Neurotoxicology 31, 439–447.
Davidson, P.W., Myers, G.J., Cox, C., Axtell, C., Shamlaye, C., Sloane-Reeves, J.,Cernichiari, E., Needham, L., Choi, A., Wang, Y., Berlin, M., Clarkson, T.W.,1998. Effects of prenatal and postnatal methylmercury exposure from fishconsumption on neurodevelopment: outcomes at 66 months of age in theSeychelles Child Development Study. JAMA 280, 701–707.
Deroma, L., Parpinel, M., Tognin, V., Channoufi, L., Tratnik, J., Horvat, M., Valent, F.,Barbone, F., 2013. Neuropsychological assessment at school-age and prenatallow-level exposure to mercury through fish consumption in an Italian birthcohort living near a contaminated site. Int. J. Hyg. Environ. Health 216,486–493.
Diez, S., Delgado, S., Aguilera, I., Astray, J., Perez-Gomez, B., Torrent, M., Sunyer, J.,Bayona, J.M., 2009. Prenatal and early childhood exposure to mercury andmethylmercury in Spain, a high-fish-consumer country. Arch. Environ. Contam.Toxicol. 56, 615–622.
Domingo-Salvany, A., Regidor, E., Alonso, J., varez-Dardet, C., 2000. Proposal for asocial class measure. Working Group of the Spanish Society of Epidemiologyand the Spanish Society of Family and Community Medicine. Aten. Primaria 25,350–363.
Dunn, J.E., Trachtenberg, F.L., Barregard, L., Bellinger, D., McKinlay, S., 2008. Scalphair and urine mercury content of children in the Northeast United States: theNew England Children's Amalgam Trial. Environ. Res. 107, 79–88.
Dutra, M.D, Jesus, I.M, Santos, E.C, Lima, M.O, Medeiros, R.L, Cavadas, M., Luiz, R.R,Camara, V.M, 2012. Longitudinal assessment of mercury exposure in school-children in an urban area of the Brazilian Amazon. Cad. Saude Publica 28,1539–1545.
European Food Safety Authority (EFSA)., 2008. Methyl Mercury in Fish and FisheryProducts. Available on: ⟨http://ec.europa.eu/food/food/chemicalsafety/contaminants/information_note_mercury-fish_21-04-2008.pdf⟩ (accessed 7 May 2013).
Evrenoglou, L., Partsinevelou, S.A., Stamatis, P., Lazaris, A., Patsouris, E., Kotampasi,C., Nicolopoulou-Stamati, P., 2013. Children exposure to trace levels of heavymetals at the north zone of Kifissos River. Sci. Total Environ. 443C, 650–661.
Farias, L.A, Santos, N.R, Favaro, D.I, Braga, E.S, 2008. Total hair mercury in childrenfrom a coastal population in Cananeia, Sao Paulo State, Brazil. Cad. SaudePublica 24, 2249–2256.
Freire, C., Ramos, R., Lopez-Espinosa, M.J., Diez, S., Vioque, J., Ballester, F., Fernandez,M.F., 2010. Hair mercury levels, fish consumption, and cognitive developmentin preschool children from Granada, Spain. Environ. Res. 110, 96–104.
Gari, M., Grimalt, J.O, Torrent, M., Sunyer, J., 2013. Influence of socio-demographicand diet determinants on the levels of mercury in preschool children from aMediterranean island. Environ. Pollut 182C, 291–298.
Grandjean, P., Budtz-Jorgensen, E., Jorgensen, P.J., Weihe, P., 2005. Umbilical cordmercury concentration as biomarker of prenatal exposure to methylmercury.Environ. Health Perspect. 113, 905–908.
Grandjean, P., Weihe, P., White, R.F., Debes, F., Araki, S., Yokoyama, K., Murata, K.,Sorensen, N., Dahl, R., Jorgensen, P.J., 1997. Cognitive deficit in 7-year-oldchildren with prenatal exposure to methylmercury. Neurotoxicol. Teratol. 19,417–428.
Guxens, M., Ballester, F., Espada, M., Fernandez, M.F., Grimalt, J.O., Ibarluzea, J., Olea,N., Rebagliato, M., Tardon, A., Torrent, M., Vioque, J., Vrijheid, M., Sunyer, J.,2012. Cohort profile: the INMA – INfancia y Medio Ambiente – (environmentand childhood) project. Int. J. Epidemiol. 41, 930–940.
Harmelin-Vivien, M., Cossa, D., Crochet, S., Banaru, D., Letourneur, Y., Mellon-Duval,C., 2009. Difference of mercury bioaccumulation in red mullets from the north-western Mediterranean and Black seas. Mar. Pollut. Bull 58, 679–685.
Howe, L.D., Tilling, K., Galobardes, B., Lawlor, D.A., 2013. Loss to follow-up in cohortstudies: bias in estimates of socioeconomic inequalities. Epidemiology 24, 1–9.
Institute of Medicine (IOM), 2006. Seafood Choices, Balancing Benefits and Risks.Committee on Nutrient Relationships in Seafood: Selections to Balance Benefitsand Risks. The National Academies Press, Washington, D.C
Karagas, M.R., Choi, A.L., Oken, E., Horvat, M., Schoeny, R., Kamai, E., Cowell, W.,Grandjean, P., Korrick, S., 2012. Evidence on the human health effects of low-level methylmercury exposure. Environ. Health Perspect. 120, 799–806.
Kim, S.A., Jeon, C.K., Paek, D.M., 2008. Hair mercury concentrations of children andmothers in Korea: implication for exposure and evaluation. Sci. Total Environ.402, 36–42.
Llop, S., Guxens, M., Murcia, M., Lertxundi, A., Ramon, R., Riano, I., Rebagliato, M.,Ibarluzea, J., Tardon, A., Sunyer, J., Ballester, F., 2012. Prenatal exposure tomercury and infant neurodevelopment in a multicenter cohort in Spain: studyof potential modifiers. Am. J. Epidemiol. 175, 451–465.
Llop, S., Ibarlucea, J., Sunyer, J., Ballester, F., 2013a. Current dietary exposure tomercury during pregnancy and childhood, and public health recommendations.Gac. Sanit. 27, 273–278.
Llop, S., Lopez-Espinosa, M.J., Rebagliato, M., Ballester, F., 2013b. Gender differencesin the neurotoxicity of metals in children. Toxicology 311, 3–12.
Mahaffey, K.R, Clickner, R.P, Bodurow, C.C, 2004. Blood organic mercury and dietarymercury intake: National Health and Nutrition Examination Survey, 1999 and2000. Environ. Health Perspect 112, 562–570.
Malm, O., Dorea, J.G., Barbosa, A.C., Pinto, F.N., Weihe, P., 2010. Sequential hairmercury in mothers and children from a traditional riverine population of theRio Tapajos, Amazonia: seasonal changes. Environ. Res. 110, 705–709.
Marques, R.C., Dorea, J.G., Bastos, W.R., Malm, O., 2007. Changes in children hair-Hgconcentrations during the first 5 years: maternal, environmental and iatrogenicmodifying factors. Regul. Toxicol. Pharmacol. 49, 17–24.
S. Llop et al. / Environmental Research 132 (2014) 83–92 91
Martorell, I., Perello, G., Marti-Cid, R., Llobet, J.M., Castell, V., Domingo, J.L., 2011.Human exposure to arsenic, cadmium, mercury, and lead from foods inCatalonia, Spain: temporal trend. Biol. Trace Elem. Res. 142, 309–322.
McDowell, M.A., Dillon, C.F., Osterloh, J., Bolger, P.M., Pellizzari, E., Fernando, R.,Montes de, O.R., Schober, S.E., Sinks, T., Jones, R.L., Mahaffey, K.R., 2004. Hairmercury levels in U.S. children and women of childbearing age: reference rangedata from NHANES 1999–2000. Environ. Health Perspect. 112, 1165–1171.
Miklavcic, A., Casetta, A., Snoj, T.J., Mazej, D., Krsnik, M., Mariuz, M., Sofianou, K.,Spiric, Z., Barbone, F., Horvat, M., 2013. Mercury, arsenic and selenium exposurelevels in relation to fish consumption in the Mediterranean area. Environ. Res.120, 7–17.
Miyake, Y., Tanaka, K., Yasutake, A., Sasaki, S., Hirota, Y., 2011. Lack of association ofmercury with risk of wheeze and eczema in Japanese children: the OsakaMaternal and Child Health Study. Environ. Res. 111, 1180–1184.
Mozaffarian, D., Rimm, E.B., 2006. Fish intake, contaminants, and human health:evaluating the risks and the benefits. JAMA 296, 1885–1899.
Murata, K., Sakamoto, M., Nakai, K., Weihe, P., Dakeishi, M., Iwata, T., Liu, X.J., Ohno,T., Kurosawa, T., Kamiya, K., Satoh, H., 2004. Effects of methylmercury onneurodevelopment in Japanese children in relation to the Madeiran study. Int.Arch. Occup. Environ. Health 77, 571–579.
Oken, E., Wright, R.O., Kleinman, K.P., Bellinger, D., Amarasiriwardena, C.J., Hu, H.,Rich-Edwards, J.W., Gillman, M.W., 2005. Maternal fish consumption, hairmercury, and infant cognition in a U.S. Cohort. Environ. Health Perspect. 113,1376–1380.
Parks, J.M., Johs, A., Podar, M., Bridou, R., Hurt Jr., R.A., Smith, S.D., Tomanicek, S.J.,Qian, Y., Brown, S.D., Brandt, C.C., Palumbo, A.V., Smith, J.C., Wall, J.D., Elias, D.A.,Liang, L., 2013. The genetic basis for bacterial mercury methylation. Science339, 1332–1335.
Pesch, A., Wilhelm, M., Rostek, U., Schmitz, N., Weishoff-Houben, M., Ranft, U., Idel,H., 2002. Mercury concentrations in urine, scalp hair, and saliva in childrenfrom Germany. J. Exposure Anal. Environ. Epidemiol. 12, 252–258.
Puklova, V., Krskova, A., Cerna, M., Cejchanova, M., Rehurkova, I., Ruprich, J., Kratzer,K., Kubinova, R., Zimova, M., 2010. The mercury burden of the Czech popula-tion: an integrated approach. Int. J. Hyg. Environ. Health 213, 243–251.
Ramon, R., Murcia, M., Aguinagalde, X., Amurrio, A., Llop, S., Ibarluzea, J., Lertxundi,A., varez-Pedrerol, M., Casas, M., Vioque, J., Sunyer, J., Tardon, A., Martinez-Arguelles, B., Ballester, F., 2011. Prenatal mercury exposure in a multicentercohort study in Spain. Environ. Int. 37, 597–604.
Ramon, R., Murcia, M., Ballester, F., Rebagliato, M., Lacasana, M., Vioque, J., Llop, S.,Amurrio, A., Aguinagalde, X., Marco, A., Leon, G., Ibarluzea, J., Ribas-Fito, N.,2008. Prenatal exposure to mercury in a prospective mother-infant cohortstudy in a Mediterranean area, Valencia, Spain. Sci. Total Environ. 392, 69–78.
Sakamoto, M., Chan, H.M., Domingo, J.L., Kubota, M., Murata, K., 2012. Changes inbody burden of mercury, lead, arsenic, cadmium and selenium in infants duringearly lactation in comparison with placental transfer. Ecotoxicol. Environ. Saf.84, 179–184.
Sakamoto, M., Kaneoka, T., Murata, K., Nakai, K., Satoh, H., Akagi, H., 2007.Correlations between mercury concentrations in umbilical cord tissue and
other biomarkers of fetal exposure to methylmercury in the Japanese popula-tion. Environ. Res. 103, 106–111.
Schoeman, K., Tanaka, T., Bend, J.R., Koren, G., 2010. Hair mercury levels of womenof reproductive age in Ontario, Canada: implications to fetal safety and fishconsumption. J. Pediatr. 157, 127–131.
Steuerwald, U., Weihe, P., Jorgensen, P.J., Bjerve, K., Brock, J., Heinzow, B., Budtz-Jorgensen, E., Grandjean, P., 2000. Maternal seafood diet, methylmercuryexposure, and neonatal neurologic function. J. Pediatr. 136, 599–605.
Tian, W., Egeland, G.M., Sobol, I., Chan, H.M., 2011. Mercury hair concentrations anddietary exposure among Inuit preschool children in Nunavut, Canada. Environ.Int. 37, 42–48.
Torrente, M., Colomina, M.T., Domingo, J.L., 2005. Metal concentrations in hair andcognitive assessment in an adolescent population. Biol. Trace Elem. Res. 104,215–221.
Torres-Escribano, S., Velez, D., Montoro, R., 2010. Mercury and methylmercurybioaccessibility in swordfish. Food Addit. Contam. 27, 327–337.
US Environmental Protection Agency, 2007. Mercury. Human Exposure. Available:⟨http://www.epa.gov/mercury/exposure.htm⟩ (accessed 13 March 2013).
Vioque, J., Navarrete-Munoz, E.M., Gimenez-Monzo, D., Garcia-de-la-Hera, M.,Granado, F., Young, I.S., Ramon, R., Ballester, F., Murcia, M., Rebagliato, M.,Iniguez, C., 2013. Reproducibility and validity of a food frequency questionnaireamong pregnant women in a Mediterranean area. Nutr. J. 12, 26.
Welch, A.A., Lund, E., Amiano, P., Dorronsoro, M., Brustad, M., Kumle, M., Rodriguez,M., Lasheras, C., Janzon, L., Jansson, J., Luben, R., Spencer, E.A., Overvad, K.,Tjonneland, A., Clavel-Chapelon, F., Linseisen, J., Klipstein-Grobusch, K., Bene-tou, V., Zavitsanos, X., Tumino, R., Galasso, R., Bueno-De-Mesquita, H.B., Ocke,M.C., Charrondiere, U.R., Slimani, N., 2002. Variability of fish consumptionwithin the 10 European countries participating in the European Investigationinto Cancer and Nutrition (EPIC) study. Public Health Nutr. 5, 1273–1285.
Willett, W.C., Sampson, L., Stampfer, M.J., Rosner, B., Bain, C., Witschi, J., Hennekens,C.H., Speizer, F.E., 1985. Reproducibility and validity of a semiquantitative foodfrequency questionnaire. Am. J. Epidemiol. 122, 51–65.
World Health Organization (WHO), 2007. Exposure to Mercury: A Major PublicHealth Concern. http://www.who.int/phe/news/Mercury-flyer.pdf.
World Health Organization (WHO), 2010. Children's Exposure to Mercury Com-pounds. ⟨http://www.who.int/phe/news/Mercury-flyer.pdf⟩.
Yusà, V., Sielves, T., Ruiz-Atienza, L., Cervera, M.L., Benedito, V., Pastor, A., 2008.Monitoring programme on cadmium, lead and mercury in fish and seafoodfrom Valencia, Spain: levels and estimated weekly intake. Food Addit. andContam. 1, 22–31.
World Health Organization (WHO), 2004. Evaluation of Certain Food Additives andContaminants. Sixty-first of the Joint FAO/WHO Experte Committee on FoodAdditives. ⟨http://www.who.int/phe/news/Mercury-flyer.pdf⟩.
S. Llop et al. / Environmental Research 132 (2014) 83–9292