47


STUDIES TO EVALUATE THE EFFECTIVENESS OF EXTENDED-LENGTH SCREENS AT LITTLE GOOSE DAM, 1993
by
Michael H. Gessel Benjamin P. Sandford
and Douglas B. Dey
Annual Report of Research
Funded by
u.S. Army Corps of Engineers Walla Walla District
Delivery Order E86920164
and
Coastal Zone and Estuarine Studies Division Northwest Fisheries Science Center National Marine Fisheries service
National Oceanic and Atmospheric Administration 2725 Montlake Boulevard East
Seattle, Washington 98112-2097
September 1994


CONTENTS
INTRODUCTION
OBJECTIVE 1: FISH GUIDANCE EFFICIENCY OF THE EXTENDEDLENGTH TRAVELING SCREEN AND EXTENDED-LENGTH BAR SCREEN . . .
Approach
Results and Discussion
Dipbasket Efficiency
Fish Guidance Efficiency
OBJECTIVE 2: JUVENILE SALMONID DESCALING .
Approach
Results and Discussion
CONCLUSIONS . .
ACKNOWLEDGMENTS . .
REFERENCES
APPENDIX
Page
1
4
4
9
9
9
10
10
12
14
16
17
19


INTRODUCTION
At Little Goose and Lower Granite Dams on the Snake River,
juvenile salmonids (Oncorhynchus spp.) are guided into the
collection/bypass facilities by standard-length submersible
traveling screens (STSs) installed in the 1970s. From 1982 to
1985, National Marine Fisheries Service (NMFS) researchers
extensively evaluated the STSs at Lower Granite Dam and found
that fish guidance efficiency (FGE) was approximately 50% for
yearling chinook salmon (0. tshawytscha).
In 1987, in an effort to improve guidance levels, NMFS
conducted research at Lower Granite Dam to test a simulated
extended-length screen. This was done by placing a fixed bar
screen (FBS) in the fish screen slot in conjunction with an STS
in the bulkhead slot. The STS is about 6.1 m (20 ft) long, and
the addition of the FBS approximately doubled the length of the
guiding surface. Results of these tests indicated that the
STS/FBS combination could improve guidance.
Research at Lower Granite Dam in 1989 was done with an
entire turbine intake screened with the STS/FBS combination and
18.8-m (62-ft) raised operating gates. Significant increases in
FGE for both yearling chinook salmon and steelhead (0. rnykiss)
were realized (weighted FGEs of 66 and 83%, respectively,
compared to 57 and 77% with the STS and raised operating gate) .
The descaling rate for fish recovered from gatewells without an
STS was 3% or less. Descaling rates for guided yearling chinook
salmon during FGE tests were 2.5 and 4.7% for control and
treatment conditions, respectively.

2
Studies at Little Goose Dam were conducted in 1986 and 1987.
They provided baseline FGE data on yearling chinook salmon and
steelhead with STSs at either standard elevation or in a lowered
position, and operating gates in either the standard or raised
position. Vertical distribution measurements were taken of fish
entering the turbine intake to determine theoretical fish
guidance efficiency (TFGE, defined as an estimate of the
percentage of fish theoretically guidable based upon a measured
vertical distribution of fish passing into the turbine intakes
and flow distributions within the intake with an STS in place as
determined from hydraulic model studies). Also, the effect of
traveling screens on fish condition was assessed by comparing
descaling levels of fish collected in the gatewell during FGE
tests with those collected during vertical distribution
measurements. Based upon the vertical distribution measurements,
estimates of TFGE at Little Goose Dam were greater than 80% for
both yearling chinook salmon and steelhead.
Guidance at Little Goose Dam for yearling chinook salmon and
steelhead was in the 60-70% range and improved with the raised
operating gate. Also, there was a general increase in FGE as the
outmigration progressed. This trend may have been related to the
increased smoltification level of fish passing the project during
the later stages of the outmigration (Muir et al. 1988).
The respective seasonal descaling averages for yearling
chinook salmon and steelhead were 2.1 and 0.7% in 1986 and 3.7
and 0.9% in 1987.

3
During spring and summer of 1991, NMFS tested an extended
length submersible traveling screen and an extended-length
submersible bar screen at McNary Dam on the lower Columbia River.
Each of these extended-length screens, which are approximately
twice as long as an STS, increased FGE to about 80% for yearling
chinook salmon and to well over 50% for subyearling chinook
salmon, with no significant difference in FGE between devices
(Brege et al. 1992). However, lower descaling of guided fish was
observed with the extended-length bar screen.
Additional testing was done with the extended-length bar
screen at McNary Dam during the 1992 outmigration, with similar
FGE results (McComas et al. 1993). These studies led to the
development and prototype testing of extended-length bar screens
and extended-length traveling screens with various perforated
plate porosities at Little Goose Dam in 1993. This report covers
the first year of the evaluation of these devices.
Specific research objectives for 1993 were:
1) Evaluate the ability of extended-length traveling screens
and extended-length bar screens to guide fish during the
juvenile salmonid outmigration.
2) Determine the effect of extended-length screens on descaling
of juvenile salmonids.

4
OBJECTIVE 1: FISH GUIDANCE EFFICIENCY OF THE EXTENDED-LENGTH TRAVELING SCREEN AND EXTENDED-LENGTH BAR SCREEN
Approach
Fish guidance efficiency tests at McNary Dam in 1992
indicated that an extended-length bar screen with a 35%
perforated plate porosity was the optimum configuration for fish
condition (descaling) and guidance. Average water flow within
McNary Dam turbine intakes is substantially less than at Little
Goose Dam (about 15,000 vs. 18,000 cfs). The higher volume flow
is produced by higher water velocity within the turbine intakes.
To compensate for the higher velocity at Little Goose Dam, it was
necessary to reduce the overall porosity of the screens by
altering the perforated plate porosity.
To determine which porosity was most effective, three
different perforated plate porosities were tested with both the
extended-length traveling screen and extended-length bar screen:
22, 25, and 28%. Prior to FGE testing, we monitored descaling
for each of the extended-length screens at the different
porosities; this was done in Slots 4A, 4B, 4C, SA, 5B, and 5C.
Once we had determined that none of the porosities caused
unacceptably high descaling, we selected the initial test
porosity for each screen and began the FGE tests.
Methods for determining FGE at Little Goose Dam were similar
to those used in previous STS studies at McNary Dam (Brege et al.
1992; McComas et al. 1993). Extended-length screens (Fig. 1)
were tested in Slots 4B and 5B, and an STS was used in Slot 3B as
a control. Extended-length screens were also placed in Slots 4A,

1
2
3
4
5
7
8
5
Little Goose Dam cross section I 1993 Fyke-net layout
North Middle SouthRow
Gatewell (bulkhead slot)
Juvenile fish bypass flume
Operating gate (raised position)
Gate slot
Vertical barrier screen
Extended-length "')
~ screen .
Figure 1.--Cross section of turbine intake with extended-length screen and fyke nets at Little Goose Dam.

6
4C, 5A, and 5C to maintain uniform flows within each test unit.
Placement of test screens during FGE testing was as follows:
Perforated Turbine
unit and slot Screen
t.Yl2.§ plate
porosity l!.l
3B Standard-length STS 48
4A Extended-length bar screen 22 4B Extended-length bar screen 25 4C Extended-length bar screen 28
5A Extended-length STS 22 5B Extended-length STS 25 5C Extended-length STS 28
The support structure for the extended-length screens
extends to the floor of the turbine intake; therefore, it was
necessary to place the fyke-net frame for collecting unguided
fish in the downstream or operating gate slot (Fig. 1). A full
complement of nets (three columns of eight rows) with cod ends
was used in the two extended-length screen test slots. An
analysis of fyke-net catch by net column with extended-length
screens at McNary Dam is included in McComas et al. 1994.
The fyke-net frame used with the STS also had a full
complement of nets, but to limit the number of mortalities, only
the center column of nets had cod ends. Previous statistical
analyses of a similar standard-length screen configuration
indicated that mUltiplying the center-column catch by 3 would
provide a reasonable approximation of the total fyke-net catch
(Gessel et al. 1986).
All the extended-length screen slots in Turbine Units 4 and
5, as well as Slot 3B (control), contained modified balanced flow
vertical barrier screens that separated the gatewell (bulkhead

7
slot) from the operating gate slot and confined guided fish to
the gatewell (Fig. 1). A solid plate (1.3-m wide) was added to
the bottom panel of the vertical barrier screens to distribute
flow entering the gatewell.
All screens were operated at the standard elevation; screen
angle was 55 0 throughout the tests. Operating gates were either
fully raised or removed (Fig. 1). Water flows into test turbine
units were maintained at approximately 19,500 cfs l for FGE
tests. This corresponded to a screen-approach velocity of around
2.5 fps with turbine power loads of about 135 MW.
Gatewell dipbasket catches provided the number of guided
fish while the fyke-net catch gave the number of unguided fish.
Fish guidance efficiency for each species was calculated as the
gatewell catch divided by the total number of fish (by species)
entering the turbine intake.
GWFGE = x 100%(GW + FN)
GW = gatewell catch
FN = fyke-net catch
Tests began at about 2000 h and generally lasted from 1 to
3 hours. At the end of each test, the turbine unit was shut
down, the fyke-net frame was raised, and the catch was removed
from each net and placed in a separate container. Both guided
1 To approximate the flow conditions near the guiding device under normal operating conditions (no net frame in place), it was necessary to increase the flow into the turbine unit during FGE testing. This compensated for the flow reduction caused by the fyke-net frame and the full complement of fyke nets.

8
and unguided fish were counted by species and the gatewell catch
was examined for descaling.
Mean FGE differences between the extended-length bar screen
in Slot 4B and the extended-length traveling screen in Slot 5B
were examined using analysis of variance (ANOVA) with Fisher's
Protected Least Significant Difference (FPLSD) used for mUltiple
comparisons of significant F-tests (Petersen 1985). Blocking by
day for statistical analysis was not possible because on some
days the tests were only conducted in one unit or fish numbers
were too low in one or both test units. Analyses were done for
yearling chinook salmon (16 and 13 replicate test days for the
extended-length bar screen and extended-length traveling screen,
respectively) and steelhead (18 and 15 test days). Guidance
estimates were not used where total sample size was less than
30 fish.
All fish were monitored for PIT-tags. Additionally, all
yearling chinook salmon and steelhead were examined for brands,
fin clips, or distinguishing marks that would indicate whether
they were wild or of hatchery origin.
Dipbasket efficiency was estimated by recovering marked
yearling chinook salmon from a gatewell during the FGE tests.
Standard procedure was to release a known number of marked fish
into the test gatewell after the unit had reached normal test
loading (135 MW). The test gatewell was dipped 30-60 minutes
later and dipbasket efficiency was estimated by the percentage of
marked, released fish that were recovered.
9
Results and Discussion
Dipbasket Efficiency
Five gatewell releases of yearling chinook salmon were made
to estimate dipbasket efficiency. A total of 124 out of 139
smolts were recaptured (89.2%). Fourteen of the missing fish
were lost during two of the tests. The remaining tests showed a
99% collection efficiency.
Fish Guidance Efficiency
Constraints resulting from the listing of Snake River
sockeye salmon (0. nerka) and Snake River wild spring/summer
chinook salmon under the Endangered Species Act influenced the
FGE evaluation since we were limited by the number of these fish
we could handle. Because of the unusually high ratios of wild to
hatchery yearling chinook salmon (Appendix Table 1), high river
flows, and a delay in the outmigration of approximately 2 weeks,
we were able to conduct only a portion of the desired number of
FGE tests. It was also necessary to adjust downward the minimum
number of fish acceptable for statistical analysis from
approximately 200 per replicate to 30 per replicate. Estimates
of FGE can be assumed to be binomially distributed. A sample
size of 30 ensures that the data are approximately normally
distributed, which satisfies one assumption in the use of
analysis of variance procedures.
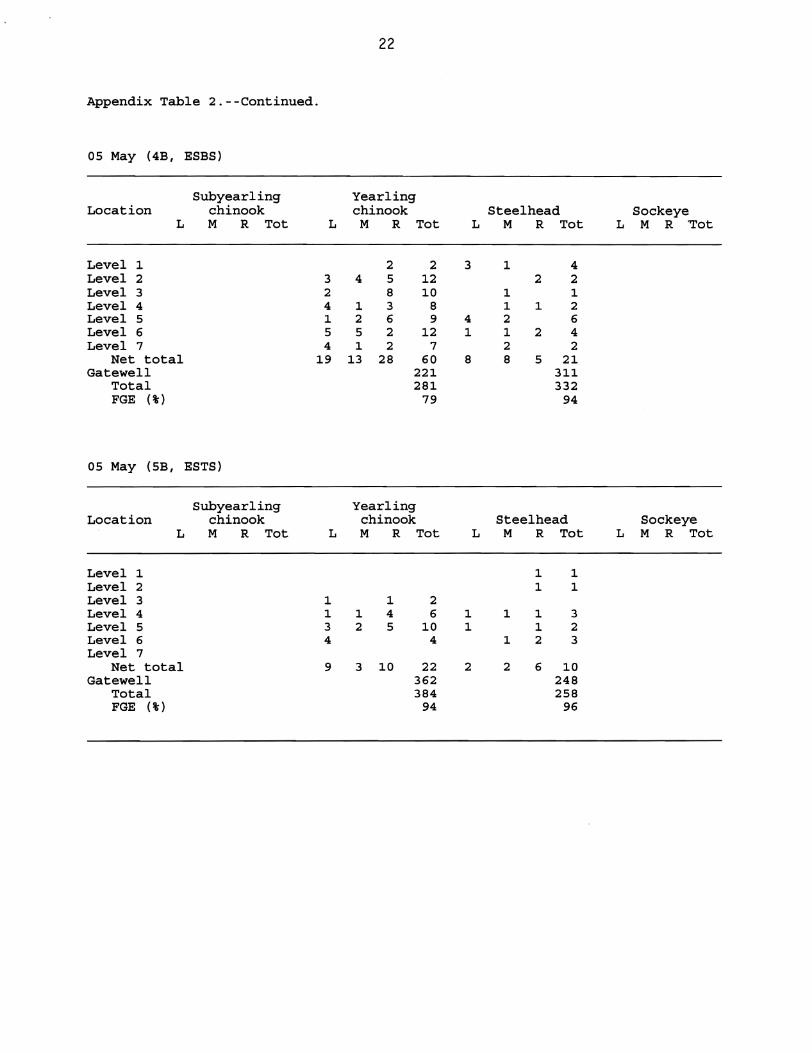
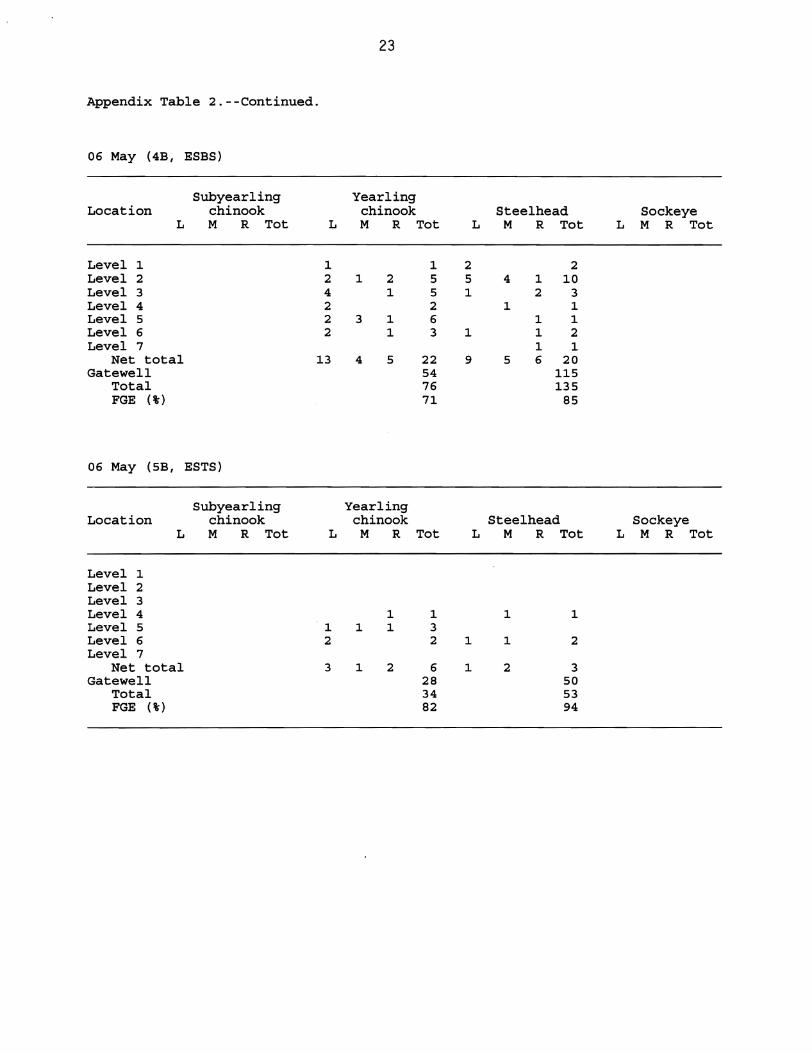
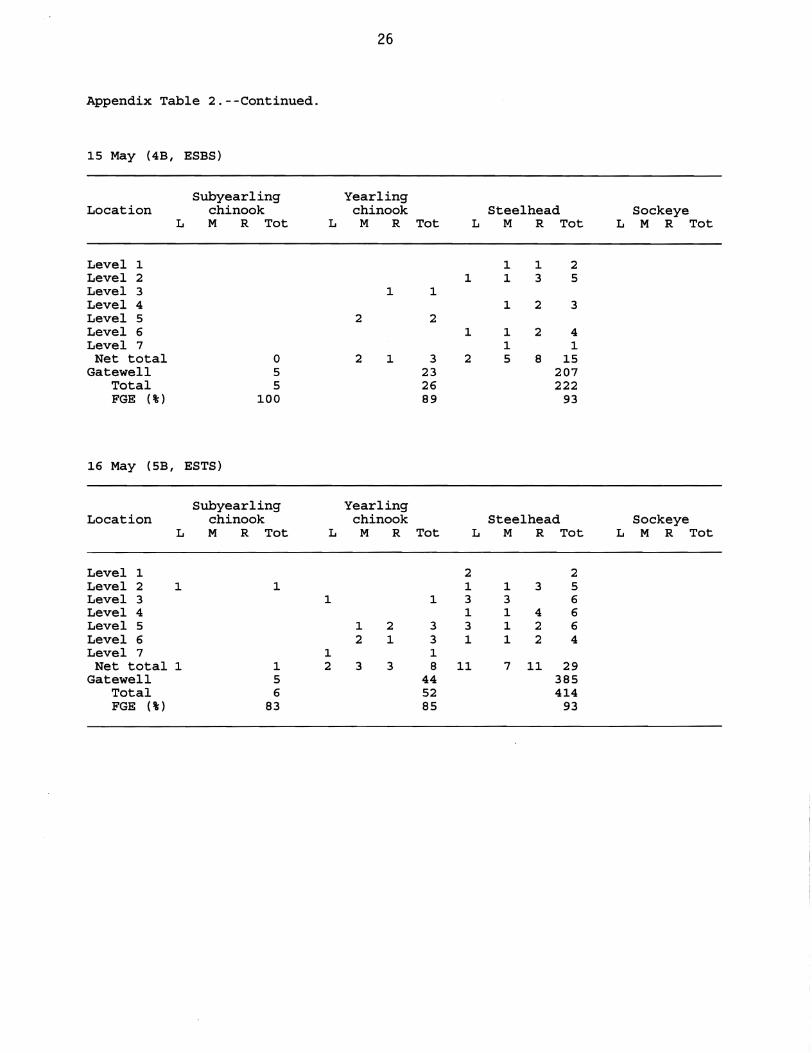
Daily fish collections for FGE tests are listed in Appendix
Table 2. Overall mean FGE for the extended-length bar screen (84
and 92% for yearling chinook salmon and steelhead, respectively)
was not significantly different from mean FGE for the extended

10
length traveling screen (86 and 87%). Daily guidance estimates
showed no apparent trend over time for either extended-length
screen or species. Figure 2 shows FGE results for both yearling
chinook salmon and steelhead for the three screen types on days
when sufficient numbers of fish were captured in each test slot
for statistical analysis. Guidance tests in the control slot
(3B) with the STS were only conducted on three days (22-24 May);
FGE averaged 74 and 95% for yearling chinook salmon and
steelhead, respectively.
A total of 183 PIT-tagged yearling chinook salmon were
identified during FGE tests. Of these, 16 were killed in the
fyke nets and 167 were collected from gatewells and returned to
the juvenile salmonid bypass system.
OBJECTIVE 2: JUVENILE SALMONID DESCALING
Approach
The external condition of all juvenile salmonids collected
in the gatewells was evaluated using standard Fish Transportation
Oversight Team descaling criteria (Ceballos et al. 1992).
Mean descaling differences among the 25% porosity extended
length bar screen in Slot 4B, the 25% extended-length traveling
screen in Slot 5B, the STS in Slot 3B, and the 22% extended
length bar screen in Slot 4A were examined using ANOVA.
Descaling estimates were not included in analyses if the sample
size was less than 25 fish. Analyses were done for yearling
chinook salmon with 21, 20, 16, and 8 test days, respectively,
for the four screen conditions. Steelhead descaling estimates

11
Yearling Chinook Salmon
FGE (%) 100·1~-----
;
80 ~
I.ESBS [JesTS OmJ, l> I
60
40
20
f- -I
f-
o 5 6 7 12 17 22 23 May
24 26 29 30 31
Steelhead
100 FGE (%) [.ESBS ~ESTS DSTS l
80 t:::
I:::! P. ~
I-
60 I-
40
20
J o 5 6 712 17 22 23 24 25 26 28 29 30
May
Figure 2.--Fish guidance efficiency (FGE) for yearling chinook salmon and steel head at Little Goose Dam, 1993 (ESBS = extended-length bar screen, ESTS = extendedlength traveling screen, STS = standard-lengthtraveling screen).

12
for all screens increased noticeably after 12 May and again after
22 May, so data in these time periods were analyzed separately.
Analyses for early season data (19 April-12 May) were done with
8, 8, 6, and 2 test days for the extended-length bar screen,
extended-length traveling screen, STS, and the Slot 4A extended
length bar screen, respectively. Analyses for the middle season
data (15 May-22 May) were done with 5, 3, and 6 test days (no
Slot 4A extended-length bar screen). Analyses for late season
data (23 May-3 June) were done with 9, 6, 11, and 7 test days.
Results and Discussion
Table 1 summarizes the results of the initial descaling
tests conducted for three days prior to FGE testing. This
monitoring was done to make sure test conditions and prototype
equipment would not cause an inordinate amount of descaling or
injury to juvenile salmonids. Constraints of available test days
and low numbers of fish limited us to only a cursory examination
of descaling. However, the information collected reaffirmed our
selection of the 25% porosity extended-length screens for Slots
4B and 5B in the initial FGE test series. Because of concern
about descaling problems occurring as the outmigration proceeded,
the highest porosity screens (28%) were placed in Slots 4C and 5C
(i.e., slots with lowest discharge).
Daily descaling data collected during FGE tests are provided
in Appendix Table 3. Mean descaling for the extended-length
traveling screen in Slot 5B (12%) was significantly higher than
for the extended-length bar screen in Slot 4B and STS in Slot 3B
(9 and 7%, respectively) for yearling chinook salmon. It was not

Table 1.--Descaling of yearling chinook salmon and steelhead during the initial testing of different porosity (%) extended-length screens at Little Goose Dam, 19-21 April 1993.
Yearling chinook salmon
Slot 3B Slot 4A Slot 4B Slot 4C Slot SA Slot 5B Slot ·5C 48% STS 25% ESTS 22% ESBS 22% ESTS 25% ESBS 28% ESBS 28% ESTS
Fish Desc% Fish Desc% Fish Desc% Fish Desc% Fish Desc% Fish Desc% Fish Desc%
9 11.1 61 11.5 80 15.0 53 9.4 55 21.8 58 13.8 19 10.5 24 4.6 85 10.6 106 2.8 45 8.9 82 14.6 88 9.1 23 13.0
6 0.0 53 9.4 40 15.0
Overall 39 5.1 146 11. 0 239 8.4 98 9.2 137 17.5 186 11. 8 42 11. 9
Steelhead w
Slot 3B Slot 4A Slot 4B Slot 4C Slot SA Slot 5B Slot 5C 48% STS 25% ESTS 22% ESBS 22% ESTS 25% ESBS 28% ESBS 28% ESTS
Fish Desc% Fish Desc% Fish Desc% Fish Desc% Fish Desc% Fish Desc% Fish Desc%
42 2.3 83 6.0 79 3.8 40 2.5 68 5.9 57 5.3 15 0.0 68 4.4 94 6.4 137 1.5 41 7.3 77 14.3 70 11.4 21 4.8 26 0.0 92 5.4 59 5.1
Overall 136 2.9 177 6.2 308 3.2 81 4.9 145 10.3 186 7.5 36 2.8

14
significantly higher than the 10% descaling for the extended
length bar screen in Slot 4A (22% porosity). There were no
significant differences in mean descaling between extended-length
bar screens in Slots 4A and 4B and the STS. Daily descaling
estimates showed no apparent trends over time for any screen.
There were no significant differences among screens in mean
descaling for steelhead. Overall season descaling averaged 16,
15, 17, and 20% for the extended-length bar screen, extended
length traveling screen, STS, and the extended-length bar screen
in Slot 4A (mostly tested after 24 May), respectively. These
descaling rates were higher than expected and we do not have a
definitive explanation. It is noteworthy, however, that
descaling for steelhead (under the various guidance conditions
test.ed) averaged between 4 and 6% before 13 May, between 11 and
17% from 15 May to 22 May, and between 23 and 29% after 23 May.
High river flows and spill at Snake River dams, as well as the
influx of hatchery steelhead all occurred around 12 May, shortly
before the increase in steelhead descaling.
CONCLUSIONS
1) Fish guidance efficiency of the extended-length
traveling screen and the extended-length bar screen was
high for both yearling chinook salmon and steelhead
(nearly 85 and 90%, respectively) and was not
significantly different between the two types of
extended-length screens.

15
2) Mean descaling for yearling chinook salmon and was
significantly higher with the extended-length traveling
screen (12%) than with the extended-length bar screen
(9%) or STS (7%). There was no significant difference
in mean descaling between the extended-length bar
screen and the STS.
3) Descaling for steelhead was about 5% prior to mid-May,
15% in late May, and 25% by early June, but was not
significantly different for any screen type.

16
ACKNOWLEDGMENTS
We would like to express our appreciation to the Corps of
Engineers personnel at Little Goose Dam for their assistance and
cooperation in this study. The fish screen maintenance crew,
supervised by Ken Weeks, and the Control Room Operators were
particularly supportive.

17
REFERENCES
Brege, D. A., S. J. Grabowski, W. D. Muir, S. R. Hirtzel, S. J. Mazur, and B. P. Sandford. 1992. Studies to determine the effectiveness of extended traveling screens and extended bar screens at McNary Dam, 1991. Report to U.S. Army Corps of Engineers, Delivery Order E86910060, 50 p. plus Appendixes. (Available from Northwest Fisheries Science Center, 2725 Montlake Blvd. E., Seattle, WA 98112-2097.)
Ceballos, J. R., S. W. Pettit, and J. L. McKern. 1992. Fish Transportation oversight Team. Annual Report - FY 1991. Transportation operations on the Snake and Columbia Rivers. NOAA Technical Memorandum NMFS F/NWR-29, 77 p. plus Appendix. (Available from Environmental and Technical Services Division, 911 N.E. 11th Avenue, Suite 620, Portland, OR 97232.)
Gessel, M. H., L. G. Gilbreath, W. D. Muir, and R. F. Krcma. 1986. Evaluation of the juvenile collection and bypass systems at Bonneville Dam - 1985. Report to U.S. Army Corps of Engineers, Contract DACW57-85H-0001, 63 p. plus Appendixes. (Available from Northwest Fisheries Science Center, 2725 Montlake Blvd. E., Seattle, WA 98112-2097.)
McComas, R. L., D. A. Brege, W. D. Muir, B. P. Sandford, and D. B. Dey. 1993. Studies to determine the effectiveness of extended-length submersible bar screens at McNary Dam, 1992. Report to U.S. Army Corps of Engineers, Delivery Order E86910060, 34 p. plus Appendixes. (Available from Northwest Fisheries Science Center, 2725 Montlake Blvd. E., Seattle, WA 98112-2097.)
McComas, R. L., B. P. Sandford, and D. B. Dey. 1994. Studies to evaluate the effectiveness of extended-length screens at McNary Dam, 1993. Report to U.S. Army Corps of Engineers, Delivery Order E86910060, 103 p. (Available from Northwest Fisheries Science Center, 2725 Montlake Blvd. E., Seattle, WA 98112-2097.)
Muir, W. D., A. E. Giorgi, W. A. Zaugg, W. W. Dickhoff, and B. R. Beckman. 1988. Behavior and physiology studies in relation to yearling chinook salmon guidance at Lower Granite and Little Goose Dams, 1987. Report to U.S. Army Corps of Engineers, Contract DACW68-84-H-0034, 47 p. plus Appendixes. (Available from Northwest Fisheries Science Center, 2725 Montlake Blvd. E., Seattle, WA 98112-2097.)
Petersen, R. G. 1985. Design and Analysis of Experiments. Marcel Dekker, New York. 429 p.


19
Appendix Table 1.--Hatchery and wild yearling chinook salmon and steelhead collected during descaling and fish guidance efficiency tests at Little Goose Dam, 1993.
Yearling chinook Steelhead
Percent Percent Date Hatchery Wilda Total wild Hatchery Wild Total wild
19 April 290 47 337 13.9 88 322 410 78.5 20 April 381 75 456 16.4 177 331 508 65.2 21 April 90 9 99 9.1 111 66 177 37.3 28 April 104 76 180 42.2 175 25 200 12.5
4 May 399 64 463 13.8 151 25 176 14.2 5 May 751 102 853 12.0 457 146 603 24.2 6 May 195 27 222 12.2 162 72 234 30.8 7 May 171 30 201 14.9 408 157 565 27.8
12 May 663 81 744 10.9 555 111 666 16.7 15 May 57 17 74 23.0 332 69 401 17.2 16 May 66 22 88 25.0 466 66 532 12.4 17 May 129 82 211 38.9 651 68 719 9.5 18 May 246 94 340 27.6 272 37 309 12.0 19 May 131 53 184 28.8 167 38 205 18.5 21 May 34 18 52 34.6 101 11 112 9.8 22 May 117 33 150 22.0 293 30 323 9.3 23 May 266 108 374 28.9 183 29 212 13.7 24 May 394 226 620 36.5 562 56 618 9.1 25 May 69 19 88 21.6 215 32 247 13.0 26 May 342 103 445 23.1 308 45 353 12.7 27 May 86 20 106 18.9 145 18 163 11. 0 28 May 103 14 117 12.0 273 34 307 11.1 29 May 276 93 369 25.2 314 38 352 10.8 30 May 171 69 240 28.8 276 31 307 10.1 31 May 292 69 361 19.1 155 18 173 10.4
2 June 113 58 171 33.9 60 12 72 16.7 3 June 173 41 214 19.2 114 20 134 14.9
aprior to May 4, the estimated number of wild yearling chinook salmon was based on the assumption that all hatchery fish had their adipose fin clipped; after this date, the estimated number of wild yearling chinook salmon was based on the assumption that all hatchery fish had either the adipose fin clipped or a ventral fin clipped.


21
Appendix Table 2.--Numbers of fish caught in individual replicates of fish guidance efficiency tests at Little Goose Dam, 1993.
28 April (5B, ESTS)a
Subyearling Yearling Location chinookb chinook Steelhead Sockeye
L M R TotC L M R Tot L M R Tot L M R Tot
Level 1 Level 2 3 3 1 1 Level 3 1 1 1 3 1 5 Level 4 1 2 4 7 3 3 8 14 Level 5 4 4 3 11 2 1 3 Level 6 2 1 3 6 2 2 4 Level 7 1 1
Net total 7 10 11 28 6 10 12 28 Gatewell 152 172
Total 180 200 FGE (%) 84 86
04 May (4B, ESBS)
Subyearling Yearling Location chinook chinook Steelhead Sockeye
L M R Tot L M R Tot L M R Tot L M R Tot
Level 1 4 4 2 2 Level 2 2 6 8 1 1 Level 3 1 2 4 7 2 2 Level 4 3 7 6 16 1 1 4 6 Level 5 4 5 6 15 1 2 3 Level 6 5 5 5 15 1 1 2 Level 7 1 1
Net total 15 24 27 66 1 6 9 16 Gatewell 302 132
Total 368 148 FGE (% ) 82 89
aTest date (Test slot, guidance device type: ESTS = extended-length traveling screen, ESBS = extended-length bar screen, STS = standard-length submersible traveling screen) .
bAge 0+ fish, <30 mm in length. cRefers to fyke-net column: L = left, M = middle, R = right, Tot = total catch for net level.
22
Appendix Table 2.--Continued.
05 May (4B, ESBS)
Location Subyearling
chinook L M R Tot L
Level 1 Level 2 Level 3 Level 4 Level 5 Level 6 Level 7
Net total Gatewell
Total FGE (%)
3 2 4 1 5 4
19
05 May (5B, ESTS)
Location Subyearling
chinook L M R Tot L
Level 1 Level 2 Level 3 Level 4 Level 5 Level 6 Level 7
Net total Gatewell
Total FGE (%)
1 1 3 4
9
Yearling chinook
M R Tot
2 2 4 5 12
8 10 1 3 8 2 6 9 5 2 12 1 2 7
13 28 60 221 281
79
Steelhead L M R Tot
3 1 4 2 2
1 1 1 1 2
4 2 6 1 1 2 4
2 2 8 8 5 21
311 332
94
Sockeye L M R 'Tot
Yearling chinook M R Tot
1 2 1 4 6 2 5 10
4
3 10 22 362 384
94
L
1 1
2
Steelhead M R Tot
1 1 1 1
1 1 3 1 2
1 2 3
2 6 10 248 258
96
L Sockeye M R Tot
23
Appendix Table 2.--Continued.
06 May (4B, ESBS)
Location Subyearling
chinook L M R Tot L
Yearling chinook M R Tot L
Steelhead M R Tot L
Sockeye M R Tot
Level 1 Level 2 Level 3 Level 4 Level 5 Level 6 Level 7
Net total Gatewell
Total FGE (if;)
1 2 4 2 2 2
13
1
3
4
2 1
1 1
5
1 5 5 2 6 3
22 54 76 71
2 5 1
1
9
4
1
5
1 2
1 1 1 6
2 10
3 1 1 2 1
20 115 135
85
06 May (5B, ESTS)
Location Subyearling
chinook L M R Tot
Yearling chinook
L M R Tot Steelhead
L M R Tot Sockeye
L M R Tot
Level 1 Level 2 Level 3 Level 4 Level 5 Level 6 Level 7
Net total Gatewell
Total FGE (if;)
1 2
3
1
1
1 1
2
1 3 2
6 28 34 82
1
1
1
1
2
1
2
3 50 53 94

24
Appendix Table 2.--Continued.
07 May (4B, ESBS)
Subyearling Yearling Location chinook chinook Steelhead Sockeye
L M R Tot L M R Tot L M R Tot L M R Tot
Level 1 1 1 Level 2 1 2 1 4 3 6 6 15 Level 3 3 3 6 5 4 9 18 Level 4 1 2 3 6 6 2 8 Level 5 1 4 1 6 5 7 4 16 Level 6 2 3 4 9 4 9 2 15 Level 7 2 2 3 3
Net total 8 16 9 33 18 35 23 76 Gatewell 69 252
Total 102 328 FGE (%) 68 77
07 May (5B, ESTS)
Subyearling Yearling Location chinook chinook Steelhead Sockeye
L M R Tot L M R Tot L M R Tot L M R Tot
Level 1 Level 2 2 1 1 4 Level 3 1 2 7 10 Level 4 4 5 3 12 Level 5 1 2 3 4 5 9 Level 6 2 3 5 Level 7
Net total 1 2 3 9 12 19 40 Gatewell 11 127
Total 14 167 FGE (%) 79 76

25
Appendix Table 2.--Continued.
12 May (4B, ESBS)
Subyearling Yearling Location chinook chinook Steelhead Sockeye
L M R Tot L M R Tot L M R Tot L M R Tot
Level 1 3 1 4 2 2 Level 2 1 1 1 2 9 12 1 2 1 4 Level 3 1 1 3 1 3 7 3 1 5 9 Level 4 2 3 5 10 4 4 4 12 Level 5 1 1 2 2 7 11 1 4 3 8 Level 6 6 6 12 3 3 Level 7 2 2
Net total 2 1 3 11 15 32 58 11 14 13 38 Gatewell 0 378 363
Total 3 436 401 FGE (%) 0 87 91
12 May (5B, ESTS)
Subyearling Yearling Location chinook chinook Steelhead Sockeye
L M R Tot L M R Tot L M R Tot L M R Tot
Level 1 Level 2 2 2 Level 3 1 1 2 2 2 3 7 Level 4 1 2 3 1 1 1 3 Level 5 1 1 2 2 Level 6 2 2 2 2 2 6 Level 7
Net total 2 3 3 8 7 5 8 20 Gatewell 166 228
Total 174 248 FGE (% ) 95 92
26
Appendix Table 2.--Continued.
15 May (4B, ESBS)
Location L
Subyearling chinook M R Tot L
Yearling chinook
M R Tot L Steelhead
M R Tot L Sockeye
M R Tot
Level 1 Level 2 Level 3 Level 4 Level 5 Level 6 Level 7 Net total
Gatewell Total FGE (%)
0 5 5
100
2
2
1
1
1
2
3 23 26 89
1
1
2
1 1
1
1 1 5
1 3
2
2
8
2 5
3
4 1
15 207 222
93
16 May (5B, ESTS)
Location L
Subyearling chinook M R Tot L
Yearling chinook
M R Tot L Steelhead
M R Tot L Sockeye
M R Tot
Level 1 Level 2 1 Level 3 Level 4 Level 5 Level 6 Level 7
Net total 1 Gatewell
Total FGE (%)
1
1 5 6
83
1
1 2
1 2
3
2 1
3
1
3 3 1 8
44 52 85
2 1 3 1 3 1
11
1 3 1 1 1
7
3
4 2 2
11
2 5 6 6 6 4
29 385 414
93

27
Appendix Table 2.--Continued.
17 May (4B, ESBS)
Subyearling Yearling Location chinook chinook Steelhead Sockeye
L M R Tot L M R Tot L M R Tot L M R Tot
Level 1 1 1 Level 2 2 2 3 2 5 Level 3 2 2 2 2 2 3 1 6 Level 4 1 2 1 4 Level 5 1 1 2 1 1 Level 6 2 1 1 4 2 2 Level 7 1 1
Net total 2 2 3 1 6 10 7 8 5 20 Gatewell 6 121 451
Total 8 131 471 FGE (%) 75 92 96
17 May (5B, ESTS)
Subyearling Yearling Location chinook chinook Steelhead Sockeye
L M R Tot L M R Tot L M R Tot L M R Tot
Level 1 2 1 3 Level 2 1 1 2 1 3 6 Level 3 1 1 1 1 1 2 3 Level 4 1 1 2 2 2 5 9 Level 5 1 2 5 8 1 3 5 9 Level 6 1 2 1 4 1 5 6 Level 7 2 1 1 4 Net total 2 2 3 5 7 15 10 10 20 40
Gatewell 0 65 209 Total 2 80 249 FGE (%) 0 81 84

28
Appendix Table 2.--Continued.
18 May (5B, ESTS)
Location Subyearling
chinook L M R Tot
Yearling chinook
L M R Tot Steelhead
L M R Tot L Sockeye
M R Tot
Level 1 Level 2 1 Level 3 Level 4 Level 5 1 Level 6 Level 7
Net total 2 Gatewell
Total FGE (%)
1
1
2 2 4
50
2 1
1 4
1 1 1 1 4 1 9
5 4 2 1 3
15
6 5 5 3 7 2
28 166 194
86
1
2 1 4
2 2
1 1
6
1 4 4 4 4 1 1
19
1 7 6 4 5 4 2
29 236 265
89
19 May (4B, ESBS)
Location L
Subyearling chinook M R Tot
Yearling chinook
L M R Tot Steelhead
L M R Tot L Sockeye
M R Tot
Level 1 Level 2 Level 3 Level 4 Level 5 Level 6 Level 7
Net total Gatewell
Total FGE (%)
1 1
100
1 1 1 1 1 5
1
1
2
2
1
3
2 2 2 1 2 1
10 99
109 91
1
1
1 3
1 1 2
1
5
2
2
4
2 1 2 3 1 2 1
12 155 167
93
21 May (4B, ESBS)
Location Subyearling
chinook L M R Tot
Yearling chinook
L M R Tot Steelhead
L M R Tot L Sockeye
M R Tot
Level 1 Level 2 Level 3 Level 4 Level 5 Level 6 Level 7
Net total Gatewell
Total FGE (\)
1 1
100
1
1
1 1
2
1 1 1
3 18 21 86
1
1 1
3
1 1
2
1 1 2 1
5 52 57 91

29
Appendix Table 2.--Continued.
22 May (3B, STS)
Subyearling Yearling Location chinook chinook Steelhead Sockeye
L M R Tot L M R Tot L M R Tot L M R Tot
Level 1 Level 2 1 3 Level 3 Level 4 2 6 1 3 Level 5 1 3 Level 6 Level 7
Net total 4 12 1 3 0 Gatewell 47 63 1
Total 59 66 1 FGE (%) 80 95 100
22 May (4B ESBS)
Subyearling Yearling Location chinook chinook Steelhead Sockeye
L M R Tot L M R Tot L M R Tot L M R Tot
Level 1 Level 2 1 1 Level 3 1 1 2 Level 4 1 2 3 Level 5 1 1 Level 6 1 1 Level 7
Net total 2 2 2 6 1 1 2 Gatewell 34 58
Total 40 60 FGE (%) 85 97
22 May (5B, ESTS)
Subyearling Yearling Location chinook chinook Steelhead Sockeye
L M R Tot L M R Tot L M R Tot L M R Tot
Level 1 1 1 Level 2 1 1 1 5 4 10 Level 3 3 1 4 Level 4 1 1 1 1 Level 5 1 1 2 Level 6 1 1 :2 1 1 Level 7 1 1
Net total 3 2 5 2 11 6 19 Gatewell 24 15
Total 29 34 FGE (%) 83 44

30
Appendix Table 2.--Continued.
23 May (3B, STS)
Subyearling Yearling Location chinook chinook Steelhead Sockeye
L M R Tot L M R Tot L M R Tot L M R Tot
Level 1 Level 2 4 12 Level 3 6 18 Level 4 2 6 1 3 Level 5 1 3 Level 6 Level 7
Net total 13 39 1 3 0 Gatewell 123 96 1
Total 162 99 1 FGE (%) 76 97 100
23 May (4B, ESBS)
Subyearling Yearling Location chinook chinook Steelhead Sockeye
L M R Tot L M R Tot L M R Tot L M R Tot
Level 1 Level 2 2 2 Level 3 1 2 3 Level 4 1 1 1 2 3 Level 5 2 2 4 Level 6 1 1 2 Level 7
Net total 1 1 2 2 8 12 1 1 2 Gatewell 0 127 61
Total 1 139 63 FGE (%) 0 91 97
23 May (5B, ESTS)
Subyearling Yearling Location chinook chinook Steelhead Sockeye
L M R Tot L M R Tot L M R Tot L M R Tot
Level 1 Level 2 2 2 1 1 Level 3 1 1 2 Level 4 1 1 Level 5 1 1 2 Level 6 1 1 Level 7 1 1 1 1 Net total 2 2 3 7 1 3 4
Gatewell 74 27 Total 81 31 FGE (%) 91 87
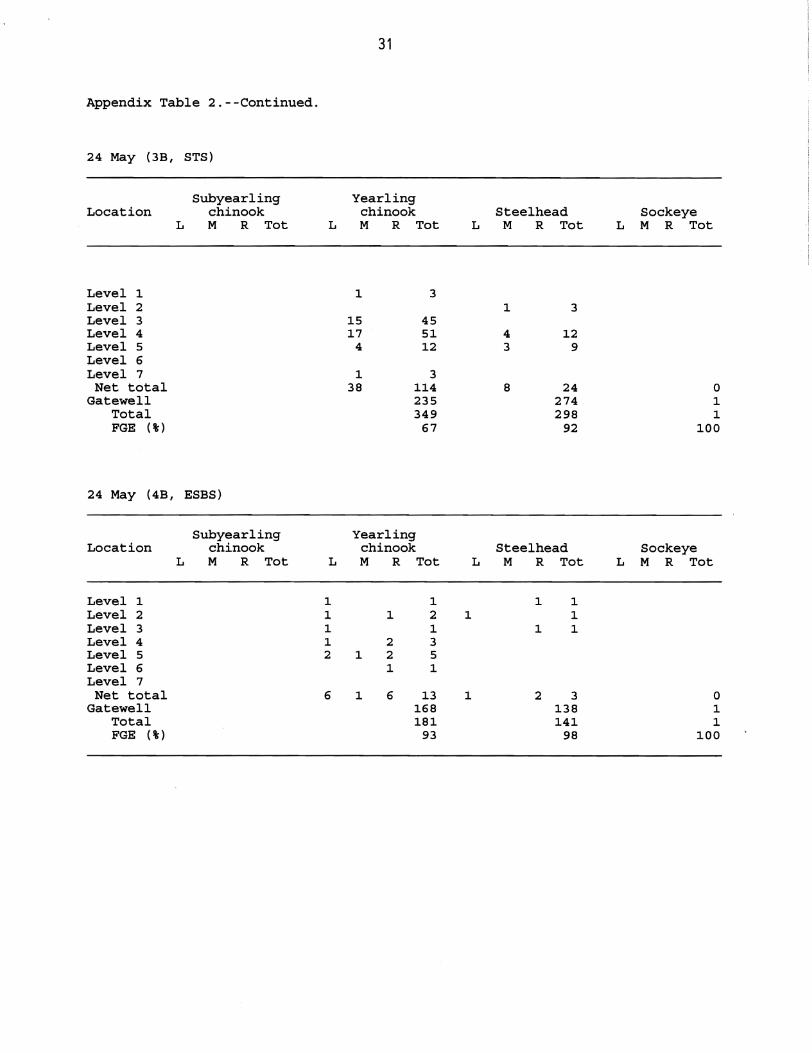
31
Appendix Table 2.--Continued.
24 May (3B, STS)
Location Subyearling
chinook L M R Tot L
Yearling chinook M R Tot L
Steelhead M R Tot L
Sockeye M R Tot
Level 1 Level 2 Level 3 Level 4 Level 5 Level 6 Level 7
Net total Gatewell
Total FGE (%)
1
15 17
4
1 38
3
45 51 12
3 114 235 349
67
1
4 3
8
3
12 9
24 274 298
92
0 1 1
100
24 May (4B, ESBS)
Location Subyearling
chinook L M R Tot L
Yearling chinook M R Tot L
Steelhead M R Tot L
Sockeye M R Tot
Level 1 Level 2 Level 3 Level 4 Level 5 Level 6 Level 7
Net total Gatewell
Total FGE (%)
1 1 1 1 :2
6
1
1
1
2 :2 1
6
1 2 1 3 5 1
13 168 181
93
1
1
1
1
:2
1 1 1
3 138 141
98
0 1 1
100

32
Appendix Table 2.--Continued.
25 May (4B, ESBS)
Location Subyearling
chinook L M R Tot L
Yearling chinook M R Tot L
Steelhead M R Tot L
Sockeye M R Tot
Level 1 Level 2 Level 3 Level 4 Level 5 Level 6 Level 7
Net total Gatewell
Total FGE (%" )
1 1
2
1 1 1
3
1 2 1 1
5 7
12 58
1
1
1
1
2
1
1 1
3 33 36 92
25 May (5B, ESTS)
Location Subyearling
chinook L M R Tot L
Yearling chinook M R Tot L
Steelhead M R Tot L
Sockeye M R Tot
Level 1 Level 2 Level 3 Level 4 Level 5 Level 6 Level 7
Net total Gatewell
Total FGE (%")
1 1
1 3
1
1
1 2 2 1
6
1 3 4 1 1
10 11 21 52
3
3
1
1 2
1
1
1 3 1 1 6
35 41 85

33
Appendix Table 2.--Continued.
26 May (4B, ESBS)
Location Subyearling
chinook L M R Tot L
Yearling chinook M R Tot L
Steelhead M R Tot L
Sockeye M R Tot
Level 1 Level 2 Level 3 Level 4 Level 5 Level 6 Level 7 Net total
Gatewell Total FGE (%)
1
1
1
1
2
1
1
2
2
3
5 66 71 93
1
1
1
1 59 60 98
26 May (5B, ESTS)
Location Subyearling
chinook L M R Tot L
Yearling chinook M R Tot L
Steelhead M R Tot L
Sockeye M R Tot
Level 1 Level 2 Level 3 Level 4 Level 5 Level 6 Level 7 Net total
Gatewell Total FGE (% )
3 1
4
2
2 5 1
10
1 2 2 1
6
2 1 7 8 2
20 143 163
88
1 1
2
1
1
1 1
2
2 2 1
5 108 113
96

34
Appendix Table 2.--Continued.
27 May (4B, ESBS)
Subyearling Yearling Location
L chinook M R Tot L
chinook M R Tot L
Steelhead M R Tot L
Sockeye M R Tot
Level 1 Level 2 Level 3 Level 4 Level 5 1 1 Level 6 1 1 Level 7 Net total 1 1 2 a
Gatewell 11 19 1 Total 13 19 1 FGE (!f;) 85 100 100
27 May (5B, ESTS)
Subyearling Yearling Location chinook chinook Steelhead Sockeye
L M R Tot L M R Tot L M R Tot L M R Tot
Level 1 Level 2 1 1 2 Level 3 1 1 2 Level 4 1 1 2 2 Level 5 1 1 2 1 1 Level 6 Level 7 1 1
Net total 1 1 3 2 2 7 2 1 3 Gatewell 2 19 18
Total 3 26 21 FGE (!f;) 67 73 86

35
Appendix Table 2.--Continued.
28 May (4B, ESBS)
Subyearling Yearling Location chinook chinook Steelhead Sockeye
L M R Tot L M R Tot L M R Tot L M R Tot
Level 1 Level 2 Level 3 1 1 1 1 2 Level 4 2 2 1 1 Level 5 2 2 1 1 Level 6 1 1 Level 7 Net total 2 3 5 2 3 5
Gatewell 30 77 Total 35 82 FGE (%) 86 94
28 May (5B, ESTS)
Subyearling Yearling Location chinook chinook Steelhead Sockeye
L M R Tot L M R Tot L M R Tot L M R Tot
Level 1 Level 2 1 1 2 Level 3 2 2 Level 4 2 2 1 2 3 Level 5 1 1 2 1 3 Level 6 1 1 1 1 2 1 1 Level 7 Net total 1 1 2 3 5 2 6 3 11
Gatewell 2 17 55 Total 3 22 66 FGE (%) 67 77 83

36
Appendix Table 2.--Continued.
29 May (4B, ESBS)
Location L
Subyearling chinook M R Tot L
Yearling chinook M R Tot L
Steelhead M R Tot L
Sockeye M R Tot
Level 1 Level 2 1 Level 3 Level 4 Level 5 Level 6 Level 7
Net total 1 Gatewell
Total FGE (%)
1
1 0 1 0
2 1
3
2
1 2
5
1
1
2
4 3
9 107 116
92
1
1
1
1
1
1 1 1
4
1 1 2 1 1
6 114 120
95
1
1
1
1 0 1 0
29 May (5B, ESTS)
Location L
Subyearling chinook M R Tot L
Yearling chinook M R Tot L
Steelhead M R Tot L
Sockeye M R Tot
Level 1 Level 2 Level 3 Level 4 Level 5 Level 6 Level 7 Net total
Gatewell Total FGE (%)
1
1
1
1 0 1 0
1
1 2
4
1 1 1 2
5
1
1
1 2 2 3 2
10 77 87 89
2 1
3
1
1
2
2
2 3 1
6 122 128
95

37
Appendix Table 2.--Continued.
30 May (4B, ESBS)
Subyearling Yearling Location chinook chinook Steelhead Sockeye
L M R Tot L M R Tot L M R Tot L M R Tot
Level 1 1 1 2 Level 2 1 2 1 4 Level 3 1 1 1 1 Level 4 1 1 2 1 1 Level 5 1 1 2 Level 6 1 1 Level 7 1 1 1 1 Net total 1 1 4 4 5 13 1 1 2
Gatewell 0 58 90 Total 1 71 92 FGE (%-) 0 82 98
30 May (5B, ESTS)
Subyearling Yearling Location chinook chinook Steelhead Sockeye
L M R Tot L M R Tot L M R Tot L M R Tot
Level 1 Level 2 1 1 Level 3 1 1 1 1 Level 4 2 1 2 5 Level 5 2 2 4 Level 6 Level 7
Net total 5 3 3 11 1 1 Gatewell 57 51
Total 68 52 FGE (%-) 84 98

Appendix Table 2.--Continued.
31 May (4B, ESBS)
Subyearling Location chinook
L M R Tot L
Level 1 Level 2 2 Level 3 Level 4 3 Level 5 Level 6 1 Level 7 1 Net total 0 7
Gatewell 1 Total 1 FGE (%) 100
31 May (5B, ESTS)
Subyearling Location chinook
L M R Tot L
Level 1 Level 2 Level 3 1 Level 4 2 Level 5 Level 6 1 Level 7
Net total 4 Gatewell
Total FGE (%)
38
Yearling chinook M R
2
1 2 6 1
1 11
Yearling chinook M R
2
1
1 2 5 1 2
3 11
Tot
4
6 6 2 1
19 63 82 77
Tot
1 5 7 1 4
18 65 83 78
L
1
1
Steelhead M R Tot
1 1 1
1 1
1 1
2 1 4 33 37 89
L Sockeye M R Tot
0 2 2
100
L Steelhead
M R Tot
1 1
1 1 14 15 93
L Sockeye M R Tot

39
Appendix Table 2.--Continued.
02 June (4B, ESBS)
Location L
Subyearling chinook M R Tot L
Yearling chinook M R Tot L
Steelhead M R Tot L
Sockeye M R Tot
Level 1 Level 2 Level 3 Level 4 Level 5 Level 6 Level 7
Net total Gatewell
Total FGE (%)
1
1
2
1
1
1 1 1
3
1 1 2 1 1
6 27 33 82
0 18 18
100
02 June (5B, ESTS)
Location Subyearling
chinook L M R Tot L
Yearling chinook M R Tot L
Steelhead M R Tot L
Sockeye M R Tot
Level 1 Level 2 Level 3 Level 4 Level 5 Level 6 Level 7 Net total
Gatewell Total FGE (%)
1
1
2
3
2
5
1 1 2
3 1
4 1 9
42 51 82
0 11 11
100


41
Appendix Table 3.--Descaling data from fish guidance efficiency tests conducted at Little Goose Dam, 1993.
Yearling chinook Steelhead Test Total Number Percent Total Number Percent date catch descaled descaled catch descaled descaled
Unit 3, Slot B (48% STS)
4 May 95 7 7.4 28 4 14.3 5 May 188 14 7.4 12 1 B.3 6 May 114 10 8.8 46 4 8.7 7 May 85 6 7.1 70 3 4.3
12 May 134 11 8.2 7 1 14.3 15 May 48 2 4.2 179 23 12.8 16 May 36 3 8.3 98 12 12.2 18 May 146 9 6.2 44 2 4.5 19 May 75 1 1.3 38 2 5.3 21 May 31 5 16.1 55 9 16.4 22 May 47 0 0.0 63 11 17.5 23 May 123 7 5.7 96 29 30.2 24 May 139 16 11.5 146 35 24.0 25 May 10 1 10.0 83 32 38.6 26 May 87 4 4.6 36 8 22.2 27 May 45 3 6.7 97 24 24.7 28 May 36 3 8.3 110 25 22.7 29 May 81 10 12.3 71 17 23.9 30 May 37 3 8.1 102 28 27.5 31 May 96 9 9.4 79 18 22.8
2 June 48 4 8.3 26 7 26.9 3 June 58 3 5.2 62 14 22.6
Unit 4, Slot A (22% extended-length bar screen)
24 May 108 6 5.6 76 15 19.7 25 May 10 2 20.0 30 9 30.0 26 May 78 4 5.1 38 9 23.7 27 May 19 3 15.B 23 1 4.3 28 May 27 4 14.8 54 3 5.6 29 May 89 9 10.1 34 7 20.6 30 May 68 3 4.4 59 18 30.5 31 May 88 13 14.8 40 11 27.5
Unit 4, Slot A (28% extended-length bar screen)
2 June 39 4 10.3 17 3 17.6 3 June 82 12 14.6 39 10 25.6

42
Appendix Table 3.--Continued.
Yearling chinook Steelhead Test Total Number Percent Total Number Percent date catch descaled descaled catch descaled descaled
Unit 4, Slot B (25% extended-length bar screen)
4 May 302 30 9.9 132 7 5.3 5 May 221 21 9.5 311 17 5.5 6 May 54 4 7.4 115 3 2.6 7 May 69 11 15.9 252 8 3.2
12 May 378 45 11. 9 363 22 6.1 15 May 23 0 0.0 207 37 17.9 17 May 121 7 5.8 187 22 11. 8 19 May 99 6 6.1 155 29 18.7 21 May 18 5 27.8 52 9 17.3 22 May 34 0 0.0 58 10 17.2 23 24
May May
127 168
8 7
6.3 4.2
61 138
20 27
32.8 19.6
25 May 7 1 14.3 33 8 24.2 26 May 66 3 4.5 59 17 28.8 27 May 11 0 0.0 19 5 26.3 28 May 30 3 10.0 77 13 16.9 29 May 107 11 10.3 114 30 26.3 30 May 58 0 0.0 90 22 24.4 31 May
2 June 63 27
9 2
14.3 7.4
33 18
10 6
30.3 33.3
3 June 74 15 20.3 33· 9 27.3
Unit 5, Slot B (25% extended-length traveling screen)
28 April 152 14 9.2 172 15 8.7 5 May 362 33 9.1 248 10 4.0 6 May 26 4 15.4 50 3 6.0 7 May 11 2 18.2 127 2 1.6
12 May 166 21 12.7 228 7 3.1 16 May 44 5 11.4 385 49 12.7 17 May 65 4 6.2 96 13 13.5 18 May 147 14 9.5 179 24 13.4 22 May 24 4 16.7 15 2 13.3 23 May 74 9 12.2 27 8 29.6 25 May 11 1 9.1 35 12 34.3 26 May 143 26 18.2 108 31 28.7 27 May 19 2 10.5 18 9 50.0 28 May 17 0 0.0 55 11 20.0 29 May 77 4 5.2 122 36 29.5 30 May 57 6 10.5 51 17 33.3 31 May 65 11 16.9 14 6 42.9
2 June 42 4 9.5 11 5 45.5


