IMPACT OF TRNA NEWS SENTIMENT ON PRICE MOVEMENT Tongli Zhang Kimi Yang IMPACT OF TRNA NEW S SENTIMENT ON PRICE MOVEMENT Tongli Zhang Kimi Yang IMPACT OF TRNA NEW S SENTIMENT ON PRICE MOVEMENT Tongli Zhang Kimi Yang IMPACT OF TRNA NEW S SENTIMENT ON PRICE MOVEMENT Tongli Zhang Kimi Yang
Transcript
IMPACT OF TRNA NEWS SENTIMENT ON PRICE
MOVEMENT
Tongli Zhang
Kimi Yang
IMPACT OF TRNA NEWS SENTIMENT ON PRICE
MOVEMENT
Tongli Zhang Kimi Yang
IMPACT OF TRNA NEWS SENTIMENT ON PRICE
MOVEMENT
Tongli Zhang Kimi Yang
IMPACT OF TRNA NEWS SENTIMENT ON PRICE
MOVEMENT
Tongli Zhang Kimi Yang
INDEX1. Data Structure and Preliminary Research
2. Introduction of Our Research Method about Relationship of News Sentiment and Daily Return
3. Analysis and Optimization of this Relationship
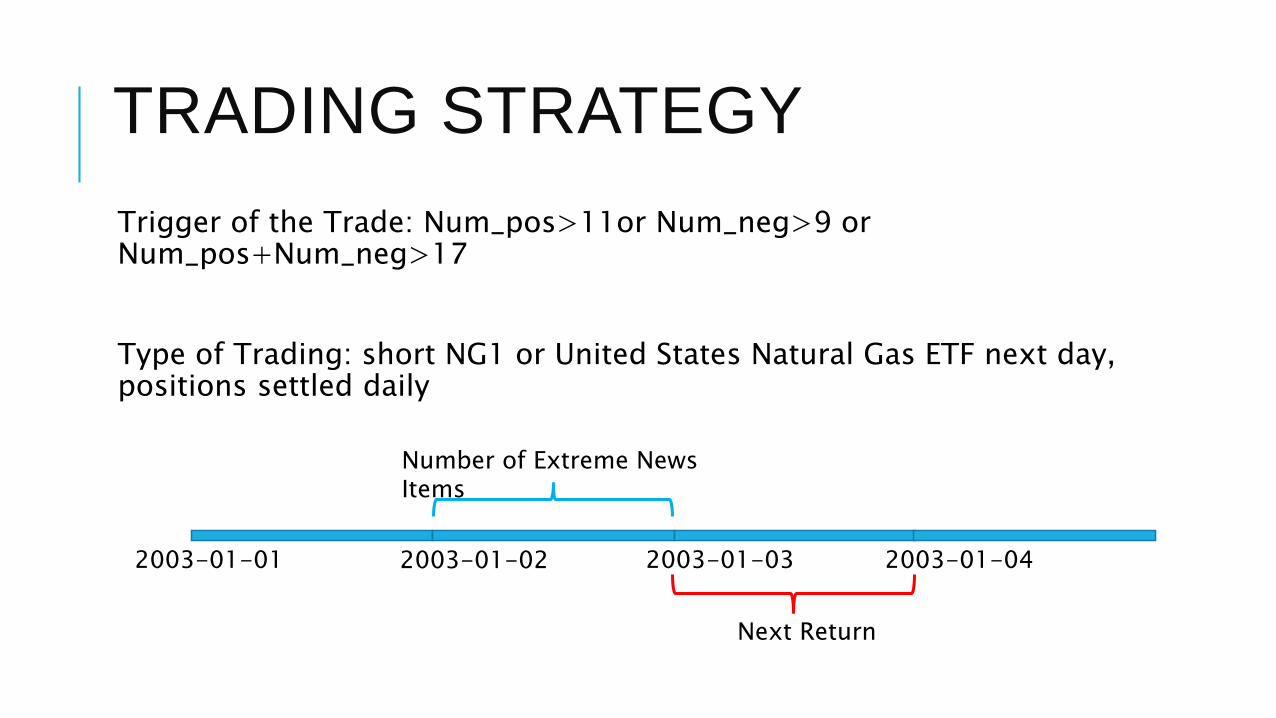
4. Trading Strategy Based on this Relationship
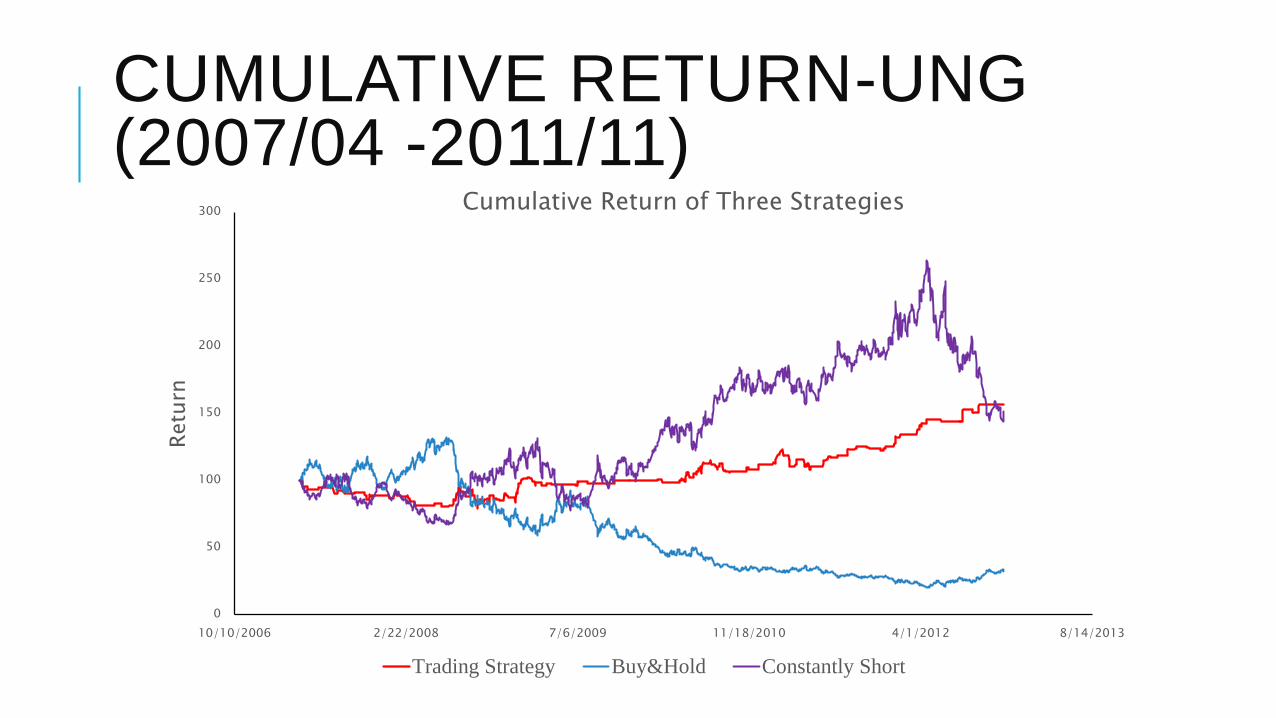
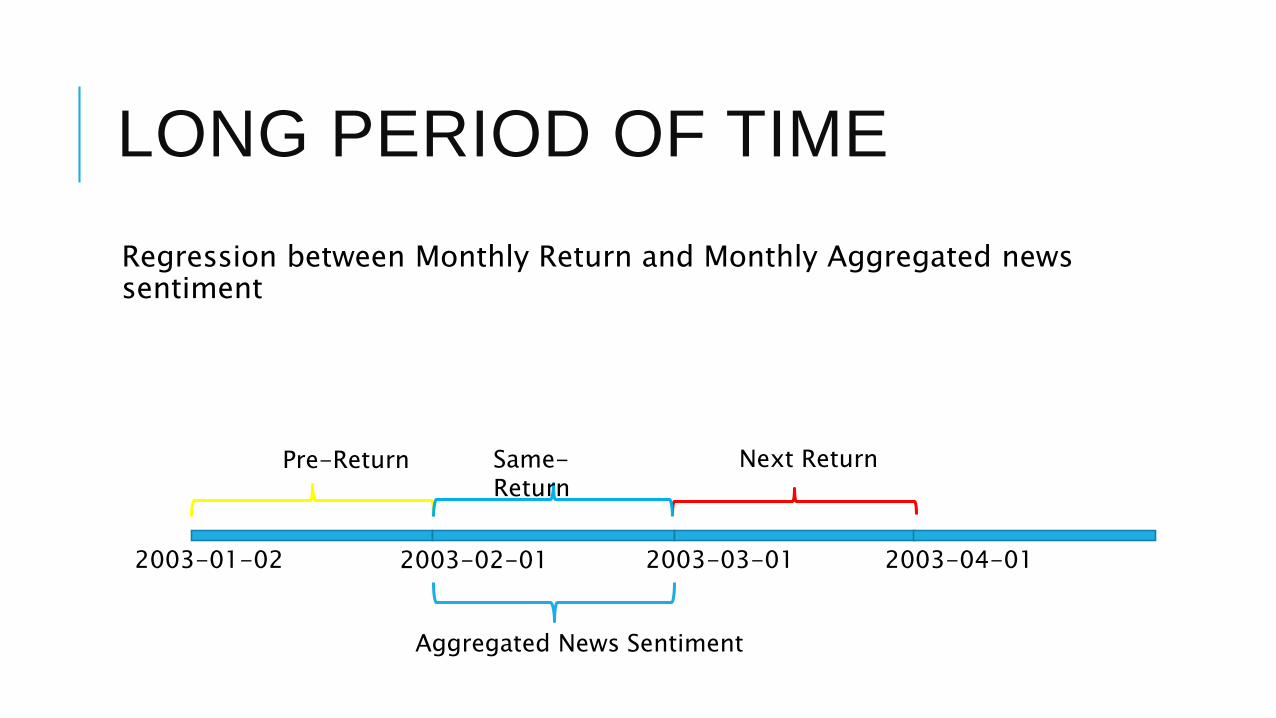
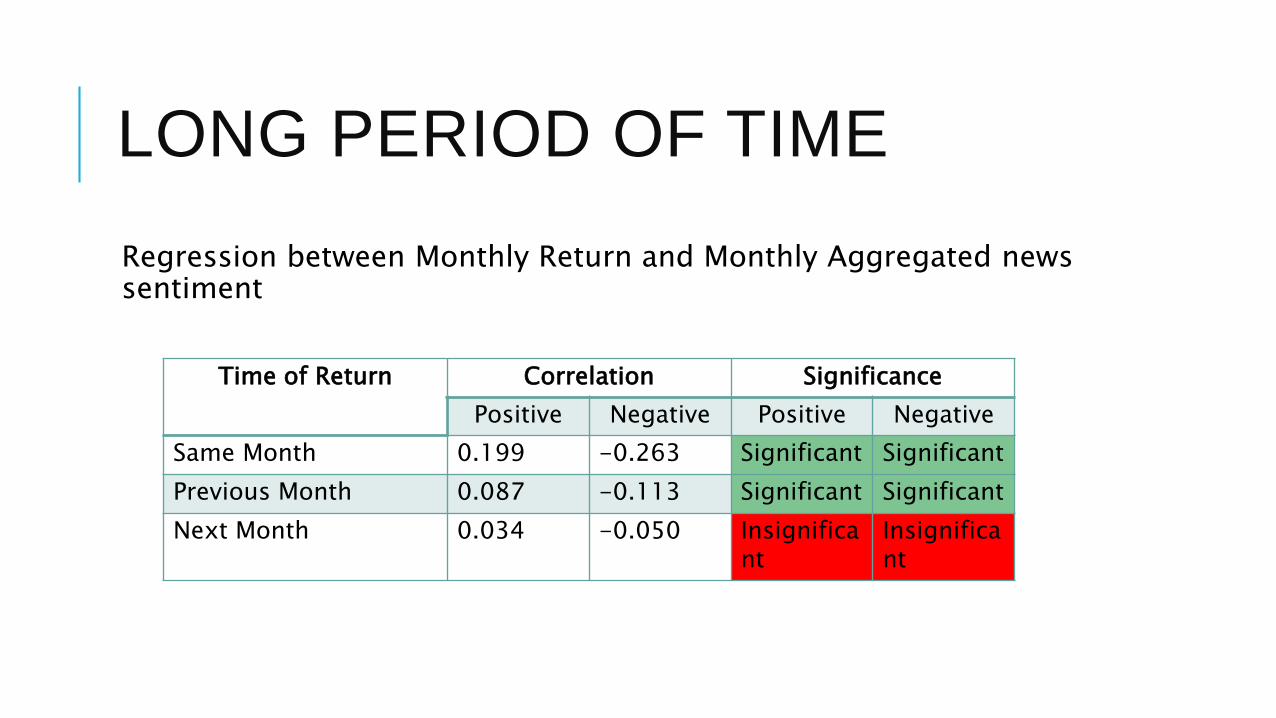
5. Analysis in Long Period of Time and on Intraday Basis
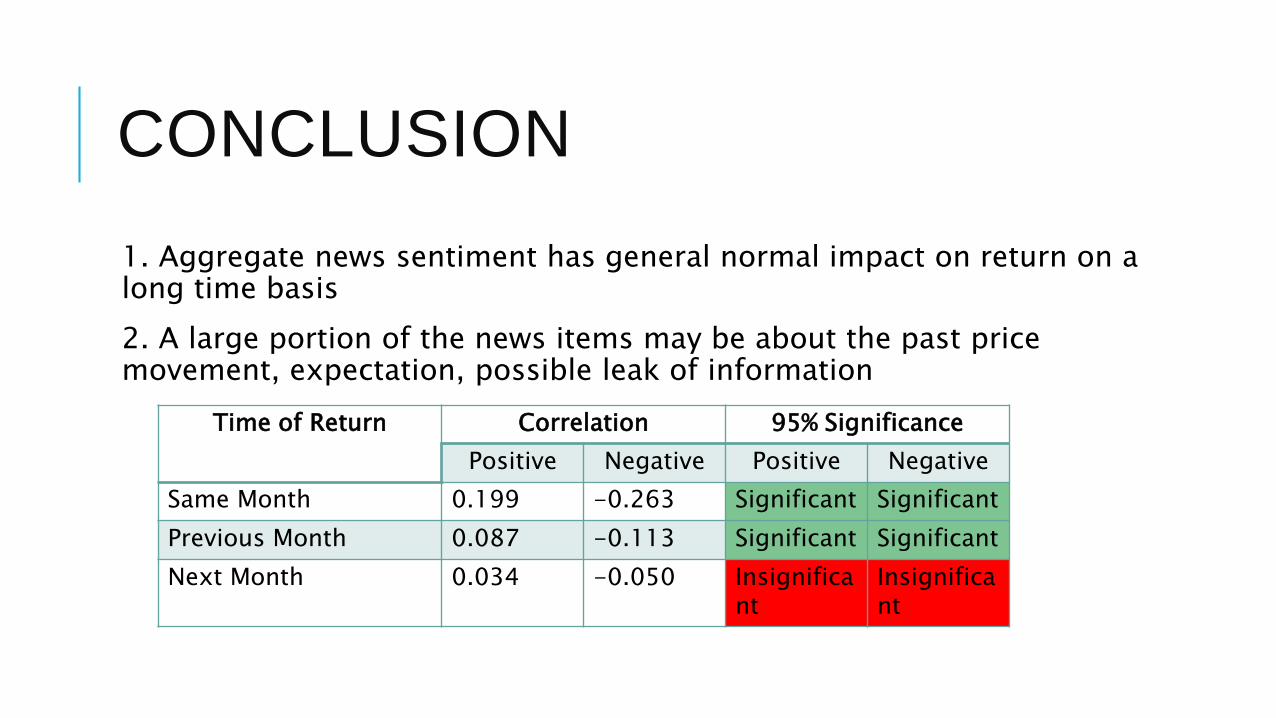
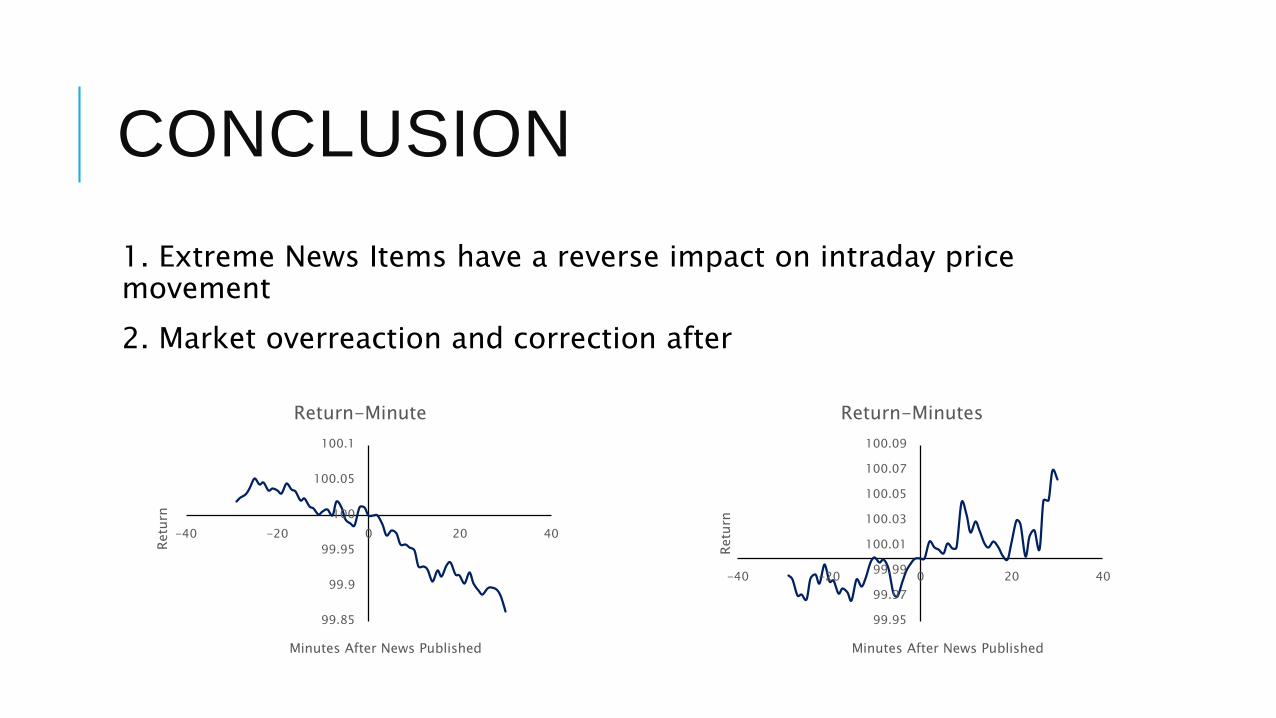
6. Rational behind the Empirical Relationship
DATA STRUCTURE AND PRELIMINARY RESEARCH
DATA STRUCTURE AND PRELIMINARY RESEARCH
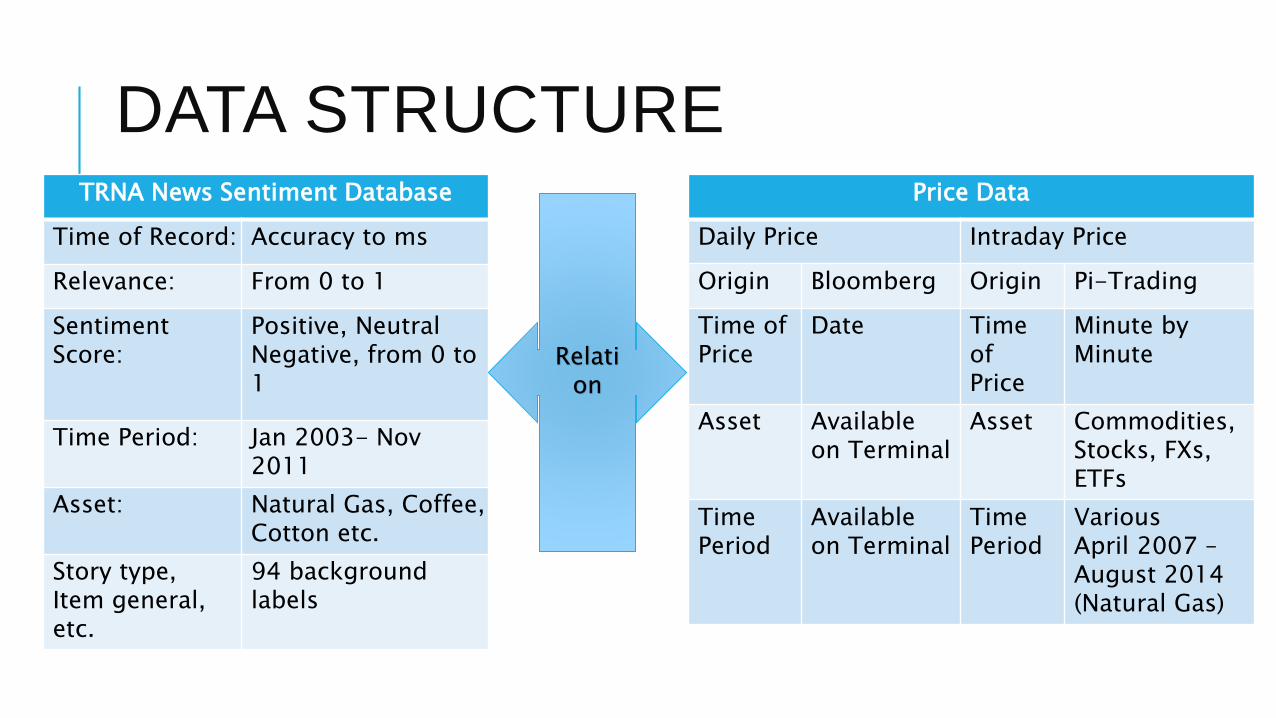
DATA STRUCTURETRNA News Sentiment Database
Time of Record: Accuracy to ms
Relevance: From 0 to 1
Sentiment Score:
Positive, Neutral Negative, from 0 to 1
Time Period: Jan 2003- Nov 2011
Asset: Natural Gas, Coffee, Cotton etc.
Story type, Item general, etc.
94 background labels
Price Data
Daily Price Intraday Price
Origin Bloomberg Origin Pi-Trading
Time of Price
Date Time of Price
Minute by Minute
Asset Availableon Terminal
Asset Commodities,Stocks, FXs, ETFs
Time Period
Availableon Terminal
Time Period
VariousApril 2007 –August 2014 (Natural Gas)
Relation
IMPACT OF NEWS SENTIMENT ON PRICE
1. Aggregated Daily News Sentiment
Relevance weighted aggregated
2. Extreme News Sentiment on Daily Basis
The criteria for extreme news is the certain quantile of news sentiment score
For example (Extreme Positive News are news items with positive scoreshigher than 80% of the total news)
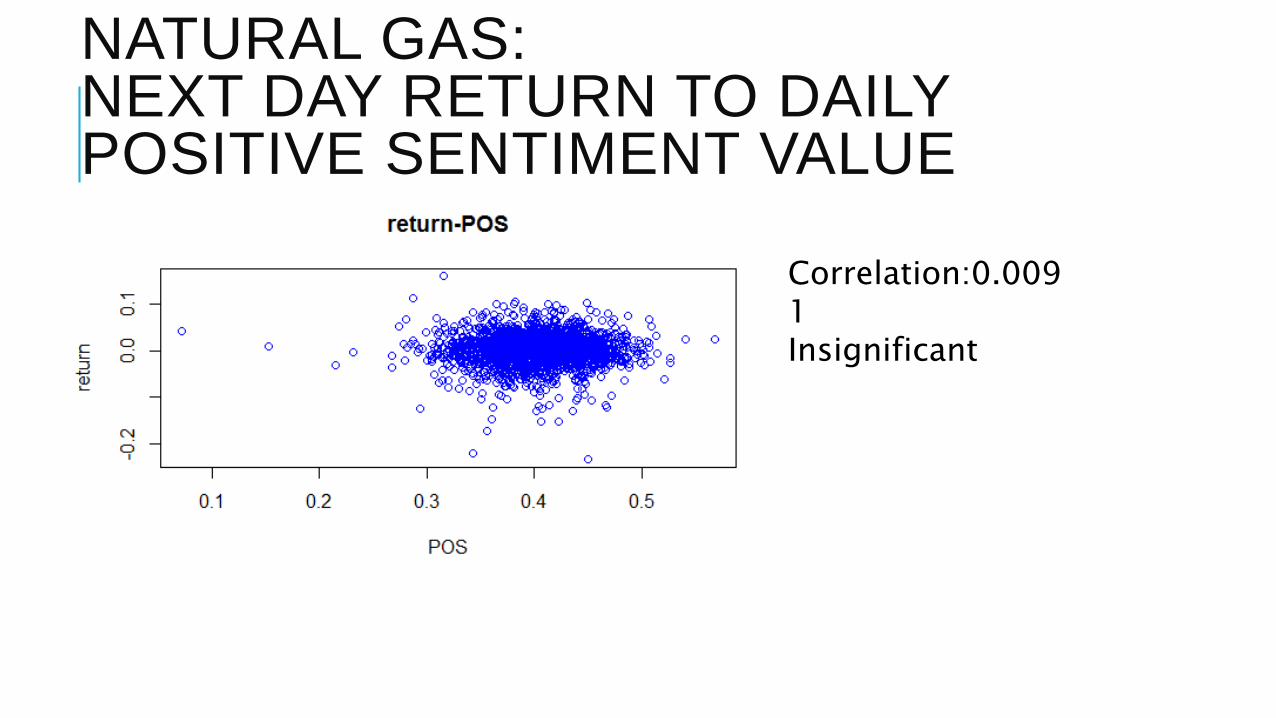
NATURAL GAS:NEXT DAY RETURN TO DAILY POSITIVE SENTIMENT VALUE
Correlation:0.0091Insignificant
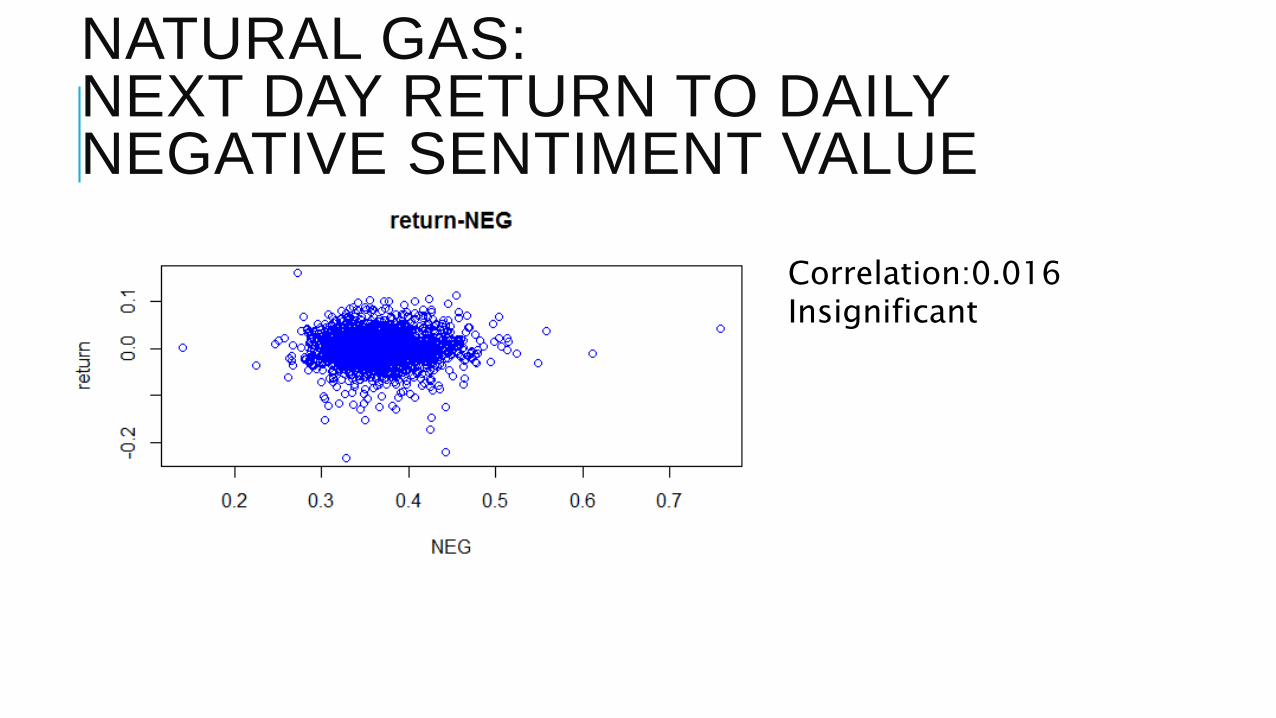
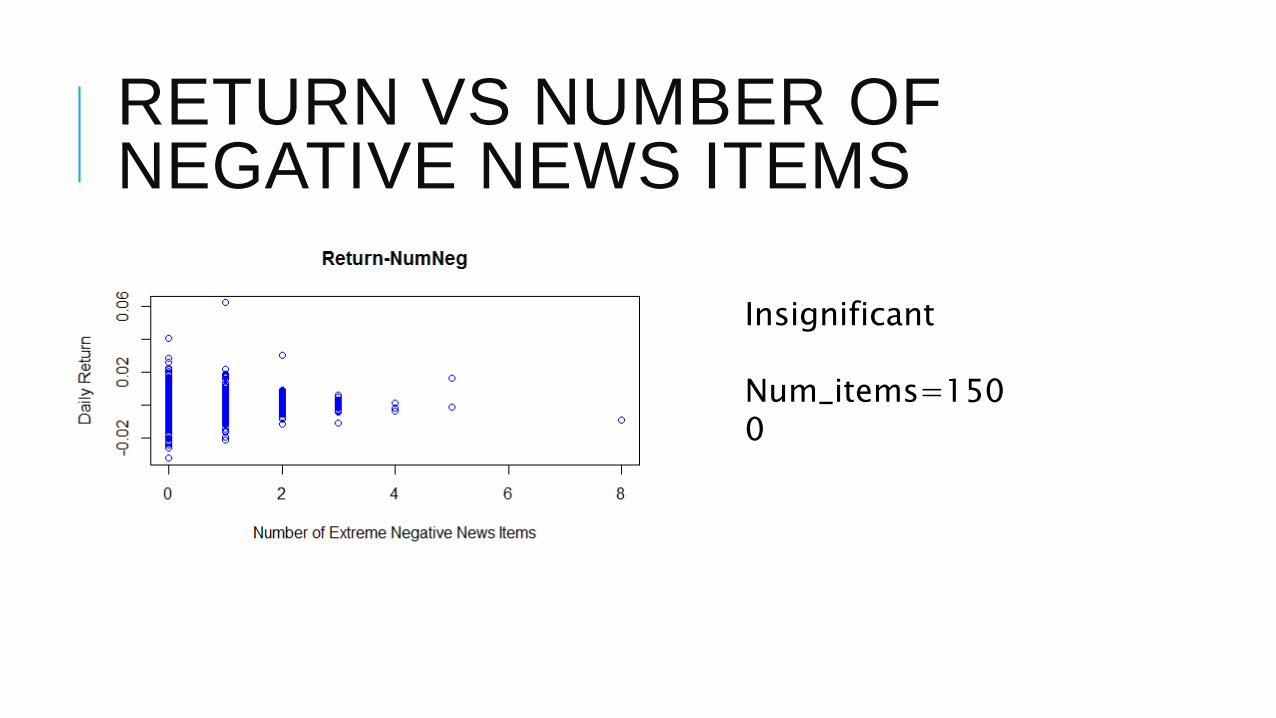
NATURAL GAS:NEXT DAY RETURN TO DAILY NEGATIVE SENTIMENT VALUE
Correlation:0.016Insignificant
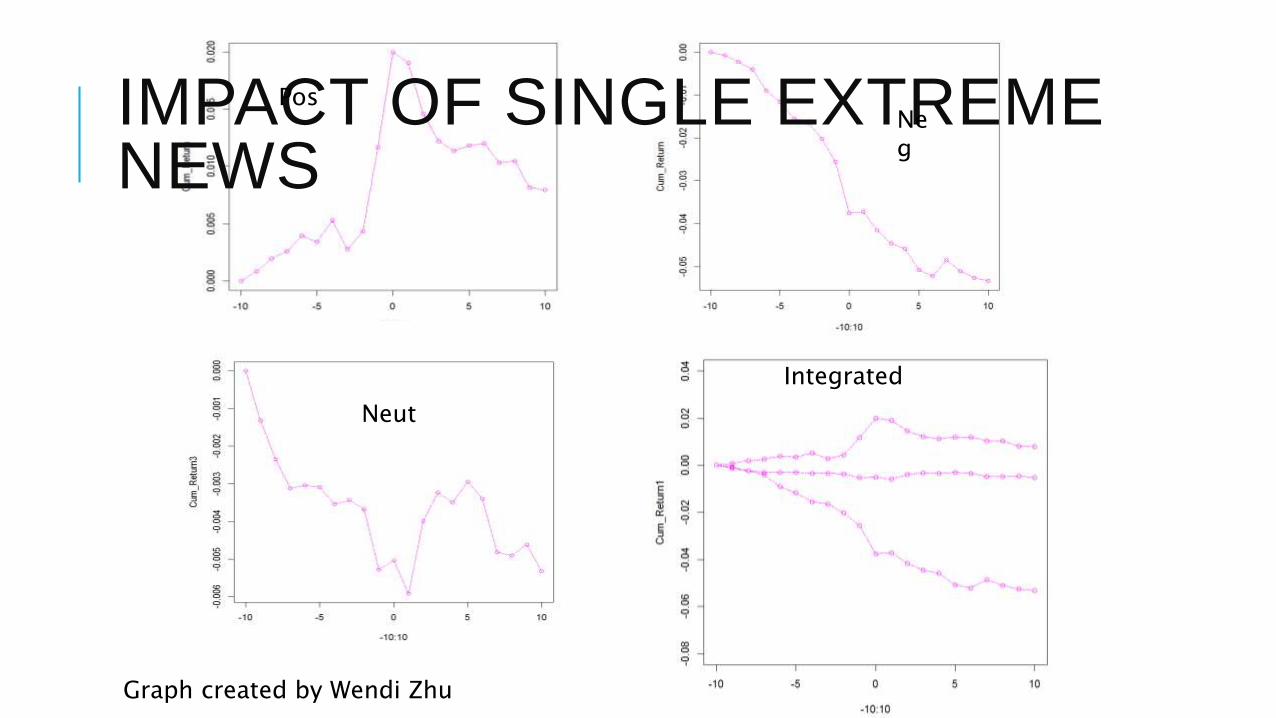
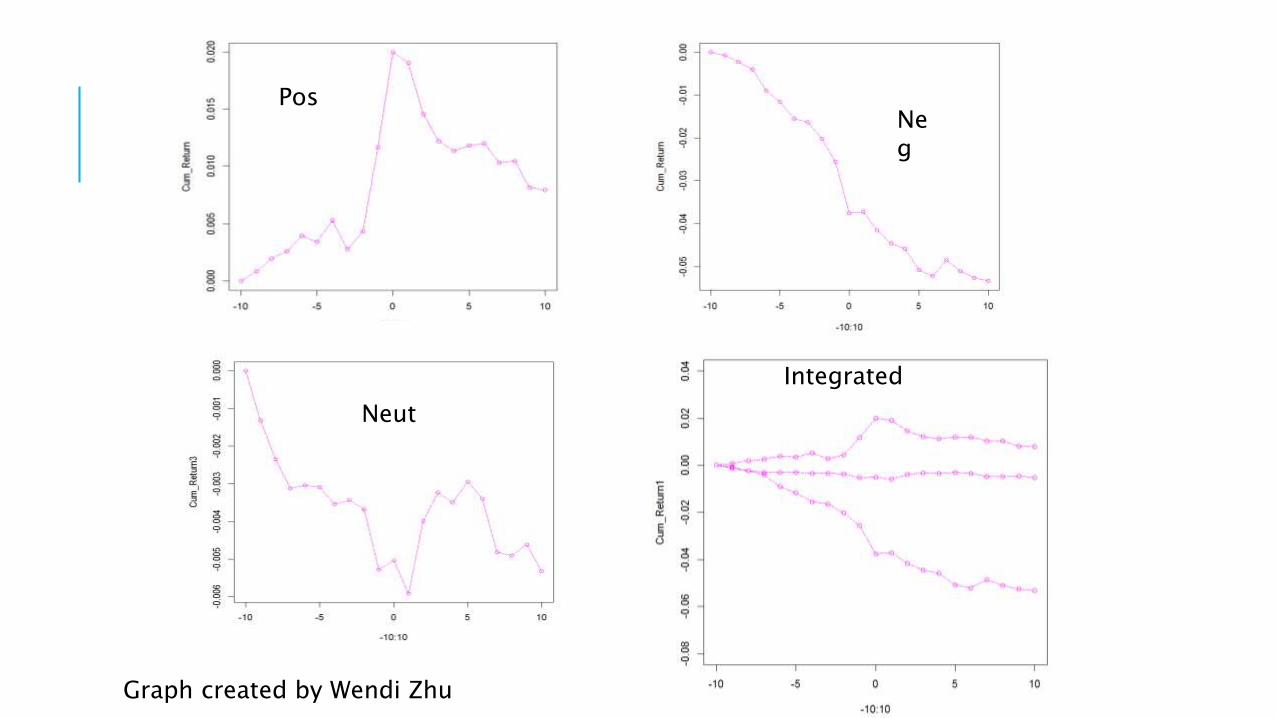
IMPACT OF SINGLE EXTREME NEWS
PosNeg
Neut
Integrated
Graph created by Wendi Zhu
ACCUMULATIVE IMPACT OF NEWS SENTIMENT &
RELATIONSHIP WITH PRICE
ACCUMULATIVE IMPACT OF NEWS SENTIMENT
& RELATIONSHIP WITH PRICE
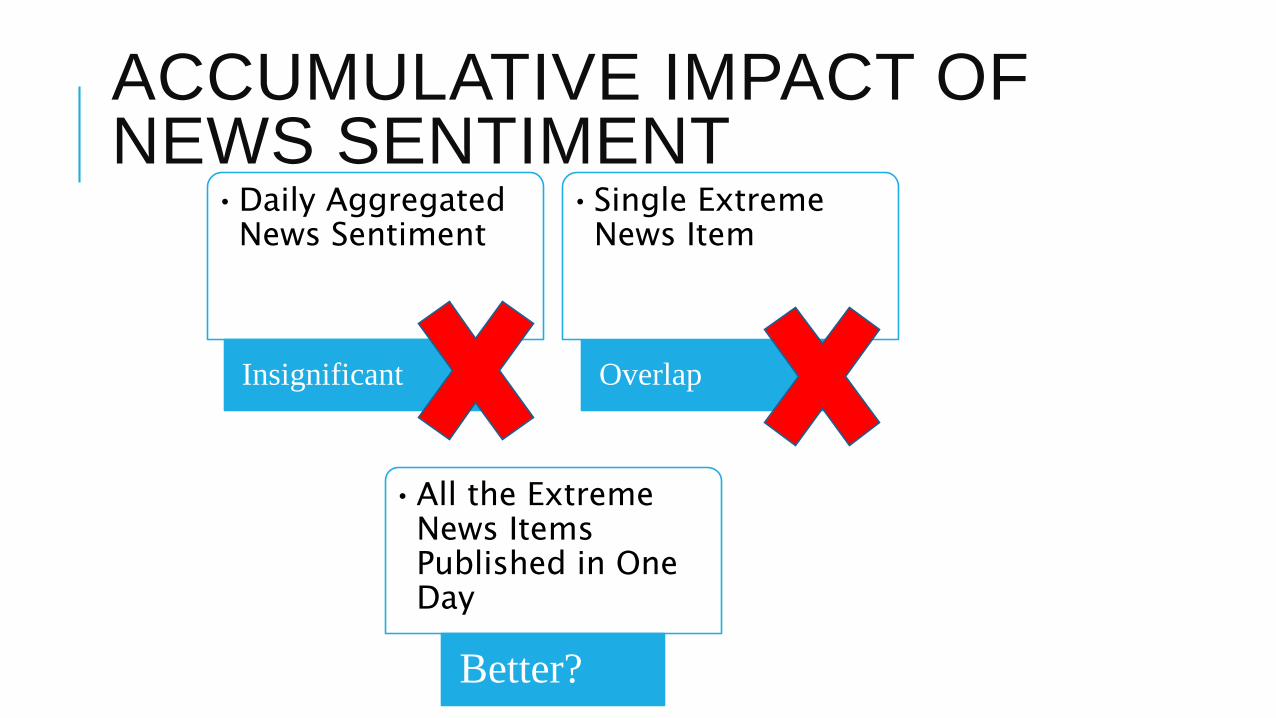
ACCUMULATIVE IMPACT OF NEWS SENTIMENT
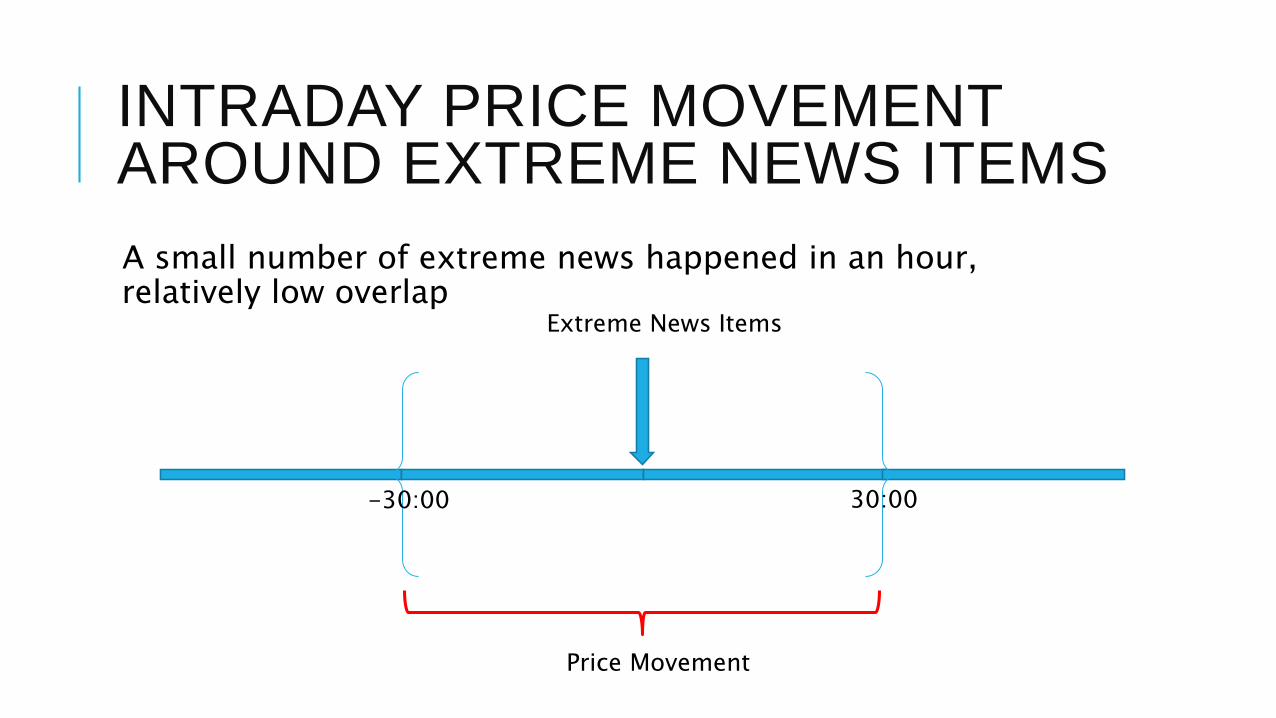
Overlap
•Daily Aggregated News Sentiment
Insignificant
•Single Extreme News Item
•All the Extreme News Items Published in One Day
Better?
ACCUMULATIVE IMPACT OF NEWS SENTIMENT
Number of Extreme News (Positive or Negative) and its relationship with price
1. Daily Basis: Daily Return Vs Daily Number of Extreme News
2. Use Year 2009 daily price data and sentiment data as training data set
3. Criteria for extreme news, sentiment score larger than 80% of news items
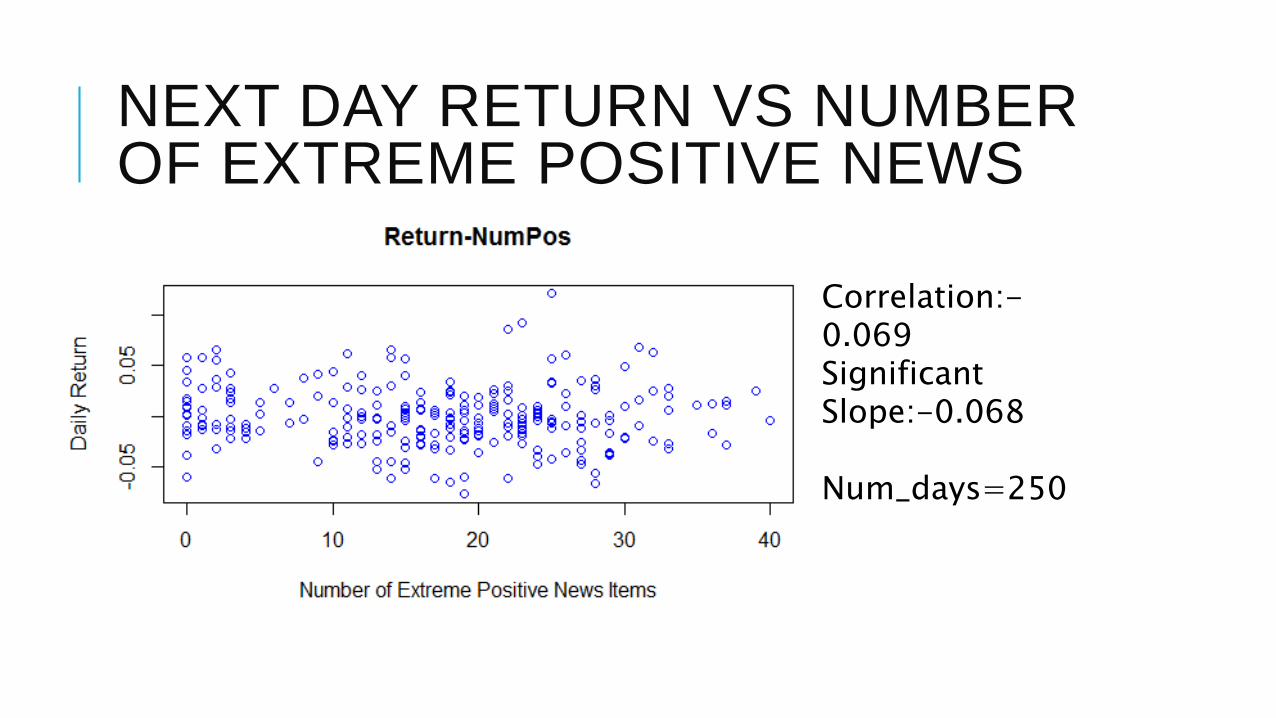
NEXT DAY RETURN VS NUMBER OF EXTREME POSITIVE NEWS
Correlation:-0.069SignificantSlope:-0.068
Num_days=250
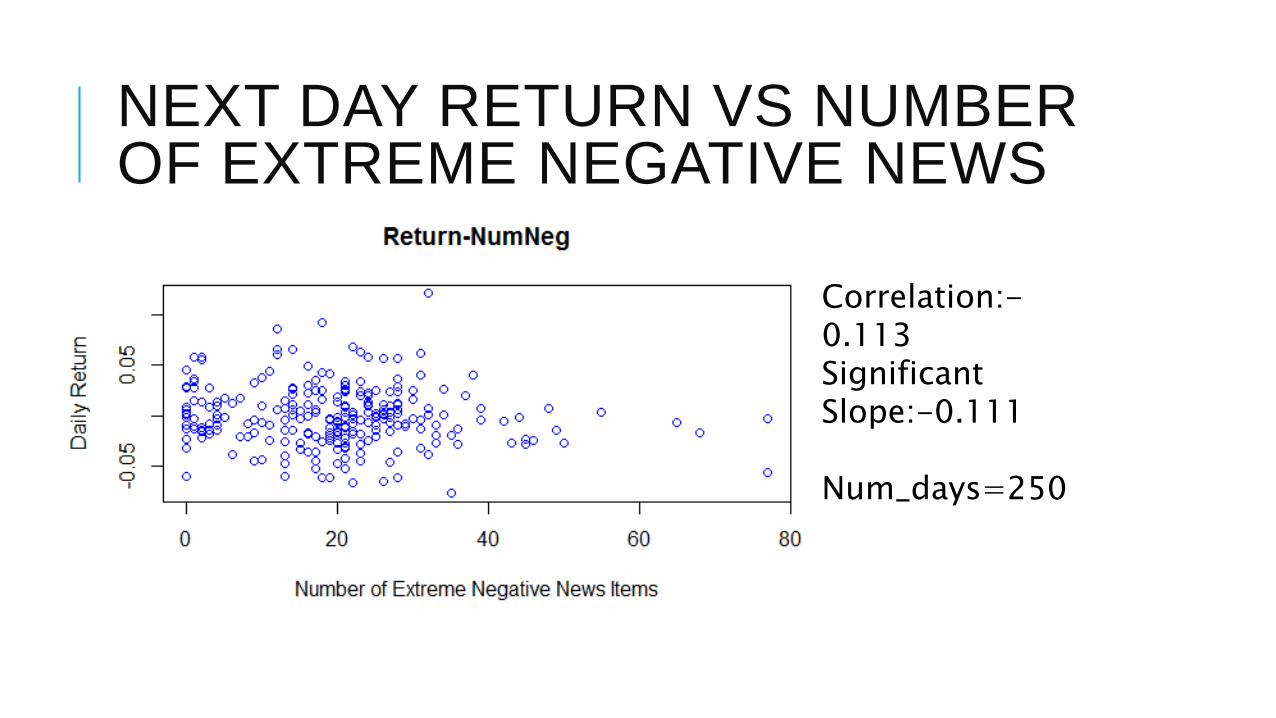
NEXT DAY RETURN VS NUMBER OF EXTREME NEGATIVE NEWS
Correlation:-0.113SignificantSlope:-0.111
Num_days=250
OPTIMIZATION OF THE RELATIONSHIP
OPTIMIZATION OF THE RELATIONSHIP
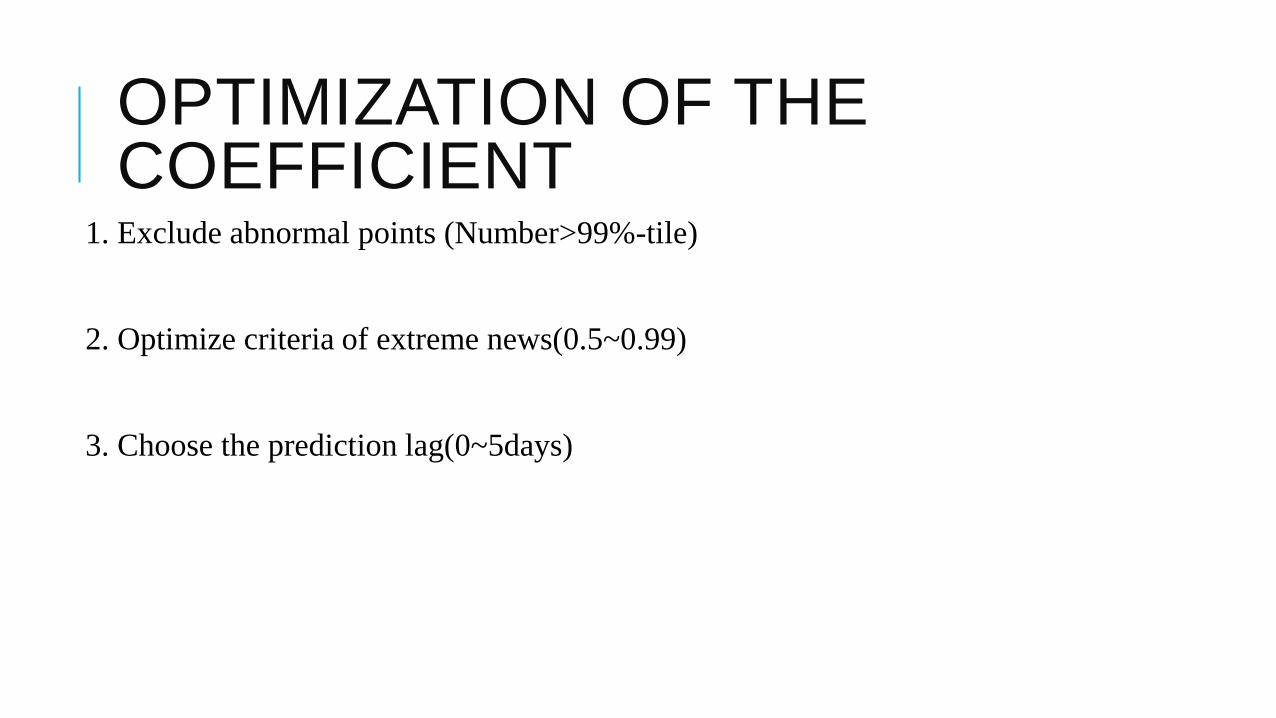
OPTIMIZATION OF THE COEFFICIENT
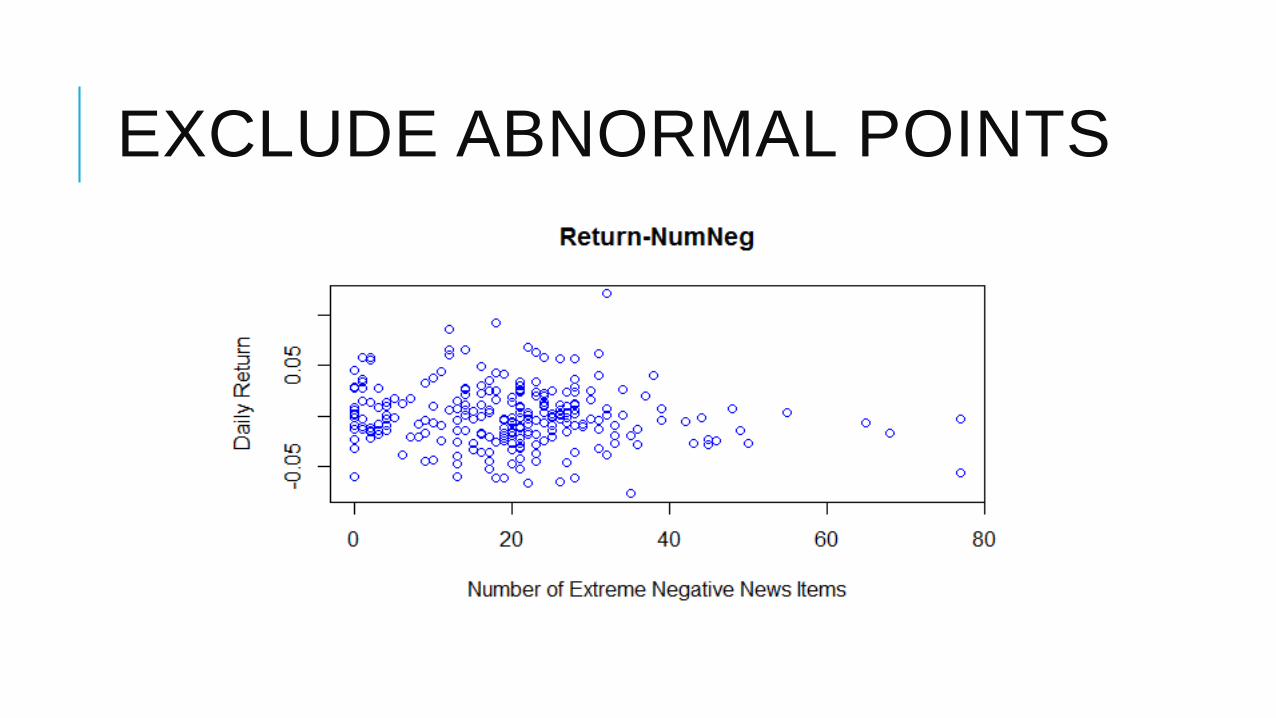
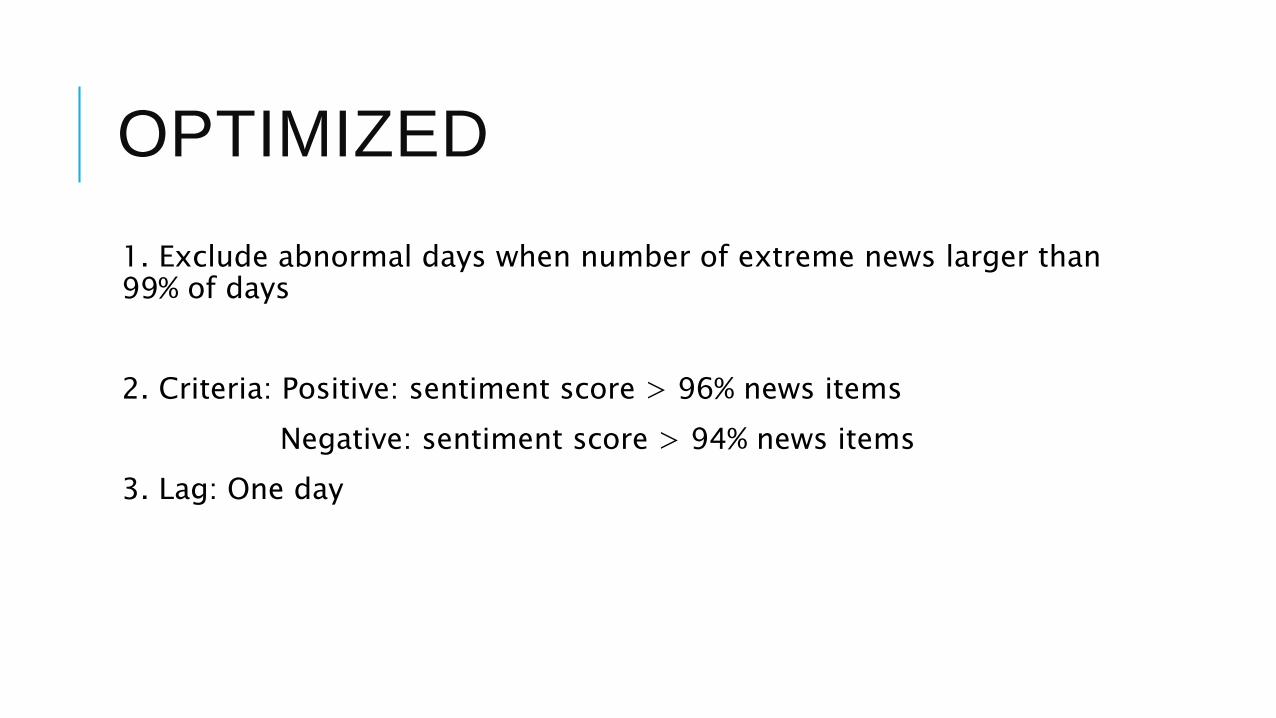
1. Exclude abnormal points (Number>99%-tile)
2. Optimize criteria of extreme news(0.5~0.99)
3. Choose the prediction lag(0~5days)
EXCLUDE ABNORMAL POINTS
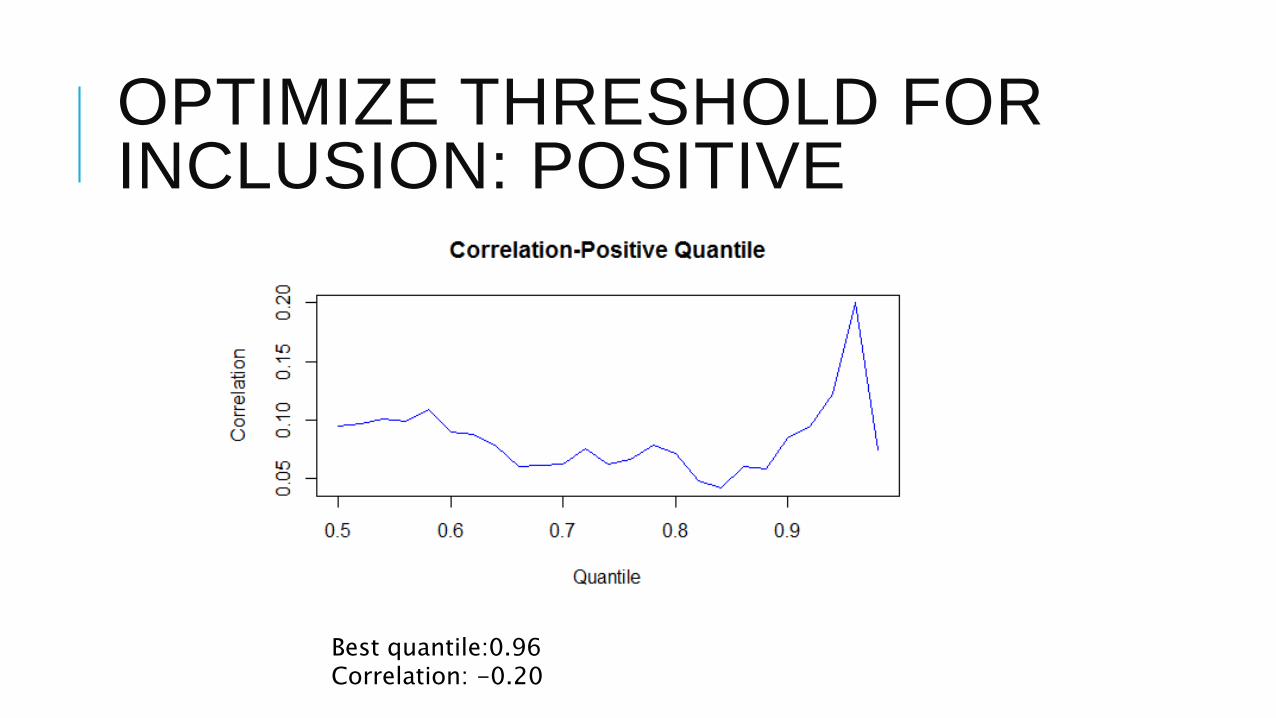
OPTIMIZE THRESHOLD FOR INCLUSION: POSITIVE
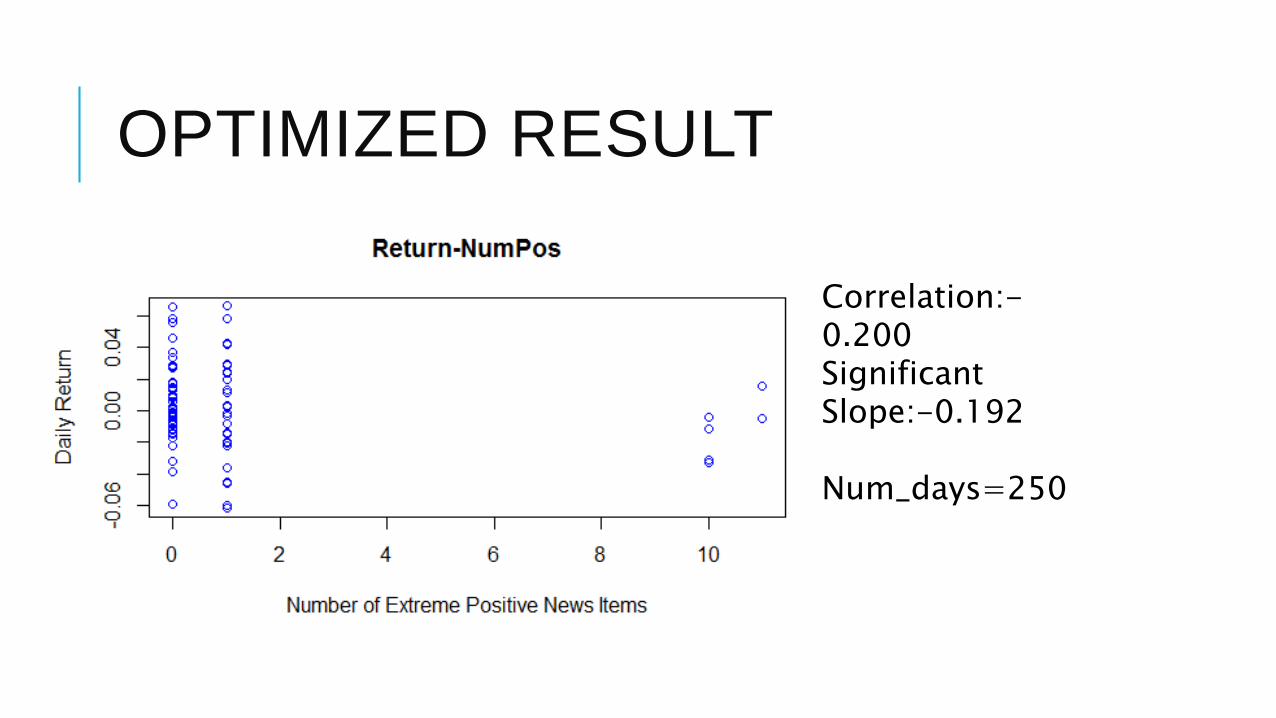
Best quantile:0.96Correlation: -0.20
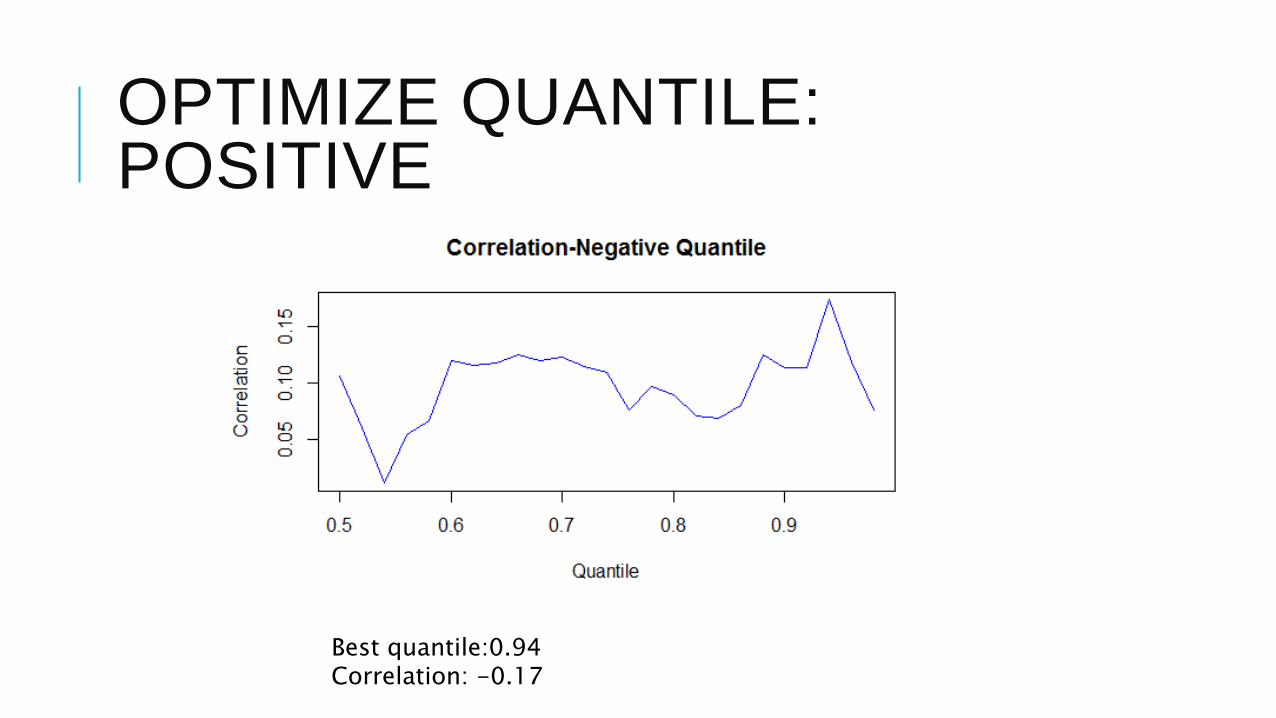
OPTIMIZE QUANTILE: POSITIVE
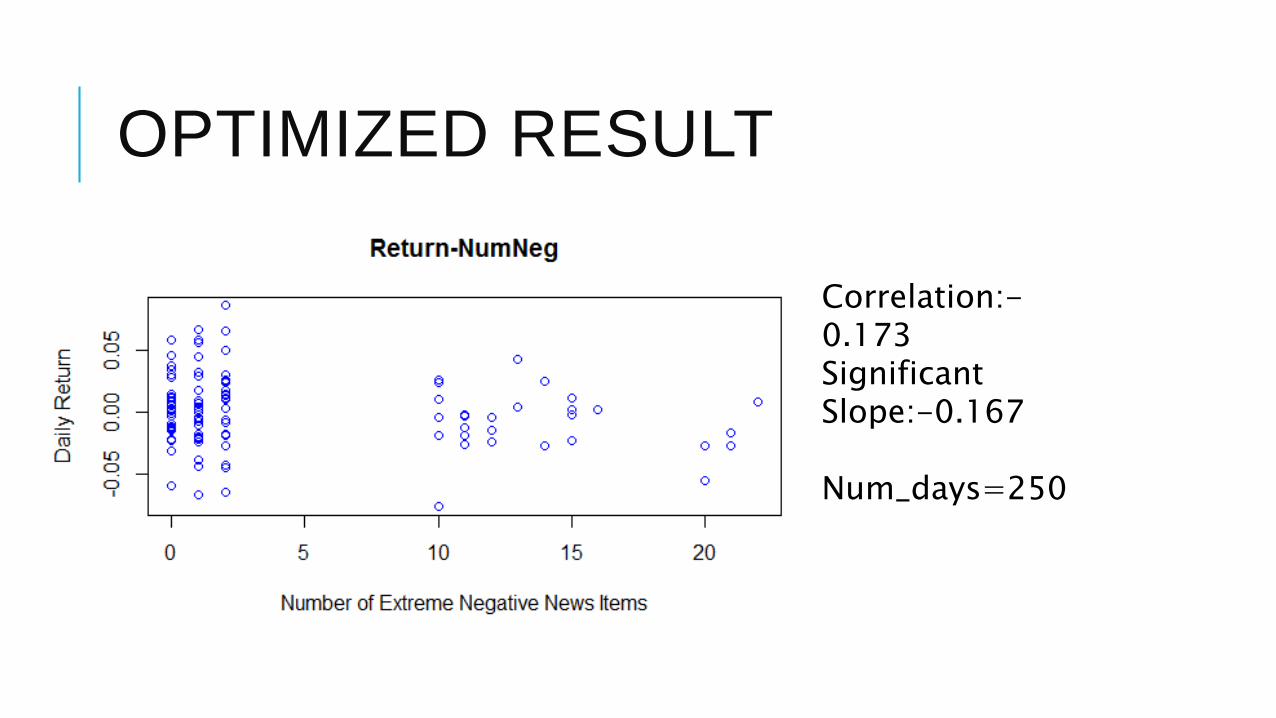
Best quantile:0.94Correlation: -0.17
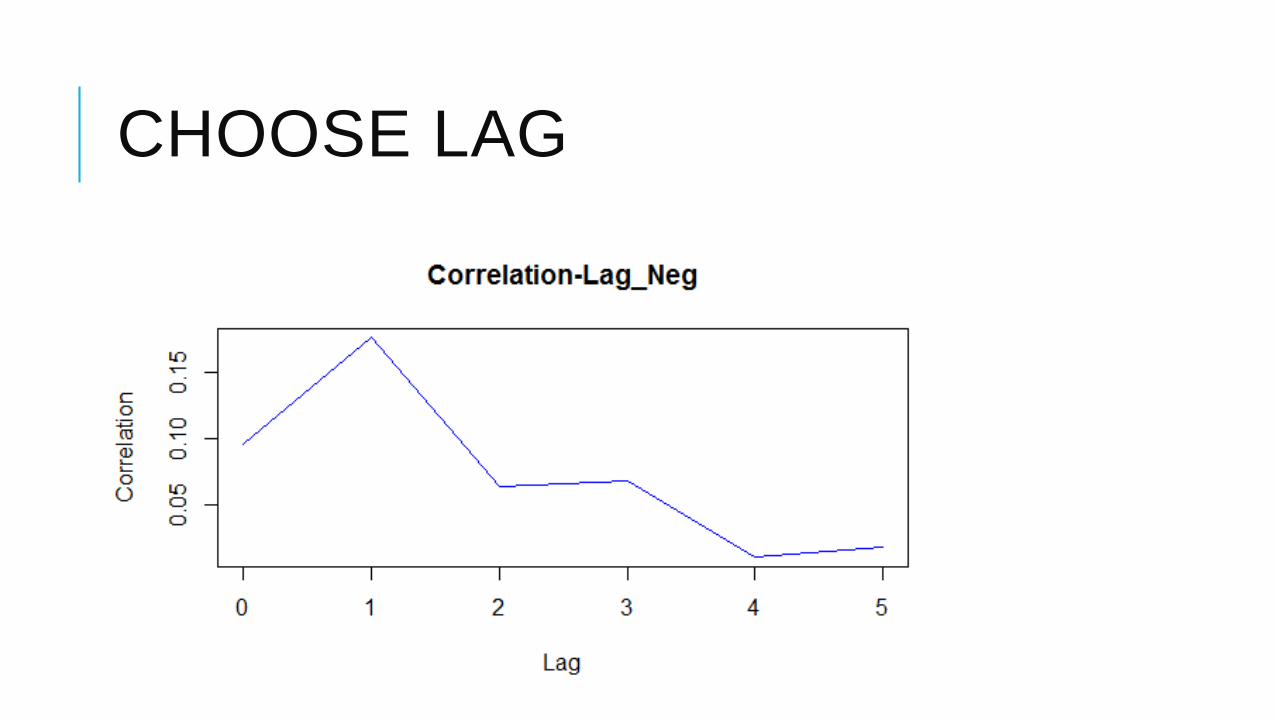
CHOOSE LAG
CHOOSE LAG
OPTIMIZED
1. Exclude abnormal days when number of extreme news larger than 99% of days