124
EXTENSIOta 28th Annu I l S • an c1en� ILE. SOUTHEAST SOUTH DAKOTA EXPERIMENT FARM BERESFORD y PROGRESS REPORT 1988 Agricultural Experiment Station South Dakota State University Brookings

EXTENSIOta 28th Annu
I l S • an c1en�r1
ILE.
SOUTHEAST SOUTH DAKOTA EXPERIMENT FARM
BERESFORD
y
PROGRESS REPORT 1988
Agricultural Experiment Station South Dakota State University
Brookings

I

Thls twenty �ightn annual r�part af the re�eareh pro9r�m st the· ScutMe 5� South Oakcta Ra�=�rcn rarm has special significance far t hos.a en�age{lj in .agr �cu.l tun! and th.e agr teul turall � related bu�ine55e5 in L�e ter ccJnt) r a uf Sau heast SGuth O�ko n Tne results shown �re n�t ne�es�arily cnmpl.t ar eanclu�!ve Interpretations given are tentative because additional data te$ult1ng from continuation of these experiments may result in conclusions different from those based on any one year. Trade nem�s are used in this �ublleatlan �ere y La prov�de spec�flc .Lnform-ation '4 t::rooe flame qucts<.1 �ere does. not l.'.!Dn!:t tute a gu���ntee or •i1Uranty and dae� ng� s1gnlfy that the PTCduct is approved to the exclusion of other comparable products.
South Dakota Agricultural Experiment Station Brookings, South Dakota 57007
or. David Bryant. Dean Dr. R. A. Moore. Director

THE SOUTHEAST SOUTH DAKOTA EXPERIMENT fARM CORPORATION
MEMBERS
BOARD Of DIRECTORS
COUNTY
Frank Orr, President John Olbertson, Vice-President Merlyn Smeenk, Treasurer Merlin Pietz, Secretary John Ludens Ron Larsen Willie Huebner Merlin Peterson Sidney Abild Leon Jorgensen Darrell Edelman Robert Anderson Joe Uherka Wayne Burkhart
Clay Lincoln Lincoln Turner Turner Union Unio Yankton Clay Turner Hutchinson Lincoln Charles Mix Minnehaha
ADDRESS
Meckling Beresford Harrisburg Parker Davis Beresford Akron, IA Irene Wakonda freeman Menno Hudson Wagner Dell Rapids
THE COOPERATIVE EXTENSION SERIVCE
COUNTY
Bon Homme Charles Mix Clay Douglas Hutchinson Lincoln Minnehaha
Turner Union Yankton
Mylo Hellickson, Acting Director
COUNTY EXTENSION AGENTS Of THE SOUTHEAST AREA
AGENT
Steve Sutera Daniel Dvorak Ron Thaden Roger Barrick Steve OeHoogh Jeff Lounsbery Steven Munk/
Craig Rosenberg Merlin Pietz Louie Desmet Darwin McGhee
ADDRESS
Tyndall Lake Andes Vermillion Armour Olivet Canton Siou>< Falls
Parker Elk Point Yankton
Larry Tideman, Program Leader, Ag & Field Operation Les Schoffelman, Southeast DES Lloyd Hansen, Extension Program Development Coordinator

TABLE Of CONTENTS
Introduction .
Weather .. . • • • " • I. •
88·1 Date of Planting For Corn
88·2 Plant Populations for Corn .
88·3 Date of Planting Soybeans
88·4 Soybean Variety Row Spacing
88-5 Soybean Population Study . . .
r •
. .. . .. . .
.. .,. . "
J. • • • • •
88·6 Influence of Potassium. Sulfur. Zinc . And Lime on Corn
Page
1
2'
10
12
88·7 Nitrogen Management Oe•onstration • • . • • . • 17
fall Versus Spring Nitrogen Application On Corn
88-9 Tillage and Rotation Effects On Soil . Phosphorus Availability to Corn
. . . 20
22
88·10 Effects of Starter fertilization of Corn Under 30 Varying Cultural And Environ•ental Conditions
88·11 Residual Effects of P Fertilization . . . . . 35
88-12 Pop-up Versus 2 x 2 Starter for Ridge Planted 37 Corn and Soybeans
88·13 Oat Research . . . . . . . . . . . . . . . . . 47
88·14 Agronoaic Evaluation of Some Drought Tolerant 4J Alternative or Emergency Forage Crops
88-15 Tillage and Rotation for Corn and Soybeans . . 46
88-16 Tillage and landscape Position Effects On . . . . . 49 Corn and Soybean Yield
88-17 1988 Crop Performance Trials 53
88-18 Alfalfa Cultivar Yield Test 62

Table of Contents Continued
Page
88·19 Herbicide Demonstrations and Herbicide . . . . . . 66 Research. 1988
88-20 Insect Research
Corn DellO 67 Soybean OellO 69 Velvetleaf Control in
soybeans 71 Corn 74
Herbicide Rates Cultivation 77 Cocklebur Control 80 Black Nightshade Control 82 Herbicide Rates Ridge-Till 84 Herbicide Carryover 86 No-Till Herbicide OellO 88
. . .. . . . . . . .. ' . 93
88-21 Effect Of li•it feeding High Energy Growing 100 Diets on Beef Cattle
88-22 Econ01tic Analysis of Using Mixing Equipt1ent 103 for Growing Heifers
88-23 Effects or Adain1stering Progesterone or . . . 108 Progesterone and GnRH Before Puberty on Age At Puberty and Reproductive Respone in Crossbred Beef Heifers
88-24 Effects of Corn Cob Additions to Corn-soybean . . 110 Meal Diets With and Without Added Synthetic lysine on the Perfor•ance of finishing Pigs
88-25 Effect of Space Allowance on Perforaance Of . . . 113 finishing Pigs Fed To A Heavier Weight (250 lb)
•

IN T RODUCTION . . . . . . . . . . . . . . Dale R . Sorensen, Mgr .
The Southeast Research Farm, located six miles west and three miles south of Beresford is open to the public year around . There is staff at the research farm each weekday that would be glad to show you oround, or feel free to look around on your own anytime. If you want to drive through on a weekend on your own. feel free to do so, or give us a call (563·2989) and we could arrange to meet you on a weekend to show you around at the farm. The farm is here for your use and to be used at any time .
What can I say about 1988 that hasn't been said on the news, at meetings. tours. and so on . It was quite unusual in that it was a very dry year, but at the time that we are preparing this report, we are approximately 4 . 5 inches below normal for precipitation in mid·Oecember . Everyone may find that hard to believe, but August and September rainfall made up for some of the shortage in June and July. The shortage of moisture was not as detrimental this year as the extreme heat was during June . But really, that is enough about the past. and we are looking optimistically forward to the next crop season.
The year at the research farm was again quite busy with many little projects going on around the farm and activities during the year. The year started off with a booth at the Oakota Farm Show in Vermillion. We visited with many folks from South Oakota. Iowa and Nebraska. In late March. the District FFA Livestock Judging Contest was held at the farm with several schools from southeast South Oakota being represented. In mid·June. a 4·H livestock Judging School was held here with a large number of students ranging in all ages from the area .
At the end of June a tour was held for Ag Chemical Oealers and representatives around the area and the following day was the annual twilight tour. This year. we had a big program and the turnout of 400 people for the evening was greater than we could have expected. The rest of the year saw several small tour groups coming to the farm during the growing season and our Fall field day in September . Attendance was down for the fall field day. but that was not surprising because many people were already involved in harvest at that time .
The research conducted each year and included in this report consists of many hours of work year around by staff from the main campus at SOSU and at the SE Research Farm . The efforts of everyone involved each year are greatly appreciated. Also, if anyone has comments or suggestions pertain· ing to our research, how we disseminate the information. schedule and run field day and tours, or any other matter, we would be glad to hear from you . Address correspondence to:
Or . Ray Moore. Director Ag Experiment Station sosu
Brookings, so 57007 (605) 688·4149
1
Dale R. Sorensen, Mgr . SESD Research Farm RR 3 Sox 93 Beresford, so 57004 (605) 563-2989

Table 1. Te•peratures at the Southeast Research Fara · 1988
Hon th
January February March April Hay June July August September October November December
1988 Departure FroM Ave Temperatures (F)8 36-year Average 36 Year Average
Maximum H1n1mum Max1mu1 M1ni•u• Maximum Minimum · - ·---- �------- � - �--·- -4- �--·------ � ------ ----- - - ··--· 21.4 25.5 48. 8 59.8 79.3 89.7 87. 0 87. 8 77 .1 58.8 46.0 35.8
0.0 4. 2
25.6 30.0 52.6 63.l 62.5 61.5 50.l 32.4 25.6 15.6
25.6 32.4 43.6 61.l 73;3 82.5 87.4 85. 2 75.6 64.3 40.5 31.0
4.3 10 . 2 22 .6 35.S 47.5 57.2 62 .0 59.2 48. 8 37. 6 24.2 10.8
· 4.2 · 6.9 + 5.2 . 1. 3 + 6.0 + 7. 2 - 0.4 + 2.6 + 1.5 · 5.5 + 5.5 + 4.8
· 4. 3 · 6. 0 + 3.0 · 5.5 + 5.1 + 5. 9 + 0. 5 + 2. 3 + 1.3 · 5. 2 + 1.4 + 4. 8
8 Computed from daily observat1ons ·--- --- · - - - -•
Table 2. Precipitation at the Southeast Research farm - 1988
Month
January f"ebruary March April May June July August September October November December
Totals
Precipitation 1988
(inches)
. - ... . .. _ ..
. 95
. 30
.52 2.58 2.04 1.45 .83
5.24 4.15
.28 1.68 . 14
20.16
'l
• • • • j9: ... -
36-year Average (inches)
. 48 .96
1.51 2.48 3.43 4.13 3.10 2.98 2.65 1.63 l .lO . 70
25.15
Departure from 36 year Ave. (inches)
+ .47 · .66 · . 99 + .10 ·1.39 ·2.68 ·2.27 +2.26 +1.50 ·1.35 +.58 · .56
·4.99

DATE O F PLANTING FOR CORN
Southeast farm Staff
Southeast Farm 88·1
Summary
Two corn hybrids (medium and late maturity range) were planted on five dates beginning on April 15 and ending May 25. Unlike past years, yield differences between planting dates in 1988 were not significantly different. The data seems to show that for either corn hybrid planted during the last week of April, yields were hurt more by the warm and dry weather in June than the other planting dates . Planting before or after April 25 showed slightly better yields for both corn hybrids, but not large enough differences to be significantly different .
Methods: Two hybrids were tested at five different planting dates in 1988. Pioneer 3732 and Pioneer 3377 were planted on five dates through April and May. Planting was started when field conditions would allow and soil temperatures were adequate for germination of corn A ten day interval was followed from the first planting date Table l reports all other management factors for the experiment in 1987 .
Tab 1 e 1 . Cr op_ Man�gem�r:it 1987 Crop Tillage Planting Rate Herbicide Phosphorus Nitrogen
Harvest
for Planting o�_t-� _St.��.Y. i_o _�_88. Soybeans Ridge· Til 1 24.100 Lasso Band 251 P205 2 x 2 starter 751 sidedress after emergence 75# at lay-by
_ Se_pjember _2 and Se_ptember _ 22 _
Results and_ D_iscussion: The weather in early 1988 again made it possible to start field work early in 1988. Conditions were quite good for the first planting date of April 15. The soil temperatures, at 2 inches on the first planting date. were daytime highs above 50 degrees F and lows were not falling below 40 degrees f. Unlike 1987. these were the first days that soil temperatures at the 2 ° soil depth had risen above 50 degrees F. On April 22 and 23 a small amount of snow fell, and the second planting date was the 25th of Apri) . On April 26, we received a heavy wet snow just prior to emergence of the first planting date. Stands were not reduced by the poor weather just before emergence of the first planting date. Table 2 reports yields for the 1988 growing season.

Table 2 . Effect of Planting Date o n Corn Grain Yield, SE Farm, 1988 1988.���������������
Pelati�e F!J.antJ�..9 D�t��·---� ij'lb:gig M.at1nl t:t AQf! l l� April 25 May 5 Mai! 1.5 M<1'r 25
bu/A@ 15% Moisture• PIO J732 101 60 50 55 57 51
P IO 3377 116 • LSD . 05 = NS
52._ __ 45 50 55
Comparing yields from 1988 to any one of the last three years of this study, indicates the limits the dry weather set on yield potentials . The heat units were there to grow a crop similar to 1987, but moisture was extremely limiting .
The data indicates that the weather had the largest effect on all the planting dates, but differences were not large enough to be significantly different . The earlier hybrid, for the first time, exhibited slightly higher yield levels than the late maturing hybrid for the first time across al l planting dates in 1986.
Table 3 reports average yields and the average planting date for 1986 through 1988 . One point to make is this is only three years' data. The first two years (1986 and 1987) were two above average corn crops and 1988 was below average . But, the data will begin to show trends that may hold up over the years. ror the early hybrid, the range of planting dates is wider than for the late hybrid. The first and third planting dates are significantly different from the final date in May. The trend for the late hybrid is fairly consistent from year to year . The first planting date is significantly different from the fourth and fifth planting dates, and the second, third and fourth planting dates are significantly different from the last planting date The differences between the May 4th and May 14th planting dates of 16 bushels is not significant, but individual years have shown us that normally this is the breaking point for this late of a hybrid . Grain moisture also goes up considerably, which is also an indicator. Most years we will see a yield decrease for a late hybrid like this when planting gets to be into the middle of May .
Table 3. Three Year Average for Planting Date ------=S=E:..... Farm, 1986·_1988 .
Study,
32
Hybrid
Pioneer 3732
Relative Maturitv
10 1
Ave r a a e .F.J. � n t i n g Q.c!. t � . Apr 14 Aor 24 May 4 11.�i_JJ� _
121 · bu/A@ 15%*
116 123 110
�a_y_j4
101
Pioneer 3377 116 143 140 13 9 123 94 • LSD (. 05) = 20 bu/acre for differences between planting dates within a hybrid.
ror more information contact: Dale R . Sorensen, Research Manager Southeast Research rarm, RR 3 Box 93, Beresford, SD 57004 {605) 563·2989

I�,� fl�
s.e.FARM ..... )
�/
PLANT POPULATIONS rOR CORN
Southeast Farm Staff
Southeast Farm 8 8 - 2
Summary
Seeding rates and hybrids were tested to determine what the optimum plant population for different corn maturity ranges would be for southeast South Dakota four hybrids were tested at f1ve different seeding rates . Grain yields in 1988 were considerably lower than the past few years . Due to the drought. yields were more variable than in past years as well, making comparisons between treatments more difficult. In general, populations did not have as large an effect as would be expected for the type of growing conditions encountered in 1988 .
Methods: Four hybrids were tested at five plant populations in 1988. These are the same hybrids and populations that were used for the past two years . The hybrids were Pioneer 3906 and 3732, and Curry•s 1466 and 1490 with actual seeding rates of 18400, 21900, 24500, 27900 and 30200 seeds per acre. Table 1 reports all other management factors for the experiment in 1988.
Toole 1987 Crop Tillage Planting Date Herbicide Insecticide Phosphorus Nitrogen
Harvest Date
ror Plant Popul�tinn Studv in 1989. Corn
Ridge-till April 29
Lasso (Band) Counter 1 5G
25# 2 x 2 starter 751 sidedress after emergence
75# sidedres s at lay-by September 2 &
September 2 2
Results and Oiscussion: Yield levels for 1988 were approximately one-half of yield levels in 1986. but the yields are better than what we anticipated during late June and early July . If the weather in late June would have continued into all of July, yield levels would have been decreased much lower than this . These yields were decreased to some extent because of the experiment being continuous corn rather than being rotated after soybeans . Again, as in 1987. the experiment was conducted with ridge-till methods which may also have contributed to yields not being reduced as much as would be expected. Table 2 reports yields for the population study in 1988.
s

Table 2. Grain Yields for Plant Pop ulation Study, __ SE F" �r_m_. _)_�e_a.
Hy b r i d s . D a k _ S � e d i Q g_ Ra_ t !L _ _ _ _ __ ]:!�!.._u r �-1L-.HL._4QQ _ _ _ 21
1 90Q. i 4 .L500 _ _1_7_,_9oq bu/A @ 15% Moisture �
PIO 3906 91 72 51 62 70
PIO 37 32 101 71 70 61 44
CURRY 1466 110 61 5 9 54 62
53
4 9
54
CURRY_l490 __ 114___ 66 47 42 45 48 • LSD .05 = 20 bu/A to compare yields between populations
within the same hybrid
--
Due to the dry conditions in 1 988, most P,xperiments on the farm had a larger degree of variability than in the past few years . This can be seen in the large LSD value at the bottom of Table 2 . The 20 bushel/ acre value is the number we use to compare the yields between populations for each individual hybrid. With that number being so large this year, it implies that we had a fair amount of variability making it much more difficult to make comparisons. For the earliest hybrid (3 906), there is a yield de· crease when increasing the population from 18000 to 21000 plants per acre; but this does not continue throughout the populations. The three remaining populations were not significantly different from the lowest population of 18000. This makes it real hard to determine if there are any true differences. or if differences are just random variab;lity .
r-ar t n�xt hybr1n (J73Z). tMt eld differences make a little more ser.se t1m1 l!'mrtJ t, �e •e woulc ··�r r or this type of year There is no ttlff,sr!!n�l'I be i;een lilt! ftl"S o po ulations, a slight decline in yield for Thr �1Tn µapul tlun, nu· nn significant, and a significantly lower yield f1Jr O,t. l'iJn 1-iigri;e!.L pl"ll'luil':J IPrJ� 1&1'!"1"1 compared to either of the two lower populations . The past two years have shown for this particular hybrid that the third population (24500) has optimized yields, with no sig�ificant yield increase at populations higher than this population (2 45nO), but being significantly higher than the lower population.
The h1�d nyhr,a (14661. a,a alse react similar to past years, but not al the s� � y,H1d l�v�1!. No $tgn�I leant yield differences were observed Uns. year ac: ro.s:s. an)• af tn� popul t Jons as was observed in past years . �Hh .1 1ta1ter ma"li.lr1n-g lWt:H ct ll�e thn, you would expect to see a yield deer� wit� in�re��lnu po�Llat10� This did not appear in 1988 and has not !men cbsf?rwid fn ot.'10- year:: e1tti1!r, nor did an increase in population inere:ae� yields ln uast ti!ar �hen nrowing conditions were more ideal .
The latest maturing hybrid in this study (1490), did react like we would somewhat expect for this type of growing season . At 18000 plants per acre the grain yield was 66 bu/acre with a significant decrease in yield occur· rioa Qt lne tn,rd p!rpu�et!on o 2450'J plants/acre. The second population did decr!a.SE! yields. Dt.it not �tgnH•&antly, indicating that increasing pogulatinn for this �,brld �as gn1ng t.o hurt yields in 1988 . The limita· tlan5 �n size af tt,,s exp.er, ent da� not allow us to have more treatments,
6

so it is hard to determine if a lower population for this hybrid would have been slight1y higher yielding or not.
Table 3 reports yield averages for the past three years for these four hybrids and five populations.
Table 3. Three·year Average Grain Yields for Plant Populations Stud�. SE Farm. 1988 . ------
Seeding Rate H!{bI id 18 ,_400 21�900 24 . 500 27 900 301200
. bu/A @ 15% Moisture• Pioneer 3906 114 113 118 128 122
Pioneer 3732 122 123 122 122 125
Curry 1466 130 125 133 127 137
Curry 1490 149 136 135 130 ��1=2=0"--���-• LSO .05 = 1 6 bu/A to compare yields between populations
within the same hybrid.
Statistical analysis of the data to this point shows no significant yield differences except for the latest hybrid ( Curry 1490) . The two highest populations are significantly different from the lowest population. The second population (21400) is also significantly different from the highest population ( 30200) .
This data is still not conclusive because it is only a three year aver· age. There was a significant response to hybrids in this experiment, as can be seen when looking at the first column in the table At 18000 plants per acre there is a substantial yield increase as the maturity range be· comes later . This would be expected when all these hybrids are planted on the same day and early in the growing season . If planting was delayed later in the grow;ng season. the late maturing hybrid would probably not yield as well . Another factor to take into consideration is that with the later maturing hybrids grain moisture will almost always tend to be higher in normal grow;ng conditions . The past two years this has not been a problem. but that can change again quickly and turn out to be more like 1985 when we had a cooler growing season and the late maturing hybrids barely reached physiological maturity and grain with high moisture contents was a big problem at harvest .
For more information contact: Oale Sorensen, Research Manager, Southeast Research Farm, RR 3 Box 93, Beresford, SO 57004 (605 ) 563·2989 .
" I

DATE or PLANTING SOYBEANS
Southeast farm Staff
Southeast Farm 88·3
Summary
Soybean yields were greatly affected by the weather conditions of 1988. Unlike 1986 and 1987 in almost all aspects. this year yield results were opposite of the past years• results. Yields in 1986 were highest with the earliest planting date, while 1987 displayed no real yield differ· ences between planting dates. Delaying planting in 1988 created much larger increases in soybean yields than would be expected.
es�o�3: T�f5 is rte lt1r� v�ar nf a long term study in looking at the efrec:t 101 ant Ing �.i1c h.u mi soyne-� yields in southeastern South Dakota. fbe atu.dy ilianJi�t� of ivo say�An varieties, {Corsoy 79 and Century 84) 't P'1ve dfffierent phrn'" mg dates, !!ach being ten days apart. As in the
DB�t the fi�r DTaritJ�� a�� 1� �l ghtly earlier than normal with the second date at about the normal planting date. and on through to June. Table 1 reports all management practices for the soybean study in 1988.
Table 1. Management Practices for Oate of Planting Soybeans SE Farm. 1988.
Tillage Fall Plow Past Crop Corn Herbicide Tre flan + Sencor/Lexone seeding Rate 60 lb/acre
��---H=-x-v....;es' Da � �����-=S=e�p�t"---9 �en 21, Oet 6
Pf>!
Harvest was over a much longer period of time in 1988. On studies such as these. timeliness of harvest is a very important factor. If harvest was held up for every treatment to reach �aturity we may bias the research one way or the other due to shattering, too low moisture, etc. This is why there was three separate harvest dates for this particular study. On September 9, the May 4th planting date of Corsoy 79 was harvested. The final four planting dates of Corsey 79 were harvested on September 21st. as well as the first planting date of Century 84. on October 6th, the remaining four planting dates of Century 84 were harvested.
�l!,],Ls: and Dfs�uis-toM; Soybean yields for 1988 were better than anttctµ t:ed am:1 planttng date effects were quite surpristng. Tab1e 2 r11:1p,:irts- SO)'hn.a.1, �ie1l1 and how they were affected by planting date in 1988.

Table 2 . Plan t ing Oa te Effec t s on Sep tember Yield s i n S o u th e a s t_S o u tti_ Da kq_t_�_J� Farm, 1988.
V arie ty i1a n tinq_ D a te -----------______ ...:..M.:..;:a::....v:.-4-'-----'MC.:...:::-a y _ l..!_ Ma v 2 4 June 3 J u ne 13
bu/A @ 13% Moisture• C orsoy 79 23 2 7 30 31 32 Centu�4._-.:28 2 5 28 3 1 2 4
LSD ( . 05) = 4 bu/acre f o�d iffere nces b e tween p la n ting d a t e s within a varie ty .
for the 1986 growing season, yields were significantly increased by earlier planting. The longer growing season of 1987 created conditions which showed little d ifferences between planting dates for planting soybeans e�cept for the May 29th planting date for Century 84 wh ich was significantly lower . The 1988 growing season produced the oppos i te results from those of 1986. Y ields gradually increased as planting date was delayed for both varieties in 1988, except the June 13th planting date for Century 84. This is not surprising because Century 84 1 s a l ate Group II soybean . What was surprising was that the June 3rd p lanting date maximized the y ield level for this variety as well as Corsoy 79 .
Weather had the greatest affect on early planted soybeans 1n 1988 when looking at the yield results. Also, when comparing between the two var ieties notice the yield difference on the first planting date (23 bu/acre compared to 20 bu/acre). The heat of June along with the dry conditions i nto July, did not have as large an effect on the Century 84 soybeans as compared to Corsoy 79 . But, as the planting date was delayed for Corsoy 79 yield levels began increasing when compared to the f irst date, delaying development of the crop to more ideal conditions in August when the heat subsided and rainfall was received.
Th i s study will be continued for several more years because of only three years of data, and varying results each yea r . One thing that we can learn from a year like 1988. is not to put all your eggs into one baske t . The r i sk of crop failure can be managed to a certain degree . The selection of soybeans with varying maturi ty groups and planting over a time period are just a couple of ways to manage that r i sk . The selection of various good, solid perform ing var ieties i s a much better way to manage crop risk than to go w 1 th that one hot, new variety that may or fflay not work for you with your management practices.
for more information contact : Dale Sorensen, Southeast Research farm, RR 3 Box 93, Beresford, so 57004 (605) 563-2989.
0

SOYBEAN VARIETY ROW SPACING
Southeas t farm Staff
SOUTHEAST FARM 88 · 4
SUMMARY
Yie ld results for the soybean var i ety and row - spacing study were at lower leve ls than past years . Again, the weather had a great deal to do with results of the study. Because of var iabi l i ty across the research s i te . some yield d ifferences were evident, but the variabi l i ty was too large to determine 1f these di fferences were due to row- spac i ng , o r if other factors were involved .
Methods : In 1988, the soybean var i ety and row spac i ng study was conducted off the research farm in a nei ghbor ing fi e l d . Pl ots were larger than normal, (25 ft x 200 ft) . Soi l test leve ls were adequate and an app l icat ion of phosphorus and potassium had been i ncorporated with chi sel p lowing in the fal l of 1987. The past crop in 1987 was sweet clover, and which we thought had been a good stand . After seeing the data and plots there must have been some d ifferences i n sweet c lover growth because soybean yields were highly var iable in 1988 and the soi l in the experi mental area was quite uniform.
The experiment was planted on May 12 and harvested on September 21 . Treflan + Sencor/Lexone ppi was appl i ed in Apr i l .
Resul ts and Di scussion : Resul ts for 1988 are i nconclusive and could have been affected for reasons di scussed in the method . These yi e ld results are reported in Tabl e 1 .
Table 1 . Soybean Yi e l d s for Variety and Row Spacing Study, SE Far m . 198�8.....;_· ��--,.��������������---
Vari et� Row - Spacing
bu /A @ 13% Moi s ture *- · · · · · · · · · - · · Corsoy 7 9 23 . 5 20.1 25.2
W�!l5 I I 23 . 3 • LSD ( . 05 ) = Not s i gnificant • • One m i ss ing plot
Over the past several years . the data has shown a defini te i ncrease in soybean yields with a decrease in row- spacing for these var i eties . Thi s year ' s resul ts are qui te di fferent i n that the wi dest row- spacing (36 N ) tended to yi e ld s l i ghtly higher than either the 30 inch rows o r 15" sk ip · rows. Agai n t as ment ioned ear l i e r , there was a high l evel of var iabi l i ty and the yield d ifferences are not large enough to be s i gnifi cantly di fferent .
1 0

In theory, it may be possible that wider rows could yield better when the weather was this dry because of less plants per acre compared to the narrower row spac ings . One of the advantages that has been stated of narrow row soybeans is that the rows cover earlier, keeping soil moisture from evaporating as easily, compared to wide rows . In 1988 this was not that critical because most of the high moisture use occurred during June when none of the soybean canopies had covered the soil surface
For further information co�tact : Dale Sorensen , Research Manager, Southeast Research Farm, RR 3 Box 93, Beresford, SO 57004 (605) 563-2989.
11

SOYBEAN POPULATION STUDY
Southeast Farm Staff
Southeast Farm 88 · 5
SUMMARY A soybean population study was i nitiated in 1988 to examine the effect seeding rate has on fi nal stands and y ie lds for soybeans. In 1988 . there was no crusti ng problem after p l anting. so the main factor examined was the effect on yie ld. There was no signif i cant y ie ld differences occurr ing in 1988 when looking at seeding rates of 119. 700 to 208,050 seeds/acre (40 to 70 lb/acre).
Methods: Many quest ions have been asked recentl y on the proper seeding rate for soybeans i n this area. In 1988 a study was estab l i shed to look at seedi ng rates for soybeans and to see how these rates handle adverse weather conditions prior to emergence. Corsoy 79 was sel ected as the variety to be used with seeding rates of 119 , 700, 148,200. 176.700 and 208,050 seeds per acre, which are the equivalent of 40 , 50 , 60 and 70 lbs/acre of seed. respectivel y . This is using seed that is the equivalent of 3000 seeds/pound which was the size for this particular l ot of seed i n 1988. The plots were a l l seeded at their respect i ve seeding rates that the planter would give . If the weather was wet and caused the soil to crust, we could therefore determine how each seed i ng rate performed under these conditions as wel l . Table 1 reports al l other management practices involved in the study .
Table 1. Management Practices for Soybean Population Study. SE Farm. 1908.
T i llage Past Crop Herbicide variety Planting Date Row Spacing Harvest Date
Fall Plow Small Grain Treflan + Sencor/Lexone PPI Corsey 79 May 18 30 inch September 9
Resul ts and Discussion: This is the fi rst year of this study and with the long dry spring there was no prob lem with emergence after p lanti ng. Crusting of the soi l surface after a hard rain can be a problem some years. but not the l ast coup l e of years. Depending on the soybean variety and its growth characteristics, it may be possible that seeding rates could be l owered a sma l l amount. But, if weather conditions created a thick crust would the lower seedi ng rate have enough seeds per foot to push through a crust , or would the h igher seeding rates be required to make it through a crust. Table 2 reports fi nal counts on a per acre basis for 1988 stands.
1 2

Table 2. S tand Counts for Soybean Popula tion S tu dy. SE r a r ir. ;55�
Seeding R a te Seed/ Seed{ · r1nal S tand P l a n ts / Fo o t lb/A Acre Foo t Plan ts/Acre
40 1 19 , 700 6 - 7 * 9 1, 258 50 148 , 200 8·9 * 117, 830 60 176 , 700 10· 11 * 141, 6 04
l.--j""o J"Q _208 G.:C _12- 13 l601S l! inch row
Table 2 is also broken into seeds per foot and final plants per foot for comparisons . With the type of planter we use at the farm, the stands turned out just ideally for this s tudy .
Table 3 reports yields for the study in 1988. There were no yield differences in 1988 due to seeding rate and final popu · lat ions.
Table 3 . Soybe an Yie lds for Soybean SE farm . 1988 .
See d i ng R a te
Populatio n S tu dy
Y ield
5 . 4 6 . 9 8 . 3 9 . 4
lb/Acre 40 50 60 70
bu/Acre�@,__,, 1=3�%=--���-27 27 26 2 7
The 60 lb/acre seeding rate was one bushel less than the other three seed · ing rates and is not significant, but just random variability .
This study should not lead anyone to believe that they could p l ant less beans and work out . This is only one year and the weather after planting could have a lot to do with the outcome of the results each year . Also, the characteristics of the soybean you grow can also have a great deal to do with the seeding rate . Some soybeans will make up for a shortage of plants by branching to fill in where o thers do not have that growth characteristic and without enough plants, may not reach their full yield potential .
For more information contact: Dale R . Sorensen, Research Manager. South · east Research Farm. RR 3 Box 93, Beresford, so 57004 (605) 563 ·2989 .
13

IN FLUENC E O F POTASSIUM. SULfUR, ZINC AND L I ME ON CORN
Jim Gerwing, Ron Gelderm an , D a le Sore nsen
Plant Science 88·6
INTRODUCTION
Some farmers in South Dakota are using potassium, sulfur , zinc and lime on soils which have a h igh soil test for these nutrients The sosu soi t testing l ab would not predict an economical response when soil test levels are high . Soi l testing lab comparison studies were conducted each year for seven years at the SE Farm near Beresford and at Brookings have shown that applying a combination of these nutrients as a g roup was not giving an economical response on corn. Each ind ividual nutrient alone , however, was not compared to a check plot. In 1987 , a demonstration was implement · ed at the Southeast Farm near Beresford, South Dakota to show the effect of each of these commonly used nutrients on a high fertility soil. No corn yield increases due to the use of potassium, sulfur, zinc or lime were noted . In 1 988, this demonstration was moved to another location at the farm where the treatments will be followed for several years in a corn-soybean rotation.
MATERIALS ANO METHODS
The demonstration was established on the SE Farm just west of the weather station . Soil type at the site is an Egan silty clay loam. Egan soil s are well d rained soils formed in silty drift over glacial till.
Soi l samples were taken to a depth of two feet in the spring of 1988. Samples were divided into 0·6 and 6-24 inch depths . The SOSU soil testing lab did regular and micronutrient analysis on the samples . Test results are reported in Table 1 Potassium and sulfur soil tests are considered adequate for crop growth and zinc is considered marginal to high . The pH is considered marginal here. A response to lime could oe possible .
14

Table 1 . Soil Lime
ttegj;lt! inches
0 - 6 6 ·1 2
11·24
Dei;i:t h inches
0 · 6 6 · 1 2
1 2 · 24
Test Levels 1988 Potassium. Sulfur. Demonstration. SE Farm
Rf!]Ulilf Soil "t!s\i ·9ii '4a, . 1i1 ?
- - -- - lD, fl 18 32 1 9 1 6 27 8
s ln
1( ... - - ... ... ....
580 450 430
Oth-e-r f£
s2u
O!:!
:, . 7 5 . 7 :, . 0 6 . 0 1 . 5 7 . 1
Tests. Mn �u
Zinc and
J�!.U mmho /cm
0 . 3 0 . 3 0. 4
C-1 Hg lb/A . . . . . . . . . . . . . . . . . PPM . . . . . . . . . . . . . . . . 38 . 88 43 3 1 l . 8 2858 646 38 . 49 40 30 l . 9 3192 758 64 . 16 29 21 2. 1 5494 918
The s i te had been in soybeans in 1987 {25 bu/A yield) and had been chisel plowed in fall. Secondary ti l l age (field cultivation) was done in spring 1•med1ately following broadcast application by hand of the ferti lizer and lime treat•ents on May 2nd. fertilizer and lime treatments ar, given in lobl e 2 Al l u�aiments- re-ce I v1H1 a 1 D5 ,ana 25 Tcrs FJ.,O. JH:J E:crre as a Slatter appl rec w l th the plan•er l ttenc� h��ilie ana ��1�� tha sat� Treatment 1 received no other fertili zer. Treatments 2 ·7 received an additional 115 lbs NIA. In addition to the N and P, treatments 3-6 re· �a-lv.ed 1rHtusr SO lm. K 0, 1S 1t,_s_ sulfur. 3- 1u:; _z inc or -4000 1bs l!fr�ttlwleea1c1u" car�ooa e e�u,ia1ent as l ime frQJII •ne s,all? falls �atar tr�,t�nl plant. The experimental design was a randomized complete block with 4 rep11cat1ons. Plot size was 15• by 50 ' .
Table 2 . Fertilizer Treatments 1988 Potas sium. Sulfur. Zinc iUH1 Lime Demanstrstiun_ SE :-@I:!?
f test. N-e N Pio_ K,;1
0 s ?l! _Ll me • • • • • • • • =! • • • • • • • � • • lb /A . . . . . . . . . . . . . . . . . . . . 1 8 25 0 0 0 0 2 123 25 0 0 0 0 ' 123 25 50 0 0 0 4 123 25 0 25 0 0 5 123 25 0 0 s 0 6 123 25 0 0 0 4000
15

Pioneer 3475 was planted on May 2 at 24, 100 seeds per acre. The herbicides and insecticides used were Lasso banded and 2,4-D at brown silk and Counter 15G. The plots were cultivated twice and combine harvested on September 6 .
RESULTS ANO DISCUSSION
Corn grain yields are listed in Table 3 . Extremely hot, dry conditions severely l imited y ields. None of the fertilizer materials, including nitrogen, had a significant effect on yield. Soil test levels for nitro gen were low and a response would have been likely if conditions would have allowed higher yields . The zinc soil test was . 88 PPM . A recommen dation by SOSU soil test ing lab for 5 lbs zinc is made for corn if the soil test is less than 1 . 0 ppm . The response to zinc in the medium soil test range ( . 5 to 1 .0 ppm) is not certain , however, and in this situation with extremely limited y i e l d , it did not result in a yield increase . Potassium and sulfur soil tests were h igh enough where a yield increase to these nutrients was not expected .
This was a very difficult year to evaluate nutrient responses because of very low yields . Crop response to nutrients is partially dependent on environmental condit ions, therefore these plots will be continued for several years. Hopefully moisture conditions will improve so we have a better test of crop response to these nutrients and lime at the SE Farm . The plots will be rotated to soybeans next year.
Table 3. Corn Grain Yie lds 1988 Potassium, Sulfur, Zinc and Lime Oemonstra w_Qn-, SE Farm------------
8 N , 123N, 123N, 123N, 123N, 123N,
50 K20 2 5 S 5 Zn 4000 lime
s lg" .l 'ri r: enc: e : prob ab i l i t y a t > r = o 2 o
16
Grain Xl�Jg B u / A 1 1 12
9 12 11 1 2

,ri3 1 , s.e. ::::-" }
"- RE�
Introduction
N ITROGEN MANAGEMENT DEMONSTRATION
J im Gerwin g , Ron Gelderma n, Dale Sorensen
P lant Science 88·7
There is increasing concern about the effects of nitrogen fertilizer on the environment, especially groundwater quality. This concern has been inten· sified by more numerous reports of NO -N concentrations above the legal drinking standard of 10 PPM in several locations in eastern South Dakota, especially where aquifers are shallow and soils very coarse. In some instances, nitrogen fertilizer moving below the root zone has been implicated.
This n i trogen management demons tration was established to show the effects of N rates and timing on nitrogen movement below the root zone . In most situations in South Dakota, if nitrogen moves below the root zone i t s tays there and only rarely moves back up . Therefore, once out of reach of crop roots it has the potential to move down to the groundwater with percolating water during periods of high mois ture .
Materials and Methods
The nitrogen management demonstration was established on the SE South Dakota Experiment Farm near Beresford. It is located on an Egan silty clay loam just west of the farm's weather station. Egan soils are well drained soils formed in silty drift over glacial till.
The previous crop at the site was soybeans which yielded 25 bushels per acre. The soybean stubble was chisel plowed in the fall . Soil samples were taken a t the site to a depth of 8 feet in the spring of 1988 and analyzed by the South Dakota State University soil testing lab in Brookings (Table 1) . Spring tillage consisted of a field cultivation immediately following broadcast application of the spring nitrogen fertilizer treatments.
1 7

Table l .
De2tn rec.f
"'
0 . . 5 . 5 l
1 . 2 2 . 3 3 4 4 - 5 5 6 6 . 7 7 . 8
Soil Tes t Lev e ls Spring, Oemong i-.. t-i!:On . s� FDT"f"'
'1'Q I :, .. - . --
2 1 21 24 1 2
9 7
10 11 14
p lb /A
30 18
6
K .. . - ... ..
540 410 380
1988 Nitrogen
Qt:! OH s a J t: .s mmho/cm
3 . 4 5 . 9 0 . 4 2 . 9 6.2 0 . 4 1 . 6 7 . 1 0 . 5
Nitrogen fertilizer treatments are listed in Table 2. All plots received 8 lbs N and 25 lbs P o
5 as starter 2 inches from the seed a t planting . The
recommended n i trog�n rate for a 140 bushel corn yield goal using the 2 foot deep nitrate test and 25 lbs N c redit for the soybeans was 123 lbs . All nitrogen applications were broadcast by hand prior to planting and incorpo · rated with one pass of a field cultivator except for the Split treatment . ln •n•s: rl!atffl8!'1t lO lb: '4 '!lo::; i1pp1 l ed pr ior to p lanting and 93 lbs N appl led ,, s i de-dress ti (..iune S) il'lrl incorporated by cultivation . Be · caus1f! ltt� stuliy lll8S .. tarted tn sprtnp the fall treatment (4) was applied 1n �ur1ny. In future years, tn:: s�uo>· will include a fall N treatment for coffloar-i =. .. n t-,:J spr l r1q ·, a;;,pl cat , Except for the 8 lbs l i quid N applied as a starter, all nitrogen was broadcast by hand as dry urea.
Table 2 . Nitrogen Fertili zer T re a tment 1988 ������N=i�t=rog·n oe�on�LZu'.on . SE Farm ����
· ·- - . T1�c at ApplA�at1 0� • • • • • _iJ--=-��a�t�.----�o--��--'S=p=r�l=n�g�·�'��� G;!l l t ' � Jl
1 2 3 4 5 6
· · · · · · · - - · · · · · · lbN / A · · · · · · · · · · · · 8
1 23 30
123 JI 200 400
93
!/ prio r to p �an t 1ng �ay . ) l J June 3
3 /
z l Tre a tmen t will be app lied in f a l l in futu re years .
Pioneer Hybrid 3475 was p lanted on May 2 a t 24,100 seeds per acre . Herbicides and insecticides used were Lasso banded at planting, 2,4 -D at brown silk and Counter lSG. The plots were cultivated twice and combine harvested on Sep tember 6 . Soils were sampled to a depth of 4 feet on September 12 and ana1yzed for nitrate nitrogen a t the SOSU soil testing lab.
18

Resul ts and Discussion
Corn grain y ields are l isted in Table 3 . Yields were l i m i ted by extremely hot, dry weather . There were no significant differences i n y i e l d , due to ei ther n itrogen rate or timing. Hopeful ly in future years of this demonstration, weather condi ti ons wi l l improve so there wi l l be a larger ni trogen demand by crops , which is necessary to determine which appl ication times wi l l result i n more effic ient n itrogen fert i l i zer use .
Table 3 . Corn G r a in Yields 1988 Nitrogen Demonst r a t ion , SE Farm
Tre atment lbN / A Timing
8 123 123 200 400
(check) spring spl i t spring spring
Corn Yield bu / A
16 18 18 2 1 17
S ignificance ; p ro�Bollity of > ··C 20
fal l ni trate soi l test levels to a depth of 4 feet are presented in Table 4 . As n i t rogen ferti 1 i zer rate i ncreased from 8 lb to 400 lb/A, total ni trate in the 4 foot soi l profi l e i ncreased from 66 lb to 274 lb/A. Most of the residual ni trate measured , however, was i n the top 6 i nches of soi l w i th only very smal l i ncreases i n the 2 to 4 foot soi l depth. This i ndi cates ni trate n i trogen movement below the root zone was not a problem this yea r . This confi rms what has been noted in South Dakota i n past years; when cond i tions are dry . n i trogen l eaching is not a probl em. In years w ith more precipitation. however . more leaching would be expected.
This demonstration wi l l be cont i nued over the next several years to watch n i trogen movement i n soi ls, dur ing years w i th l a rger amount of precipi tation. It wi l l be these types of years where n i trogen management ( t iming and rates) wi l l have an i nfluence on how much n i trogen moves through the soi l .
T able 4 NO - N Soil Test Levels fall 1/ 1988 ����---=N=itrooen Demonstra ti on, SE Farm
�_fl.Qt Iii inches
0 · 6 6 · 1 2
1 2 · 24 2 4 - 3 6 3 6 · 48 Total l/ Sampled
fer U 11.:e_r_ N agalied s - - ... . .. .. . ..
19 6 9
1 4 18 66
September 12
123 200 Soil N 0
3· N , lb/ A
47 63 14 3 2 17 23 2 1 22 27 27
126 167
19
lb/A
.:.oo
153 3 5 2 9 2 5 32
274

fALL V ERSUS SPRING N I TROGEN APPLICATION ON CORN
Jim Gerwing, Ron Gelderma n. Dale Sorensen
Pla nt Science 88·8
Int roduc t.i.Q.D
Most nitrogen fertilizer used on corn in South Dakota i s applied i n spring . There are some advantages. however , to fall nitrogen applica tions . Some of these are : l) lower N prices 2) more time for both farm ers and fertil izer dealers to do a good job soil sampling and spread ing fertilizer and 3) less compaction due to dryer soils in fal l . One concern that many farmers have is that fall applied N will be lost, especially by leaching, before the next years crop resulting in lower crop yields. This demonstration was established in the fal1 of 1987 to look at the differ · ence in corn response to nitrogen applied in fall versus spring.
Material and Methods
The demonstration was established on the SE South Dakota Experiment Farm near Beresford in the fall of 1987 . The soil type at the site was a Whitewood silty clay loam . Soil samples were taken in the fall to a depth of 2 feet . The results of soil tests are given in Table 1 . The 2 foot n i trate test was 33 lbs/A . The 1987 crop at the site was soybeans which y1eidea 2; bu.sn�ls �er acre Tn; soybean stubble was chiseled on October 28. Fa1 1 t epp1 ica 1o�s w�r� .:tpread on the surface on November 4 and rnc::orpcirute.d by l:iis,C i ng on NCIVCl!lh!f 5. Spring nitrogen treatments were .tJraaClcHt cm He!;' 2 ancr l'llfflediate·y f ncorporated with a field cultivator . Ure� wa3 the n � trogen savr�e for tRJt.h spring and fall applications. Nitrogen rates for both times of application were O, 40, 80 , and 120 lb nitrogen per acre. All plots received 8 lb N and 25 lb P O as a starter at planting . A randomizea complete back design was used �ith 4 replica · tions. Plot size was 15 eet by 60 fee t . Pioneer 3475 was planted on May 2 at 24 ,100 seeds per acr�. Yields were determined by combine harvesting on September 9 .
T 11t:IJ,,,e l, Sot! rr:u levels� ra Lt.L s;,.n.119 N Demons tr a t. ,_en
cegtn ND::· N E K tlH IHI Sa.J ts
l n . al l ti J A. m h O ' C lfl . . . 0 · 6 12 14 550 3 .5 7 . 2 0 . 5 6 ·24 21
2 0

!3t,5yJ ts amJ Oiscumen
Corn grain yields are given in Table 2. r�treme1� �r� canditfons l 1 mfte� y lt!-l c1S to ::.1tmtn !ilO ous-he'' ui p-e utre lneri: was 110 y1e-H:I te..5l)ClrT!i--e ·ta tt.l!' edrlau ni trttgen fn� "i trnt� 1 n �a l ptu� tnai wn•eh Da:-Ame· a�� l l abl� From the soybean residue was adequate to produc-e tt:dirum y 1 eJ!l '1¥ 1 thoui:: .erJd1ng ferti l izer N. Under more normal con11 l t cm?. ii Yil!lcl respcms:e to �cfdeil � l lroggn �ouid have �een �Kp:eetffif. B:ecau:5-e' -u,era �as n� respnnse to ff frarti 1 1 z:Cr, no d"lfrere:m:::E tre ween 11 1 1 Bnt! sptin� ap_pf1t!.Dit1 Cnlii WOuld IJI! expected. Plans are to repeat these appH-c;aUon.s ln future yt-.grS, to IJela determine i f fal l and spring N app l i &.attan.s � 1 1 result n -ettYol yi� l �s
Table 2 . Corn Grai n Yields , rall v s . Spring N Demonstration Beres ford, SD 1988
Nitrogen rate lb/A
0 40 80
120
Significance
Time of Application rall Spring • • • • • • b u / A • • • • • • ·
· · 3 7 • • • · · • • • 4 1 34 42 40 33 32
N rate : NS N timing : NS
21

S.E. FARM REPORT .....___.,,,
TILLAGE AND ROTATION EFFECTS ON S2IL PHOSPHORUS AVAILABILITY TO CORN
Manjula Vivekanandan and P. E. rixen2
Plant Science 88 ·9
Today's corn producer performs less tillage than in the past and p redictions indicate that even less will be done in the future . Changes in management practices involving different tillage and residue incorporation practices alter the dynamics of organic matter turnover in soil and may influence the supply of plant nutrients. To maximize efficiency, it is critical that information be available to guide fertilizer management adjustments for specific tillage and rotation systems . A tremendous amount of r esearch on this aspect has been conducted on N management, but less rese�rch has been conructed with respect to P management . Studies carried out in St th Dakota (Fixer . et al., 1987 ) ind i cated that no till ( NT) systems may require a lower P so i l test level for maximum economic yield than plowed systems They reported that where annual P app 1ications were broadcast, the soi ' test P level required for 95% of maximum corn yield was 15 lbs/A l ower in NT than in chisel or moldboard plow (MP) systems .
The "fal low syndrome " is a phenomenon that has been recognized in the northwestern corn belt for many years . Past experiences have shown that severe early grow th problems due to P deficiency of corn occur when this crop is planted in a field that has been fallowed the year before . A study conducted in southeastern South Oakota showed that soybeans likely experience a similar growth p roblem but to a lesser degree than corn (Fixen et al., 1984) . The question remains as to what specific effect fallowing has on P nutrition . Mycorrhizal (a benefic i al root fungus) associat ion and labile o rganic P could be the two possible factors involved .
W i th these factors in mind, a study was initiated in 1986 with the following objectives : To determine the influence of tillage and previous c rop on
1 . soil P availability to corn ;
2 . labile inorganic, labile organic and soil solution P fractions ;
3. and on mycorrhizal infection levels of corn
1 Research supported by Pioneer Hybrid International and SOSU Agricultural Exper iment Station .
2 Grad . Research Ass i stant and Associate Professor, Dept. of Plant Sci ., South Oakota State Univ . • Brookings, so 57007 .
2 2

METHODS
A field study was conducted on a Viborg silty clay loam (Haplustoll) soil in southeastern South Dakota. These soils are deep, friable, moderately well-drained soils developed in a silty cap over glacial till. The study was l aid out in a sp1it·plot randomized block design with four rep l tcations . Five different cropping systems namely MP corn -fallow, MP corn-barley, MP continuous corn, ridge plant ( RP) corn -soybean, and RP continuous corn were established in 1986 . Each plot was split and soil test levels of 24 lbs/A and 89 lbs/A were established by applying O and 520 lbs P20
5/A as TSP . Along
with the P treatments, 20 lbs Zn/A was also applied . The study area was planted with Pioneer 3475 on April 23 in 1987 and May 2nd in 1988, at the seeding rate of 24,500 seeds/A. A split application o f liquid nitrogen as 28·0·0 was made at th� rate o f 75 lbs N IA at emergence and another 75 lbs N/A at lay-by stage . In the RP system 6·8 11 ridges were bui l t during final cultivation (corn 18" tall). Corsoy 79 soybeans and Bowman barley were used in rotations.
Parameters measured were early dry matter production and P uptake , date of silking, grain yield, grain moisture and stover yield. Soil and root samples were collected periodically at different growth stages of corn (V2, V6, V12, Rl and R4) from all treatments. Soil samp les taken at depth increments of 0 -2 ", 2· 4 " and 4-6 " were analyzed by Bray and Kurtz No . 1 P (Bray and Kurtz , 1945), mineralizable P ( 0 . 5 N NaHCO e�tractable organic P ; Bowman, 1986), soil solution P (Aslyng, 195�) and soil so l ution organic P · O . O!M CaCl extractable organic P. Root samples were estimated for mycorrhizil infection rate using the grid intersection method (Giovannetti and Mosse , 1980) after cleaning the roots and staining them with trypan blue (Phillips and Hayman, 1970). Corn yield was determined by hand harvesting of 20 foot o f the center two rows .
Since the 1987 and 1988 growing season were quite different, key weather parameters for the experiment site are given in Table 1 and Table 2 .
Table l . Growing season temperature data at SE site .
Temperaturr:. { F) 1987 1988
Departure from Departure from Month Averaae 35 yr avQ Average 36 yr avg
Mi n7 Max . Min. Max . Min . Max . M 1n. Max .
April 67 . 5 38. 1 +6 . 4 +2 . 5 59 .8 3 0 . 0 ·1. 3 ·5.5 May 77 .2 53. S +4 . l +6.1 79 . 3 52 . 6 +6.0 +5 .1 June 85 . 0 59.2 +2 .7 +2. 1 87 . 7 63 . l +7.2 +5.9 July 85.5 64.3 ·1 . 9 +2 . 3 87 . 0 62 . 5 -0. 4 +0 . 5 August 79 .9 57. 1 ·5. 3 ·2. 0 87 . 8 61 . 5 +2. 6 +2 . 3
Source: SE Farm, Ag . Experiment Station, sosu,
23

Table 2. Growing season precipitation at SE site.
Pre.r:;1jj'1 Wl l on ( lncnes) 1987 1988
Month
-Oep from ·--Dep from
Total 35 vr ava Total 36 vr ava
April May June July August April ·Aug
0 . 50 3 . 15 3 . 58 4.75 1 . 42
13 . 40
-1.98 ·0 . 32 -0 .62 + l . 59 - 1 . 49 ·2.82
Souri;e-: SE Far ... , Ag . Exper,�n::. Ste ton. SOSO
RESULTS AND DISCUSSION
Early Growth Response
2.58 +0.10 2 .04 - 1 .39 1 . 45 -2-68 0 . 83 -2 .27 5.24 +2. 26
12. 14 -3 . 98
Substantial early growth response to P was observed in nearly all cropping systems at the six leaf stage in 1987 and 1988 (Table 3 ) . Relative early growth responses averaged over both years were 367%, 91%, 56%, 5% and 26% for the plowed corn-fallow, plowed corn-barley, plowed corn-cor�. ridge tilled corn-soybean and ridge tilled corn-corn systems, respectively. In the ridge plant system, the response was lower than in the mold�oard system. The ranking of early dry matter response agrP-ed with the theoretical expectations based on mycorrhizal relationships ( Table 4 ) . Early growth responses to P were inversely related to mycorrhizal infection ( F i g . 1 ) . Mycorrhizal infection was highest i n the R P system when compared to MP and within MP system the fallow-corn rotation had the lowest percentage of infection . The physical disturbance of the intensely tilled system and lack of potential host plants in the corn-fallow system could be reasons for low infection rates in this system. The role of mycorrhizae in improving P nutrition of plants has been reported by many researchers ( Kahn , 197 2 ; Sanders et al ., 1975; Kucey and Paul, 1980 ; Reid, 1984) . Most of the beneficial aspects of mycorrhizae in mineral uptake are those related to increases in surface area effective in ion absorbtion ; which is an important factor influencing plant response to P fertilizer .
Table 3 . Early growth response of corn to P as effected by cropping systems. 1987 · 1988 ______ ----==---:----=---,-,--=-------
T i l l age Previous Early Growth Response System Crop 198, ]988 ,v:q . ..__........._ ______ ���-----...... ..._-------=.=.-= . . . . . . . . . . . . . %-·----·------··· Moldboard Fallow 384 350 367 Moldboard Barley 119 62 91 Moldboard Corn 53 59 56 Ridge plant Soybean 8 2 5 Ridge plant Corn 23 29 26
Ory matter prollllction at 6-lea� stage expressed- s ( P520 - Po) 'Po x 100
24

. 0 "' 200 fl!
FIG. 1 MYCORRHIZAL INFECTION VS
Cl
EARLY GROWTH RESPONSE OF CORN TO P(V6)
D 1997
• uss
,..i.....��-.-���.--��--��-:-.......;;==-� • $ to ts 20 � ROOT LENGTH INFECTED, %
Table 4. Influence of resi dual P on mycorrhizal i nfect1on of corn i n five cropp ing systems, 1987·1988.
Tillage
Moldboard Moldboard Moldboa·rd Ridge plant Ridge plant
Previous Crop
Mycorrhizal Infection at V6
1987 t 1988 Po Ps20 Pa P520
· · ··- -·�·----- - --
Mycorrhizal Infection at Rl
Fallow 6 9 2 19 21 10 Barley 13 21 7 32 29 14 Corn 18 22 10 40 31 15 Soybean 23 28 13 50 43 20 =Co=r�n���2=5c..._��� 25<--__,,l=l�--"'-'51:ee_����4=2�-1=6 LSO . lO 5 . 1 4. 1 3. 2 6.3
� Applied in the fall of 1985. % of root length infected.
2 5
..
Grain Yield Response
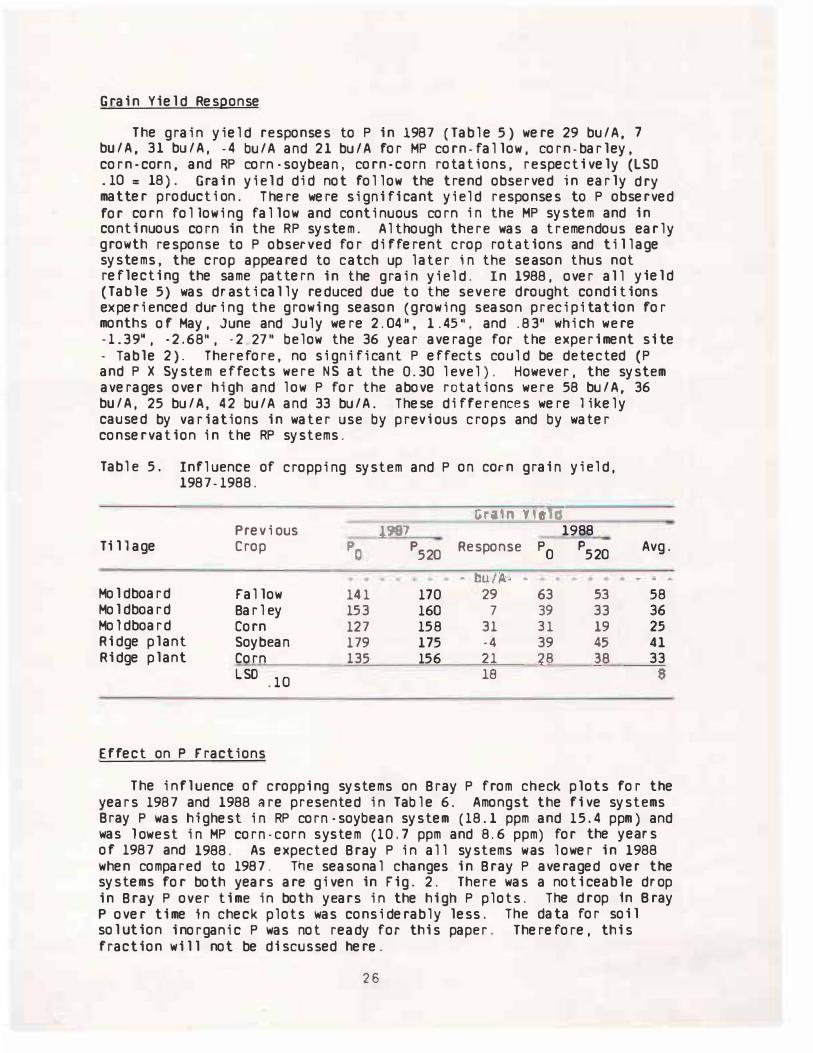
The grain yield responses to P in 1987 (Table 5) were 29 bu/A. 7 bu/A. 31 bu/A, -4 bu/A and 21 bu/A for MP corn-fallow, corn-barley, corn-corn. and RP corn-soybean, corn-corn rotations, respectively (LSD . 10 = 18) . Grain yield did not follow the trend observed in early dry matter production . There were significant yield responses to P observed for corn following fallow and continuous corn in the MP system and in continuous corn in the RP system. Although there was a tremendous early growth response to P observed for different crop rotations and tillage systems, the crop appeared to catch up later in the season thus not reflecting the same pattern in the grain yield . In 1988, over all yield (Table 5) was d rastically reduced due to the severe drought conditions experienced during the growing season (growing season precipitation for months of May, June and July were 2 . 04 ", 1.45 " , and .83� which were · 1 .39�, ·2 .68", -2 27 " below the 36 year average for the experiment site · Table 2). Therefore, no significant P effects could be detected (P and P X System effects were NS at the 0 .30 level) . However, the system averages over high and low P for the above rotations were 58 bu/A, 36 bu/A, 25 bu/A, 42 bu/A and 33 bu/A . These differences were likely caused by variations in water use by prev ious crops and by water conservation in the RP systems.
Table 5 . Influence of cropping system and P 1987-1988 .
Previous J,967 Ti 11 age Crop PC p520
Moldboard fallow 141 170 Moldboard Barley 153 160 Moldboard Corn 127 158 Ridge plant Soybean 179 175 Ridge plant Corn 135 156
LSO .10
Effect on P Fractions
on corn grain yield,
Gra:t 11 Y f afo 1988
Response PO p520 • nut P. - �
29 63 53 7 39 33
31 31 19 .4 39 45 21 28 �8 19
Avg.
. . �
58 36 25 41 33 8
The influence of cropping systems on Bray P from check plots for the years 1987 and 1988 are presented in Table 6 . Amongst the five systems Bray P was h ighest in RP corn-soybean system (18 .1 ppm and 15 . 4 ppm) and was lowest in MP corn -corn system (10 .7 ppm and 8 . 6 ppm) for the years of 1987 and 1988 . As expected Bray P in all systems was lower in 1988 when compared to 1987 . T�e seasonal changes in Bray P averaged over the systems for both years are given in Fig. 2. There was a noticeable drop in Bray P over time in both years in the high P plots. The drop in Bray P over time in check plots was considerably less. The data for soil solution inorganic P was not ready for this paper. Therefore, this fraction will not be discussed here.
26

FIG. 2 SEASiO.NAL CHANCES lN BMY P
Slfflll ,VWG!S SH? SYSl'III A1EIIAGl'3 1168 1------------- --- ..... •
H
ill I!
..... IIQ .
x • .. ..
�· • •
fL.-- ----•V ---,ai--_ ... :Iii =-:Q
I+---.-��...-----��
-e- am ..........
il+------------------1 I M • ff • • I • • • •
DlYS Anll l'UlmNC DAYS mEI PUNTING

Table 6. Influence of cropping systems on the seasonal average of Bray and Kurtz P i n the check plots.
T i l l age
Moldboard Moldboard Moldboard Ridge plant Ri dge plant
Pre" f ous.. crop
Fa l low Barley Corn Soybean Corn LSO . 10
Year 1987 1988
B.rav P. ppm -
14 . 7 12 .9 12.8 10 . 7 10 . 7 8 . 6 10 . 1 15 . 4 13 . 1 11 . 4 3 . 3 4 . 7
The effect of cropping systems on m inera l i zable P in check plots i s gi ven i n Table 7 . In both years , the mi neral izable P was hi ghest i n RP corn-soybean rotation and was fol l owed by the MP corn ·barley rotation. The l owest m inera l izable P was found in the MP corn-corn rotation. It is interesting to note that the grain y ie ld responses in 1907 were inversely related to minera l i zable P at a l l planting times (Table 7 and Fig . 3) . M 1neral izab1e P appears to play an i mportant role i n determin ing grain yield response i n these systems.
A l l P fractions (Bray P and mineral i zable P) measured and aycorrhizal infection rates were hi ghest i n the RP corn-soybean rotation making 1 t a favorable rotation for P management.
Table 7 . Influence of cropping systems on the seasonal average of m 1neral izable P i n the check plots.
Tillage
Moldboard Moldboard Moldboard Ridge plant Ridge plant
Prt*' . O'JE Cru.@
Fal l ow Barley Ccrn Soybean Corn LSD
. 10
28
V!Ar 1987
"11 neraJ1Jib le Ji I
25 . 4 30 . 8 25 . 6 38 . 4 28 .4 5.3
12§!! ppta -
30 . 8 35.4 27.6 36 . 1 3�....§ 8 . 8

FIG. 3 YIELD RESPONSE VS MINERALIZABLE P A\.ER,GED O\'ER TIME. 1987
�,a.1.-------�-----i ft • •
ltlNEP-WZABLE P, PPI
29

S.E. FARM REPORT
EFFECTS OF STARTER FERTILIZATION OF CORN UNDER VARYING CULTURAL ANO ENVIRONMENTAL CONDITIONS. 1988
Paul E. Fixen and Brad G . Farber
P 1 ant Science 88·10
Few agricultural areas of the United States contain the diverse set of climatic conditions found in South Dakota . The warm humid environment of the southeast corner grades into the semiarid central and western reaches of the state . South Dakota farmers grow corn in the most variable climate found in the corn belt. Yield levels vary tremendously across years and locations . ranging from no grain (harvested for silage) to over 200 bu/A .
Superimposed on this variable climate we find an increasingly diverse set of cultural practices. Areas that have historically been moldboard plowed now may be chisel plowed. disked. ridge planted with no additional tillage, or even p l anted with no tillage at all . Most information available indicates that an increase in this diversity is likely in the future .
The efficacy of starter fertilizer on corn in South Dakota. at this time, is exceedingly difficult to predict. Recent studies in South Dakota have shown that the importance of starter fertilizer increases when tillage is reduced. However, other data shows that under certain environmental condi· tions, starter fert ili zation can actually decrease corn yields . A need exists to better predict the probability of both positive and negative starter responses under the variable climatic, cultural , and soil conditions of South Dakota .
Objectives :
1. Develop a model based on field data that predicts early season corn growth response to starter fertilizer .
2 . Develop a model that predicts the portion of early growth response that c arries through to total dry matter production at maturity and grain yield .
3 . Develop starter response probabilities for geographic regions of South Dakota.
Methods :
Arrangements were made with cooperat i�g farmers to plant the experiments . Two treatments were included at each of 9 sites (with and without starter) and planted in strip s across the field . The paired strips were repeated four times to provide an estimate of natural variability . A multitude of soil , crop, and weather parameters were measured and cu ltural practices were
3 0

recorded in order to describe 1n detail the total environ•ent of each site. Some of the parameters are reported in Tables 1 through 4.
Results:
Site locations and cultural practices are recorded in Table 1. Four sites were r idge planted , two were in disk systems. two wer� in chisel systems, and one was pl owed. Residue cover varied from a l aw of 31 to a high of 45% for an irrigated site.
Soil test results are shown in Table 2. Soil test P levels are reported incremental ly to a 12-inch depth and vary from 5 . 5 ppm (low) to 55 ppm (very high) for the 0 ·6 11 depth.
iitb l !! .L S.i ti! 1 acat1 0ll6 arrd 0\11tural e.ract1cu. Tillage1 Residue2
Site Pl anting Relrtive Prev. �o. (n11n1.� �re I'{� c, 1" 1 (I JUrtUrl t:i sig.-tea ctgs 'COJ:!r
Oa.y:£:
3788L Clay 5/2 P 3475 108 RP Soy 24 3788H Clay 5/2 P 3475 108 RP Soy 24 7088 Hamlin 5/3 P 3737 100 MP Barley 3 7188 Union 512 P 3475 108 RP Soy 25 7288 Hand 5/14 J 5400 105 DK Wheat 20
7388 Hutchinson 5/4 Keltgen 105 CH Wheat 4 7788 Lake 4/28 P 3475 110 RP Soy 45 8288 Beadle 4/29 K 2750 112 DK Sudan 25 8688 Roberts 5/5 S 1701 101 CH Soy 16
1 2 MP = mol dboard plow , CH = chisel p1ow. OK = disk , RP = r idge pl ant
After planting.
Table 2. Soil test results at planting and soil bulk densities.
S I le: Ntl t
3788L 3788H 7088 7188 7288
7388 7788 8288 8688
1 In
NO · f4 O -i ·9 1-i1
··lbs/A- - -96 29 96 29
120 21 75 16 56 34
67 46 95 23 84 67
163 47
IJrgfffl 1.., M ter
% 3.9 3.9 4. 5 3.8 3.8
3.2 4. 3 1.6 4.7
row cf growth stage V12.
surra,ce Ext. �H K
ppll 6. 5 360 6 . 5 360 6 . 9 335 6 . 9 288 6 . 2 530
6.4 465 5.7 203 6 . 2 243 7.5 253
3 1
su�· rJ:m)SiU,l
0·611 6-12• 3 ···glc• · · · ·
1.15 1.23 1.15 1 . 23 1.03 1.13 1.25 1.19 1.33 1.40
1.28 1.42 1.07 1 . 17 1.45 1 . 63 1 . 17 1 . 27
er:ay J P w 0 ·3 1 3·6° 6·12'
· · ···ppm· ······ 6 5 4
13 12 10 17 20 18 23 5 s 53 45 18
46 19 6 69 28 13 59 48 33 26 24 21

The 1988 corn growing season was dominated by the data shown i n Tabl e 3 . Hti�n c f tn..e stat� e�p!!r1enc!d hat dr condi tions i n May. June and part of Ju i � . Eva, though ra1n ffnal l y f�1 1 auring July and August, i n many cases i t ,,r.11.!I tcio::i 1 u, b:l b1mB r l t t:.t,� c-ap. ln l s i s i l lustrated by Figure 1 . The sum or M6y inti June pret:1p1 t..Gtian expi ir.ed 98% of the var i abi l i ty i n corn yie ld of ttte- §tarte trE":i ants aero�� •n� · 9 s ites. The regression analysis i l l ustrates that grain yield increased 62 bu/A for every i nch of prec1pita· tion up to two inches. This unusual l y l arge response to water at fi rst seems imposs ib l e . Howeve r , suffic ient water dur i ng this period could have al lowed the pl ants to ut i l i ze the rain occurring l ater i n the region . Insufficient water early l ikely had severe negative effects on the number of rows of kernels per ear (set by the Vl2 stage) and poss ib ly number of kernel s per row (set by V17) . These data i l lustrate that cul tural practices that conserved water dur i ng the early part of the season could have had dramatic effects on grain yie ld i n 1988 .
. ;
�
FIGURE 1 . INFLUENCE OF EARLY SEASON PRECIPITATION ON CORN
YIELD OF ST.ARTER TREATMENTS, 1986.
200 -
180 160
140
120
100
80
60
40
20
0
0
Y=-6.5+62.SX
n-7, r2 ==0.98
Y=88.3+ 12.3X
n=3. r2= 1 .00
2 4 6 8 10
MAY + JUNE PRECIPITATION. INCHES
3 2

Table 3 . Precipi tation and water use .
t rr igat tOf'l1 So11 [st I
Site Jlrc•ing season ertt1Q tatior or wat2r water Check No . May June July Aug. Sept . Total lib!: u�e bu/In
- - • a • • • • • - • • -• - - 6 - - -- • • Inches----- · · · · ·-- - - -- · · - � · - · · - · - -
3788L 0.0 1.5 0 . 8 5 . 2 0 . 0 7 . 5 3 . 7 11.2 7 . 1 3788H 0.0 1 .5 0 . 8 5.2 0.0 7 . 5 4.1 11 . 6 6.9 7088 3 . 8 1 . 7 1 . 1 4 . 1 0.25 11 .0 5 . 4 16 . 4 6 .6 7188 0 . 5 0 .8 0 . 7 4 . 8 0.0 6.8 3.9 10 . 7 5.3 7288 0 . 0 0 . 6 6 . 1 1 . 7 0 . 0 8 . 4 3 . 0 ll.4 3 . 0
7388 0 .0 0 . 8 0 . 5 2.0 0 . 0 3 . 3 6 . 7 10 . 0 4.3 7788 2 . 4 6 . 4 8 . 1 11 . 8 2.0 30. 7 1 . 4 32 . 1 6 . 2 8288 4 . 2 0 . 5 1.4 1 . 1 0 . 0 7 . 2 10. 4 17 .6 7 . 6 8688 0 . 1 0 . 6 0 . 8 3 .2 1 . 8 6 . 5 4 . 3 10 .8 3 .9
; Between in i tial and f;nal soi l moisture samp les . Initial - Final soi l water content, 0 ·4 ft .
The l ocation and rate of starter nutrients app l i ed are shown in Table 4 and response i s summarized i n Table 5 . Even though May and June were abnor mal l y warmer i n 1988, large and consi stent ear l y growth response was measured. Thi s may have been caused by unusual l y large shoot/ root ratios caused by the el evated temperatures resu lt ing i n an i ncreased demand for nutri ents per unit of root l ength. Under these condi tions, a concentrated band was l ikely necessary to meet the plant demand.
Table 4 . Ferti l i zer appl ied at each site .
S l t.e Ne . Locati on1
starter
Inches - - · - · · · ----·-·-- · · - - · -·-l bs/A· ·-- · - · ---- · · ----· · - · · - ·
3788L 2x2 7 25 0 157 0 3788H 2x2 7 25 0 157 0 7088 2x2 12 41 0 112 0 7188 Oxl 12 41 0 72 0 7288 OxO 6 19 0 106 34
7388 3x2 5 15 5 63 40 7788 2x2 14 39 17 234 0 8288 2x2 8 27 0 85 20 8688 2x2 8 32 16 108 0
1 Posit i on of band relative to seed (to s i de x below)
3 3
0 0 0 0 0
17 0
40 0

Grain yield i ncreases of 13 bu/A were measured at two sites while no yield decreases were detected. One of the sites showing a yield increase had a Bray 1 P test level of 54 ppm ( 107 lbs/A) which is extremely high. This result is 1 n agreement with other studies conducted from 1 984 to 1986 in eastern South Dakota which indi cate that starter response by corn i s 1ndepen· dent of no1 1 test level. Total dry matter production (silage y ield) was increased at three sites by use of starter fertilizer.
Table 5. Starter effects on early growth and yield,
s t·ei Nt:1.
3788L 6. 8 7.8 15• 79 3788H 7.3 9.0 23* * 80 7088 2. 6 3. 6 38** 108 7188 6.4 9 . 4 47** 57 7288 4.8 7 . 4 54** 34
7388 8.4 12 . 4 48* * 43 7788 5. 0 7 . 3 46** 190 8288 3 . 1 6 . 8 119 ... 133 8688 3.3 3 . 8 15"* 42
** Response signifi cant at 0. 10 level_ * Response significant at 0 . 20 level.
Summary :
82 3 83 3
109 1 70 13*
28 - 6
42 - 1
196 6 146 13°
45 3
1988.
T�tal Ort M.!.t.t!.c_ Ch�sl Start.Qr R�sp.
- - 1000 1 bs I A · · %
8.9 9 . 2 3 9 . 0 9 . 4 4
10.0 9 . 8 ·2 7.0 8.1 16* 4. 6 4.4 . 4
5 . 2 5.1 ·2 18.0 18 .5 3 1 1 . 8 13 . 2 12·· 6.9 7 . 8 13" *
In a hot droughty year , starter ferti li zer increased early growth of corn at all sites and grain yield at two sites. No yield decreases were measured. Responses were not related to soil test levels.
3 4

· � �
1t il:ii4 J S,Er iFARM r
�
RESIDUAL EFFECTS OF P FERTILIZATION
B . G. Farber , P . E. Fixen, R. H . Gelderman, 8. Lawrensen and R . Nettleton
Plant Science 88-11
SUMMARY
Several states in the North Central Region have established long-term phosphorus studies. These experiments were designed to evaluate the residua l effects of P fertilizer and also generate P soil test calibration data in a situation where a range of soil test calibration data exists in one soil . These data are extremely useful for evaluating year - to -year fluctuations in crop response to soil test P and establi shing response p robabilities a t one given soil test level. Valuable lessons can also be learned from such studies that relate to short-term and long·term P management decisions.
Method s :
The long-term P study in South Dakota is located south o f the off ice building on the Southeast Experiment farm near Beresford. The soil is classified as an Egan silty clay loam (Udic haplustoll) . These are deep, f riable, well-drained soils developed in a silty cap over glacial till From 1 964 to 1 967 five rates o f ? (0. 10, 20, 40, and 80 lbs P/A) were broadcast and plowed down annually to establish a range of soil test levels . Various crops have been grown in the study with the major ones being corn and alfalfa . A couple years of soybeans and sorghum were included over the 22-year period . Since 1 982 the study has been planted to corn and moldboard p lowed each fall.
The study a rea in 1 988 was p lanted to Pioneer 3732 on April 2 9, 1 988 at a rate of 2 4 , 100 seeds/A Weed control consisted o f a Lasso banded over the row at planting. Counter was banded for insect control . An application o f 75 lbs/A nitrogen a s 28·0·0 was made a t lay -by .
RESULTS AND DISCUSSION
General soil test change s :
Table 1 shows the changes that have occurred in selected soil test properties over the past 22 years. Soil pH (0·4k) has declined from 6.0 to 5 . 4 and may be a t a poin t where a small response to l ime addition could be seen . These soils normally must be quite low in pH before lime response is measured due to high subsoil pH and abundant exchangeable cations with limited exchangeable or soluble aluminum at any given pH level. Organ ic matter has remained constant while ammonium acetate extractable K has declined 15 0 lbs/A (still interpreted as very high) .
3 5

Table 1. Changes in soil test results over 22 years .
O rganic Yeg,r pH Matter
Bray & Ku rtz NH40Ac );JO � p ____ K�----. · · · · · -· · · · · lbs I A · · -· -· · · · · · · · · ·
1964 6 . 0 1986 5 .4
bepfh 0·"1 ·• 1 Rep 4 excluded . 2 Check plots only.
2 .7 2 . 8
161 597 152 455
Initial soil test P �w�r�g u 16 lbs/A for reps 1 to 3 and measured 17, 14, 16, and 26 lbs/A fo r r�ps 1 tnrough 4, respectively. Part of rep 4 is a Tetonka soil (A rgiaguic ar 1 11!..:.!J) with a lower p H and with considerably more P initially. The check plot from this rep had d ropped to the level of the other reps by 1973 . Essentially no change in soil test P levels occurred over the 22-year period fo r three of the four reps.
£:rt il i ze r e f rut$ ori; g ra111 =-....:-.=--•:..;..;.:::-.;.;.;..:...:..;::;...:..:::.;...
Corn grain yields and g rain moisture were not influenced by soil test P level differences i n 1988 (Table 2) . Grain yields, however, were reduced considerably due to the severity of the 1988 d rought .
Table 2 . Influence of so il test P level on corn grain moisture i n 1988 and grain y i eld i n 1982·1988.
Soil Test Grain " � a G r a i n Moisture P Level 19� 1983 1984 -�985 1��§_ 1987 l'IJ&5 ;. ,g. 19]!__
lbs/Al ... -· . . . · bu/A -·-·-········ · · ··-···· ··
15(L) 97 102 103 119 20(M) 103 97 101 117 19(M) 94 103 102 126 28(H) 93 106 109 131 56(VH) 84 107 117 129
� Bray and Kurtz No. 1 , Summer 1988, 0-4" At 15 . 5% moistu re
113 108 26 95 16. 3 113 112 27 96 15 .7 111 107 23 95 15 6 113 113 28 99 14. 0 114 115 23 98 17. 9
Corn y i elds f rom 1 982 through 1988 show that the 26 lb/A soil test level has averaged 4 bu /A more corn than the 15 lb/A level ( r able 2) . These data also show that the response to P varied considerably across years with no response in 1 982, 1983, 1986, 1987 and 1988, a small response in 1 984 and a good response in 1985. This illustrates that P fertilization needs to be evaluated over a long-term period . Residual effects of the P fertilizer (in this case applied 20 years ago) cause this input to act in part as a cap i tal investment like tile installation . The cost of P fertilization should not be attributed to a single crop because benefits may be seen fo r several years.
36

Pop - up Versus 2 x 2 Starter for Ridge Planted Corn and Soybeans
P . E . Fi xen, B . G. Farber and D . R . Sorensen
Plant Sci ence 88·12
Current South Dakota recommendati ons state that fer t i l izer should not be placed i n seed contact w i th soybeans t and N + K O shoul d not exceed 10 lb/acre for corn due to potential l y del ayed imergence or stand reduction . Many growers today are i nterested i n banding w ith the i r planters but do not have starter openers . Also t in r i dge-t i l l and no-t i l l systems t surface soi l di sturbance at planting i s not desi rable due to weed control factors. Since a conventi onal starter d isc opener in a "2x2" placement penetrates deeper than any other tool on the planter , i t frequent l y causes si gnificant di stu rbance of the row area. For these reasons , interest in pop-up ferti l i zation has increased.
Compar i son of pop-up and "2x2" placements i s necessary to determine if the i r effectiveness var ies . The deeper placement of the "2x2" may make i t more effective when the soi l surface dr ies out.
Objectives
a. Compare the emergence, ear l y growth t and grain y ie ld resul ting from pop-up placement to 2x2 placement for corn and soybeans i n r 1 dge ti l l .
b. Oetermine the effect of soi l test P level on placement response.
c . Determine so i l mo i sture content incremental l y i n the r i dge through the season and relate these data to placement response.
Methods
The study was l ocated i n the southeast corner of the research farm on a Viborg si l ty clay loam soi l . Viborg soi l s are deep, fr iable moderately we l l-drained soi l s deve loped in a s i l ty cap over glacial ti l l ( Pachic Haplustol l . fine -s i l ty, mi xed mesic) . Results of soi l tests taken 1 n the spring of 1988 are reported in Table 1 .
Tah1 e L §l!m! r al sci n last rl!:Su1u .• 52ri f10 , l9tm .• Organic i1ec E it!".
Oepth N03·N matter pH cond . K
lbs/A % mmho/cm ft>s/ A
0 ·6 " 26 3 . 9 6 . 5 L O 720 6 - 24" 70 2 . 5 7 . 3 0 . 6 520 24-48 11 29 0 . 6 8 . 2 0 . 6 345
Reps 1 - 4 ; Corn in 1988 .
3 7

Cultural practices are reported in Tab le 2 . Weed control was excellent in both corn and soybeans . The study was conducted in a split block design with four replications and two factors in a factorial arrangement resulting in nine treatments . Three soil test levels were u ti l i zed from an earlier study at this site. Bray and Kurtz No . 1 soil test values for the r idge run r rf rep:Dr*rd by neptr ·n�r�-ant.s in Table 3 . The resulting average rur �he top six 1n�hes ranije:d from !4 to 27 lbs/A (Low to High) . The second
clor fnvolve4 hrc.e. rloce�en· s wn �h consisted of a check , ferti lizer pl�t�d �,th t..r'l1! seen (pop·u�) and 2•� starter (two inches to the s i de and wo fncnes uclDw th!! seeU) The fert ilizer used was 10-34-0 at a rate to
tie I 1 l!'r 25 llls P O /A nd lns or N Check plots were 6 rows wide and 40 ee lang Nh1 le ?n� rertf l ;zed plol! .ere 3 rows wide and 40 feet long . The
plo s ��re p1qn" ·d wi a 6· ra. planter that was plumbed to de l iver fert il i�er to the seed an 3 rowr und to t�e 2x2 disk opener on 3 rows Yields were determined by hand harvesting 20 feet of the inside two rows of each plot for corn . Soybean yields were determined likewise exc·pt that a plot combine was used for harvest.
Table 2 . Cultural practices in 1988.
Past crop Variety Planting date Row spacing Seed rate Final plants/acre Herbicide Insect i cide Harvest date Cultivations S idedress 28% N, lbs/A
soybeans Pioneer 3475 May 2 30"
24,100 22,800
Soj_beans_
Lasso band, Banvel post Counter 15 G Sept . 6 one 150
corn Corsey 79 May 16 30"
146,000 155,000 Dual band none Sept . 27 two 0
Table 3 . Soil test P l evels in the ridge ;n the fall of 1987 .
0-3 3-6 6-9 9-12
0-6
� Reps 1-4 Reps 5-8
Corn 1n l988l 'J Snyp�ans ffi l386� �reatment_ Ire1n.mm1
L 14 A:tg. b H H Ayq. · · · · ·- · ·-- · ·· · · · ·-- · · · · · · · · lb:SIA · · · · · - ·· · · · · --- - -- - · · · · · · - · · ·
13 17 25 18 17 22 28 22 10 15 23 16 13 19 29 20 10 18 25 18 14 25 40 26
6 10 16 11 12 15 29 19
12 16 24 15 21 29
38

Soil moisture was monitored incremental ly in the ridge by taking weekly grav imetric samples unti l June 16 and biweekly from June 16 to August 11. The gravimetric val ues were converted to volumetric values using bulk density measurements taken at the V12 growth stage. The resulting soi l moisture contents were adjusted for precipitation events occurring between sampl ing dates.
Results
The fi gure shows the soil moisture contents in the ri dge throughout the season for both soybeans and corn. The l to 2 inch depth corresponds to seed depth while the 3 to 4 inch depth corresponds to the 2x2 depth. The 3-4 inch depth was s l i ghtly wetter than the 1·2 inch depth through the V6 stage. The difference i ncreased to nearly 7% by Vl2 after which the 1 to 2 inch depth became very var iable. The soi l moisture data is summarized in Table 4 for corn. From VO to V6, the moisture contents were similar from one inch depth down to 8 inches. This is the most critical stage for P uptake by corn and the water differences are relati vely mi nor for either diffusion or root growth. 01fferences were greater from the V6 to Vl2 stage, however, by this time the P uptake demand per un1t of root length has usually greatly decreased .
VOLUMETRIC SOIL MOISTURE.3788
SOYBEANS SEED VS 212 ll''T"- -------------- -e- J 11) Z
CORN SEED VS 212
JD .. Ill & II
ee
.,.. iQ :¥ Iii .: .... 111) 11
3D � 14 Iii: 25
t -0 20 2 II
II ,121 (&!
- ...
·�
C IS
llll 2tD 10
n VI Yl2 Rl 5 � 120 160 llO 210 2f0
TIM£, DAYS
3 9

Table 4 . Average soil moisture contents by depth increment in ridge-till corn. 3788 .
Depth Growth Stace .::al.nc=rc..:e:;.:.:m.:..;:e"""n-=-t _______ V'"""O=-· -=-V=6- V6-v12 v12-Rl inches ········· · · ······ ·· · ·· · ·%· · · ········· ···· ······
0-1 1·2 2·3 3 .4 4-6 6·8
21 27 28 29 31 34
17 18 20 22 24 27
16 17 16 18 17 19
Volumetric bas is ; samples taken between p l ants in the row of check rr!}€:t.ent n�a nojust�a Far prer1;1 i�t1on .rre:c:s ll!twe.en $illi.Dl1nq times
No emergence effects were detected for corn, however. significant differences were found for soybeans (Table 5 ) . Soybeans having a 2x2 starter reached 50% emergence one day earlier than either the pop-up treatment or the check . Final stands were not affected by the treatments .
Table 5 . Influence of fertilizer band placement on emergence of $0VJ!3!!5 �n � ridgf ·ti 1 1 s�s��. 19a§
[lay� a rv:aeh �naicated Hmer�nct'! final Treatment 50% 75% 90% * s tand
Check
Pop-up
2 x 2
7.8
7 . 8
6 . 8
100% emergence = 156.000 PPA.
8 . 9 10 .7
8 . 9 10.3
8. 2 9 .7
156
153
155
Early growth ( V6) was mea sured for the corn plots (Table 6) . Both an increase in soil test level and P p lacement enhanced early growth . At the low so i l test level. seed placed P provided slightly more early growth than 2x2 starte r .
La.t!111t,..6. Eiil'1y grc11,th cgpClnse uf c-orri o P, .l.9BS. -------Soi 1 te�s�t����--------=-P..:..,lacement
l��tl Cheek 2 ! 2 Seed A�g. ··· · ···· ···· ····· · ·grams/plant-· · · · ···· · · ··········
L 6 . 8 7 . 8 8 . 5 7 . 7
!i
Avg . 7 .1
9. 0
8 . 4
9 . 4
9. 0
LSD . 10 : P l acement = 1. 1, Soil test level = 0.5, Plac . x STL = 0 . 7, CV = 6%. Growth stage = V6 .
4 0
8 . 6

Grain yields were not significantly influenced by either soil test level or P placement in this study in 1988 (Table 7) . However. both corn and soybeans trended higher as soil test levels increased. Corn grain moisture at harvest was not influenced by P management (data not shown) .
Table 7 . Grain yield response to P placement and soil test level. 1988
. sgfl !'..arn .savi1eans test Placement P1-iw,i5 l evel Check 2x2 Seed Ave . Check 2x2 Seed • • • • • • • • • • • • • • · • - - · - · - • • • • • • bu I A · - · - • • • • • • • • • • • - - - • • • • • - - - - • • • -
L 78 82 91 84 24 24 24 M 98 87 99 95 24 25 27 H 100 83 103 95 26 25 25
Avg . 92 84 98 25 25 25
LSD . 10 Placement ns Soil test level ns Plac . *STL ns
CV ,% 16
Summary
Avg.
24 25 26
ns ns ns
8
-
Since this is the first year of this comparison, no conc 1usion should be drawn . However, it shou ld be pointed out that in a dry. hot year like 1988, seed placement of 10-34-0 at a rate of 25 lbs P O IA did not result in any damage to either corn or soybeans . The moist ufid1sturbed seed bed provided in a silty clay loam soil in the ridge plant system may have been partially responsible for the lack of detrimental effects .
41

OAT RESEARCH
D . L . Reeves Plant Sc i ence 88 · 13
We started a prel i m i nary herbicide testi ng program this year in cooperation with the extension weeds workers. This 1s our southern site. Thi s year we used 6 varieties and 9 treatments . The treatments included MCPA at 1/2 and 1 lb. rates, 2 . 4 · 0 Amine at 1/2 and l lb ., Bronate at 3/4 and 1 1/2 lb . • and a Banvel + MCPA mi x .
There are three objectives to this program. One i s to see how oats are reacti ng to env i ronmental conditions when sprayed on a g i ven year . The second i s to see how our sel ecti ons approaching rel ease as a var iety respond to commonl y used herbi c ides. The third i s to see what cou ld be expected in the field if a sprayer overlapped when spraying oats .
!life, 1tnat111errb cau.seu sigJ':lrf=cant y1 el d and test weight reductions t1Ms: �ar� T� rdgt, rates . o ! , .J-o gave the l owest y i e l d and test Ym1ght ror !a�n v r lel/ the hiijn rate of Banvel + MCPA also reduced y� eld''.9 , but m:it .u se-i.r:ere1�. FMt ,teights of this treatment were very sh1rrHilr 111 the hffJh- 2. · D r11 te.
�T.r�e.a�· t�rn�8�n�t=--�����R�e�-�t�e�· �����Y�l�e�l�ct=---���1� st e[gnt_ ( lb l A ) rau A; { l b / b u )
unsprayed
eanvel + MCPA
2 , 4 · 0 amine
l /4, l /2
1
3 8 22 . l
31 20 . 8
2 7 2 0 . 6
There was also a signifi cant treatment x var iety interaction for y ie ld and test wei ght i ndicating al l varieties d id not respond the same . It i s not known whether these results are typical . Plans are to continue this test at three locati ons next year .
We continue to use this location as our best testing site for our earl y maturity sel ections . A severe epidemic of bar l ey ye l l ow dwarf vi rus (red leaf) caused great losses in some entr ies this year . The good part was it permitted us to sel ect entr i es having good resi stance to red leaf . An encouraging point was the excellent resi stance some of our advanced l ines had to red leaf.
Two regional tests are grown here. The Uniform Ear l y Oat Performance Nursery is a USOA coordi nated test grown in several states . The Tristate test includes only 10 new entries from each of the Dakotas and Mi nnesota. Overall, th is conti nues as an i mportant testing site i n our oat breeding program.
4 2

A G RONOMIC EVALUATION or SOME DROUGHT TOLERANT A LT ERNATIVE O R EMERGEN C Y
FOR A G E C RO P S Arvid Boe and Kathy R obbin s
Plant Scien ce 8 8 - 14
Introduction
In the northern Great P lains, cool-season grass pastures decline in pro ductivity and forage quality in mid-to late summer . Some currently used practical solutions to forage shortages during the summer period include perennial warm-season grass pastures and warm-season annual grass pas tures .
Summer annual legumes have been used for soil improvement, pasture . hay and si1age in the southern United States . Mungbeans (Vigna rad��ta) have been grown quite extensively in Ok l ahoma for food and forage, and cowpeas (Vigna unguiculata) are grown on about 200, 000 acres annual1y in the U .S - , with Georgia, California, and Texas accounting for about 65% of the total acreage _ They are grown primarily as a vegetable and a dry bean. but have been utilized for hay, silage, and pasture . Both crops grow well on infertile, sandy soils and are tolerant of d rought and hot weather _
Objectives of this research were to evaluate effects of row spacing and plant population (density) on forage production of cowpeas and mungbeans_ Data obtained should be useful for determining the adaptability of these legumes to forage production systems in southeastern South Dakota .
Experimental Approach
Cowpeas and mungbeans were planted at 2 rates ( 100, 000 and 200, 000 pure live seeds /acre) in 3 row-spacing ( 10·, 20·, and 30 ·inch) treatments, replicated 3 times in randomized complete block design . Planting date was June 2 and harvest date was August 16. Plants were in early pod stages at harvest, but mungbeans were more mature than cowpeas .
Results
As was found in a similar study in 1987 at Beresford, forage yields for both cowpeas and mungbeans increased with decreased row-spacing, indicat· ing superiority of narrow rows for forage production (Table 1) . The forage yield advantage of narrow rows may be due to less intra·row plant competition in the narrow rows . Distances between plants in wide rows were closer than distances between plants in narrow rows at the same p l anting rates.
Cowpeas significantly outyielded mungbeans at Beresford in both 1987 and 1988, but these yield d ifferences were not as great at Brookings and Highmore . These data indicate that simi l ar evaluations of more cultivars
4 3

of each species should be beneficial for identifying cultivars that are well-adapted to specific regions of the state .
�orage yields of the 100,000 and 200,000 pure live seeds/acre seeding rates were similar, indicating no practical advantage to the higher seeding rate . Stand establishment was excel lent for both planting rates at all locations in both years . However, increased plant density in the high seeding rate plots was generally offset by larger individual plant size in the low seeding rate plots. As part of the study, data were also collected on forage yield components and leaf-to-stem ratio. Results were incon clusive and suggest further research is needed to determine if populat ion density and 1nter-and intra-row spacing can be utili zed to influence forage quality in these species.
Discussion
This study indicated cowpeas and mungbeans offer great potential as summer annual or emergency forage crops in southeast South Dakota. These annual legumes produced at least 3 tons o f dry matter/acre during the d rought year of 1988 from a p lanting made in early June and harvested for forage in mid cAugust . During the severe droughts of the mid l930's, when most crops were failures, mungbeans grew well in central Oklahoma, and cowpeas are also well-known for their ability to grow in areas with heat and drought stresses too extreme for other annual legumes .
B�th �pec 1 es nall'B aeen sutcessfu1ly uti 1 1 :1!11 as h3y ana s11a9e _ �ay from Uiese le;umes may be so-are'Rltilt slemay. flt.t !TO rermentit DI" 11r p-al atab� 1 1 t:y problem he.v be.en assoc: ta tee 11 i th p:w,goean si lo_g_a.
Seed costs have been low ( $2 .00·$5.00/acre; 15-20 lbs/acre at $18 .00-$30.00/100 lbs). but will fluctuate with domestic production. Both species can be easily planted with conventional equipment. A grain drill was used to p lant evaluation plots adjacent to experimental plots and excellent stands of both species were obtained. In Oklahoma, mungbeans are dr ill-planted after winter wheat to provide a later summer or early fall hay or silage crop (Leroy Mack, Johnston Seed Co .. Enid, OK ; personal communication) . Addit i onal studies are needed to determine if doublecropping with small grains is a viable alternative in our area .
The encouraging results of this preliminary research have provided strong incentive for additional studies on these and other annual legume and grass species. New forage that complement or supplement our traditional perenn i al grasses and legumes add flexibility to forage production systems and can be extremely valuable to forage producers in the climatically unpredictable northern Great Plains .
T able 1 . Mean Dry Matter Yields for 2 Annual Legume s Grown in Ji Row -5 Da e ings a t
L e gume • Cnwppa Munab ean -· · ·· - t ons/acre- - -·
4 . 5 a 3 . 2 b
Beresford. SO in 1988 Row - spacing (inches)*
10 20 30_ -· -· - -· · · · tons I acre· 4.3a 3. 9b 3 . 3c
.. _. _ _ _ _ _ - · · · *Means in same row followd by a dif f erent letter are significnatly different b y LSD . 0 5 .
44

FABABEAN RESEARCH PROJECT Dale R. Sorensen
Dur ing the 1988 growing season research plots and l arge p l antings were used to study how the fababean reacts to South Dakota. A 20 acre field of fababeans were grown for the fi rst t ime to have enough pl ant mater i a l to conduct l ivestock research. Smal l var i ety plots w i th two row-spacings were a l so establ i shed to look at var i ety adaptab i l i ty and row- spacing efforts .
Table l reports forage yi elds for 1988 for four var ieti es at two row - spacings ( 7 and 14 i nch) . The research plots were planted on Apr i l 13th.
Fababean �grage Yi elds at Two Row ·Spa.�1ngs. SE rDrm, l9B8, Tapl� 1. Vari ety Row-Spacing
Ackerper l@ Herzfreya Al�din Diana 7" 14 " 7d 14 " 7d 14" 7 " 14-
. · · · - - - · · · · · · · tons/acre @ 65% Moisture* · -3 l 3 . 8 3. 2 2 . 8 2 . 5 2 . 4
*LSD . 05 = 0 .6 Tons/Acre 2 . 6 2 . 3
Due to the extreme heat in June of 1988 , yi elds were down considerably compared to past years when we were able to pl ant in Apr i l . The fababean does fine with dry condit ions, but extreme heat is detrimental to the development of th is crop. Ackerper l e and Herzfreya are both more recently devel oped varieties and did exhibit better yield capabi l i ties than the Aladin and Diana var i eties.
The l a rge pl anting of fababeans (20 acres) were harvested at the same time as the sma l l p lots and yields were comparable from the 20 acres that were comparable to our sma l l research plots.
In August , when the rain began to fal l , fababeans were again planted into ground that we had grown smal l grain on i n 1988. Instead of using the grain dri l l , we planted the fababeans w i th a un1t planter in 15 inch rows. Because of the seed s ize , the grain d r i l l does damage the seeds where the o ld pl ate p l anter does not have any problem 1 n handl ing that s ize seed and causi ng any damage to the seed .
Th1s planting of fababeans came up wel l and conti nued growing unti l November 10th, when the night t ime temperature got down to 20 degrees F . There were several ni ghts below 32 degrees F pr ior to that , but the plant recovered each t i me . The actua l ki l l i ng frost for these fababeans 1n 1988 was 20 degrees r . These fababeans were harvested on November 14th and the yield for this area which was unrepl icated worked out to . 95 tons dry matter per acre ( l . 56 tons/acre 65% moisture ) . This was a surpr i sing yield considering they were planted i n mid -August and harvested in early November . These fababeans a l so would have been good for grazing during the fal l because they would conti nue to grow . This work wi l l be carried on for the 1989 growing season.
4 5

TILLAGE AND ROTATION FOR CORN AND SOYBEANS
O. H. Rickerl and D . R. Sorensen
PLANT SCIENCE 8 8 · 1 5
Summary: A field study was initiated at the Southeast Experiment rarm to determine the long term effects of tilla g e and crop rotation on y ield and soil characteristics . Tillage treatments were moldboard plow . ridge · till and no · ti l l or chisel p low. Crop sequences included continuous corn and soybeans as a standard of comparison for rotated corn and soybeans. Preliminary results from 1988 indicated that rotation in a rid g e - ti l l system produced the highest corn yields. Ridge - ti llage also caught m ore snow and stored m ore soil surface moisture than other systems.
Methods : This study was initiated in the spring of 1 987 . Crop treatments were establi shed as continuous corn, continuous soy beans, rotated corn - soybeans, and rotated soybean - corn. A l l plots were cultivated and ridg e - till p lots were ridged at second cultivation. Other tillage treatments were fall moldboard p lowed and no - till . fertilizer and pesticide appl ication followed recommended practices (Table 1 ) .
Table 1 Hanagee��t P r actices f;r
Planting Date Herbicide Ferti liz er .tia,:rv.es:-t pa tJ
Corn Pioneer 3 7 3 2 May 6
Lasso+Atrazine ( Pre ) 25 I P205 Starter
Septembe-r -8
tillage RoLati-on Squt,1 ,, l 98B SO)'beans
Century 84 May 13
Lasso+Sencor/Lexone (Pre) 25# P205 Starter
OctofJl!:r 6 ... With tilla ge and crop treatments established , data coll ection began in the f a l l of 1 987. Soil moi sture at 0 · 6, 6 · 24. and 24 - 48 inches was determined from probe truck sam p led core s . Crop residue was measured as a percent of ground cover after fall tillag e and a gain after spring p lanting . The snow trapped by stubble and residue was also recorded.
In 1 988 tillage treatments were changed slightl y. All corn pl ots �et! L ld9ea •t oultivGt..ion, Dut soybean plots were not. Fall 'U.l lage wtrs fllldbaartl plowed . anti chisel plow replaced the no · till treatment . Nit:rog_e.n &pQli-ce t.1on was 90 pounds/acre in corn foll �•lng soybEans Qnd 1.20 pounds/acre in corn following corn. Pestielde ID,Plication rollowetf re1;ommended practices . Plots were mechanically harvested to determine y ields.
4 6

Results and Discussion : T able 2 lists soil moisture content at 3 depths in the fall of 1987 and 1988. In 1987, ridge - till plots
Table 2 . Soil moisture �s: n rree,.ted b v
Year Tillage
1987 Moldboard p low
Depth J.nches
0 ·6 6 ·2 4 2 4 · 4 8
Ridge - till 0 - 6
N o - till
1988 Moldboard p low
6 - 24 2 4 · 4 8
0 - 6 6 ·24 24 · 4 8
0 - 6 6 · 2 4 2 4 - 4 8
Ridge - till 0 · 6 6 · 24 24 - 48
at 3 depths in the fall of 1987 and 1988 crop rot§ tion aoa ti1laqe.
Crop and Rotation corn soybean
Continuous Soybean Continuous Corn
17. 0 1 7 . 0 14 .0
Rotation P,otatiao . .. - • ·S - - .. . • . .
NA* NA NA
18. 5 14 . 8 15. 2
NA NA NA . - ... . . . . . .
18. 2 1 7 . 8 12. 5
18 .0 1 6 . 0 12. 8
17. 6 20. 8 13 . 2
NA NA NA
1 9 . 0 19 . 5 1 3 . 8
_ _ ._ _ ., . . . • \ .
NA NA NA
18. 6 21 . 2 13 . 2
1 7. 5 16 . 5 12. 8
1 7 . 1 1 6 .9 1 3 . 1
NA NA NA
NA NA NA
17 . 4 1 7 . l 12 . 4
- - � • • � - - - • • • w - - - - -
2 1 . 2 2 1 . 9 19. l 18. 8 19. 4 1 8. 9 17 . 6 18 . 5 12. 2 12. 4 1 1 . 6 12 . 2 . -- � � - - . . . . .
Chisel C·6 2 1 . 7 19 A 2 1 . 0 17 .9 6·24 24 . 8 20 . 7 17. 4 1 8. 4
��---=-������i�4-·_4�B���l�3�·�9'--���1�3�-�0----��l=3�·�3'--�---12 8 •NA · Not a pplicable since 1987 was the first crop year.
had a slightly higher percent soil moisture, in the top two increment s , than the other tillage treatments. At the 24 ·4 8 inch depth, however, ridge - till had less m oisture than other treatments with the exception of no - till soybeans. In 1988 surface moi sture was generally higher in ridge - till plots. The exceptions were continuous cropping in the chisel plow treatment , which had been no-till the previous fall. Deeper increments indicated that ridge - till treatments were dryer than moldboard plow or chisel plow.
47

Table 3 . Crop r esidues in the fall o f 1987 and spring o f 1988 as affectuo b� crgp 1nd t i -la��-------
Corn _..T-=i .... l..,.l=a .... g=e __________ F -U s Qr • ng
Moldboard Plow 11 Ridge · Till 7 3 Ho ti!l/Ch!sel Plow 10
6 52 2e
Crop and
GrounCJ
• 1987 plots •�re n o - t i l l . nfiC 198e plcts
Season Soybeans
fr1ll SprJng _ Cover
5 2 66 40 �6" l§
�r.s cl"l.sel µlow
Crop residues are recorded in Table 3 . Residues decrease d over the winter for both crops and in all tillage systems . Soybean re� idue was less than corn and was much less effective at trapping snow ( Table 4 ) . Ridges with corn s tubble trapped 2 t o 4 more inches o f snow than the o ther combinations .
Table 4 . Maximum snow depth during the 1987 · 88 winter , as affected by crop and tillage�·:.,__����������
Crop Tillage
Moldboard plow Ridge · till Na t.111
C orn
6 9 ,
Soybeans inches - - -
Corn yields (Table 5 ) were low due t o the drough t , bu t were also lower than the same hybrid planted nearby, but a week later . Rotation improved corn yields regardless of tillage treatment with the biggest d i f ference occurring i n t h e ridge tillage treatment . Soybean yields showed li t tle response to tillage or rotation treatments .
Table 5 . corn and soybean yields in 1988 as affected by exog ro tatJon and tillane .
Tillage
Moldboard plow Ridge - till N o - till
Crop Ro tation ____ Corr, s oybean
Continuous Soybean Continuous Corn Rota�.on���������-R-o_t-a_t_!_o __ .�
· bu /acre-22 27 24 33 22 26
4 8
1 9 19 21 20 19 18

TILLAGE AND LANDSCAPE POSITION EFFECTS ON CORN AND SOYBEAN YIELD
T . E . Schumacher and D. Sorensen
Plant Science 88-16
Tillage systems which leave a high residue cover on the surface generally perform as wel l as, or better than other systems with little or no residue cover. This i s especi ally the case on soils which are well su1ted to crop production. However, there has been some hesitation about using conservation t i l lage systems in areas where soi l temperatures remain cool and soi l moisture levels are relatively high dur ing the early part of the growing season. Due to the rolling topography of Eastern South Dakota, well-drained and less well -drai ned soils occur i n an intricate pattern across most fields. This study i s designed to provide information on the benefits and difficulti es associated with selected tillage systems on soils which have different moi sture and temperature environments, (well -drained vs . less wel l -drained ) . The study also provides information for evaluating a method for selecting corn hybrids which are more tolerant of stress environments. The line source i rr i gation selection method for evaluating corn hybrids was conducted at a seperate locati on .
Methods. The two soils i n the study are an Egan soil located east of the farm feedlot and a Wentworth soil located i n the lower landscape position in the southeast part of the farm. The Egan soi l i s formed in s i lty glacial drift and has a silty clay loam surface texture. The Wentworth soi l i s si milar to the Egan soil however it is typi cally found 1 n lower positions i n the landscape and has deeper silty hori zons. Ti llage systems i nclude r idge till (RT), no till (NT) , and a fall moldboard plow - d isk (HP) system. A starter phosphorous fertili zer was applied to half of each tillage plot at a rate of 25 lbs P o I acre. Y i eld was determined by machine harvesting the center rows2of each treatment. There were four replications of each treatment. The cultural practices are outlined i n Table 1. Soil test results were used to determine application rates of ferti l izer . Test results are given in Table 2 for the two soi l s .
Tabl e 1. Cultural practices for 1988.
Prnctjce C-prn
Variety Planting Date Row Spacing Planting Rate Herbicide Insecttc1de Harvest Date
Pi oneer 3475 May 4,5 30 i n. 24,000 s/a Dual -B ladex Band Counter September 7
49

Table 2. Soil Test Results, Fall 1 907.
20 35
21 31
p
38
18
K
608
615
Soil
Egan
Wentworth
Six corn hybrids were also included 1n each t i l l age plot and phosphorous starter subplot for both soils.
Re�ults am.s_o1sruss19n. Yield data for the Egan and Wentworth soils are given 1n Tsblrs 3 , Ai and 5. There was no effect of tillage system on yield on the Egan soil for both rotations. The overall yield potential was very low due to the drought and high temperatures at pol l ination. The beneficial effects of the conservation t i l lage systems on moisture conservation are more likely to occur under less stressful conditions. There was no effect of P starter on the Egan soi l . As expected the corn -soybean rotation had a higher y i e l d than the continous corn rotation . The advantage of the rotation was most noti ceable with the conservation tillage systems.
A starter response was observed on the Wentworth soi l . The response depended on til lage system and rotation. Overal l yi elds were lower on the Wentworth soil compared to. the Egan. This occured even though the Wentworth soil i s located in a lower landscape position than the Egan soil . This •ay have been a result of compaction from prior years. However the effect of the Wentworth soil on y i eld appeared to be variety specific. The six hybrids which were evaluated for the sel ection methodology study yielded equa l ly well on the Egan and the Wentworth so1 1s at 40 and 38 bu/A, respectively. The importance of the starter and t i l lage interaction is difficult to assess because of the low y1eld environment in 1988.
Table 3. Corn yield on the Egan soil .
-·· · - Rotation - - - ·- -T111 ag� c-c C·S Ave. · · · ----- · · · · · · · · · · · - · ·-·- - -Bu/A· · ·- - - --- · · · - - - - - - - - Y Y - � · - � -4:1
RT NT MP
AVE
36 34 46
39
55 59 49
54
5 0
468 47a 48a

Table 4. Corn yield on the Wentworth soi l for the Continuous Corn Rotation.
!11 lage starter No Starler Ave. _ .• ;·-· · ---····· · ··-·-· ·Bu/A�-� - · · · - - · - · · � · · ·----- ·- · · �
RT
NT
MP
AVE
TxP LSD. lo � 5 bu/A
27
35
25
29
28
26
24
26
28
31
25
Table 5. Corn yield on the Wentworth soi l for the Corn -Soybean Rotation.
U 11@91! Stlrnr No Starter Ave. • • • • • • • • • • • • • • • • • • • • • • • • • Bu I A · • • • • • • • • • - - • • • • - • • • • - • • • • • • • • • RT 37 26 32
NT
MP
AVE
19
29
28
TxP LSD. lo • 8 bu/A
29 24
26 28
27
Yi eld data for the hybrids which are being used to evaluate stress selection methods are g iven in Table 7. A t1llage and phosphorous interaction was also observed on the Wentworth so1 1 i n this study across all of the hybrids. The no ti l l treatment had the greatest yield i n absence of P starter at 45 bu/A compared to 34 and 31 bu/A for the r i dge till and moldboard plow treatments , respectively. The addition of starter resulted in a s1�1lar yield of 43 bu/A for each ti llage treatment on the Wentworth soi l .
51

Table 6. Hybr1d yield data .
SoH .t!Y.t'1.d.!L Ego.r, Wen Lwo-'-rt=h..;.._ _____ _ • • • • • • • • • • • • • • - • • • - • • • • • -Bu I A • • • • • • • • • • • • • - · - • - - - - • - • - • - • • • -
FR23xCM105 34 44 LH38xCH105 45 41 W64AXCM105 41 33 fR23xA632 45 40 W64AxA632 26 27 LH38xA632 46 44 ---··· ..... ...... - . . . · ·- · · · · · - - · - - - · -- ·
LSD. lo .,. ' 1
The results. from 1988 1nclicatc that under condU1ons or severe stress th U,r-e,e t111 ne • ,st�nis prodilcc c li"i1 , , ,.. 1 c:; rtethJti!.tS t; llage svstams tenn tc hove a he-nefic:ial .e t reel on sol l j'lrnpart;es t1vr?r i me=. This study 1 1 n {ts ;rcona ear un� � 1 1 b contin�ea to ,va1lHlt� the lang terw err,�ts or he ti l l eg.e system� on 50 1 1 proper ll!li anc1 pr�duct1v l lr .
52

1 988 PERFORMANCE TRIALS ON SHALL GRAINS GRAIN SORGHUM, SOYBEANS ANO CORN AT THE SOUTHEAST EXPERIMENT rARM
J. J. Bonnemann Plant Sci ence 88·17
I N TRODUCT ION
V a r iety o r performance t rials with f our major types o f c rops were conducted at the Southeast F a rm during the 1 988 crop year . Data f rom all tr ials and for other areas a r ound the state are found in publications fo r each type of crop .
T r i a l s o f spr ing wheat and oats were conducted at the fa rm in 1 988 , Table 1 . Results of the trial are found in EC 774 (rev. 98 9 Variety Recommenru · n�. SmJlJ G r a in and FlB�-
The 1 988 G r a i n Sorghum Performance results f o r the SE Farm a re reported in Table 2 . Y ielj - ult� and o OET �ata fo1 rarm trials on g rain s o rghum car be rouno 1n Plant Science Pimp�let !1 3. 1 988 G rain Sorghum Per or anee fTials
Soybean t r i als were conducted at several locations in southeast South Dakota including the Southeast Farm. These sites were freeman , Elk Point and E l l i s , ( no rthwest of Sioux Falls ) . Tables 3 and 4 cons i s t o f data from the 81 varieties tested just a t the Southeast Farm. Results for the other locations and other a reas o f South Dakota can be found in EC 775 (rev.) 1 98 9 V a r iety Recommendations, Soybean..L.,.
Over 100 hybrids were compared i n the corn p e r formance t r ial located at the SE rarm in 1 98 8 . Y ields ranged from approximately 35 to 86 bu/acre ( Tables 5 & 6 ) . G rowing conditions were no t the mos ideal in 1 98 8 , but d r y down was again ahead of norma l . Y ield s of a l l c orn performance t r i als in 1 988 f o r all locat ions as well as 2 , , , and 4 y e a r a ve rages can be found in fl'9nt ScienC'� Pamphlet I 12. 1 9813 CDTn Per onru,mce T r ia l s.
Hore i n formation on these crops can be found by listing the publication as underlined, and sending to : Bulletin Room, SDSU , Brookings, SO 5 7007 . T hese publications should also be available a t your county extension o f fice.
5 3

Table 1. Small Gr1ln_P�rforman�e • • • • · - • OATS · - • - - · ·
UR lET'I Benson Burnett Don Hazel Hytest
Kelly Lancer Lyon Monida Moore
Nodaway 70 Ogle Otana Otee Porter
Preston Pro at Sandy Starter Steele
Trucker Valley Webster Wright
Test Average Test LSD (51)
BU{A U?88 J·YR
27 43 :, 1 40 59 8 4 65 80 34 51
4 0 28 15
27
34 61
63 41
4 9 27 21 45 26
21 37 51 JO
40 6
4 9 4 9 3 5
4
36 74
60 51
66 55 45 71 58
45
66 58
57 24
Tr-ails I s� F"arm I
• • • • SPRING
VARl(Tl' Alex Amidon Angus Butte 86 Celtic
Chall enger Chri Guard Leif Len
Leo 747 Marshall Nordic N orseman Prospect
Shield Stoa Telemark Wheaton 2369
2375 238.5
Test Average Test LSD (5')
1988 ls WHEAT
pu1a 1988
' 9 7
1 0 9
13 8
1 5 6
1 1
1 2 1 1 13 9
12
13 10 13 12 1 4
1 4 ll
1 1 :,
3. ra_ 22 27 2 7 29 29
28 2) 32
2 8
27 29 34 29 31
34 33 30 30 3 1
29 7
• � - • • • a • • • • • � - - • • • � - - • • - • • - - • • • • • • • - - - - • • • • • • • - - • • • • • • • • � - • • •
Planted · April 8 Harvested - July 14
54
•

Table 2 . 1 988 Grain So_rghum T rail. SE Fa rm. 1 988
CWT Test Plant Moisture Headed 1-& r let� liame Y i-elo Weight .. Helght e�?cent Molffa Cargill 3385 58 . 9 62. l 40. 7 1 7 . 1 7 /20 Interstate 665 58. 1 58. 7 41 . 3 1 4 . 5 7/16 Cargill 630 .57. S 61 . 8 3 9 . 7 17 . 5 7/20 Seedtec STJlOl 56 . 6 58 . 7 41.3 15. 2 7/16 Seedtec WS203 54 . 9 61. 5 42.3 15 . 5 7 / 17 Interstate 856 53 . 5 58 . 9 3 9 . 3 14. 7 7/14 Cargill X77001 53. 3 60 . 5 3 9 . 3 15.3 7/17 Dahlgren DC ·33B 52 . 7 60 . 9 39 . 3 16.3 7/18 Interstate 668 51 . 5 60. 5 38 . 3 15 . 2 7 / 1 9 Cargill 2285 51 . l 60. 6 3 4 . 3 1 6 . 8 7/1 9 Cargill 1022 4 9. 9 61. 9 3 9 . 0 1 7 . 4 7/20 Dahlgren DG · 27B 4 9. 3 60 . J 40 . 3 1 5 . 1 7/17 Conti - Seed
Silverado 4 1 . 6 60. 0 37. 0 27 .3 8 / 4 Cact,9111 �O !9. 5 61 ) 38.7 23 8 1121
Overall Hean 52 . 0 6 0 . 6 3 9 . 4 1 7 . J 7 / 20 LSD ( . 05 ) = 5. 1 Bu/A CV = 6 . 0% Planted Hay 16 Harvested - September 26
5 5

Tgble �: 1989 G£OUQ I Sc:tb�an Mat.
Var1�ty Name Group
Fontanelle 3914 I Riverside 1405 I Mustang M - 1140 I Curry 175 I Profiseed PS150 I BSR 101 I Profiseed PS1755 I Hy - Vigor K · 2180(BL) I Agripro EX1969 I Corsoy 79 CK I I Fontanelle 3850 I Lakota I Weber 84 I Agripro AP1776 I Hy - Vigor Rowking( BL) I Hardin I Sibley CK I Profiseed PS2198 I Hodgson 78 I Mustang M · ll80A(BL ) I Mustang H - 1 150 I Dawson CK 0 Pzal�ie Brano PBl71 r
Overal l Mean LSD ( . 05 ) = 4 . 5 Bu / A c . v . = 10 . 6% Planted Hay 16 Harvested Oct 6
Perrornaence Tr.:.�l. SE Farm Yield Plant Mature Bu'A Hatght Mc I 0-S
39 . 4 24 9 / 1 4 34 . l 2 3 9 / 11 33 . 7 22 9 / 1 1 33 .5 25 9 / 1 1 33 . 0 2 3 9 / 11 3 2 . 8 26 9 / 10 32 . 7 23 9 / 1 1 31 . 4 2 6 9 / 13 :n . 4 24 9 / 9 30 . 5 26 9 / 1 1 29 . 7 24 9 / 8 29 . 6 27 9 / 7 29 . 6 2 1 9 /9 29 . 2 2 4 9 / 9 29 . 1 27 9 / 10 28 . 0 25 9 / 6 27 . 5 2 3 9 / 6 27 . 1 22 9 / 9 27 . 0 24 9 / 8 27 . 0 24 9 /9 2 6 . 6 23 9 / 8 23 . 7 22 8 /30 73.4 11 g, 8.
30 . 1 24 9 / 9
56

lable 4. � !9S8 &roup I I Sax._tru n Pe?fo.1:11u1:m;e T 1:l a. l.
Ur i .e tY Name Sands SOI 28 7 Hoeg emeyer 237 S ·Brand S - 46G Dekalb C X 226 Ag ripro AP2324 Gold en Harvest Diamond 0201 S ·Brand S·45J S·Brand S·450+ Sta r 8829 DeKalb C X264 Platte Riv ersid e 303C
Mat . �rcup
II 1 1 II I I I I
X277 I I I I I I II II II I I I I
Hy·V igor Ex·3· 903K·BL II Elg in 8 7 CK II P reston I I Sands SOI 277 I I Profiseed P Sll52 II P i oneer 9272 II C entury 8 4 I I Prairie Bnd P E275 ·BL I I Beeson 80 II P ioneer 9251 II Lath a m L- 770 II Sands SOI 268 II Stine 2750 II Dahlg ren DG·3285 I I N orth rup K ing $27-10 I I M c curd y 2608 B L II BSR 201 II W ells II I I Diamond 0200 I I Mustang M·1225 II Must ang E X P -13 II Agripro A P 2190 II Curry CBS·270 II Hoeg emeyer 281 II North rup King S23·03 I I Mead CK III Gold en Harvest X261 II Sta r 8826 II Hack II Dahlg ren O G - 3220 I I Must ang M -1 220A I I
Y i eld P lant B u / A l"e-lgnt 43 . 0 25 41. 4 24 40 . 9 26 40 . 6 23 40. 3 26 40 . 3 24 40 . 1 26 40.0 24 40 . 0 27 39 . 0 26 3 8 . 9 24 38 . 7 28 38 . 5 27 38 . 4 27 38 . 3 24 38 . 1 26 37 . 7 26 37 . 7 26 37 . 7 24 37 . 1 23 36 . 7 23 36 . 6 26 36 . 5 24 36.5 24 36.4 26 36 . 3 22 36 . 2 29 36 . 1 25 35 . 9 25 35 . 8 28 35.8 27 35.6 27 35 . 5 2 5 35 . 4 25 35.4 26 35 . 3 23 35 . l 25 35 . 1 28 3 5 . 0 2 5 34.9 2 6 34 . 9 25 34.6 23 34 . 6 25 34 . 2 26
57
SE Fa;nn
Matu r e itito ,oa 9 / 1 6 9 / 13 9 /12 9 /12 9 /16 9 /10 9 /11 9 /16 9 / 1 1 9 /13 9 /16 9 /16 9 / 12 9 /11 9 /1 4 9 / 16 9 /11 9 / 1 6 9 /18 9 /1 5 9 /16 9 /1 5 9 /13 9 / 1 4 9 /1 5 9 /1 7 9 /1 7 9 /11 9 /14 9 / 14 9 / 1 2 9 /12 9 /1 4 9 /12 9 /1 5 9 / 1 1 9 /11 9 /11 9 /20 9 /12 9 /1 4 9 /14 9 / 10 9 / 10

Table 4 . 1988 Group II Soybeans Continued Ma t . Yield Plent Mature
varlat�· J#(lrt'le Groug iulA �et.Qhl Hrii'lll Neb soy I I 34 . 2 27 9 / 1 4 Golden Harvest Hl233 I I 34 . l 24 9 1 11 Fontanelle 4)0 9 I I ,, . 1 24 9 / 1 7 Northrup King 8236 I I 33 . 7 25 9 / 14 Hoyt (S·O) I I 33 . 7 18 9 / 16 Agripto AP2021 I I 33 . 5 24 9 / 1 4 " Elgin II 33 . 2 20 f / 1) Latham L · 650 I I ,, . 1 23 9 / 1 3 Miaili I I ,2 . , 2 7 9 / 13 Harcor I I 3 0 . 8 29 9 / 12 Sibley CK I 30 . 4 25 916 Corsoy 79 CK I I 29 . 9 24 9 / 1 1 curry ces-202 I I 29 . l 23 9 1 9
O!amtmd Ql SJ) r 1 is-i 23 9l4
Overall Mean 36 . 0 25 9 / 13
LSD ( . OS ) • 5 . 0205 CV • 1 0 . 01 Planted · May 16 Harvested October 6
5 8

Table 5 . Corn Performance T[Jia}a ta[lVa Southeast far m . 1988 Type and Y ield Percent Per formance
Brand and Hvbrid C;J: OSS Bu /A Mo is tut! Scote Rating Fontanelle 4035 E 2X 85 . 6 1 7 . 9 1 Hoegemeyer SX2566 E 2)( 8 2 . 2 1 6 . l 2 Pioneer 3379 M 2)( 79 . 3 21 . 2 4 Tecnagene DF6805 M 2)( 79 . 0 14 . 2 3 Agripro AP525 M 2X 1 1 . 3 1 9 . 9 5 Hoegemeyer SX2628 M 2X 77 . l 20 . 3 6 Golden Harvest ><723 M 2X 7 4 . 6 1 7 . 8 8 Northrup - King S5750 M 2X 7 4 . 6 1 5 . 6 7 Cargill 6227 M 2X 74 . 2 20 . 7 12 Asgrowt o • Gold RX626 L 2X 72 . 7 14 . 5 9 Pioneer 3615 M 2X 10 . a 12 . 9 10 Pioneer 3585 M 2X 69 . 9 12 . 6 11 Tecnagene O F6807 M 2X 69 . 8 1 5 . 9 1 3 Lincoln EX 105 M 2X 69 . l 1 7 . 4 17 Nor thrup King N4545 M 2X 6 1 . 9 13 . 2 14 Seedtec ST7446 M 2X 67 . 8 1 4 . 3 16 Betagold Karla M 2X 67 . 3 13 . 0 15 Top Farm 1 106 M 2X 66 . 8 14 . 5 18 Kal tenburg K6300 M 2X 66 . 0 1 6 . 3 21 DeKalb OK535 M 2X 65 . 4 14 . 0 19 Terra TR 164E M 2X 6 5 . 0 1 3 . 5 20 Golden Harvest X615 M 2X 64 . 8 20 . 8 28 Terra TR 1040 M 2X 64 . 3 1 8 . 0 26 8etaQcld. Harna M 2)( 64 . 2 13 . 3 22 North1up Kl�g 55340 M 2X 64 . 1 1 8 . 1 2 7 Pio,ne,1u:· l:569 M 2X 62 . 8 13 . 1 23 Intets�aie lS543 M 2X 62 . 6 14 . 1 24 DeKalb IJKSA7 M 2X 62 . S 14 . 2 25 Cur ry 1 611 M 2X 62 . 4 1 7 . 7 30 Sigee lSlA L 2X 62 . 1 19 . 1 35 Interst ate IS613 L 2X 62 . l 1 7 . 8 31 Asg�ow / O ' Gald RX578 L 2X 62 . 0 15 . 9 29 Top Fifrm 109 M 2X 61 . 7 1 8 . 3 34 S · Btan"d S S � ti.4 M 2X 61 . 2 16 . 8 38 ront a-nelle �230 M 2>< 60 . 7 1 7 . 4 37 NC+ ' l J l E 2X 60 . 0 1 7 . 4 40 SeerJtee ST 7440 M 2X 59 . 9 14 . 5 33 rontanel le . '4030 E 2>< 59 . 8 14 . l 32 oahlQ!'eri a,e.s:,s M 2)( 59 . 5 1 8 . 4 42 Teena� �� Df6802 M 2X 59 . 1 1 3 . 6 36 aetag_old Mnia M 2X 5 8 . 4 1 8 . 2 44 Inter stat� IS593A L 2X 58 . 2 1 7 . l 43 Hoegecreyer 5X2617 M 2X 58 . 1 1 4 . 7 41 Sigcc t7Dl M 2X S8 . 0 13 . 2 3 9 Pf i st.e:r 230C M 2)( 55 . 9 1 8 . 2 48 Kal t11nbur-g K5200 M 2)( 55 . 1 13 . 4 46 Garst i11CtB M 2X 55 . 0 12 . 5 45
5 9

Table s . Corn Performance Trial Continued
Brand and H�brid Agripro 680 Hawkeye SX43 Agripro AP364 Crow ' s 344 Cargill 6127 Wilson 1.5008 Pioneer 3475 Terra TR l03E Pfister 2250 SDAES Check 4
Means
Type and Yield Cross Bu / A M 2)( 54 . 8 H 2X 54. 0 M 2X 53 . 6 M 2X 53. 2 M 2X 52 . 8 M 2X S l .8 M 2)( 49. 0 M 2X 48. 8 H 2X 47. 9 E 2 )( 3 6 . 2
63.l LSD . 05 = 17. 3 Bu/A CV · 1 9 . 7% Planting Date · Hay 4 Harvest Date · October 12
60
Percent Moisture
1 8 .4 1 8. 1 1 4 . 6 13 . 0 16. 2 1e . o 12 .7 13 .l 15. 5 11. 6 16.0
Performance Score Ra�ir;,,g
50 51 49 47 52 53 54 55 56 57

rag1e §. 1988 Corrt
Br s�d ang Y�tiety Wi l�on 1670 S·Brand S S - 54A NC+ 4616 font anelle 4280 Wilson 1640 Hoegemeyer SX2673 Dahlgren OC·541 Northrup King N6348 Asgrow / O ' Gold Rx746 Supercrost Exp 8110 S · Brand S S · 57A Cargill 7877 Tecnagene DF8812 Horizon 7113 Kaltenberg K7500 Crow ' s 488 Curry SC1479 Curry SCl480 Jacques 7770 Horizon 7115 Hoegemeyer SX2632 Supercrost 4386 Mccurdy 6660 Jacques 7820 S · Brand S S · 62A DeKalb T llOO Terra · TR1125 Supercrost 2989 Jacques 6770 Cargill 7993 Dahlgren DC·545 Tecnagene O F8814 Interstate IS663 OeJ(alb 01<636 S · Brand S S · 60C Top Farm sx1112 Lincoln 5422 Hawkeye SX56 Interstate IS613 Garst asss Cargill 6927 Continental 8707 Northrup King 57751 Kaltenberg K7400 SOAES Check 1 Golden Harvest H2466 NC+ 5990 Terra TR1120
Means LSD . 05 17 . 2 B u / A Planted May 4
T ype aMa Yield Pereent tt21s au IA Hai..stuie
L 2X 7 7 . l 20 5 L 2X 77. 0 21. 4 M 2X 74. 3 20 . 8 M 2X 72. 5 19.9 L 2X 72.3 19. 0 L 2 X 71.8 24 . 4 L 2 X 70. 4 19 . 2 L 2 X 70 . 2 20 . 5 L 2 X 68 . 3 19 . 7 L 2X 67. 3 21 . 2 L 2X 64.7 20.3 L 2X 63 . 5 20 . 4 L 2 X 63 . 2 19 . 5 L 2 X 62 . 8 20. 9 L 2 X 62 . 0 19 . 2 L 2X 61.8 19. 7 L 2X 61 . 5 21. 1 L 2X 61 . 4 19 .3 L 2 X 61 . l 19 . 4 L 2 X 61. 0 18 . 9 L 2 X 59 . 2 2 0 . 0 M 2 X 58 . 6 17.9 L 2X 58. 6 19.3 L 2X 57. 0 24 . 2 L 2 X 55 . 7 22 . 5 L 2 X 55. 6 19 . 8 L 2 X 55. 4 19. 1 L 2X 54.8 17. 4 L 2X 53. 9 17. 2 L 2X 50. 8 21 . 7 L 2X 50.3 22. 0 L 2 X 50. 1 21.6 L 2X 49. 8 23 .0 L 2 X 49 . 3 22 . 2 L 2X 48. 8 18 . 7 L 2X 47 . 9 17. 4 L 2 X 46 . 9 23. 7 L 2 X 46. 8 23 . 2 L 2X 4 6 . 4 17 .7 L 2X 45. 5 17. 6 L 2 X 44. 2 19. 0 L 2 X 4 4 . 2 24. 1 L 2 X 42. 9 23. 1 L 2X 42. 4 21. 6 L 2 X 38. 8 23 . 5 L 2 X 38. 1 1 5 . 6 L 2 X 37 . 6 22.3 L 2 X 3 4 . 9 22 .7
56 . 4 20 . 5 C V • 21 . 9% Harvested · October 12
61
l21Ut p e .r terr 111 o n o e· Sc9 r a f! n t1 n 11.
l 2 3 5 4 8 6 7 9
10 11 13 12 15 14 16 20 1 7 19 18 22 21 2 3 2 8 29 26 25 24 27 30 3 3 32 35 36 31 34 40 39 37 38 41 42 44 43 46 45 47 48

Table 1. Continued
l 9EIS 1987 Cult1var 2-cut 3 -cut
Tcla.l To�s1
MTO S82b 2. 77 5. 07 Range lander 2 . 52 4 . 87 Vernal b 2 . 10 5.52 HTO N82 l . 93 4 .96
Roamer 1 . 99 4.90 Drylander 1.80 4.70
Ave rag:e 2 . 48 5.92 LSD (0.05) 0.55 0. 77
1988 �9rsge Yit]d (tons DNIAl_ Cut 1 cut 2 Cut 3 3 ·Cut
6/14 1114 8/23 Tc1,a1
1 . 86 0 .56 0 .09 2 . 51 2 .24 0 . 61 0.07 2 . 93 1. 75 0 .30 0. 12 2 . 17 2 . 18 0.52 0 .09 2 . 79
1 .94 0.56 0.09 2.59 1.86 0 .32 0.05 2 .23
2 . 14 0:62 0 14 2,94 '•S NS 0 . 08 t�S
3 Year Relative a �vg P.! r rD r mance
3 . 45 91 3 .44 91 3.26 86 3 . 23 85
3 . 16 84 2 .91 77
3 78 0 . .59
a % Relative performance = cu1tivar 3 yr average yield/3 yr average or all b cul t 1 vars.
Experimental line, currently not marketed.
64

Table 2 . rorage yield of 35 alfalfa cult1vars planted April 22, 1987 at the Southeast �c��nrch St.at 1on� Ber�sfDrdi SD.
1987 1988 Y ie ld (tons OM /A) 2 % l · Cut Cut 1 Cut 2 Cut 3 3-Cut year Relat ive
Cultivar Total 6/14 7/14 8/23 Total Ava Performancea
SX 217 0 .93 2 .74 1 . 31 0 . 62 4 . 67 2 . 80 124 OK 135 1 . 03 2 .64 l . 31 0 .41 4 . 36 2 .70 119 MTO S82b 0 .77 2 .99 1 .18 0 . 4 3 4 .59 2 .68 118 Vernal 0 .69 2 .79 1 . 28 0 . 4 3 4 .50 2 . 60 115
Saranac 0 .80 2 . 82 1.16 0 . 34 4 . 32 2 . 56 113
GH 737 0 . 87 2 . 37 1 . 07 0 .71 4 .15 2 .51 111 Dynasty 0 .95 2 . 61 1 .13 0 . 33 4 . 07 2 .51 111 f'SRC H·170b 0 . 79 2 . 45 1 . 14 0 . 53 4 . 11 2.45 108
FSRC H · l72b 0.84 2 . 55 1 .06 0 .43 4. 03 2 . 44 107
120 0 .76 2.55 1.04 0 .50 4 . 10 2 . 43 107 Mohawk 0 . 65 2 .50 1 . 1 1 0 . 49 4.10 2 . 38 105 Cimarron 0 .78 2 .43 1 . 09 0.44 3.96 2 . 37 105
Iroquois 0 . 62 2 . 49 1 . 11 0 .51 4 . 11 2 . 36 104 636 0.71 2.53 1 . 12 0 . 35 4 . 00 2 . 36 104 Commander 0 . 77 2 . 50 1 . 00 0 . 45 3 .94 2 . 36 104 XPH 2001 0 . 72 2.44 1 . 05 0 . 43 3 . 92 2 . 32 102
fortress 0 .97 2 . 34 0 .93 0 . 37 3 . 64 2.30 102 Big 10 0 .94 2 .53 0.86 0.26 3 .66 2 . 30 102 Blazer 0 .79 2 .58 o . 78 0 . 35 3 .7 1 2 .25 99 Arrow 0 . 69 2 . 4 1 0 .98 0 .40 3 .79 2 .24 99
F'SRC IH · l71b 1 . 03 1.96 0 . 93 0 . 46 3 . 35 2 . 19 97 Dart 0.73 2 . 3 3 0 .90 0.40 3 .63 2 . 18 96 5432 0 .64 2 . 30 1 . 05 0 . 35 3 .70 2 . 17 96 sx 424 0 .67 2.47 0 .97 0 .24 3.67 2 . 17 96
NAPB 3 lb 0 . 71 2.40 0.91 0 .27 3 . 58 2 .14 94 MTO N82 0 .52 2 .61 0 .92 0 .15 3. 66 2 . 10 93 526 0 .59 2. 34 1 . 03 0.23 3. 61 2 . 10 93 FSRC H·l74b 0 . 77 2 .21 0.93 0 .24 3 . 38 2.08 92
Apollo Supreme 0.67 2 .21 0 . 84 0 . 33 3 . 38 2 . 03 90 .. Saranac AR 0 .65 2 .21 0 . 82 0 .27 3 . 30 1 .98 87
WL 225 0 . 88 2 .22 0 . 67 0 .13 3 . 03 1 . 96 86 Salute 0 .64 2 . 19 0 .71 0 .27 3 .17 1 .90 84 532 0 . 62 2 . 08 0 . 79 0 .22 3 . 08 1 .85 82 Endure 0 . 6 3 2 .10 0 . 70 0 . 19 3 . 00 1 . 82 80 Magnum III 0 . 94 1.88 0 . 57 0 .13 2 .57 1 . 76 78
Average 0 . 76 2 . 42 0 .98 0 . 36 3 .77 2 . 27 LSD (0.05} � NS NS ns us k!i '8' % Rel ative performance = cultivar 2·yr average yield/2·yr average of all ,b
cultivars . Experimental line. currently not marketed .
6 5

PURPOSE. :
HERBICIDE DEMONSTRATIONS AND HERBICIDE RESEARCH 1988
L. J. wrage and P . O . Johnson
Plant Science 88·19
CORN AND SOYBEAN HERBICIDE DEMONSTRATION L. J. Wrage end P. o . Johnson
Evaluate performance of labeled and experimental herbicides for weed control and crop tolerances. Demonst�at1on plots provi de side-by -s i de comparisons. Plots were used in field tours and data coll ected is being presented in educational meetings.
METHODS:
Plot Oesign: Plot Size: Previous Crop: Soi 1 :
Crop: Planted: Cultivation: Herbicide: PPI:
PRE: EPOST: POST :
Evaluated: Rainfall: 1st week
2nd week
RESULTS:
Demonstration 20 ' x so • ; each till age Corn Silty clay loam;
3.2% OM; 6. 2 pH Pioneer 3906 5/5/88 None 5/5/88 515188 5127188 617188 6/24/88 . 28 inches . 03 inches
Soybeans
Demonstration 20• x 50 ' ; each tillage Corn
·s i lty c1ay loam; 3 .2% OH; 6 . 2 pH
Hardin 5113188 None 5/13/88 5/13/88 NIA 6/8/88 6/29/88
.03 inches 1.67 inches
Herbicides were broadcast over chiseled or plowed seedbed. Spring ti llage was the same for both crop sites.
Foxtail was heavy ; significant yel low foxtail was present in late fall. Tall waterhemp was heavy. Variation between plowed and disked seedbed were not consistent. Half of each plot was cultivated; evaluations are for unculti vated treatments.
Corn: Rainfal l during the first two weeks after planting was less than required for maximum performance for some preemergence treatments. However, several treatments performed very wel l. Fourteen plots i n the plowed seedbed and 4 plots in the disked seedbed rated above 95% control for both grassy and broad· leaved weeds.
6 6

' SaybeflflS: s1;mr1c-aot rainfa l l was rece1 veti the sacond week after-pl1nt1ng: germtnatiun or 5om� weetr seeus ha:d star� durin9 tne r-trtt w�ek. Control was generally 5 to 15% less than experienced with �ore favorable 11oisture. Twenty treatments in aoth disked and plowed seedbed exceeded 90% control on both grassy and broadleaved weeds.
Table 1 . Corn Herbicide DeMonstrat1on
Treat•ent lb/A act.
PR,PLANT INCORPORATED Check Eradicane 4 Eradicane+atraz1ne 4+1 Eradicane+Bladex 4+2
Eradicane+Bladex+atrazine 2+1.6+.5 Eradicane+Bladex+atrazine 4+.5+1.5
Sutan+ 4 Sutan+ +atraz1ne+Bladex 4+.5+1 . .5
iHAL�OW PREPLANT INCORPORATED Atraz1ne 2. 5 Atrezine+Bladex .75+2. 25 Lasso 3 Dual 2.5
PR�iMERGEN�E Atrez1ne 2.5 Bladex 3 Check
Dual 2.5 Lasso 3 Prowl 1.5 Rearod 6
•Tophand 2.34 *Tophand+atraz1ne 1.41+1
Lasso+attaz1ne 2+1 Lasso+atraz1ne+Banve1 2+1+ . .5 Lasso+81adex 1 . 25+2 Lesso+Bledex 2+2
67
19B8"' '"' 3�X�Af AV,ei"� Disked Gr Bdlf
0 0 97 89 97 97 96 95
92 98 98 98
89 76 91 92
19 93 72 90 88 85 86 79
64 94 82 41
0 0
89 78 93 83 80 69 95 80
94 91 91 94
84 92 90 96 90 87 94 92
Plowed Disked Gr Bdlf Gr Bd11
· · l Control •
0 0 0 0 96 94 82 62 96 98 88 91 97 96 87 85
95 98 98 99 91 93
92 82 84 57 96 91 86 89
90 96 81 90 89 82 96 87 67 60 94 82 73 48
89 96 76 89 92 58 69 44
0 0 0 0
90 82 82 54 94 88 78 59 90 74 65 62 96 83 77 41
98 98 95 97
96 97 75 84 94 96 90 86 82 75 94 92
P1m,e,ir Gr Bdlf
0 0 e, 70 91 94 93 91
96 97
75 53 95 96
90 95
81 67 85 58
89 94 87 6 1
0 0
90 75 92 78 84 68 92 58
.. .
94 94
93 90

Table 1 Continued
T reatment lb/A act.
Dual+atrazine 2+1 Oua1 +81adex 2+2 Atraz1ne+B1adex . 75+2 .25 Ramrod+81adex 4+2
Lasso+Bladex+atrazine 2+1.5+.5 Dual+Bladex+atraz1ne 2+1 .5+.5 Prowl+Bladex+atrazine l+ .6+.6
EARLY POSTEMERGENCE Prow1+atraz1ne 1 .5+1 Prowl+Bladex 1 . 5+1. 5 Prow1+81adex+atrazine 1+.6+ .6
Atraz1ne+COC 1 .5+1 qt Bladex+X-77 2+ . 5%
Tandem+Bladex+X-77 . 5+1.5+ .5% Tandem+Bladex+at razine+X ·77 .5+1+.5+ .5% Bladex+atrazine+X-77 1 .5+ .5+ .5%
f8t�t86 ENC£ & fARl V POSTDt£RG£NCE Ramrod&8anve1 +Bladex 4&.. 25+1.5 Ramrod&Banvel 4&.5
PREEMERG�NCE & POSTEHERGENCE Ramrod&:Banve1 4&.25 Ramrod&:2 t4 ·0 am1ne 4& . 5 Ramrod&:Basagran+COC 4&1+1 qt Ramrod&Basagran+
atraz1ne+COC 4& .52+ .52+1 qt
Ramrod&Buctril 4& .38 Ramrod&Buctril+atrazine 4& .25+ .5 Ramrod&Banve1+atrazine 4& .25+ .5 Ramrod&Buctr 11+Bladex 4&.25+ .5 Ramrod&Banvel+atrazine 4&..5+1
POST EMERGENCE *M6316+COC . 0039+1 qt
EARL. 'f PQ5nf!1�R.GElACE l PDSTEHERGE'P4C£ *Banvel&Exp . fl+X-77 .5& .0625+ .25%
* Experimental Gr = Green foxtai l , yellow foxtail
1989-W " 3 · Year Avera9.e Oisked Pl aw-e-d Disked Plowed Gr Bd1f !r: Mil Gr 8d1f Gr Bdlf
90 95 92 94 81 83 91 91 82 76 90 86 81 75 91 84 84 88 94 90 80 73 90 84 94 80 96 84 81 65 93 78
96 94 97 94 82 77 92 93 92 91 96 90 81 80 92 90 96 97 98 98
86 98 81 95 79 91 86 94 89 96 84 96 80 77 89 81 84 94 86 95
85 97 96 96 66 90 88 95 84 95 94 97 79 65 91 70
88 98 96 98 81 63 92 69 76 93 78 93 80 68 86 77 62 62 78 70 70 77 85 75
96 98 98 98 90 93 96 98 63 89 90 95
82 92 92 94 59 86 84 87 82 82 94 93 59 79 83 85 86 94 96 96 58 76 84 83
83 90 97 98
82 88 98 98 57 71 82 81 90 95 98 98 64 86 88 90 81 92 94 94 62 88 84 84 92 93 94 96 64 86 86 82 92 98 96 98
68 92 65 98
94 98 95 99 .. . --* * Average 3 ratings/plot
Bdlf = Tall water hemp. rough pigweed. 1ambsquarte r
6 8

Table 2 . Soybean He rbicide Demonstration
198&!• 3-Year ever age �js!S,etf Plowet1 Disked Plowed
T reatment lb/A act. Gr Bdlf G r Titii1 G r Bdlf Gr Bdlf ·% Control - . .. - -
PREPLANT INCORPORATED Check 0 0 0 0 0 0 0 0 Vernam 2. 5 69 83 74 83 54 67 75 67 T reflan .75 95 90 90 88 82 79 85 84 Sonalan 1 96 92 95 93 85 82 89 88 Prowl 1 . 25 94 89 92 90 86 83 84 82
T reflan+Sencor/Lexone .75+ . 38 94 98 95 98 86 92 92 92 Command 1 82 65 89 70 Commence 1.31 93 92 92 90
T r e fl an+Command .75+ .75 90 95 91 90 Amiben+Command 1 .8 + . 5 88 95 90 81 -Command+Sencor/Lexone .75+ . 25 93 98 93 84
*T reflan+Pu rsuit .75+ .06 98 99 98 99 T reflan+Scepte r .75+ .067 96 99 95 98 T reflan+Scepte r .75+ .125 98 99 98 99
Sonalan+Scepter+Sencor/ Lex one .75+ .067+ . 25 99 99 99 99
Sonalan+Scepter+Command .75 .... 067+.5 98 99 98 99 Commence+Sencor/Lexone 1 . 31+ . 3 96 99 97 99
*Prowl+Pursuit l+ .078 96 99 98 98
SHALLOW PREPLANT INCORPORATED Lasso 3 81 87 90 81 70 71 84 73 Dual 2. 5 80 77 85 70 68 51 85 63 Dual+Command 2+ .75 63 77 88 78 Lasso+Treflan 2+ .75 89 - 89 93 96
*Lasso+Pursuit 2+.078 95 99 95 98 Lasso+Scepte r 2+ .125 93 99 94 99
PR�fbA�I ,�co��DRATED l PJtEEMEftGENCE Treflan+Sencor/Lexone&
Sencor/Lexone .75+ . 25& . 38 98 99 97 98 87 91 96 97 Treflan&Sencor/Lexone .75&.5 98 99 96 98 89 93 95 97
PRE EMERGENCE Am 1 ben 3 62 70 93 86 67 79 90 89 Lasso 3 91 86 90 70 81 80 89 80 Dual 2 . 5 84 78 86 61 85 77 86 73
Lasso+Sencor/Lexone 2+ . 5 82 91 78 81 79 89 82 89 Oual+Sencor/Lexone 2+.5 81 91 70 45 81 87 75 78
*Lasso+Pursuit 2+ .063 97 99 83 97 Lasso+Scepter l . 5+ .067 84 97 74 96 Lasso+Scep ter 2+ .125 88 98 84 95
69

Table 2 Continued. l.9-98• • 3·Year Average Disked
Treatment lb/A act. Gr Bdl f
PREEMERGENCE {Continued) Lasso+Amiben 2+2 91 93 Lasso+Lorox 2+1 70 75 Lasso+Am1ben+Sencor/Lexone 3+2+ .25 95 97
•c1nch+Sencor/Lexone 1 . 3+ . 43 89 96 *C1nch+Scepter 1 . 3+ . 125 84 62 Check 0 0
PREEMERGENCE & POSTEMERGENCE *Lasso&Pursuit+X·77 2&. 063+ . 25% 91 87 Lasso&Basagran+COC 2&1+1 qt 77 89 Lasso&Bl azer/Tackle+X·77 2& .5+ .5% 85 94 Lasso&Cobr.a+X·77 2&.2+. 125% 79 97
*Lasso&M6316+X·77 2&.0625+ .25% 85 98 Lasso&Blazer/Tackle+
Basagran+X-77 2&.38+ .25+.5% 84 97 Lasso&C lassic+X -77 2&.016+. 25% 78 98
POSTEHERGENCE Fus i l ade 2000+COC . 187+1 qt 61 0 Poast+COC .2+1 qt 81 0 Whip+COC . 15+1 qt 76 0 Assure+COC . 0875+1 qt 79 0
*Assure+M6316+X+77 . 0875+ .0625+ .25% 42 96 Poast+Blazer/Tackle+
Basagran+COC . 3+ . 25+ . 5+1 qt 92 94
Pl owed Di sked Gr Bdl f Gr Sdl f - �Control --
92 93 85 87 84 80 71 76 97 99 83 90
91 97 88 80 a 0 0 0
89 89 79 87 74 90 85 95 87 94 78 98 82 96 .. -
85 98 83 94 81 98
65 0 72 0 77 0 86 0 75 0 85 0 48 95 ..
90 95 89 90
* Exper iment.a f •* Average 3 rat1�Qilp1at Gr = Green foxtai l . yel low foxtai l Bdl f = Tal l waterhemp. rough pigweed. l ambsquarter
7 0
Plowed Gr Bdl f
92 95 80 80 96 98
0 0
87 93 91 95
88 97
77 0 88 0
90 87

YELYETLEAF CONTROL IN SOYBEANS
L. J. Wrage and P. 0. Johnson
PURPOSE:
Evaluate l abeled and experimental herb1c1 des for velvetleaf control i n soybeans. Treatments included low rate combinations.
METHODS :
Plot Design: Plot Size: Previous Crop: Soil : Crop: Planted: Cultivation: Herb1c1de: PPI:
PRE: POST: LPOS:
Evaluated: Rainfall: lst week
2nd week
RESULTS:
RCB; 2 reps 10 I )( 50 I
Corn Silty clay loam ; 3 . 2% OM; 6. 9 pH Hardin 5/13/88 None 5/13/88 5/13/88 6/8/88 6/15/88 6/15/88
.03 inches 1.67 inches
Pl ots were established in an area with l i ght natural i nfestation . Vel vetl eaf was overseeded before til lage and before final incorporati on pass. Weed stand was heavy and uniform. Differential control was apparent. Competition reduced yielc over 20 bYIA. so·l 1neorpota+...ea t ·eatments that included Command , Sern:or /Lexane . Sce_ptet or Pursu t prov,�led the most consistent control . Several txceed�d 95l control. Perror anc� may � i 5 to 10% less in very heavy soil with a lgng ter� history for ijelv-atleaf.
71

Table 3 . Velvetleaf/Soybean Screening
Treatment lb/A act .
PREPLANT INCORPORATED Check Prowl 1 . 25 Vernam 2 . 5 Treflan+Sencor/Lexone . 75+ . 38
Command . 75 Command 1 Commence 1 . 31 Check
*Commence+Pursu1t 1 . 31+ .063 Commence+Scepter 1 . 31+ .063 Commence+Scepter+
Sencor/Lexone l . 31+.063+ . 25
Commence+Sencor/Lexone 1 . 31+ . 38 Salute+Command 1 . 125+ . 56 Sencor/Lexone+Command . 25+ . 55 Amiben+Command 2+ . 55
Treflan+Scepter . 75+ .063 Treflan+Scepter . 75+ . 125
*Prowl+Pursu1t 1+ .063
Sonalan+Scepter+ Sencortlexone 1+.063+ . 25
Sonalan+Scepter+Command 1+ . 063+ . 5
iHAL!J!V PR£ELA1fr tHCORPDRArtD Lasso+Scepter 2+ . 125
*Lasso+Pursuit 2+ . 063 Lasso+Command+Scepter 1. 5+. 25+. 0937
�!;,PL�NT J:.NtgRPQRAT�Cil & EA..££to1£AJlENCE Treflan&Sencot/Lexone . 75&.5 Treflan+Sencor/Lexone&
Sencor/Lexone . 75+ . 25&.38
PREEMERGENCE Lasso+Sencor/Lexone 2+ .5 oual+Sencor/Lexone 2+ .5 Lasso+Scepter 1 . 5+ . 0937 Lasso+Scepter 2+ . 125
*Lasso+Pursuit 2+ . 063
7 2
1988 2 · Year Average % Control Yield % Control Yie ld
Vele bu/A Vele ti.YLe
0 3 . 6 0 1 3 . 9 50 6 .5 29 18 .7 30 4 . 7 41 1 7 . 3 99 18 . 4 97 35 . 2
86 20.2 91 37 . 0 92 19.3 96 34 .2 88 16 . 4 88 32.5
0 7 . 3
94 16 . 2 90 17 . 5 • • .. --
98 13 .0
98 22 .0 97 36 . 8 98 25 . 0 97 27 . 8 97 38 . 6 92 25 . 3 94 35 . 5
80 23 . 0 90 24 . 2 92 34 . 4 97 21 . 3 98 28 . 4
98 21.8 89 15 . l
84 18 . 4 90 18 .6 92 19.0
82 18 . 0
98 14 .9 98 28.5
74 9 . 6 84 27 . 8 72 12 . 5 83 27 . 4 66 9 . 5 66 13 . 9 75 12 .9

Table 3 Continued
Treatment lb/A act.
1988 Control Yield
Vele bu/A
PREEMERGENCE (Continued)
Amiben Lasso+lorox Lasso+Amiben
3 2+1 2+2
82 32 82
Check O
PREPLANT INCORPOORATED & POSTEMERGENCE Treflan&Tackle/
Blazer+28% N . 75& . 5+1 gal 59 Treflan&Tackle/
Blazer+Basagran+28% N . 75& . 25+ . S+l gal 58 Tref1an&Basagran+28% N . 75&1+1 gal 82 Treflan&Basagran+COC . 75& . 75+1 qt 62 Treflan&Basagran+28% N . 75&.75+1 gal 83 Treflan&Basagran+
Dash+28% N . 75& . 75+1 qt+l gal 82
23 . 7 7 . 3
16 . 2
7 . 8
11 . 1
12 . 8 13 . 8 10 . 7 11 . 1
16 .6
f.B.IPLANT INCORPORATED & POSTEMERGENCE & LATE POSTEMERGENCE Treflan&Basagran+28% N& . 75&. 5+1 gal&
Basagran+28% N . 5+1 gal 75 18. 5
PREPLANI fN�DRPtrP.AiED A POSTEl'l.Eit;_ptet Treflan&Cobra+28% N . 75&.2+1 gal Treflan&Cobra+COC . 75&. 2+1 p t Treflan&Classic+28% N . 75&.0117+1 gal Treflan&Classic+X ·77 . 75& .0117+ . 25%
71 72 54 40
•rreflan&M6316+X·77+28% N . 75&.0039+ . 25%+1gal 55 •rreflan&M6316+Classic+ . 75& .0039+.0026+
X · 77+28% N . 25%+1 gal 55
•Treflan&Pursuit+X-77 •rref lan&Pursuit+
X · 77+10·34·0 *Treflan&Tackle/B lazer+
Pursu 1 t+X· 77 *Treflan&Tackle/Blazer+
Pursuit+X·77 •rreflan&Tackle/Blazer.
Pursuit+28% N
. 75&.063+.25% 54
. 75&.063+ .25%+1 gal 60
. 75& . 25+ .045+ . 25% 50
. 75& . 25+.063+. 25% 42
. 75&.25+ .063+1 gal 68
P,FtEE!LANT lNCDRPOltAtEO .S LATE PilSTOl£�NCE Treflan&Am iben . 75&2 . 7 Check Check
0 0 0
15.1 12 6 7 .0
10 . 4
8 . 8
13.4
14.0
1 4 . 0
5.9
9 . 1
16 . 2
10 .9 4 . 3 4 . 8
• Experimental Vele = Ve lvetleaf
7 3
2·Year Average Control Yield Vele bu/A
82 40 82
0
73 87
87
85
....
....
67
.. .
3 2 . 5 13 . 8 29 .1
11 . 7
24.8 27. 7
28.4
30 . 9
28 .6
. ---

VELVETLEAr CONTROL IN CORN
L. J. wrage and P. O. Johnson
Evalute labeled and experiaental herbicides for velvetleaf control 1n corn. Treatments included low rate combinations.
METHODS:
Plot Design: Plot Size: Previous Crop: Soi l : Crop: Planted : Cultivation: Herbicide : PPI:
PRE: EPOS: POST : LPOS:
Evaluated: Rainfall: 1st week
2nd week
RESULTS:
RCB; 2 reps 10· x so· Corn Silty clay loam; 3 . 21 OH; 6.2 pH Pioneer 3615 5/10/88 None 5 / 10/88 5110/88 6/1188 6/8/88 6/14/88 6/25/88 o.oo inches 1. 70 inches
Uni form, heavy weed pressure. Partial natural infestation, overseeded betore t1 1 1 age and final, shallow tillage. Infestation reduced yield over 60%. Eradicane and atrazine combination treatment at planting or an atrazine ci:m atoing treatm"Hnt ftJ h1•ed l:ly a post meFgD'ncr> r.erbtc1Cfe •tre ganaral l y the ltlD!i l I! rreel:.li11!! systems_ itte- c r-re:--t Of trarlJ season co•petH 1ur, was apparentr Y 1 E lc= 1ndicat� :hE crap fa1 ed to respnna hen wEerls w�re remu�ed wfth �e¥era1 p.as !fflargen� trearm.enl! -rich 1ncludec na plant,"�-t rontrol . �" at ra-t1ng rat� response w.as �iaent �it� se1ni! tre-atmcnts. trop �rJury �as noted �� h 2,4·D. The two-year average compares performance for 1987-88.
74

Table 4. Velvetleaf/Corn Screening
Treat11ent lb/A act.
PREPLANT INCORPORATED Check Erad1cane 4 Erad1cane 6 Eradicane+atraz1ne 4+1.5 Erad1cane+Bladex 4+2 Eradfcene+Bladex+atrazine 4+1.5+1
Blade>< 3 Atrazine 3
f.R£PL�F\ll I f!ZDRflGM .. !filLA FTlSTEMiRGE:t�U: Erad1cane&atrazine+COC 4&1. 5+1 qt Eradicane&2,4-0 amine 4&. 5
PRE EMERGENCE Atrazine 3 Prozine 4 Bladex+atrazine 3+1 Lasso+Bladex 2+2
oual+atraz1ne 2+1 Dual+atraz1ne 2+2 Dual+atraz1ne+Bladex 2+1+1. 5 Atrazine+Banvel 1+.5
EARLY POSTEMERGENCE Prozine 4 Prowl+Bladex 1 . 5+1. 5
Atraz1ne+COC l+l qt Atraz1ne+COC 2+1 qt
Bladex+X·77 2+. 25% 81adex+atraz1ne+X·77 1.5+. 5+ .25%
PREEMERGENCE & POSTEMERGENCE Ramrod&Banvel 5&. 5 Ra•rod&Buctril+atrazine 5&:. 38+.5 Raarod&Buctril+atrazine 5&.. 38+1 . 5
Ramrod&Banvel+atrazine 5&.25+.S Ra�rod&Banvel+atrazine 5&. 25+1. 5
Ramrod&Laddok+281 N 5&1. 04+1 ga 1 Ra�rod&Laddok+Oash 5&1.04+1 qt Ra•rod&Laddok+COC 5&1.04+1 qt
7 5
1988 2·Year Control Yield Average % Vele bu/A Control
% Vele
0 41.4 0 76 87 . 4 78 83 93 .9 87 90 104.8 90 96 93 .9 93 90 104 .8 90
77 83 . 0 94 89. 5 96
90 98.3 84 92 87 . 3 86
64 55 . 7 72 65 58.9 55 61.1 72 48 54 . 5 63
50 41 . 5 49 65. 8 51 51 . 3 64 88 52 . 4
90 72. l 96 7 7 . 5
45 38 . 3 62 69 62.3 80
77 40 .4 82 84 45 . 8 91
64 57. 9 81 92 65 . 5 95 89 61.2 94
48 55.7 73 60 60 . 0 80
82 35 . 0 68 45. 9 75 61 .l

Table 4 Continued
Treat•ent lb/A act.
eBEJritERGEHC'E i PC1Sr1;M,1tC£. CE (Continued) *Ra•rod&M6316+COC 5&.0078+1 qt *R1•rod&M6316+COC S& .0156+1 qt
ffi[[MIB_GEtl;CJ; ik LAfE etlillKfRG,£ ICE
1998 Control -..,-1 e-1-e1 % Vele bu/A
45 58
32 . 8 39.3
2 -Year &1era,gq Control I Vele
Ra•rod&Banvel 5&.25 89 35.0 8' Ramrod&2 ,4·D 8M1ne .5&v5 84 24.0 80 Ra•rod&Buctr11 5&.38 82 40.4 77
J!eEtMERGE�C£ l POSTEMi,RGENCE 6 LATE POSTE�ERGE�CE RaRrod&Buctr1 1+atraz1ne&
Buctri l S&.38+1.2&.25 96 35.0 98 Check o 27 . 3 Check o 25 . 1
wtxper1•ental Vele • Velvetleat
LSD ( • 05) 15.6 '"'fi'"l 162
7 6

PURPOSE :
INTERACTION OF HERBICIDE RATES WITH ROW CULTIVATION IN CONVENTIONAL TILLAGE
L. J . Wrage and P . 0 . Johnson
· Evaluate input levels of herbicide and cultivation on weed control, crop yield and returns in conventional till corn-soybean rotation . Determine the long-term effect of reduced levels of weed control on crop yield .
· Determine if herbicide rates can be reduced when used with cultivation .
Producers and research data indicate herbicide rates can be reduced in certain situations . However there is no consideration for long-term effects on weed population and no indication the practice can be continued each year as weed pressure increases . Row cultivation is one option to at least part of the herbicide inputs ; however the level of each is not documented .
METHODS:
The study i s designed in a corn -soybean rotation . Three herbicide levels representing 100%, 75% and 50% of labeled rate for a preplant , preemergence , and a banded and postemergence treatment are included for each crop. Each herbicide treatment includes 2 cultivation levels. The rotation is designed so the same herbicide and cul tivation level will be maintained each year .
Corn Soybean Plot Design : RCB; 3 reps RCB ; 3 reps Plot Size : 20' x 100 ' 20' x 100 ' Soil : Silty clay loam ; Si l ty clay loam ;
2.9% OM ; 6 . 0 pH 2 . 9% OM ; 6 . 0 pH Crop: Northrup King 4545 Corsoy 79 Planted : 5/10/88 5/13 /88 Herbicide : PP! : 5/10/88 5/ 13/88
PRE : 5/10/88 5/13/88 POST: 6/1/88 6/1/88
Evaluated : 9/23/88 9/23/88 Rainfall: 1st week 0 .00 inches 0 . 03 inches
2nd week 1 . 70 inches 1 . 67 inches
RESULTS:
Weed pressure was generally light but uniform. Green foxtail and tall waterhemp were predominant. Weed control was evaluated by visual estimates and plant counts . Yields were harvested with field plot combine. The seedbed and soil conditions were excellen t : crop stand uniform.
Even light weed pressure appeared to reduce yield . Reduced herbicide rates were adequate when one cultivation was added . Cultivation proved to be especially effective for this season's conditions . A very dry mid-season reduced later weed flushes . Oata in succeeding years will determine if reduced herbicide inputs with cultivation will be adequate if weed populations increase .
7 7

Table 5. Corn Cultivation Study
Cult i Plants/sg �d % Control Yield Treatment vat ion lb/A act . Gr Bdlf Gr Bdlf bu/A
PREPLANT INCORPORATED Eradicane+Bladex 2+1 1 . 67 0 . 67 97 97 66.3 Eradicane+Bladex 3+1 .5 0 .17 0 . 00 99 99 71 .9 Eradicane+Bladex 4+2 0 .00 0 .00 99 99 67 . 1
Eradicane+Bladex l Cul t . 2+1 0 .33 0 . 00 99 99 79.6 Eradicane+Bladex 1 Cult . 3+1 . 5 0.17 0 . 00 99 99 77 .2 Eradicane+Bladex 1 Cult . 4+2 0 .17 0 . 00 99 99 70 . 2
--- · · - -· ····· · · 2 Cul t . 10 . 83 2 . 00 87 93 60.1
PRE EMERGENCE Lasso (Sand} 2 Cul t . 0 . 83 0.50 97 97 68 .1
f:OSTEMERGENCE Bladex 2 Cul t . 2 1 . 00 0 . 33 97 98 71 .2
PRE EMERGENCE Lasso+Bladex 1+1 3 . 83 3 . 50 92 90 68.5 Lasso+Bladex 1 . 5+ 1 . 5 3 .50 2 . 83 94 90 62 .1 Lasso+Bladex 2+2 2.67 2.50 94 91 64 .9
Lasso+Bladex 1 Cult. l+l 0 .50 0 . 33 98 98 68 . 1 Lasso+Sladex 1 Cul t . 1.5+1. 5 0 .50 0 . 50 98 96 70.6 Lasso+Bladex 1 Cu lt . 2+2 0 .50 0 . 17 98 99 72.3
LSD ( .05) 4.05 1.61 4 . 0 3 . 1 22.3
Gr = Green foxtail Bdlf : Tall Water Hemp
7 8

Table 6.· Soybean Cult1vat1on Study
Culti • Tnatmeat vat Ion
MEE�ANT l�Cg.RPall�TtD Sonalan+Sen/Lex Sonalan+Sen/Lex Sonalan+Sen/Lex
Sonalan+Sen/Lex l Cult. Sonalan+Sen/Lex 1 Cult. Sonalan+Sen/Lex l Cult.
... .. - .. ... ... . . . . . . . .. 2 Cult .
P8E:�HmtiENC£ Dual (Band) 2 Cult.
eGSTEt,1(RGENC£ Poast+Blazer+COC 2 Cult.
ERIE Efii1Ef!GEH€: E. oual+Sen/Lex oual+Sen/Lex oual+Sen/Lex
oual+Sen/Lex 1 Cult. oual+Sen/Lex 1 Cul t . Oual+Sen/Lex l Cult.
LSD ( .05)
Gr s Green foxtai l Bdlf s Tall Water Hemp
lb/A act.
.5+ . 125
.75+.25 l+.38
.5+.125
.75+.25 1+.38
2.5
.2+. S+l qt
1+.25 l.5+.38 2+.5
1+.25 l.5+.38 2+.5
7 9
flGnl-!/ � 10 � ,gntrol Yield Gr Bd1r Gr Bdl f bu/A
0.83 2.67 98 89 29 .6 1 .50 l.17 97 94 27.1 1 . 17 0.33 97 97 28 .8
0.17 0.17 99 99 29 . 1 0.17 0.00 99 99 31 .3 0.17 0.00 99 99 27.1
1.50 5 . 3 3 95 83 24.9
0.50 1 . 17 ... si, 27 .9 I
3 .00 4 .50 93 83 26.6
10.00 2.00 81 91 23.2 3 .8 3 1.00 91 92 26.9 3 . 50 1.33 90 95 26.4
1 . 17. 1.83 96 91 29 .3 1 .83 0.00 96 98 32.5 0.83 0.50 98 97 31.0
4 .48 3.13 6.5 11.3 4.2

COCKLEBUR SCREENING/SOYBEANS
L. J. Wrage and P. o. Johsnon
PURPOSE:
Evaluate labeled and experimental herbicides for cocklebur control in soybeans.
METHODS:
Plot Design: Plot Size: Previous crop: Soil: Crop: Planted: Cultivation : Herb1c1de; PPI ;
PRE : EPOS: POST:
Evaluated: Rainfall : 1st week
2nd week
RESULTS:
RCB; 2 reps 10 · x so• Soybeans Silty lOaR; 2.9% OM; 6.0 pH Hardin 5/17/88 None 5/17/88 5/17/88 6/8/88 6/14/88 8/ll/88
L 70 inches o.oo inches
N11tura1 lnfesHan. Trnniln ape heel prHir to plan ting_. He:av_y. unifoflll stand!. oat� bas-ed on vi sua1 o�sarv�t1on �ept1rte-d for label!d heroic1des Sf:�era1 treat•ents provided excellent contr�l. Differences visually apparent. Crop leaf response was less than for other years and was not recorded.
8 0

Table 7. Cocklebur/Soybean Screening
!£jtatment lb/A act.
PREPLANT IHCORPORATEO Check Scepter . 125
*Pursuit .063 Sencor/Lexone . 38
PRfPLANT IN-1:0Ri)lJR."TEO & PREEKERG£�CE Sencor/Lexone&Sencor/Lexone . 38&.25
POST EMERGENCE Basagran+COC 1+1 qt
PDS!t�£ll�tH� & EA.f!LY POSTEMERGENCE Basagran+COC&Basagran+COC .5+1 qt&.5+1 at
PDSTcMERGENtE Cobra+COC .2+1 pt Tackle/81azer+X ·77 . 5+.5% Classic+X·77 .0117+.25% Scepter+X·77 . 125+.25%
*Pursuit+X·77 . 063+.25% *H63l6+X·77 . 0039+. 25%
Rescue+COC 1.5+1 qt Rescue+Tack1e/81 azer+X·77 . 75+.125+.5%
LSD ( .05)
*Experimental
81
co"trel 1fte1ij cacklel)ur .Jw1A
0 15. 9 92 26.9 80 22. 3 82 21.9
72 23.3
98 25.6
96 26.5
92 23.8 62 20.2 90 25.2 94 25.5
94 24.0 35 19.0
82 23. 8 82 22.6
22. 1 5.6

BLACK NIGHTSHADE HERBICIDE EVALUATION
L. J. Wrage and P. o . Johnson
PURPOSE:
To compare labeled herbicides for black nightshade control 1n soybeans. Herbicides are used at rates specified for this weed.
METHODS:
Plot Design: Plot Size: Previous Crop : Soil: Crop: Planted: Cultivation: Herbicide: PPI:
PRE : EPOS: POST:
Evaluated: Rainfall: 1st week
2nd week
RESULTS:
RCB; 4 reps 10 t )( .50 I
corn Silty loam; 2. 9% OM; 6. 0 pH Hardin 5/17/88 None 5117188 5/17/88 6/14/88 6/20/88 10/6/88 1 . 70 inches 0 .00 inches
Black nightshade e•erged slowly. Density was 1 1g�t but unifor•. Tall waterhe•p became a significant weed and affected yield in 1 988 110re than nightshade. Five treatments exceeded 90% control. Late e1erging nightshade was a problem in postemergence treat•ents lacking residual. Preplant incorporated treatments were usually superior to the same herbicides applied pree•ergence in 1988 .
8 2

Table 8 . Black Nightshade Herbicide Evaluation
1988 3·Year Average % Control Yield % Yield
Treatment lb/A act. Blns Tawh bu/A B lns bu/A
PREPLANT INCORPORATED Check 0 0 7 . 4 0 19 .8 T reflan . 75 0 67 30 . 0 13 35.4 Sona1an 1 .25 46 94 28.5 49 30.8 Lasso 3.5 86 87 27 . 1 89 36.2 Dual 3 67 87 27 . 6 80 36 .1
Sonalan+Lasso 1 .25+2 . 5 83 96 30.2 87 32 .6 Sonalan+Oual l .25+2 77 95 28 . 6 87 28 .4
"'Prowl+Pursu1t l+ .063 98 96 29. 3 Prowl+Scepter 1 . 25+ . 12 96 98 30 .8 Command+Sonalan . 75+1.25 34 92 28 .6
�IJ'W ?REPLANT INCDRP!IBAIE'..C T reflan+Lasso .5+2 56 76 24 . 7
PREPilANT INC<mPOR� T £10 l ?REEMERGE�CE Sonalan&Amiben 1 .25&2 89 98 29 .2 90 31.4 Sonalan&Lasso 1 . 25&2 . 5 92 99 29. 3 94 31. 3 Sonalan&Oual 1 .25&2 79 98 29 . 9 89 32.2
PREEMERGENCE Amiben+Oual 2+2 64 95 27 .2 84 33. 1 Lasso+Amiben 2 . 5+2 66 89 30 . 3 84 36.1
Dual 2 . 5 45 66 10.4 61 27 .2 Amiben 3 57 92 30.6 74 33.9 Lasso 3 61 69 23 .6 81 34 .l
ciREPlANT IN£QBPJ!�IEO ll EARLY POSIEMERCE'Nct Treflan&Cobra+X·77 . 75&.2+ .125% 94 96 30.0 Check g 0 11 .1 0 20.3
e!f!.\..!'!I INCflRPl!RA.TEO !. PVSJEMEllGENl:E
T reflan&Blazer+X·77 . 75& .5+ . 5% 41 99 29.2 54 33.9 Treflan&Basagran+COC . 75&1+1 qt 29 94 25.4 44 33.2 Treflan&Bl azer+
Basagran+X-77 . 75& . 125+ .25+ . 5% 28 96 29 .1 64 34.9 *Treflan&Pursu it+X-77 . 75&: .063+ .25% 90 95 27.0 T reflan&Scepter+X·77 . 75&.125+ .25% 64 96 29 .1 T reflan&Classic+X-77 . 75& .0117+.25% J> 92 27 .9
LSD ( .05) 12 . 1 5 . 7 6 . 8 10 . 6 5 .2
*Experfmanla1 Blns = Blacknight shade Tawh = Tall Water Hemp
8 3

PURPOSE :
INTERACTION or HERBICIDE RATES WITH ROW CULTIVATION IN RIDGE-TILL
L. J. wrage and P . O. Johnson
· Evaluate input levels of herb1c 1de and cultivat1on on weed control , crop yield and returns i n ridge-till corn-soybean rotation.
· Determine the long- term effect of reduced levels of weed control . Determine i f herbic ide rates can be reduced w ith normal operat1ons in ridge· ti ll systems.
Producers frequently suggest weed problems are reduced after 2 - 4 years of successful ridge -till. This study will evaluate the effecti veness of cultivation with several levels of herbicide inputs.
METHODS:
Three herbicide levels represent ing 100%, 75% and 50% of full labeled rate for preemergence herbicides and a banded application are compared to an untreated check. The same level of herbicide i nput will be maintained each year i n the corn-soybean rotation.
Plot Design: Plot Size: Previous Crop : Soil:
Crop: Planted : Herbicide: PRE: Evaluated: Rainfal l : 1st week
2nd week
RESULTS:
RCB; 3 reps 25 ' x 100· Corn Silty clay loam ;
3.1% OM; 6 . 0 pH Pioneer 3704 5/5/88 5/5/88 9/23 /88 0.28 inches 0.00 inches
RCB; 3 reps 25 ' x 100' Corn Silty clay loam ;
3 . 1% OM; 6 . 0 pH Century 04 5/1 3 / 88 5/13/88 9/23/88 0 . 03 inches 1 . 67 i nches
Weed pressure was l i ght ; the area has been well managed and establ i shed i n ridges previously. No s ignificant differences 1n weed control or crop y ield were noted in this initial year of the study . Crop y i eld was less on the ri dgesystem compared to the conventional companion study; some may be due to varietal di fferences. Some moisture stress could have occured i n the r i dges dur i ng the hot, dry mid-season period.
84

Table 9. R1 dge·Ti1 1 Study Corn
Plants/sg �d % Control Yield Treatment lb/A act. Gr Bdlf Gr Bdlf bu/A
PREEMERGENCE
3 Cultivations 0 .67 0.17 98 98 33 .0
Lasso+Sencor/Lexone 1+.25 0 . 33 0 .83 97 95 30 .9 Lasso+Sencor/Lexone 1 .5+ . 38 0.17 0.33 98 97 29.2 Lasso+Sencor/Lexone 2+ . 5 0 .33 0.17 98 98 32 . 3
Lasso (Sand) + Sencor/Lexone (Band) 2+.5 0 . 83 0.33 96 96 35 .7
LSD ( .05) 0.63 0.92 1 . 8 3 .2 7 .2
Table 10. Ridge-Ti 1 1 Study Soybeans
F) ntsJsci vd" J contro1 'til!:10 Treatm:snt l tJ/ A net. §r_ � � Brl'] f ...AWA
PREE�MERGENCE
Dual+Sencor/Lexone l+.25 0.00 0 .00 99 99 25.7 Oual+Sencor/Lexone 1 . 5+ . 38 0 .00 0 . 00 99 99 22.2 Oual+Sencor/Lexone 2+ . 5 0 .00 0 . 00 99 99 23 .0
Dual (Band) + Sencor/Lexone (Band) 2+. 5 0 . 00 0.17 99 99 23.0
3 Cu1t1vations 0.17 0 .83 97 95 20 . 6
LSO ( .05) 0.24 0.32 1 . 8 1 . 5 5 .7
Gr = Green foxtail Bdlf = Red Root P1 gweed
8 5

HERIICIO£ CARRYOVER
L . J . Wrage and P. o . Johnson
euRPOSE:
Evaluate 1988 corn response to 1987 soybean herbicide treataents ror velvetleaf control .
METHOD�:
Plot Design: Herbicides Applied: PPI:
Herbicides 1988: Crop 1988: Planted : Cultivation: Soil pH:
O.M. texture:
Precipitation:
PRE:
S/1/87 to 6/lS/88 Hor•al tor this period
RESULTS:
RC8; 2 reps ,,1,187 ,11,t87 Hone Corn · Pioneer 370• 5/5188 lX 6.9 3.0 Silty clay loa•
2s.1• inches 32.11 1nehes
Corn we$ planted no·tt l l as fi l ler crop across 1987 soybean velvetlear herb1e1de test area. No tell or preplant1ng til lage. Visual evaluations and 11easureaents are reported tor selected soil applied tre1t11ents.
No ,d1 fier!lnce.& •er� noted at eaargence to about 12· 1nch stage. Stunting in n•" ttratents tJecaR tGIRtrcnt Ind rP11ined evident for several weeks. Height rd1fl'ierenc,es weire rnot vtSU11ly gp,ar-ent ilt harvest. Stand count and yield vari ed
rlrDl'll-$1 derdlf !but _,,. not staUst1cal1y significant.
86

Table 11. 1987-88 Herbicide Carryover
Normal Stu"ted Stand Plant Plant Ear Count Yield Height** Height** Hei ght**
Treatment(l987) lb/A act. 10-14-88 bu/A 6·15-88 6 ·15 ·88 10-14-88
PREPLANT INCORPORATED
Prowl 1 .25 72 108.2 38 . 5 26 . 4 Vernam 2'.5 66 86 .4 37 . 0 26.5 Treflan+Sen /Lex . 75+ .38 18 126 .9 39 . 0 ·-· .. 29 . 3
Command 1 68 104 . 6 37.0 27.1 Commence 1 . 31 62 106 . 3 3 7 . 5 29 . 2 Treflan+Command . 75+.75 72 107 . 3 25 . 6 Prowl+Scepter 1 . 25+ . 125 72 107 . 8 24.5 16 . 5 26.3
Squadron 3 54 80.7 25 . 5 19. 0 24.8 Treflan+Scepter . 75+ .125 72 112 . 4 23 . 5 15. 0 29 . 8
*Treflan+Pursuit . 75+ . 09 72 114 .9 26 . 5 20 .0 29 .2 *Prowl+Pursuit 1+ . 078 76 129 .1 25 . 5 18. 0 3 0 . 7 *Sen/Lex+Pursuit .25+ . 078 66 102 . 0 26 . 5 19 . 5 27 .1
SHALLOW PREPLANT INCORPORATED oual+Scepter 2+ .125 7 0 90 .5 24 . 5 14. 0 27 . 3 Oual+Command 2+ . 75 70 96 . 9 39 . 5 28.9 Lasso+Command 2+ . 75 64 82 .4 36 . 0 26 . 9 Lasso+Commend 2+ . 5 52 79 .4 34 . 5 28. 1
PREEMERGENCE Oual+Sen/Lex 2+ . 5 70 91 . 3 34. 5 27 .6
LSD ( . 05) 19 . 0 40 . 8 6 . 0 7 . 5 5 .2
•Experimental **Measured 1n inches
8 7

NO-TILL CORN AND SOYBEAN HERBICIDE DEMONSTRATION
L. J. Wrage and P. 0. Johnson
PURPOSE :
To compare performance of labeled herbicide programs in three no -ti ll systems: corn on soybean residue, soybeans in corn residue and soybeans in grain stubble. Treat•ents represent preplant residual, preemergence and postemergence syste•s that are most promising. The herbicide treatments for corn include some treatments with low atraz1ne rates to al low rotation to soybeans. Plots are utilized for producer tours and in field training events.
METHODS:
Plot Design: Plot Size : Previous Crop: Soil : crop: Planted: Herbicide : FALL:
EPP: PRE: POST :
Evaluated: Rainfall: 1st week
2nd week
Plot Design: Plot Size: Previous Crop: Soi l : Crop: Planted: Herbicide : FALL:
EPP : PRE: POST :
Evaluated: Rainfal l : 1st week
2nd week
Corn on Soybean Residue
Demonstration 20' x 100' Soybeans Si lty clay loam; 3.2% OM; 6 . 2 pH Pioneer 3704 5/5/ 88 10/26/87 3/31/88 515188 5/27/88 6/29/88 0 . 28 inches 0.00 inches
Soybean on Corn Stalks
Demonstration 20' x 100' Corn s; tty clay loa•; 3 .2% OM; 6 .2 pH Century 84 5/13/88 10/26/87 3/31/88 5 /13/88 6/7 /88 6/29/88 0.03 inches 1 . 67 i nches
88

Plot Design: Plot Size: Previ ous Crop: Soi l : Crop: Planted : Herbicide : FALL :
EPP: PRE:
Eval uated: Rainfal l : 1st week
2nd week
RESULTS:
Soybeans in Grain Stubble
Demonstration 20' x 100 ' Oats Si l ty c lay loam; 3.2% OM; 6. 2 pH Century 84 5/13/88 10/26/87 3/31/88 5/13/88 6/29/88 0.03 inches 1.67 i nches
Foxtail. tal l waterhemp and redroot pi gweed remain suffi ciently heavy for eval uation. The plot areas have been ma i ntained in no·ti l l for five seasons ; with only maintenance herbicide levels in the fi l ler year . Velvetleaf are hand rogued from the plot area. Data are presented i n the fol l ow ing tables:
Corn on Soybean Residue: Several treatments were excel lent , exceed i ng 95% control on a l l species. These required no add i t i onal inputs for weed control . The effectiveness of atrazine continues to be apparent. Reduced atrazine rates to .5 lb/A require considerable repl acement herbi c i de i nput .
Soybeans on Corn Residue : Weed control i s more variable and general ly less efffective in thi s rotation than when soybeans are no-ti l led i nto gra i n stubble. Only two treatments exceeded 90% control ; these rated 80% wou l d require addit i onal herbicide and/or cult ivation and those under 80% are unsatisfactory.
Soybeans on Grain Stubble : Weed control in this system conti nues to be outstanding for several treatments . Crop growth i s a lso excel lent. Several combinations of fal l or spring early preplant treatments were near ly weed free the entire season. Some black nightshade was noted i n plots w ith Prowl or Surfl an and metribuzin.
8 9

U) 0
Atrazine <3>
Atrezfne ct .5) Atrulne (ZMl••l (2.5)
m-llll call 09DtSntATlC. scutheat a .... rch fal'II
,.
OILY PAEPLMT
01.ml (2.S)
Atra.ine (J) AtMll.ine <Z>�IJU;llt (2.S) Atruine <Z��u.�11 "' (2.5)
Atruine (2) Atruine (1.D),�llo..Ql (1.5) Atrazine (.5,..l.teJc (1.5)+
b11111t (1.5)
..... (2�•C)uial (1.5) AtNIZine (.S>4ladm (1.5)
PIESEICjEIICE
DI l (2.5) At.-.zfne (.'6�•0.al (1) Atnrzfne (.5Mledea (1)+
11� .. , (1)
Grmaxacw (.5)+1·77 (.SI)+ atruine (1.5>+0ual <2>
Gr..w:nt ( .S)+X· 77 ( .51)+ atraiine (.5)+9ll!l!Jr:• <2>• Dial <2.S)
Atnzine (.5)+ ., .... (1.5)+ X-77 ( .125S)
ltOl.ftLIP (.75)+etrazine <1>• ll�JJ (2)+L .. M> NT (2.5)
2,4·D e.t <O+crop oil <1 qt)+ Atrez.fne (1) .. l w (2)+ �Q "1 (2.5)
s cont!:JL S!: !5iLf
92 "
96 " 9t "
95 " • " • 99
96 99 99 99 99 99
15 95 90 •
16 •
a 95
,, 96
14 95
J;Jli'..-:Q!Cff' (.5)+ Atnzine O.SJ>1Jil (1 qt) as • X·77 (.\1)1•Uuo NJ (2.5)

l\lJll,l (2.5) Dial (1.5)
EAIJY PIEPUNT
awl (1.5) 'Cluol (1.5)
Scepter (.1ZS)+o1al (1.5) �rsuit (.063)+oual (2)
Dual (l)+senJLe1 (.38)
IIIUl (2.5)
"]Jull( (2.5)
IIIO•, j U. lilnll!ao j .. Clllll lllU-Q l.l�r:TOIII U\eMt lesarch f ...
,'!i!lllll
P@EEJIRGEIICE
Sen/Lex (.5) n1.ul U t•ll!IIJ,l,e• I . '5,
�Liil (1)+Sen/leit (.5) Dial c , m 1ru,-1 1h c ot: .. u
Dual (1) Dual (1)
Sen/Lo (.D)
-t.r-aicone (.5)+1-77 (.SJ.)+ lasso NT (2.5)+f'ursuit ( .06.l)
Gr�one (.5)+X-77 (.SI)+ leMO NT (2.5)+Scepter ( .125)
Gr.oxone (.5)+X-77 (.SJ.)+ Duel (2.5)+Servlex (.5)
RounoJp (.75)+Lasso MT (2.5)+ SWLe:. (.5)
2,4-0 est (.75)+ttCIU'd,jp (.11)+� LIIUO NT (l)+sen/lu (.S)+oll (1 qt)
Rou,o.ip (.18)+AS+2,4·D e.t (.75)+ cr-ap oil <1 qt)
8� (.5)+1·77 (.St.)
s '5!!:111:21 §.[ le!!
60 91 54 90
58 92 94 916
88 87 91 91
915 96
95
93 IO
62 89
56 90
66 10
f'ur11Uit ( .06.l) 16 25
Classic (.0417).Pinwc:le (.IJCor,:i>• 10 ) X • 77 (. 1251.)+,i'.'.O'I N (J qt)
Poast (.3)+tlazer (.5)+ 65 45 llms.mrtn <. ?S)+X· 77 ( .1.lWJ
Fu.Hade zool) (.117) .. laer (.5)+ 30 10
1�r1111 (.75)+X•77 (.1251.>

'!kcph!r c r 1Ulllil'dw\ Cl-�>
'ac.r.,,tt'f' f .1�t
U)
'"' �Id'·� ... Cr = tellOIII foatail
--11'11.L 'Slffilf.¥!1 m• ffllllll£ IIICIIIIIIIUMI Im �t 1111•rda J11n1
EARLY PREPUIIT !'@EQPW..Cl
Ill" • ('I .1J �l (1)
'!!Cmtt'r c .1iu •Ck I U..St " l (1) ·�n c.w1-11�1 n.·\> llulil (1)
(",UV1ll!'II [,il!'l,�i (1-)) llllfll (1) ��l!fllnr ( .fZS)+f>ra.,,l (1.S)
*Pursuit (.M\�,11rwl (.1S)
P""l (1.S)+Smw:or/leaane ( .39) Im'!,:!°' /l t1 11)(11: < .D) 5:l.lr'f l ,VJ 1 1 . ,,. l;lrAJII'• ' Jiit �IJUID:l!')e' ( .D)
l..o lff (1.S>+Strir:or/leacne (.JI) L.ao 111 (1)+Sene0r/leaone (.35) L.-.o (1.5)+5encor/laane (.JI) Lw.o (1)+sencol"/Laone (.D)
1k t (1.S)+S..Cor/Laone (.38) Dial <1>+5encor/Lexone (.33) *Karneas (1.5)+5encor/lexone ( .]I) ffamess (1)t'5cnl:C)1 /Le.xcne (.33)
Dwil (1.5) t10;1 I C 1J , kitx:n t� ft•ioo!:fll:!01 it '3,..
&..-...ane (.5)+X·71 (.5'1)+ P11�l C2.5)+S41!1'1COt'/lexone < .S>
ROU'IILI) (.75)+lHIO NT (2.S)+ �or/le•one (.5)
Bdlf = tall
I cantml
It IIW
• " " "
" 91 99 "
,. 91 96 " 97 91
9S " 9J
90 9'
14 "
9J 95 96 97
c.�1 92 91
15 M
90 9J

Evaluat ion of Insecticide P erformance on Variou s Insecticide Historie s Garret son and
Hurle y, South D a k ot a , 1988
David Walgenbach, Billy fuller and Mark Boet el
Plant Science 88·20
In 1985, an insecticide h istory study was initiated by establishing four insecticide histories (Counter, Oyfonate, Furadan, and Lorsban) at Hurley, so . This field had been reported to be a Lorsban problem in 1984 with a history of fou r prior annual applications. Each of these history areas was 0 . 7 acres . Also in 1985, five insecticide histories (Broot, Counter, Dyfonate, Furadan, and Lorsban) were established in a field near Garretson, SD . The Garretson Field had been reported to be a Dyfonate· Furadan problem field in 1983-84 with a history of alternate annual applications of Furadan and Dyfonate . Each of these history areas was 1.2 acres .
In 1986, 1987 and 1988 these history treatments were maintained. A portion of each of the history plots was removed from these history regimes each year to test the efficacy of six major corn rootworm compounds (Broot, Counter, Dyfonate, Furadan, Lorsban, and Thimet) at 2 rates (0.75 and 1 . 0 lbs AI/acre). The design in all areas was a randomized complete block with four (Hur l ey ) or five (Garretson) replication. Treatment plots were 45 feet by one row . All insecticides were applied in a 7 -inch band with modified Noble metering units mounted on a John Deere 71 Flexiplanter . The 1985 through 1988 data sets show the performance of major insecticides on their own and 3 and 4 alternate use patterns .
Efficacy of the various treatments was assessed by examining five roots from each plot for rootworm feeding damage using the Iowa 1 to 6 scale. P lant stand and height measu rements were taken in June for all treatments . Yield data was collected at Hurley and Garretson. A mechanical failure of the center pivot irrigation system during a critical pollination period at Hurley resulted in the production of sterile ears . Thus, yield results for Hurley were not included in this report for 1988 .
93

Table 1. Initial efficacy ratings for rootworm compounds used 1n
the subsequent 3·yr history study at Garretson and Hurley. SD, 1 985.
Rootworm f'ormu· Rate Percent Location compound lat i on ( l bslac) root protection
Garretson8 Counter 15G 1 . 0 72 Lorsban 15G 1 . 0 43 Dyfonate 20GM 1 .0 46 f'uradan 15G 1 . 0 49 Thi met 20G 1 . 0 40 Broot 15GX 1 . 0 51
Hurleyb Counter lSG 1 . 0 83 Lorsban 15G 1 . 0 63 Dyfonate 20GH 1 .0 63 Furadan 15G 1 . 0 65 Thi met 20G l. O 64 Broot 15GX 1 . 0 72
8Report to have experience a Dyfonate-Furadan problem in 1983 and 1,e4 following a lO·yr history of alternate use of these compounds.
bReported to have experience a Lorsban problem in 1 984 which followed a 4-yr history of us1ng this compound.
94

Table 2. Efficacy of six major rootworm compounds in respect to
the established rootwor� insecticide history at Garretson. SO.
Establisheda Rootworm F'ormu· Rate Percent root protecti on history compound lat ion (lbslac) 1986 1 987 1 988
Dyfonate Counter 15G 1 . 0 73 73 68 Lorsban 15G 1 . 0 63 65 69 Oyfonate 20GM LO 41 71 65 Furadan 15G LO 50 71 69 Thi met 20G LO 32 66 Broot 15GX 1 . 0 58 63 69
Counter Counter 15G 1 . 0 59 68 69 Lorsban 15G 1 . 0 54 61 49 Oyfonate 20GM 1.0 42 64 81 Furadan 15G 1. 0 43 54 39 Thi met 20G 1. 0 45 66 Broot 15GX 1 . 0 53 70 53
ruradan Counter 15G 1 . 0 73 76 82 Lorsban 15G 1.0 52 71 71 Oyfonate 20GM 1.0 40 68 76 ruradan 15G 1. 0 25 27 25 Thi met 20G 1 . 0 33 56 Broot 15GX 1 . 0 41 55 44
Lorsban Counter 15G 1 . 0 77 70 77 Lorsban 15G 1. 0 44 65 78 Oyfonate 20GM 1 . 0 53 71 66 Furadan 15G 1. 0 28 57 40 Thi met 20G 1 .0 52 59 Broot 15GX 1. 0 48 55 57
Broot Counter 15G 1. 0 75 76 68 Lorsban 15G 1.0 54 71 78 Dyfonate 20GM 1.0 47 71 78 Furadan 15G 1 . 0 33 41 24 Thi met 20G 1. 0 40 69 Broot 15GX 1.0 37 50 30
8Plots were established in a field reported to have experienced Oyfonate·Furadan failure in 1983-84; and the five history plots were initiated during the Spring of 1 985.
9 5
ii

11
Table 3 . Efficacy of six major rootworm compounds in respect to
the established rootworm insecticide history at Hurley. SO .
Establisheda Root worm rormu· Rate Percent root protection history compound lat ion ( l bslac) 1986 1987 1988
Dyfonate Counter 15G l . 0 73 73 68 Lorsban 15G L O 63 65 69 Dyfonate 20GM l O 41 71 65 ruradan 15G 1 . 0 50 71 69 Thi met 20G 1 . 0 32 66 Broot 15GX 1 .0 58 63 69
Counter Counter 15G L O 59 68 69 Lorsban 15G L O 54 61 49 Oy fonate 20GM 1 . 0 42 64 81 F'uradan 15G 1 . 0 43 54 39 Thi met 20G 1 0 45 66 Broot lSGX 1 .0 53 70 53
Furadan Counter 15G LO 73 76 82 lorsban 15G 1 . 0 52 71 71 Oyfonate 20GM 1 .0 40 68 76 Furadan 15G L O 25 27 25
Thi met 20G LO 33 56 Broot 15GX 1 . 0 41 55 44
Lorsban Counter 15G 1.0 77 70 77 Lorsban 15G L O 44 65 78 Oyfonate 20GM 1 . 0 53 71 66 Furadan 15G L O 28 57 40 Thi met 20G 1 . 0 52 59 Broot 15GX 1 . 0 48 55 57
Broot Counter 15G L O 75 76 68 Lorsban 15G 1 . 0 54 71 78 Dyfonate 20GM L O 47 7 1 78 Furadan 15G L O 33 41 24 Thi met 20G L O 40 69 Broot 15GX 1 . 0 37 50 30
3Plots were established in a field reported to have experienced Dyfonate - ruradan fa ilure in 1983 -84 ; and the five history plots were initiated during the Spring of 1985.
96

•
..
••

...
The following replaces Table 3 in section 88-20
T tll1;. 3. Eff icac:.y of" six m.:ij or roo't'WOl!m ccmpoumls i..n ?'es r,ua·crt Jfu?tle.y
,. SD tr11 tbe as-t.ablish�d riootworm insi?O'tkid� hirtO'l'JI a't
Establisheda Rootworm Formu- Rate Parea-nt rcot 2rot:eetio·n history com-2:9und lat ion (lbs/ac) I§1.s l.9i' 1988
Dyfonate Counter l SG 1 . 0 7 3 7 7 7 0
Lors'ban lSG 1 . 0 69 76 69 Dyfonate 20GM 1 . 0 &J 8 59 so
Fur ad an l SG 1 . 0 so 69 S6 Thi.met 20G 1 . 0 59 so Broot 1 5GX 1 . 0 69 68 62
Counter Counter 15G 1 . 0 6lJ 7 5 7 1 Lorsban lSG 1 . 0 61 7 0 5 2 Dyfonate 20GM 1 . 0 62 68 62
Furadan lSG 1 . 0 5 7 74 .. Thi.met 20G 1 . 0 1.Jl 6 5
Broot lSGX 1 . 0 65 7 3 6 2
Furadan Counter lSG 1 . 0 70 7 6 Lorsban l SG 1 . 0 53 71 Dyfonate 20GM 1 . 0 !f 8 56 Furadan 1 5G 1 . 0 31 I.JS Thimet 2 0G 1 . 0 50 Broot l SGX 1 . 0 56 26
Lorsban Counter l SG 1 . 0 7 2 76 71 Lorsban lSG 1 . 0 56 65 61 Dyfonate 20GH 1 . 0 65 61 5 8 Furadan lSG 1 . 0 39 52 52 Thim et 20G l . O 60 58 Broot lSGX 1 . 0 68 ,� 52
a Plots were established in a field reported to have experience Dyfonate-Furadan failure in 1983-9 � ; and the five history plots w�re initiated during the Spring of 198 5 .

European Corn Borer Trials
A corn (Pioneer 3475) fi eld near Delmont , SD was chosen for eva luating 2 9 European corn borer (ECS), Ostr inia nub 1 1 a l i s Hubner, treatments. On 5 May 1988, the crop was sown with 96 . 5 cm (38 in) row spacing. Preapplication counts i ndicated a uni form di stribution of fi rst- , second - , or thi rd- instar ECB larvae in 30% of those corn stalks sampled .
Treatments (2 untreated controls, 2 liqui d , and 25 granular compounds) were established to evaluate their effi cacy in controlling first brood ECB larvae. Granular compounds were applied (18 June 1988) to s ingle row plots (0. 9 cm by 30.5 m) i n a randomi zed complete block design with 4 replications. Granules were placed in the whorl of the corn plants from a hi ghboy using a pnematic applicator powered by a 3 . 5 horse power eng ine. Nobel head metering units were mounted on a modi fied cha in driven apparatus which regulated the amount of granular insecticide released. Li quid compounds (Pounce 3 . 2 EC) were applied � i th a 3 gal co
2 backpack
sprayer.
Insecticide application rates were computed on a broadcast basis using band wi dth of 12 inches applied di rectly i n the whorl. These rates may be different from those reported by other i nvestigators where treatments are computed on a 1 1near area basis (linear ft of row) that are utilized for establishing corn rootworm application rates. The broadcast appli cation rates are approx - imately one- third the rootworm application rates.
At the 48th day (5 August 1988) postapplication, twenty corn stalks were randomly chosen from each plot. These plants were split vertically and examinded for ECB tunnelling damage. The number and length of ECB cavities were recorded and analyzed using the General Linear Model (GLM) procedure with means compared by Duncans Multiple Range Tests.
No phytotox1c response from these treatments were observed i n this study. Data indi cated that 20 treatments were signi ficantly (P < 0.05) less damaged when compared to the untreated control which sustained the least ECB injury of the two untreated control pl ots (Tab1e 4). Pounce 3. 2 EC, Lorsban 5G, and the high rate (0.5 lbs AI/acre) of Chlorpyr1fos were observed as the three most effective treatments in reducing first -brood ECB damage in corn.
9 7

Table 4 . First-brood European corn borer (ECB) control using
ground application (High-boy) of treatments 1nto whorl-stage corn at
Delmont, SD, 1988.
Corn Treatment Pounds Formu· Total yield
AI/acre lat ion ECB cav1t1es (bu/acre)
Pounce 0.150 3 .2EC 0.025 a 142 .2 abcde Pounce 0.100 3 .2EC 0.23 4 ab 143 .2 abcde Chlorpyri fos 0 . 500 7 .5G 0 . 375 abc 151 .0 abed Lorsban 0 .750 15G 0 .475 bed 143 .2 abcde Lorsban 1. 000 15G 0 .475 bed 140.2 abcde Force 0. 100 1.5G 0 .525 bcde 139 .7 abcde Dy fonate 1.000 20G 0.534 bcdef 144 .0 abcde Pounce 0.125 1 . 5C 0 .575 bcdef 145 .0 abcde Counter 0 .750 15G 0.638 bcdefg 154 .2 abc Counter 1 . 000 15G 0.638 bcdefg 147 .5 abed Thi met 1 . 000 20G 0 .709 cdefg 148 .8 abed XR0·429 0 .250 2G 0 .825 cdefgh 155 .0 ab Force 0 . 125 1.5G 0 .863 defghi 160.5 a Thi met 0 .750 20G 0 .875 defgh f 143 .2 abede XRD-429 0.063 2G 0 .938 defghij 160 . 3 a Lorsban 0.500 15G 0 .963 efghij 121.5 e SC0567 0.750 lOG 0 .963 efghij 13 3 .5 bede Brace 0 .500 lOG 0 .975 efghij 134 .2 bcde 8-8451 1. 000 15G 1.013 fghi 150 .5 abed SC0567 0.500 lOG 1 . 063 ghij 130.2 dee Furadan 1 . 000 15G 1.213 hijk 151.2 abed Pounce 0.100 1 .5G 1 . 3 00 ijk 159 .2 a B -8451 0 .750 15G 1 . 3 58 jk 144 .5 abcde XRD -429 0. 125 2G 1 . 363 jk 154 .2 abc ruradan 0.750 15G 1 . 588 kl 143 :2 abede 1st check plot 1 . 588 kl 139.0 abcde SC0567 1 . 000 lOG l . 625 kl 143 .2 abcde Chlorpyr i fos 0 .250 7 . 5G 1 . 959 lm 145 .5 abed 2nd check p1ot 2 .263 m 128 . .2 de
98

Table s . Second-brood European corn borer (ECB) control using a
a central pivot injector systeas for application of treataents at
Delmont. SO, 1988.
ECB larvae Corn Treataent Pounds f'or•u· Total 26 days yield
AI/acre lat ion EC8 cavities post application (bu/acre)
Untreated 1 .,4 a 0.88 a 146.4 a
01pe1 1 .5 ES 0.60 be 0.41 be 138 .2 ab
Oipel 2 .0 ES 0 .34 c 0.25 c 125 .8 c
Oipel 2.5 ES o.,o be 0 .19 c 130.8 be
Lorsban 1.5 4L 0.81 b 0.54 b 149.8 a
99

EFFECT OF LIMIT FEEDING HIGH ENERGY GROWING DIETS ON THE EFFICIENCY OF METABOLIZABLE
ENERGY UTILIZATION
J . J . Wagner1
Animal and Range Sci ences 88·21
One hundred twenty·eight An9us steer calves were ut i l i zed in a study to examine the effect of l imit feeding on efficiency of metabolizable energy (ME> uti l i zation during the growing phase and subsequent performance di.Iring the finishing phase. Steers l imit · fed a high concentrate diet exhibited more rapid dai ly gains than steers ful l · fed the same alllOl.rlt of energy from a high roughage diet (Z . 1S v& 1 . 74 lb per head, respectively). Feed conversion was iff1)roved by l imit feeding cOl11)&red with full feeding (6.09 vs 10. 19, respectively). The efficiency of ME ut i l i zation was also iff1)roved. limit·fed steers gained . 1242 lb per Heal ME conpared with .0956 lb per Meal ME for the ful l · fed steers. limit·fed cattle also requi red fewer days on teed (102 vs 1 17 , respectively), gained weight more rapidly (3.43 vs 3.00 tb per head daily, respectively) and more etf1ciently (6.66 vs 7.53, respectively) than fult·ted cattle during the finishing phase.
(Key �orcls : Limit feeding, Growing Programs, Metabol izable Ent>r9y. )
Introcllct ion
limit·fed, high energy diets have been successfully used to grow l ight cattle. Gain is limited by l imit ing the amount of dry matter offered to cattle. As a resu lt , feed efficiency is genera l l y i171>roved by l im i t feeding.
In order to effectively uti l i te l imit-fed growing pr09rams, producers must be able to predict feedlot performance with reasonable accuracy. Tar9et sale weights and average daily gains must be met in order to a l low use of the various forward pricinv technique,& and to a l l ow backgrounders to consistently prodvce a \a'\i form feeder steer at a predicted date.
In previous trials at the Southeast South Dakota Experiment Farm, observed performance of l 1m1t·fed cattle has been greater then that predicted by the net energy system, suggesting that the efficiency of energy ut i l ization was i171>roved through limit feeding. Therefore, the objectives of this research were to c�re the efficiency of metabolizable (ME) ut i l i zation for l imit·fed versus full-fed cattle and to determine the i�ct of l imit feeding on subsequent perfor11111nc:e during the f in ishing phase.
Materials and �
One hundred twenty·eight Angus steer calves that had been on a 31 ·day receiving trial (601. concentrate diet> were weighed following en overnight wi thdrawal of feed and water, blocked into two weight categories and a l l otted to 16 pens. EAperimental diets are Sh01loln in Table 1 , Cattle in four of the heavyweight pens and four of the l i ghtweight pens were fed ad libitun amounts of a high roughage diet ( 1 .03 Mr.al ME per lb dry matter). The remaining eight pens of cattle were fed l imited lfflOUl'ltS of a high concentrate diet ( 1 .326 Meal ME per lb dry matter). The high concentrate diet was offered to each weight category of l im it ·fed cattle in an amount intended to provide similar daily ME intake ae that consl.llled by each weight category of full·fed cattle.
Cattle were weighed on day 14, day 28 and at the c�let ion of the 84·day tr ia l . Final weight was obtained after an overnight w ithdrawal of feed end water. Interim weights were obtained after overnight wi thdrawal of water only.
1 Assistant Professor.
100

TABLE 1 . DIETS FED TO STEERS8
lnoredient
Ground high mo i sture corn Corn si l age Alfa lfa-grass hay Supplement
Soybean meal Ground corn li mestone Trace mi neral i zed sal tb
Mol asses V i tamin A, 8 · E premixc
Rumensin 60
L1mi t · fed
69. 190 8 . 667 8 .667
1 1 . 161
1 . 004 .800 . 400 .063 .024
F'ul l · t'ed
5 . 193 45. 943 45. 943
2 . 263
.500
. 100
.040
.015
a Percentage of diet dry matter . b Composi tion, minimum percentage. NaCl 96.0 . Zn . 350. Mn ¢209, Fe . 200, Mg . 150, Cu . 003. 1 . 007 and Co .005.
Composition, IU per l b , vitamin A 2,000,000, vi taftin D 400�000 and vitamin E 200.
Composi tion, 60 g monensi n per l b .
Data were analyzed as a random,zed block design. Variables of interest for the 9rowing phase were average daily gain, dry matter intake, feed effic iency, ME intake and the effic iency of ME ut, l tzation. Variabtes of interest for the f inishing phase were average dai ly gain, feed efficiency, dry 1111tter intake, day$ on feed and carcass qua l i ty and cutabi l i ty traits.
Results and DiscussiQO
Interactions between weight group and treatment were not significant. Therefore, treat111ent 111eens tiere c�ted across weight categories. Performance of steers during the growing phase la displayed in 'fable 2. 8y design of the trial, ful l · fed cattle consl.llled more dry metter than limit·fed cattle (17.6:J vs 13.04 lb Pt'r h� daily, respectively). Full -fed cattle consuned slightly more ME than did the li111it·fed cattle. Aver-,., daily gain was greater CP<.0001> for the l imit· fed cattle than for the ful t ·fed cattle (2.15 vs 1 .74 lb per head daily, respect ively).
TABLE 2 . PERFORMANCE OF STEERS DURING GROWING PHASE
Diet �------�I_t_em __ �--------�L�i.m_i_t_-f_e_d,____,F�u�l�l-·�fe�d=-�P�r�o�ba�b�1�l�i�ta¥
Ini t ia l weight, lb Ory matter i ntake, l b Average dai l y gai n . l b Feed/ga in Dai l y ME i ntake, Mcal a
Gain/ME , l b/Meal
607 13 . 04 2 . 15 6 . 09
17 . 30 . 1242
a ME = metabol i zable energy .
101
606 17.63 l . 74
10 . 19 18 . 16
. 0956
. 6417
.0001
.0001
. 0001
. 0068
. 0001

Feed efficiency and the efficiency of ME ut i l i zation was irrproved by limit feeding. Limit-fed cattle requi red 6.09 lb dry matter per pound of gain c0ff1)llred to 10 . 19 lb requi red by the ful l · fed tattle, Efficiency of ME ut i l ization was .1242 lb of 9a1n per l b of dry matter for the l imit·fed cattle and .0956 lb of gain per pound of dry matter for the ful l -fed cattle.
llll)roved efficiency of energy ut1 l 1zation 11111y be due to a true i�rovement in the efficiency of ME uti l i zat ion or i t may be due to inaccurately estimating the ME content of one or more of the diet c01TpOnents. Average dai l y Runensin intake was 188 mg/head for the l imit·fed cattle and 159 mg/heed for the ful l ·fed cattle. This may have contributed to the improvement in ME use.
Performance of l 1m it ·fed cattle was generally greater than that of full·fed tattle durine the finishing f)hase (Table 3). Cattle that had been l imit-fed during the growing phase achieved 14.3X greater (P<.05) average dai l y gains, requi red 15 fewer (P<.05> days on feed and were 26 lb heavier (P<.05) at slaughter than cattle that had been ful l · fed during the growil'lg phase. Ory 11111tter intake was similar for both groups of tatt le . feed efficiency was markedly 1 1rproved for the l imit·fed cattle c�red with the full·fed cattle (6.66 vs 7.53, respc-tively).
TABLE 3 . PERFORMANCE OF STEERS DURING FINISHING PHASE8
Gru ing d,et. Item Limit-fed F'ull - fed Probab1 1 i tv
Days on feed 102 117 .0386 Slaughter wei ght, l b 1126 1100 . 0333 Dry matter i ntake, l b 22 .43 22 . 30 . 8319 Average da i l y gain, l b 3 . 43 3 . 00 .0256 Feed/gain 6 .66 7 . 53 . 016g Hot carcass we i g�t , l b 707 694 NS Rib eye area, i n 12.52 12.22 NS Marbling score, uni tsc 6.02 6.03 NS Percent choice 92.54 96 .30 NS Yie ld grade, units 3 . 15 3 . 16 NS
� Least-square means adjusted to a common fat thickness . c NS = 9onsign1fi cant.
Smal l = 5 .00 , modest0 ·= 6 .00 and 111<>derate0 = 7 .00.
1 0 2

ECGIIICNIC INAUSIS Of USUIG NiKIMG £CIUIPNEIIIT FOR GIIOWIIIG HEIFERS
1 2 3 J. J, �agner , o. Peterson , R . Hanson and H . L . M i l ler
Anirn&I/Range Sciences 88·22
S�venty·two Silff'!lental cross and Charolais cross hei fers (475 lb) were ut i l i zed in a growing s 1udy to estimate the economic value of using a mixer wagon and feed scale to feed l ight cattle a high roughDgc diet. Cattle fed the mi xed diet gained an additional 22.6 lb on 61 .2 lb less dry matter over the 133·d�y trial than did cattle fed the l.lf'Wllixed diet. Annual ownership and repai r costs were assumed to equal $2356. I f yearl il"l9 feeder cattle sold tor '80/cwt and if corn, hay and corn silage were worth $90, $80 and S25 per ton, respectively, i t would take a minilll..Jn of 114 head on feed for 133 days each year to pay annual costs for the wagon. The econofflic analysis of the data from this trial suggests that even relatively sma l l cattle feeding operations should strongly consider investing in a mixer wagon with a scale
(Key �ords: Feedlot, MiAing Equipment, Economic Analys is . >
Introduction
Many farmer feeders do not have feed scales or mixer wagons to feed cattle. they feel that they cannot afford the expense of this feeding equipment. They feed by what i s often referred to as the "front end loader and scoop shovel method". Roughage is often measured by volune using a front end loader or large r� bale. l ikewise, grain and sl.ll)plement are measured by vol\l!le using bushels, buckets, bags or a scoop shove l .
There are two potential problems associated with feeding by this method. F i rst, feeding by volume can result in tremendous variation in the amount of dry matter offered to cattle, particularly i f h i gh si lage diets are used. Second, producers are unable to adequately mix diet components under this system. Cattle are given the opportunity to select their own diet. Some cattle may eat predominately roughage Other cattle may eat predominately conc�trate. Other cattle may eat some c°"*>ination in between.
�eighing of feed conrnodities and feeding them as a c�tetely mixed ration al tows cattle feeders more control over the diet. tntake mav be stabi l i ted and every mouthful of feed that the cattle eat may contain a proper balance of carbohydrate, protein, vitamins and minerals. Performance by cattle fed known amounts of a C<>llt)letely mixed diet w i l l l ikely be greater than that by cattle fed diet colll)Onents separately. D i f ferences in performance relative to feed co9tS and other operating expenses w i l l determine i f purchas· ing, operating and maintaining a mixer wagon and scale is economical for farmer feeders.
The objective of this research was to deteNftine performance di fferences between cattle fed c�letely mixed diets with feed del iveries weighed out at each feeding versus cattle fed by volll!le unmixed diets. A second objective was to evaluate the economies of using e mixer wagon with scales for farmer teed�r opera· t ions.
1 .
2Ass1 stant Professor.
3Professor, Department of Economics.
4cattle Mana!l('r, Southea,t Ekperiment Farm. Associate Professor.
103

Materi !..L and Methods Beginning in mid·Oct�r. a total of 72 S irmwntal cross and Charolais cross heifers (L75 lb) were
purchased from four South Dakota locati ons and transported to the Southeast South Dakota Experi�nt Farm neer Beresford. Upon arrival, cattle were at towed access to long stem grass hey and water overnight. Ouri119 a two week receiving period, heifers were fed a standard 60X concentrate starter diet. Once al t cattle were 111eirblecl, they were shrunk overnight, weighed, ear tagged, vaccinated CIBA, 8VI'!, Pl3
, 7·way clostrldial bacterin), dewormed, strat i f i ed by weight and breed and al lotted to eight 0-he � pens. The tr;a1 started Nov"'*>er 4, 1987, and lasted 133 days.
Four pens of heifers were fed ad l ibitl..fll amounts of a coq>letely mixed grower diet (Table 1 ) . The &PPf"OJN"i&te amounts of corn s i lage, ground hay, high moisture corn and supplement for all four �s were w.ighed into the mixer wagOtl (Schwartt three auger mixer, 2 ton capaci ty) and thoroughly mixed prior to fet'ding. Precise BIIIOU'lts of this total mixed ration were �i9hed out to each of the four pens of heifers. The four re111aining pens of heifers were fed 1he same diet. Total amount of feed offered to these cattle was approximately the same as the total amount of feed offered to the cattle fed the cocrpletety mixed diet. F cOIIIIIOditles were not mixed prior to feeding and ind1vie1Ual feed deliveries to each pen were estimated by vol�. The total 111110Unt of corn s i lage, ground hay, high moi sture corn and s�tement needed for al l four pens wa1 weighed out and placed in a separate pi le for each cO!llllOdity. One fourth of each pile, as estimated by volune, was placed into the feed bunk for each pen using a front end loader and scoop sllo�e t . A l l feed tor a particular pen was placed in the same bunk. Corn s i lage, hay, corn and supplement were layered In the bunk In that respective order.
TABLE 1 . DIET FED TO HEIFERS DURING GROWING STUDY
Corn silage (35% dry matter) Alfal fa·grass hay (16% crude protein) Ground high moisture corn (72% dry matter) Supplement
Corn grain Trace mineralized saltb
Cane molasses Rumensin 60 d Vitamin A · 3 0
39 . 27 39 .27 15.10
5 .58 .50 .25 . 02 . 01
� Dry matt�r ua �� -Composition, m \ n imur percentage, NaCl 96 . 0, Zn . 350,
"to c709 , r� 200. �q 150, Cu .003, I .007 and Co . 005 . d tan ains 60 g a:m� mont!f'ls in per lb. · C�nla1ns 30,000 lU vltamin A per gram .
SLJ..::. � Oiscussiori
Table 2 displays the perfonllilnce of heifers. Average dai ly gain was approximately 10.J� greater CP<.05) for the heifers fed the c�letely mixed diet. Statistical analyses were not possible on feed intake and feed conversion data. feed deli...eries to each of the four unnixecl pens were estinaated by volune and assuned to be the SMII!
for each pen. Average daily dry matter intake of the cattle fed the mixed diet was abcH..it 2.7X less than the intake of the cattle fed the urrnixed diet. Feed cOtlversion was irrproved by 1 1 .8X for the cattle fed the CCfl'4)\etely mixed diet. Over the entire trial these d i f ferences i n performance amounted to 22.6 l b additional gain per head on 61 .2 lb less dry matter for the heifers fed the cCfl'4)1etely mixed diet.
Ec9Q01DIC .l!)llyaie. Although the use of a scale·mixer wagon irrproves the productivity of the cattle being fed, it is a matter of economics as to whether one should invest in such equipment. The fol lowing discussion is to help in determining the mini� size of operation which can profitabty adopt this technology.
104

TABLE 2 . PERFORMANCE OF HEIFERS FED EITHER MIXED OR UNMIXED DIETS
Item
Initial weiffht. l b Average dai ly gain . l bb
Daily dry matter intake. lb Feed/gain
� Standard error of the mean. P< . 05 . c Nonestimable .
Tr-ea taa-nt
476 1 . 82
16.59 9 . 12
474 1.65
17.05 10 . 38
6 .37 . 08 NE NE
U'I• M lT•t n-f'I> I'( lllw indyi:11 I a � Dl'f•nrir.- tJ COi.I lff f � 11fP"'rirrr1 "Si I. M'A. •·rat II f lrffl!I 't I �� In -=,j, m, -,, ArfJIJl,l_ll':' tor •Tr.Im Woi-'lPJll!Q wifil 111 Lm:PQO"J1.1; «-111 IIIOSt frequently needed optlO"s. The prices •nd technical det• were obtained fro,a al\ Arts·Uay vendor, and fro,n the Agri cultural E".9lneers fr:,c:P9ser5
.
'"" atluil'"
l i terature
TABLE 3 . ESTIMATED OWNERSHIP ANO REPAIR COSTS Of A MIXER WAGON
List price Cash price {20% d iscount) State sales tax (3%)
Total cash cost Less salvage value (15%)
Depreciable value Annual depre�iation (10 year l i fe } Annual repai r (5% of l ist price) Housing Interest on average investment at
12% ($10,529.90 + $1.579.48) x ( . 12/2)
Insurance ($2 .00 per thousand) Total annual ownership and repair cost
$12. 779 $10.223. 20
306.70 $10.529.90
1.579. 48 e .950. 42
$ 895 . 04 638 . 95 73 .92
726 . 56 21.06
$2. 355 . 54
The cost o1 the tractor used with t�e mix•r wagon is not included Jn thi1 analysis. For the size of wagon being evaluated here, e 30 to 40 horsepower tractor is sufficient. Mixing time le short, usual ly about 10 min· utes, and INiy be done as the wa11on is towed to the feed tu\k, For th• •nalysil 1t hand, it was assuned the cost of the tractor needed for the wagon waa about the lall'le •• the coat 1111ed by not ue1no the present 11q1,1ip111ent to �l iver the feed to the bunk.
The feeding trial shows that during the 133·day feeding period cattle fed the mixed diet gained 22.6 more lb on lus feed than. did the control group. I f these utre pounds are sold aa feeder cattle et S.80 per pound, an e•tra $18.08 is generated per heed. I gnoring for the t ime being that less feed was used, i t wi l l take a minimum
s Arts·Way ,a a registered trademark for Arts·Way M1nuf1cturlne C�ny, Inc., AnlStrong, fA. No qng,c:rsement of this p;-oduct is intended or ill1)l ied.
105

of 130.3 head on feed (S2356/S18.08 � 130.3).
for 133 days per year to pay the ownership and operating cost of the wagon Stated in terms of add1ti0f'lal beef pr�uced, i t w i l l take 2,944.4 additional lb of
beef produced per year to pay the annual costs of the wagon.
I f the price of the ani111E1ls being fed dec l i nes, i t w i l l take more head or pounds to cover the costs of the wagon. For example, i f the price of feeders sold Is only S.60 per lb, i t w i l l take 3,926 more lb to pay for wagon costs. This translates Into 173.7 head when each animal gains an addit ional 22.6 lb by market t ime, up from the 130.l head when the price is S.80. The f fgure may be used to estimate the in· creased production in pounds, at various sale prices, needed to cover the annual costs of owning and using a scale·mixer wagon.
�hen including the feed saved, the nuni>er of head needed to pay for the wagon is reduced s l ightly. The more costly the feed, the fewer head I t takes to justify the use of a scale·mixer wagon. �ith the ration used and feeds priced at 52.50 per bushel for corn, $80 per ton for hay and 525 per ton for corn s i l age, the 61.2 lb of teed (dry matter basis) _,ved per head has a value of S2.S9. When adding this to the S18.08 additional sales per head, i t w i l t take 114 head on feed for 133 days per year to pay for the wegon. I f the prices o f these feeds ere decreased to 52.00 for cor�. $20 per ton for si lage and SSO per ton for hay, feed savings amount to 51.89 per head. I f the 22.6 additional lb of gain are sold ar S.60 per lb and the teed savings are included, then at least 152.5 head need to be fed annually to pay the annuat cost of a wagon.
�ith performance data available only for grOt1ing heifers, I t would be very risky to estimate by extrapolation the benefits of a scale·mi•er wagon for finishing cattle. The rations are different and we lack the data to determine the increased productivi ty, i f 1ny, when feeding high concentrate rations as are used in f in ishing. Feeding less bulky f inishing ratioos may l i kely result in less increase in productivity frOlll mixing, meaning less value from the wagon. Likewise, the price of s laughter cattle i s usua l l y less than for feeder cattle, resulting in the increased production being sold at a lower price. On the other side, with the higher cost per cwt of finishing retions, each � of feed saved means greater benef i t frOlll a wagon. Using mixing equipment may al low feeders to use h igher concentrate diets, thus 1�rovin9 average dai ly gain. Any increase in the rate of gain means less days on feed and lower operat ing costs on the animal bP.1ng f inished, a plus for this piece of equipment. So at this time we cannot make a determina· :ion as to the net econcrnic benefi t of such a wagon in the finishing lot.
� Considerations � Investing in ! �ixer Wagon. The l i fe of the wagon was estimated at 10 years or 10,000 loads. This would be 1 , 000 loads per year or 2.74 toads per day. Repa i r costs w i l l l i kely increase and l i fe decrease as use is i ncreased above 1 ,000 loads per year. However, l ess use w i l l not necessari ly mean less repair per year. Deterioration from weather and acid from feeds wi l l not decrease with less use and, in fact, may increase. Obsolescence is a function of t ime only, so i t is not affected by level of use. From this we can conclude that co1ts vi l l remain about constant with decreased use, while each l oad in excess of 1,000 loads per year viii i ncrease depreciat ion and repc1 i r costs by S1.53.
In this experiment, approximately 2.30 bushels of feed were required per head per day. Therefore, i t took about 306 bushels of feed per head over the 133 days. �ith a 17'j·bushel wagon, this i s about 1 . 75 loads per head to bring them from starting weight to sale weight . Using the S80 per cwt sale price and the high prices for feeds, the break·even level of production to cover annual costs of the wagon i s about 1 1 4 head per year. Thus, a t the break·even level of production the wagon would be used for only 199.5 loads per year. Therefore, use could be Increased five times and not have an appreciable increase i n annual costs o f the wagon. Even with cattle sell ing at S60 per cwt and low priced feeds, there is plenty of reserve capacity. At the lower prices, the break·even level is 152.S head per year, which would require only 267 l oads per year. This would a l low for a 375� increase in use wi thout increasing annual costs. A 175-bushel wagon should feed 570 heed for 133 days ot this ration with a thousand loads. A producer who i s is putting more pounds o f gain on each animal w i l l obviously be feeding fewer cattle from starting weight to sale weight per thousand loads.
106

The time and tabor required using a scale·mlxer wagon i s another aspect which 1hould be evaluated. While i t may take more time to load a mixer wagon with a scale due to the Meigh1ng process, the time traveling betMeen the feed bunks and feed storage area with the loader may be reduced. Whether there i& • net gain or toss in time depends on the current feed handling techniques vis·a·vis the new. 6ecause most farmers have an older, sma l l tractor which can easily handle the mixer wagon, no adc:titlonal investment I$ l i kely to be ,r,x,ced above the cost of the wagon.
In conclusion, the evidence of this experiment indicates that a mixer wagon equipped with • ec•l• c•n be a profitable investment for feedlot operators feeding high roughage rations to t ight cattle. Yith feeder cattle selling in the S.70 to S.80 range, the break·even level of production is 110 to 160 head an feed for 133 days per year but w i l l depend on how 111.!Ch ill'J)rovement a particular operation can 9ain cl.le to more accurate feeding and the value of feed saved.
1 07

S.E. FARM REPORT -
EFFECTS OF ADMINISTERING PROGESTERONE OR PROGESTERONE AND GnRH BEFORE PUBERTY ON AGE AT PUBERTY AND REPRODUCTIVE RESPONSE IN
CROSSBRED BEEF HEIFERS 1 2 H . L. M 1 13er , J . J . Wagne4 ,
R . Hanson and D . Sorensen Animal /Range Sci ences 88-23
One hundred six crossbred heifers were ut i l i ted to determine prepubertal treatment of progesterone or progesterone plus Gonadotropin ReleAsing Hormone (GnRH) on age at puberty, conception to a synchron1 zed estrus and conception during the breeding season. Days to puberty were 369.5 � 6.2, 363.1 ! 9.9 and 360.4 ! 7.8 for control. progesterone pr1m�d and progesterone plus Gonedotropin Releasing Hormone (CnRH) , respect ively. There was no differ�n(e (P> 05) 1n age of puberty, nl6!1ber cycling before synchronization or conception rate dur1n9 a JS·day breed1n9 �Pa�on. The p<:"rrcntege of heifers conceiving to synchronized estrus was lower (P< 10) for control corrpart'd to progesterone or progesterone plus GnRH treated heifers. Injecting CnRH at breed1ng had l i tt le (P>.05) effect on increasing conception rates to the synchronized estrus or during the breeding season.
(Key words: Beef He1fer�. Pub<>rtv, GniH, Progrstcrone, fer t i l i ty.)
Introduct i on
Oecreas1 ng the time to puberty 1n beef he1fcrs should result in increased conception rate early in the breeding season, since the heifer woutd !::)(, cyclin9 for a longer period of time prior to br, ing. Also, otder and larger calves would result at wean1ng. and a (Of'ger period of t ime would be available for the heifer to begin cyc l ing before the second breeding season. some research has been conducted ilOninistering reproductive hormones to heifers before puberty, result i ng in varying results on decreas1ne tiine to puberty. A management proceck.lre to decrease t ime to puberty resul t ing in increased reproductive efficiency in first calf beef hei fers would be economically important to the cow-calf producer. The purpose of this study was to evaluate several hormones aoninistered before p.iberty and their effects on age at p.berty and subsequent reproductive performance i n crossbred beef he1fers.
One hundred s ix crossbred beef hei fers were randomly a llotted to one of three groups. One gr0\4) was the control and d1d not rereive hormone therapy. A �econd group was progesterOt\e pri� before puberty <9 days Synchro·Mate B ) . The th ird group was progesterone primed and injected with Gonadotropin Releasing Hormone (GnRH) at SMB removal . Each of the treatment groups were divided and one·helf of each grO\IJ) given GnRH injections at t r 1a l i n i t 1at 1on Blood w�s collec ted via jugular venlpuncture weekl y from OCtober 161lil a l l heifers were synchron1zed for breeding in May. B lood sa"l)les were centri fuged and the 1er.1111 harvested and ana(yzed by redioi11111Unoassay for progr�tcronc lrvcls to dctcrm1nc when cycling was ini t i ated. On May 9 a l l heifers were synchronized w1th Synrhro·Mate B and 1nsem1natrd �8 hours after i�lant remova l . A t breeding each of the three prepubertal groups wcrP. d1v1drd �nd one-half of each group i njected with GnRH and the other
iAssocia�e -rofessar. 34$s1 stant �roressor 4CatL le Manager . Scull c • l South Dakota Exper iment Farm. Manug.t"r . 5cutheast out, Dakota Experiment farm.
1 0 8

one·half control. G!'"!e week after A l , the heifers were exposed to bulls for 28 days. Eighty-one days after Al the heifers were rectal ly palpated and conception date estimated.
�l� and D i scussion There was no difference (P>.OS> in age to ptlberty between the three prepubertal treatment gr<>Yps (Ta·
ble 1 ) . Also, no difference (P>.OS) existed between the three prepubertal gr°'-lf)s in the nurber of heifers cycling before estrous synchronization. Collectively, �4 of the 106 heifers were cyc l i ng before synchronize· tion. After •vnchronization and breeding, a l l heifers but one that did not conceive started cyc l i ng. lhis may be due to the progesterone i111>lant and estradiol injection associated with SMB synchronization.
TABLE 1. EFFECTS OF PROGESTERONE PRIMING AND PROGESTERONE PRIMING + GNRH ON REPRODUCTIVE DEVELOPMENT IN CROSSBRED BEEF HEIFERS
Progesterone Control ____ PrQ.Q_esterone __ + GnRH
Number of heifers Days to puberty Cycl i ng before synchronizationa
34 369.5 + 6.2 17 (50.0)
a Values in parenthesis are percentages.
36 363.1 .t 9.9 17 (47. 2 )
36 360.4 ± 7.8 20 (55.6)
Conception r&tes to the synchronized estrus and for the breeding season are presented 1n Table 2 . The lOlilest conception rate to synchronized estrus �as in the control heifers (P<.10). Both control treatment groups prepubertel hed lower conception retes than progesterone primed or progesterooe primed plus GnRH groups. Jhere was no difference (P>.05) ,n conception rate for the breeding season for the prepubertat treatments or the GnlH inject ion et breeding. Average concept ion rates from the prepubc:>rtal tre<>tments to s.ynchroni Led estrus were 47 1 , 61.l and 69.4X tor control, progesterone primed and progesterone pruned plus GnRH, respect ively, and for the breeding season 82.4, 91 . 7 and 80.6X for control, progesteron� primed and progesterone pr 11oed plus GnRH, respec tively.
Progesterone priming or progesterone priming plus GnRH hod l i tt le effett on age to puberty or reproductive performance in beef heifers. Also, t i ttle advantage existed by injecting heifers with GnRH at the time of insemination.
TABLE 2. CONCEPTION RATE TO SYNCHRONIZED AI AND BREEDING PERIOD FOR BEEF HEIFERS TREATED WITH PROGESTERONE AND GNRH BEFORE PUBERTY
Pre�uberty
Control Progesterone Progesterone + GnRH Control Progesterone Progesterone + GnRH
ANO GNRH AT BREEDING
Breeding
Control Control Control GnRH GnRH GnRH
---- -
Conception rate to
No. of synchroni aed heifers _______ estrus ___
18 8 lJ,I 4lb 17 10 l�S.Bl� 19 14 ( 13. 7) fl 16 8 (;jij O] 17 11 {64 . 7)� 19 12 (63 ')
� �alues in parenthesis are percentages. • Values in columns with unlike superscripts di ffer (P< . 10 ).
109
Conception rate for breedini _sea gm __
14 (77 . 8) l� (88.2) 15 (79.0) 14 ( 87 5) 14 (82 . 4 ) 18 (94 7)

EFFECTS OF CORN COB AOOITIONS TO CORN - SOYBEAN MEAL DIETS WITH AND WITHOUT ADDEO SYNTHETIC LYSINE ON THE PERFORMANCE OF FINISHING PIGS
C . R . Hamilton . B . S . Borg, G . w . l ibal, R . C . Wahls trom and R . Hanson Animal and Range Sciences B B-24
Different CDll1)00ents of fiber have characteristic chemical and physical properties which may affect fil:)er digestion end uti l i zation by the pig. Because fiber is not readily broken down into its base units by rna11'1'1'18lian enzymes, d i lution of the energy content of the diet occurs when f iber is present 1n swine diets. Hemicel lu lose, cellulose and l i gnin are three major COlll)Onents ot fiber that are founct in various proportions in d i fferent fiber sources. Corn cobs are relatively high in he<nice l lulose and low in t i gnin. Further, varying amounts of cob are cOfl'ITIOn in corn grain fed to swine.
The objectives of the present st\.ldy were to ( 1 ) evaluate the response of f inishing pigs fed corn· toybeen meal diets containing 0, 4 or 8% added ground corn cobs and (2) determine the effects of add�d eynthetic lysine on the performance of pigs fed diets containing added corn cobs.
(Key �ords: Finishing Pigs, F i ber Source, Corn Cobs, Synthetic Lysine . )
Experimental Procedure
A total of 140 feeder pigs (40 lb avg wt) were purchased fran two sources through the S ioux Fa l ls Stoek Yards end transported to the confine;onent fac i l ity at the Southeast South Dakota Research farm near Beresford. Pigs received a corn·soybean meal based receiving diet containing 20% oats and 10 9/ton ir9iniamycin to an average weight of about 7'S tb. One hundred twenty pigs were then a l lotted to five treatments from outcane groups based on weight, sex and feeder pig source. Each dietary treatment was fed to t01Jr replicate pens of six pigs per pen. Treatm<!nts were produced f rom the addition of 0, 4 , or 8% ground corn cobs and O or about .t3� lysine f ron, L · lysine'HCl to the busat corn-soybean me-al diet (Ta· ble 1 ) . Ground corn cobs and synthetic lysine Pach replaced corn 1n the basal diet formulation. The reiut ting dietary treatments were:
1 . Corn-soybean meal control 2. Diet 1 plus 4X ground corn cobs 3. Diet 2 wich .13% synthet ic lysine. 4 . D iet 1 plus 8� ground corn cobs. 5 . O iet 4 plus • 14% synthetic lysine C i solysinic with diet 3 ) .
Average init ial weight across a l l repl icates was 74.28 lb. Pigs r eceived the same d ietary treatment 1.r1ti l the study was terminated on day 81.. Pen average we1qht aero�� al l treatments was 230.9 lb upon termination of the st\.ldy. Pig weights were recorded every 14 dJy� and feed weighed back every 28 days. lhe Stuc:ty was conciJcted during the months of Novel'l'O<.'r through January of 1987.
1 1 0

TABLE 1 . COMPOSITION OF EXPERIMENTAL DIETS
% added cobs: % added l;tsine: Ground corn Soybean meal. 44% Corn cobs, ground Animal fat Oicalcium phosphate Limestone Premix Salt Total
Calculated analysis: Crude protein, % Lysine, % Crude fiber, % ADF % NOF % ME. kcal/lb
0 0
79.13 16.20
2.0 . 93 .75 .75 .25
100
14 . 0 . 65
2 . 94 4 . 01 9 .40
1504
75. 13 16.20 4 . 0 2 . 0
.93
100
.75 .75 .25
14 . 0 .64
4.29 5.45
12.56 1471
+.13 75.13 16 .20 4 . 0 2 . 0
.93
100
.75
.75
.25
14 . 0 . 77
4.29 5 . 45
12.56 1471
a Lysine added as L·lysine *HCl to the premix .
-----0
71 .13 16 .20
e. o 2 . 0
. 93
100
.75 .75 .25
14 . 0 . 6 3
5 . 64 6 . 89
15 . 72 1437
+ . 14 71.13 16 .20
8.0 2. 0 .93 .75 .75
� 100
14. 0 . 77
5 . 64 6 . 89
15 . 72 1437
The effects of dietary treatment on pig performance by 28·day period and overall are shown in Table 2 . The addi t i on of ground corn cobs atone did not appear to depress pig performance during any of
the experimental periods exam1ned. Additions of ground corn cob either with or wi thout added synthet i c lysine did not affect (P>. 1 0 ) average daily gain (AOC), average d a i l y feed intake (AOF) o r feed effi· cicncy ( feed/gain) for the 1nit 1al and second 28·day periods.
During the third 28·day period (day 56 to 84), pigs fed added cobs had gains that were similar (P>. 10) lo those fed the basal diet except when synthetic lysine was added ,n corri)ination with the h i ghest level of cobs. Pigs fed 8X added cobs with added lysine gained (P<.OS) 1T10re slowly than pigs fed any other diet with cobs added, while those fed the basal diet were intermediate. Dietary treatment hau no (P>.10) effect on AOf during the third feeding period Pigs fed er. added cob� wi thout added lysine tended to gain more (P<. 10> efficiently than pigs ted the basal diet. The addition of synthetic lysine and 8t added cobs tended to produce less (P<.10) efficient p19 gains than any of the other diets containing added cobs, while pigs fed the basal diet were intermediate.
Overal l , pigs fed 4� cobs in cOlrbination with added lysine h&d greater CP<.05) ADC than those fed the basal or 8X added cobs with added lysine diets. The addition of lysine to the diet containing 8� added cobs produced pig gains that were lower (P<.OS> than either diet with cobs and not lysine added, while those fed the basal diet were intermediate. Because feed intake was not affected (P>.10) by dietary treatment, a trend was observed for teed effic iency. For pigs fed diets with 8X added cobs, the addition of synthetic lysine tended to depress (P<.10) feed efficiency. However, lysine did not depress feed effic iency when added in the presence of 4X added cobs, as feed/gain was similar (P> . 10) for pigs fed the 4t added cobs w i th added lysine and 8� added cobs wi thout lysine diets. Pigs fed the basal and 47. added cobs wi thout lysine diets were intermediate for feed efficiency.
111

TABLE 2. EFFECT OF ADDEO COB ANO(OR) LYSINE ON THE PERFORMANCE OF PIGS
% added cob: 0 � 8 % added lysine : 0 fl + . 13 0 + . 14
Avg da1 l y gain, l b Avg da; 1y feed, l b Feed per gain
Avg daily gain, lb Avg daily feed, lb feed per gain
Avg daily gain. l b Avg daily feed. lb Feed per gain
Avg daily gain, lb Avg daily reed, l b Feed per gain
In1t iel 28-day period
1.55 l.53 1.61 4.72 4.72 4.73 3 .06 3 .09 2.95
Second 28- day period
2.26 2.32 2.34 7. 45 7.81 7.43 3 . 30 3.85 3.19
Third 28·day period
l . 71ab l.838 1 . 85a
7.13de 4.23 7. 37ef 4.06
7.18ef 3.89
Overall 84- day period
1.83bc l. 8 98b l . 93a
6.4lde 3 .51 6.63de 3.52
6.42e 3 .34
1 . 44 4.73 3.31
2.28 7.53 3.31
1 . 85a
7.02f 3.82
l.85ab
6 . 40e 3.47
a, b, c Means in the same row without a com•on superscript differ (P<.05). d, e. f Means in the sa�e row without a common superscript di ffer (P<.10).
1 . 47 4 . 72 3.20
2. 17 7 .44 3 . 44
l.59b 7 . 05d 4. 51
1. 73c
6.37d 3.69
The tack of I depc-ession in daily 9ains resulting fr0/111 the addition of corn cobs to the diet was not surprising in this study. fiber additions to awine diets t)lpica l ly result in a dilution of the metabo l i zable energy (ME) content of the diet. feed intake iney be inc:re11ed to meintain the seme level of ME intake (with· in physiological l i111its) which a l lows the l&IIIIL' rate of gain to be maintained, but results in poorer feed efficiency. Outside t�retures should have heel a min1mat effe<;t on the resul ts ot this study in view ot the fact that pigs were housed in an environmental ly modified building. Corn cobs are relatively hith in hemicet tulose as indicated by the high neutral detergent fiber (NOF) and low acid detergent fiber (AOF) content. This hith hemicetlulose content 111ay account for some of the responses obtairwd in the prest\'lt study.
The overal l growth response obtaiNN:t from the addition of a moderate level of corn cobs (4X) and syn· thetic lysine was not eApe<:ted. Converaely, lyain. appeared to have e negative effect on both gains and feed effic iency when added in the preaenc:e of the higher (al) level of 9rOl6ld corn cobs.
Addi tional studies are pl11'YW!C1 to further inveatigate the effects of various sources and types of fiber on the performenc• of growing piga.
i!il!D.tr A total of 120 purchased feeder plea aver1glne a�t 74 lb initially �re uti l i zed in an 84·day study to
evaluate the effect of adding 0, 4, or 81 ground corn cobs and O or about . 13X synthetic lysine on pig per· forrnance. Pigs were allotted to fi�e dfetary treatments repl icated four times. D ietary treatment had no effect CP>. 10) on the perfor1111nce of pl9s for the lnitiel S6 cleys of the study or on feed cons�tion for any period studied. C�red to the corn·soybean meet basal diet, the addition of ei ther 4 or 8X ground corn cobs did not reduce the perforNnc• of plga. Among treet111ent 9roups fed added cobs, the addition of synthet· ic lysine to the diet with 8X lddad coba r.,ulted in poorer 91in• (Pc.OS) end feed efficiency (P<.10) by pigs.
112

EFFECT or SPACE ALLOWANCE ON PERFORMANCE OF FINISHING PIGS FED TO A HEAVIER WEIGHT (250 LB)
c . R. Ham i l ton, G . w . Libal, R. C. Wahlstrom and R. Hanson
Animal/Range Sciences 88·25
The practice of feeding pi9s to heavier weights has inc:reased in the recent past. Packers prefer pigs that are heavier than the 200 to 220 lb finished weight range of years past. This is because the overhe-.d coats for slaughtering o 200·lb pig are the seme as for a 250·lb pig, provided the 1),1<:ker can physically handle heavier and larger pork carcasses.
Eight square feet per pig is the current recamnended pen space allowance for finishing pigs housed in confinement. Kowever, the data used to determine this recomnendation were from studiea in which pigs were marketed at about 220 lb. thus, the per pig pen space allowanc:e for pigs taken to heavier �ights may be greater then 8 sq ft .
The objective of this experiment was to determine the space requirement of finishlnt swine fed to an average of 250 lb using dai ly gain, feed consUll)tion and feed efficiency averages as response criteria.
(Key Words: Finishing Pigs, Performance, Peo Space.)
EAperimental Procedures
A total of 90 pigs weighing about 109 tb were transported from the SDSU Swine Research Unit at Brookings to the confinement l..llit at the Southeast South Oakota Research Farm near Seresford. Pigs were randomly assigned to one of three treatments from outcOllle groups based on weight, sex and ances· try. Each treatment was repl icated in three pens containing ten pigs per pen. Treatments were pro· ca.iced by altering pen space to provide either:
1 . S ix square ft:et of pen space per pig (4 ft x 1 5 f t ) . 2 . Eight square feet of pen space per pig (5.33 f t x 15 ft). 3 . Ten square f�t of pen space per pig (6.67 ft x 15 ft ) .
AlthOUGh the desired pen dimensions were obtained by altering the width of the original pen, a rectangular shape wes maintained in each resulting pen. Pigs were fed • c� diet (fable 1 > for the entire study. Each pen of pigs was provided with three feeder spaces and one nipple waterer. The study was terminated by pen at pen average weights of about 250 lb.
An effort was rnede to record pig weights end feed consUll)t ion every 2 weeks. However, this wes not possible for the enti re study due to mechanical problems with the weighing equipment. In the event that a pig was removed from the study, pen dimensions were adjusted accordingly in order to 111intain • constant pen space a l lowance for the entire tr ia l . A pen of pigs constituted en experiment•l �it . This study was conducted during the sUffller of 1988.
� The effect& of pen space on the perform;ince of pigs for the entire study are presented in Teble 2. Pi9s
provided with 6 sq ft of pen space tended to gain more slO'ltly (P<,07) and gained less (P<,05) efficiently than pigs provided with either 8 or 10 sq ft of space. Overall average daily feed cons�tion 11111ns were similar {P>,10) for al l treatment groups.
113

TABLE 1. COMPOSITION OF EXPERIMENTAL DIET , I
Percent -----=I ..... n...,q __ re __ d __ i .... e"'"n"""t ___________ of di et
Ground corn Soybean meal, 44% Li mestone Dica)cium phosphate Salt Vitamin-trace mineral premix
Total
Calculated analysis: Protein , % Lysi ne, % Calcium, % Phosphorus, % Metabolizable energy, kcal/lb
81 . 58 16.02
. 99 . 91 .2, .25
100
14.0 . 67 .65 .50
1503
Average 1 n 1 t ial and final weights for each treat11ent grOl.4) are also shown In Table 2. The acc�ing coefficients of variation (CV) for these weights may be of particular interest. Within pen weight variation was similar at the beginning of the stLdy. Al though not tested statistically, the CV for 1inel weight suggests that within pen weig�t variar ion was not affected by space al lowance for the overall weight range stLdied.
Result$ of th1s study tend to support the current recOl!lllended space allo..ance of a sq ft per pig. These date suggest that 6 sq ft may be inadeQUale and 10 sq ft per pig to be unnecessary for finishing pigs fed to pen aver· age weights of about 250 lb. further, overcrowding appeared to affect gains and feed effic iency wi thout depress· ing feed cons1.1rption.
TABLE 2 . EFFECTS OF PEN SPACE ON THE PERFORMANCE OF PIGS FED FROM 109 TO 249 LB
S�ace allowance §;!er �1gl
Item 6 8
Initial wt, lb 10 9 . 2 10 9 . 2 CV for ini tial wt, ,a 5 . 11 5 . 20 Final wt, l b 245.7 251 . 0 CV for fina l wt, %
8 4.35c 4.37b Avg dai l y gain, lb 1 . 28 1. 3 9 Avg daily feed, l b 5 . 14d 5.27e Feed/gain 4.01 3.79
sg ft 10
109.2 5.0 9
249. 8 5.47b 1 . 38 5 . 03e 3 . 66
-·• Average coe·ficient of variation for pig we ights w it9i e a pen.
' Means i n the same row without a CONOn superscript di f&et (P< . 07 ) .
' Means in the same row di ffer (P< . 05).
without a common superscript
Sl.6llll&ry A total of 90 p19s were ut i l i zed ro study the effect of either 6, 8 or 10 sq ft of pen space per pig on the perfornia11c f in ishing pigs from 109 to 250 lb. Overa l l , pigs provided with 6 sq ft of space tended to gain more (P<.07) slowly an mare (P<.05) feed per l b of gain than pigs given a or 10 sq ft of space. Feed intake was not effected (P>. 10) by pen variatiOl'I within a pen did not appear to be •ffectect by overcrowding in this study.
114

NOTES

NOTES

•

s.e. FAAM
REPORT


