Chapter 6 Extent and Nature of Financial Exclusion of Tribes Financial Exclusion among the Scheduled Tribes: A Study of Wayanad District in Kerala 151 Chapter : 6 EXTENT AND NATURE OF FINANCIAL EXCLUSION OF TRIBES 6.1 Exclusion from Bank Account (Banking Exclusion) 6.2 Credit Exclusion 6.3 Exclusion from Insurance: An Introduction 6.4 Exclusion from Pension Schemes 6.5 Concluding Observations 6.1 Exclusion from Bank Account (Banking Exclusion) The access to using banking services is considered as a universal need as it is “fundamental to enable full participation in economic and social life” (Sinclair, McHardy, Dobbie, Lindsay, & Gillespie, 2009). The lack of it may stigmatize the people, leading even to social exclusion (Anderloni, 2008). Having a bank account is imperative in the sense that it is an entry into an array of financial services, which can be offered to people to mitigate different type of shocks that can come in their way. Having bank account is an important precondition to participate in the economy in which a person lives (Gloukoviezoff, 2007). In simple parlance and in its very raw form financial exclusion is generally understood to connote the condition of not having availed of bank account or transaction account from a formal bank. This is because, the primary and the fundamental financial service that one should get in the realm of finance is to have an account in a formal bank with all facilities that such an account offers. In the study area, which we have covered in our analysis, there are banks both public and private under the formal system to offer bank accounts to tribes, implying that the supply side bottlenecks, as far as the banking infrastructure is concerned, appears apparently absent in the study area. Moreover, supplying bank accounts do not pose any threat to banks as no risk is involved in it. Often we observe bank staff conducting mobile account opening facilities in some occasions seemingly to fulfill their targets of financial inclusion. Hence, our first attempt
Transcript
Chapter 6 Extent and Nature of Financial Exclusion of Tribes
Financial Exclusion among the Scheduled Tribes: A Study of Wayanad District in Kerala 151
Chapter: 6
EXTENT AND NATURE OF FINANCIAL EXCLUSION OF TRIBES
6.1 Exclusion from Bank Account (Banking Exclusion) 6.2 Credit Exclusion 6.3 Exclusion from Insurance: An Introduction 6.4 Exclusion from Pension Schemes 6.5 Concluding Observations
6.1 Exclusion from Bank Account (Banking Exclusion)
The access to using banking services is considered as a universal need as it is
“fundamental to enable full participation in economic and social life” (Sinclair, McHardy,
Dobbie, Lindsay, & Gillespie, 2009). The lack of it may stigmatize the people, leading
even to social exclusion (Anderloni, 2008). Having a bank account is imperative in the
sense that it is an entry into an array of financial services, which can be offered to people
to mitigate different type of shocks that can come in their way. Having bank account is an
important precondition to participate in the economy in which a person lives
(Gloukoviezoff, 2007). In simple parlance and in its very raw form financial exclusion is
generally understood to connote the condition of not having availed of bank account or
transaction account from a formal bank. This is because, the primary and the fundamental
financial service that one should get in the realm of finance is to have an account in a
formal bank with all facilities that such an account offers. In the study area, which we
have covered in our analysis, there are banks both public and private under the formal
system to offer bank accounts to tribes, implying that the supply side bottlenecks, as far as
the banking infrastructure is concerned, appears apparently absent in the study area.
Moreover, supplying bank accounts do not pose any threat to banks as no risk is involved
in it. Often we observe bank staff conducting mobile account opening facilities in some
occasions seemingly to fulfill their targets of financial inclusion. Hence, our first attempt
Chapter 6 Extent and Nature of Financial Exclusion of Tribes
Financial Exclusion among the Scheduled Tribes: A Study of Wayanad District in Kerala 152
is to look into how many tribe households have secured bank accounts from the formal
banking system.
Contrary to general perception, it is found that banking exclusion, that is exclusion
from having a savings bank account, is extremely negligible (around 5 percent) among
the tribal communities(Figure No.6.1). Obviously, the drive of banking inclusion
strategies that have been aggressively followed under the stewardship of Reserve Bank of
India might have contributed to this huge number of tribes holding a bank account.
Nevertheless, what is observed here is just a picture of tribes holding at least a bank
account or those who have opened a bank account irrespective of whether they use it or
not. What is noteworthy is that approximately 95 percent do hold an account, while the
rest of the story remains to be narrated in the sections to follow.
Figure 6.1 Extent of Exclusion from Bank Accounts (Savings Exclusion)
Source: Field Survey, 2012.
After having seen that the extent of banking exclusion or savings bank exclusion is
the lowest among the tribes, it is worthwhile to look into whether there exist any
differences among tribe communities in respect of their access to bank account. For this
purpose, the study has run a Chi-Square Analysis and the results of which are summarized
below. First, we shall have a look at the following table (Table No.6.1), which reveals
that amongst the tribes the Kuruma tribe has 97.4 percent of its households having access
to savings bank account with a formal banking institution, while the Paniya tribe, both a
backward and a non-primitive tribe have 93.1 percent of households with savings bank
accounts. Chi-square test reveals that there is no significant difference among tribe
communities in respect of having bank accounts (Table No.6.1).
Having bank
Account95%
Having No bank Account
5%
Other5%
Chapter 6 Extent and Nature of Financial Exclusion of Tribes
Financial Exclusion among the Scheduled Tribes: A Study of Wayanad District in Kerala 153
Table 6.1 Status of Having Accounts-Tribe Wise
Status of having bank accounts Tribal Communities
Total Kurichya Kuruma Paniya Adiya
Yes, do have bank accounts 96.20 97.40 93.10 96.60 94.80
Not having bank accounts 3.80 2.60 6.90 3.40 5.2
within tribal group 100 100 100 100 100
Source: Field Survey, 2012. Chi-square P value is .345 (Not significant)
6.1.1 Type of Bank Accounts
In the preceding section, our endeavor was to examine the status of holding
account among the tribes that is whether the tribes hold bank accounts or not, irrespective
of the type of account. We know that banks offer different type of accounts viz. savings
bank account, current account, recurring deposit account, and deposit account to the
customers. Apart from these, with the implementation of MGNREGS programme, the
workers who avail of the works offered by the MGNREGS are mandatorily required to
open accounts with banks, through which their remuneration would be paid. Thus, this
scheme has added one more account, the MGNREGS account, which has become very
popular in recent times in rural areas. Besides this, we know that India has one of the
largest postal net works in the world, and more over post offices are popular in rural
areas. Therefore, accounts with the post offices are also reckoned as a type of accounts
relevant for our study. From the discussions which we had with the bank officials and
tribal promoters, we have come to know that many households among tribes tend to have
both savings bank accounts and NREGS account, and hence we have also added one more
category, namely ‘both Savings bank and NREGS account category.
Table 6.2 Tribe Wise Distribution of the Type of Accounts
Type of Account Tribal Communities
Total Kurichya Kuruma Paniya Adiya
Savings Bank Account 31.00 44.60 15.20 33.30 25.30
Post Office Account 1.00 0.00 0.00 7.00 1.10
NREGS Account 44.00 14.90 68.70 33.30 50.80
Both SB Account and NREGS Account 24.00 40.50 16.00 26.30 22.80
% within tribal group 100 100.00 100 100 100.
Source: Field Survey, 2012. Chi-Square Test P value is .000 (Significant)
Chapter 6 Extent and Nature of Financial Exclusion of Tribes
Financial Exclusion among the Scheduled Tribes: A Study of Wayanad District in Kerala 154
The above table reveals the type of bank accounts, which the tribal households
hold (Table No.6.2). It is evident that most of the tribe households posses MGNREGS
account, showing the phenomenal importance that the MGNREGS programme has
received among the tribes (Dreze & Khera, 2011). However, the percentage of tribe
households holding Savings Bank Account alone appears to be only 25.3, while 22.8
percent hold both Savings Bank Account and NREGS account together. This is because
of the fact that MGNREGS account has been considered as a special purpose account,
which is opened to receive income arising out of works done under the MGNREGS
programme. It is interesting to note that tribes relatively hold less number of post office
saving bank accounts. Although the study has included two more categories in the
interview schedule viz. current account and recurring deposit account, in the analysis we
have found none holding such accounts.
Our next attempt in this section is to investigate into inter tribal differences in
holding different type of accounts. First, we shall have a look at the tribe wise distribution
of the type of account. Among the tribe communities, the Kuruma tribe has exhibited a
distinguishing picture as exactly 44.60 percent of households belonging to this tribe hold
savings bank account and 40.50 percent hold both saving banks and MGNREGS account
(Table No.6.2). The percentage of Kuruma households holding MGNREGS account alone
hovers around just 15 percent. None from this tribe appears to have secured a Post Office
Account. In contrast to this, the Paniya tribe has not fared well in possessing different
type of accounts. Its historical backwardness has reflected on their pattern of holding
bank account as well. Among the Paniya community, only 15.2 percent hold savings bank
account alone where as 68.7 percent hold MGNREGS account not combined with the
Savings Bank Account. The percentage of Paniya households holding both Savings Bank
account and MGNREGS account hovers around only 16 percent. Quite interestingly, it
appears, however, that the Kurichya and Adiya tribe, respectively a forward and
backward tribe community, share seemingly similar status in respect of the type of
account they hold. For instance, the percentage of Kurichya household possessing savings
bank account is slightly lower (31 percent) than that of the Adiya household (33.3
percent). Similarly, regarding both Savings bank account and MGNREGS account,
amongst the Kurichya and Adiya tribes respectively 24 and 26 percent hold these
accounts. The holders of Post Office Savings Account are relatively more amongst the
Adiya tribe (7 percent). It again astonishes that amongst the Kurichya tribe 68.7 percent
Chapter 6 Extent and Nature of Financial Exclusion of Tribes
Financial Exclusion among the Scheduled Tribes: A Study of Wayanad District in Kerala 155
hold only MGNREGS account. The reason why Kurichya tribe hold more MGNREGS
account is that members of this community are more actively involved in MGNREGS
work on account of the awareness of this programme amongst this community.
Let us now turn to the Chi-Square test to see whether there prevails any significant
difference amongst these tribe communities with regard to the distribution of different
type of bank accounts. The analysis shows that since the P value is .000 at 5 percent level
of significance, there is significant difference in respect of the distribution of different
type of bank accounts (Table No.6.2).
6.1.2 Banks in which Tribes have their accounts
Now, it is imperative to look into the banks, in which the tribes have opened
accounts. It has been briefed at the outset that in its simple parlance financial exclusion
connotes exclusion from the formal banking institutions. Therefore, in the list of banks,
which we consider here, we encompass, Nationalized Banks, Scheduled Private Sector
Banks, Regional Rural Banks, Cooperative Banks, and Post Offices. As far as the
Regional Rural Banks are concerned, they have been popular in the Malabar Region of
Kerala, although recently they have started spreading across southern Kerala as well.
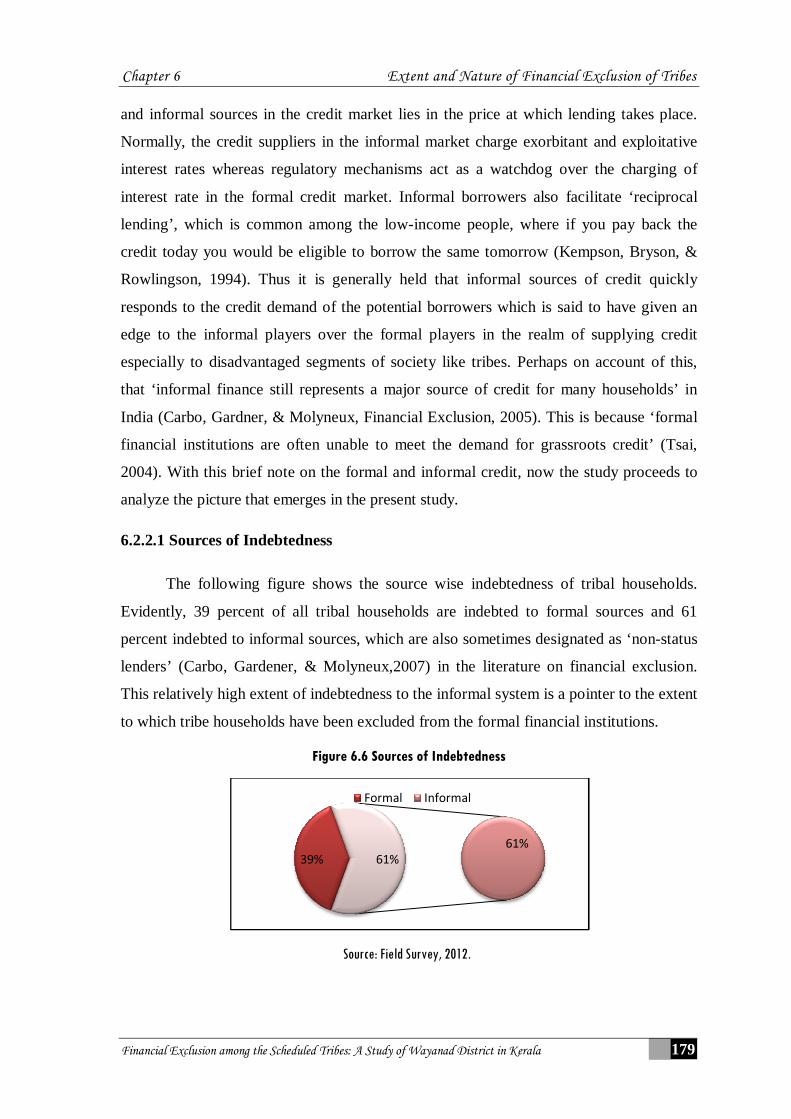
Source: Field Survey, 2012. Figures are in percentages
Unsurprisingly, a little more than 64 percent of tribes have accounts with the
nationalized banks, especially the State Bank of India, State of Bank of Travancore,
Syndicate Bank and the Canara Bank, while in Regional Rural Banks roughly 31 percent
of tribes have opened accounts. This perhaps compels us to “fall back again on the
Chapter 6 Extent and Nature of Financial Exclusion of Tribes
Financial Exclusion among the Scheduled Tribes: A Study of Wayanad District in Kerala 156
commercial banking model for seeking a satisfactory solution to the problem of
increasing financial inclusiveness” (Patil, 2010). Only around one percent has obtained
accounts from the Scheduled Private Sector Banks, mainly the Federal Bank Limited. The
role of Cooperative Bank in offering accounts to tribes appears to have been relatively
poor as only 2.7 percent of tribes have accounts with the Cooperative Banks. This
vindicates the opinion (Patil, 2010) that “the experience so far indicates that the
cooperative movement is bogged down in a political quagmire making it an undependable
route for financial sector inclusion”. In this background, we find nothing bizarre in more
tribes having opened accounts with the nationalized and regional rural banks. Moreover,
in the study area banks from these two groups have been widely spread.
Tribe wise distribution evidently brings us some appealing facts about the relative
importance of different banks in offering services. For instance, Kurichya community
have more accounts with the Regional Rural Banks (67 percent), while the Kuruma (90.5
percent), Paniya (75.7 percent) and Adiya (52.6 percent) have obtained relatively more
accounts from nationalized banks. Only 25 percent Kurichya household have accounts
with the Nationalized Banks. It is to be observed from the table that Kuruma tribe’s
reliance on the Regional Rural Banks for savings bank accounts appears to be abysmally
low at 6 percent. Nevertheless, the distribution of tribe household based on the name of
banks in which they have accounts has nothing to do with the core of our analysis. Many
factors, which perhaps lie beyond the limit of this study, might have been at work to
entice tribes to prefer a particular bank for opening account.
6.1.3 Reasons for Exclusion from Having Bank Accounts
Now a peep into the factors that have culminated into the exclusion of a meager 5
percent of tribes from having bank accounts is necessary. It is apparent from literature on
financial exclusion that the factors leading to financial exclusion, more particularly
banking exclusion, could be compressed into broad five factors viz. Price Exclusion,
Marketing Exclusion, Condition Exclusion, Access Exclusion, Self Exclusion and
Geographical exclusion (Sinclair, 2001). Not all these factors when taken individually
may be as relevant to the tribal communities as it applies to a general population.
Nevertheless, for analytical exercise it would be apt to enquire about these factors leading
to banking exclusion of tribes in the study area.
Chapter 6 Extent and Nature of Financial Exclusion of Tribes
Financial Exclusion among the Scheduled Tribes: A Study of Wayanad District in Kerala 157
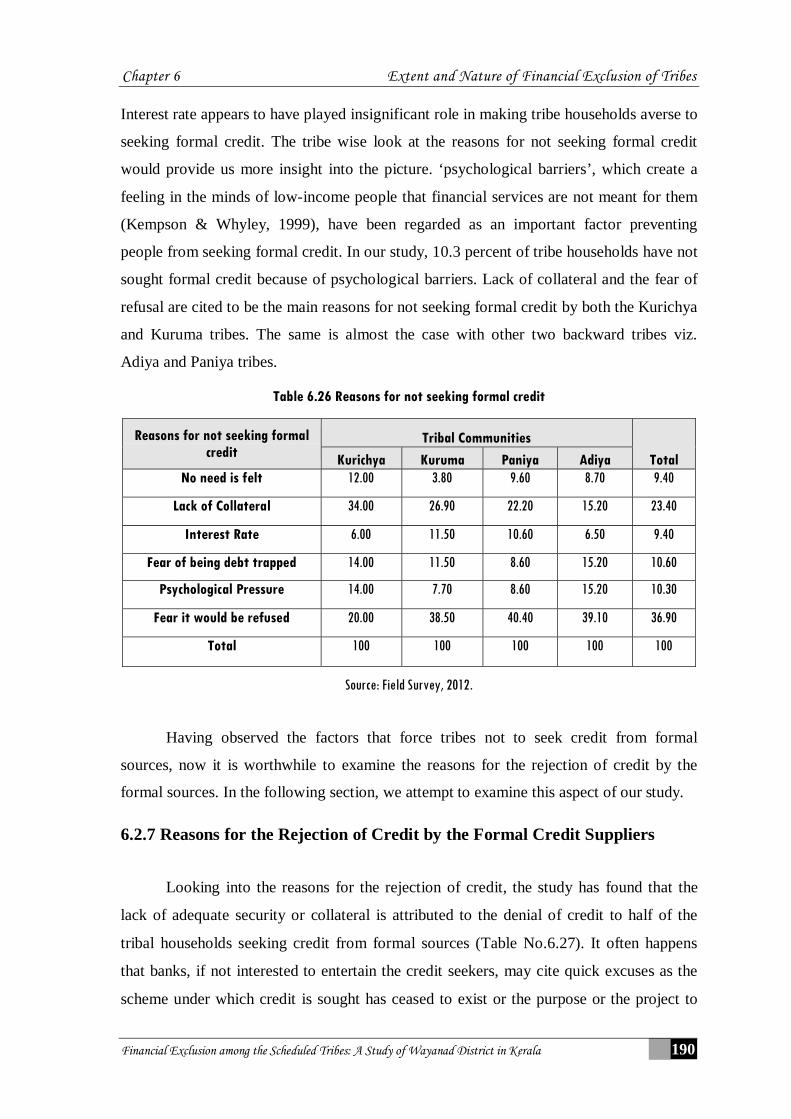
Table 6.4 Reason for Exclusion from Bank Accounts
Reason for Exclusion
Tribal Communities Total Kurichya Kuruma Paniya Adiya
Access Exclusion 0.00 0.00 11.10 0.00 7.70
Condition Exclusion 25.00 50.00 0.00 50.00 11.50
Marketing Exclusion 0.00 0.00 16.70 0.00 11.50
Self Exclusion 75.00 50.00 72.20 50.00 69.20
Total 100 100 100 100 100
Source: Field Survey, 2012. Figures are in percentages
As the table portrays (Table No.6.4), one cause of banking exclusion namely
geographical exclusion which arise either due to the lack of sufficient number of bank
branches or due to the closure of existing braches, called ‘geographical desertification’ in
the literature on financial exclusion, has rarely been cited to be a factor resulting in
banking exclusion in this study1. Of the rest of the four causes shown in table, we find
that most of the respondents excluded from having bank accounts have suggested that
they own no account with bank because of reasons attributed to themselves. Needless to
add, one needs to explore on this ‘self exclusion’, the most frequently cited cause of
banking exclusion (69 percent). Condition exclusion has been cited to be the second most
important reason contributing to banking exclusion. Around 12 percent of the respondents
have opined that conditions attached to opening bank accounts tend to dissuade them
from attempting to open accounts. The other two types of causes have also been cited as
factors leaders to the banking exclusion of the tribes.
As regards tribe community approach to the causes of banking exclusion, it is
obvious from the table (Table No.6.4) that 75 percent of Kurichya tribe has cited self-
exclusion as the most important factor discouraging them from opening accounts. The
Paniya (72 percent) and Kuruma (50 percent) communities have also cited self-exclusion
as the main cause of banking exclusion. Hence, it can be presumed that financial
exclusion is self-driven, or demand driven, as supply side bottlenecks are apparently
insignificant. Thus, it is obvious that self-exclusion has been singled out as the main
1 It is to be noted here that ‘current debates over the pattern and causes of financial exclusion have moved beyond the issue of geographic proximity to other aspects (Sinclair, McHardy, Dobbie, Lindsay, & Gillespie, 2009).
Chapter 6 Extent and Nature of Financial Exclusion of Tribes
Financial Exclusion among the Scheduled Tribes: A Study of Wayanad District in Kerala 158
reason for banking exclusion among the tribes. To gauge into more aspects of self-
exclusion, one needs to conduct Focus Group Discussion (FGD) ensuring the
participation of selected respondents from the sample.
6.1.4 Reasons for Taking Bank Accounts
In the preceding section, we have observed that an overwhelming number of tribe
households in the study area are in a position of having received at least one bank
account, and most of them hold either a savings bank account or an MGNREGS account.
Perhaps, owing to the wide popularity that MGNREGS has received, it is observed that
the tribe households, regardless of the community in which they belong, hold both
savings bank account and the NREGS account. This being the picture of the status of
holding bank accounts among the tribe households, now it would be of interest to
investigate into the reasons that influenced the tribes to open accounts with banks. As we
know for anthropological peculiarities tribes, especially the backward tribes have been
generally averse to using the services of modern financial institutions, and hence, probing
into the reasons for opening accounts would throw light on the change in the behavioral
pattern that has happened to the tribes thanks to their increasing openness to the outer
world. Below we provide quantitative information as to what have been the reasons cited
by tribes for opening accounts.
Table 6.5 Reasons for Taking Bank Accounts
Reason for Taking Accounts Tribal Communities Total
Kurichya Kuruma Paniya Adiya Self Decision 48.00 58.10 13.60 24.60 29.1 Pressure from Banks 3.00 13.50 9.50 24.60 10.5 Pressure from relatives and friends 2.00 9.50 4.90 12.30 5.9 for NREGS 47.00 18.90 72.00 38.60 54.4 Total 100 100 100 100 100
Source: Field Survey, 2012. Chi-Square Test P value is .00 (Significant)
As the table exhibits (Table No.6.5), the study has put forth five possible reasons
that might have acted as compelling factors behind tribes opening accounts with banks.
Of course, the first is ‘Self Decision’, and around 29 percent of tribes have cited this as
the main reason for taking accounts. Indeed, how to delve on the reason of ‘self decision’
is a matter to be fathomed, for which we really need to rely on sources other than the pure
Chapter 6 Extent and Nature of Financial Exclusion of Tribes
Financial Exclusion among the Scheduled Tribes: A Study of Wayanad District in Kerala 159
statistical data. Nevertheless, more enticing is the role of MGNREGS, an employment
guarantee programme, in forcing the tribes to open bank accounts. The mandatory
practice under MGNREGS is that the payment is disbursed to the workers via bank
accounts, which make owning, and operating bank accounts unavoidable for all the
beneficiaries of MGNREGS, no matter how effectively and frequently they use it. It is
here we have to ponder over the influence of labor market in the process of inclusive
growth and more particularly in the context of widening access and use of financial
services among the tribes. Referring to the Integrationist Approach to Financial Inclusion
that has been elaborated on in an earlier section in this work, we reiterate that the best
way of connecting people with finance and thereby ensuring their participation in the
whole gamut of economic and social process is nothing, but first to connect the people
with the labor market. In fact, what MGNREGS has done in the case tribes is this. The
data captures from this study also corroborates this aspect, where it has been find that an
overwhelming percentage of tribes, that is in the vicinity of 54 percent, have cited their
involvement in MGNREGS as the main reason for taking bank accounts. Since Tribes
lead a community life involving much interdependence among households and members,
one may naturally expect that friends and relatives may have influences on the decision
making process of tribes with regard to opening bank accounts. However, contrary to this,
the present study has found that relatives and friends have hardly had any role in making
a household included in the banking system. This is evident from the fact that only a
meager 5.9 percent of tribes have opined that they took bank account consequent upon the
pressure exerted on them by their friends and relatives. In the light of financial inclusion
drive that has been on an unprecedented pace in India under the direction of RBI, the
pressure from banks on tribes for opening accounts should have been a major reason for
opening bank accounts. Nonetheless, the data in this study has hardly anything
substantiate to suggest that banks have been pressurizing tribes for opening accounts. The
table speaks of the fact that only 10.5 percent of tribes have reported that they opened
accounts following pressure from banks. Now, our endeavor is to understand whether
different tribe communities exhibit any difference in respect of the reasons for opening
banks accounts. This would through light on the factor, which has worked well for a
particular tribe community in their decision of opening accounts with banks.
Looking at the table (Table no.6.5), it is obvious that 47 percent of Kurichya
households choose to open bank accounts merely because of reasons attributed to
Chapter 6 Extent and Nature of Financial Exclusion of Tribes
Financial Exclusion among the Scheduled Tribes: A Study of Wayanad District in Kerala 160
MGNREGS and nearly 48 percent owns bank accounts because of their own decision.
Only 3 percent and 2 percent of Kurichya households hold banks account because of the
reasons viz. pressure from banks and pressure from relatives and friends respectively. For
the Kuruma tribe the dependence on MGNREGS for opening accounts is considerably
very less, which is clear from the fact that only around 19 percent have suggested
MGNREGS as the root cause for opening accounts whereas 58 percent consider ‘self
decision’ as the main reason for opening bank accounts. Not surprising is the role of
MGNREGS in tempting the households from the Paniya tribe to have bank accounts. It is
found that an overwhelming percentage, that is 72 percent, of Paniya households hold
account because of their participation in MGNREGS. The influence of self-decision (only
around 14 percent) is remarkably very less as far as the Paniya tribe is concerned. Among
the Adiya tribe, another backward tribe under our study, while approximately 24.6
percent each cite self-decision and pressure from banks as the main factor forcing them to
have bank accounts, around 39 percent is of the view that it is their participation in
MGNREGS, which has prompted them to open bank accounts. Since the P value in the
Chi-Square Test is less than .05, the study concludes that there is significant difference
among tribe communities as far as the factors that influence them to open accounts are
concerned.
6.1.5 Current Balance in the Pass Book
The next indicator to understand as to how extensively and effectively tribes use
banks accounts is to have a look at the balance amount recorded in the Passbook. Since
tribes are low-income people, it is unusual to expect them to keep large sums of money in
accounts. However, a check at the balance figures would obviously provide us some light
into the habit of saving or keeping money with the bank accounts. Needless to add that
collecting information on balance kept in the passbook is rather a difficult exercise as
tribes are reluctance to share such evidence with the interviewers. Lack of financial
illiteracy among the tribes could also make the collection of such recorded data a tiresome
endeavor. Luckily, in certain cases the respondents showed the magnanimity to disclose
their passbook records before the researcher. Nevertheless, in most of the cases the
researcher found it difficult to elicit data on the balance kept in the passbook by the tribes.
Generally, it has to be taken granted that the tribes do not appear to be interested in such
records, rather they are curious about what they receive from different sources.
Chapter 6 Extent and Nature of Financial Exclusion of Tribes
Financial Exclusion among the Scheduled Tribes: A Study of Wayanad District in Kerala 161
Table 6.6 Descriptive: Current Balance in Accounts
Tribes N Mean Std. Deviation Std. Error Minimum Maximum
Kurichya 100 405.0000 579.2062 57.92062 100 5000
Kuruma 74 724.3243 732.5712 85.15967 100 5000
Paniya 243 272.8395 288.6327 18.5158 100 1500
Adiya 57 457.3684 302.6934 40.09272 100 1200
Total 474 393.3966 481.2836 22.10609 100 5000
Source: Field Survey, 2012.
Test of Homogeneity of Variances
current balance in pass book
Levene Statistic df1 df2 Sig.
9.128 3 470 .000
Table 6.7 ANOVA: Current Balance in Passbook
Sum of Squares df Mean Square F Sig.
Between Groups 11882469.214 3 3960823.071 19.058 .000
Within Groups 97680362.220 470 207830.558
Total 1.096E8 473
Source: Field Survey, 2012.
Average current balance is a ready pointer towards the overall position of the
current balance kept in accounts by all tribe household. In this analysis, we have found
that the mean current balance is estimated at Rs.393.396 only which is by any yardstick
may appear to be dismally low. The minimum and maximum current balance is Rs.100.00
and Rs.5000.00 respectively. The range is also too big denoting huge difference amongst
tribe households in respect of the current balance kept in accounts. All tribe communities
have Rs.100 as the minimum balance. This is due to the influence of MGNREGS account.
The beneficiaries of MGNREGS should adhere to the rule of keeping Rs.100.00 in the
account just to keep the account active.
Chapter 6 Extent and Nature of Financial Exclusion of Tribes
Financial Exclusion among the Scheduled Tribes: A Study of Wayanad District in Kerala 162
More startling is the difference that we observe among tribe communities with
regard to the mean values of balance in the passbook. A glance at the table (Table No.6.6)
suffices these differences in a better way. What is of interesting is that there does not exist
any difference in the case of minimum balance kept in the account while the maximum
balances differ widely. Unsurprisingly, Kuruma and Kurichya tribe have the maximum
amount of Rs. 5000.00 kept in the savings bank account whereas the Paniya and Adiya
tribes have Rs.1500.00 and Rs. 1200.00 respectively. The economic and social
backwardness that these two tribes exhibit get reflected in their tendency to keep
abysmally low balances in the passbook. As regards the mean balance, we find that
Kuruma tribe has the maximum mean balance, which is to the tune of Rs.724.32. The
Kurichya community has Rs.405 as their mean current balance kept in the account. More
worrisome is the trend among the backward tribes. The Paniya tribe has Rs.272.83 as its
mean balance while the Adiya tribe has Rs.457.36. These figures undoubtedly tell us the
fact that although banking exclusion is not rampant among the tribes, the actual use of the
savings bank account for keeping money balances is not up to the mark. A pertinent
question that arises now is as to the resourcefulness or the saving capacity of the tribes,
which deserves to be fathomed.
Now, one has to look at the differences that we observe among the tribes in respect
of their tendency to hold balances in the account for which we go in for ANOVA. The
table portraying the results of ANOVA reveals that there prevails significant difference
among tribe communities with regard to the balance amount held in the account. Having
done ANOVA, it is of inquisitive interest to look at between which groups of tribe the
difference is more pronounced, for which the study relies on the post hoc analysis.
The table (Table No. 6.8) evidently shows that when we compare the case of Kurichya
with their counterparts we observe that the difference is significant between the Kurichya
and Kuruma tribes. In addition, when we pair Kuruma with other tribes, significant
difference lies between Kurichya and Paniya tribes, and we find significant difference
between Paniya and Kuruma when Adiya is placed against other tribes. Thus, the
emerging picture is that Kuruma is distantly different from other tribes in respect of
holding balances in the account.
Chapter 6 Extent and Nature of Financial Exclusion of Tribes
Financial Exclusion among the Scheduled Tribes: A Study of Wayanad District in Kerala 163
Table 6.8 Multiple Comparison: Current Balance in the Passbook
(I) tribal group (J) tribal group
Mean Difference (I-J) Std. Error Sig. 95% Confidence Interval
3 Broadly speaking, Micro Finance is interpreted to encompass both micro credit and micro savings although both these have been used interchangeably in recent times. Micro credit is defined as a set of programmes offering credit for self-employment to very poor persons (Kaladhar, 1997).
Chapter 6 Extent and Nature of Financial Exclusion of Tribes
Financial Exclusion among the Scheduled Tribes: A Study of Wayanad District in Kerala 194
Apparently, it seems to be undeniable that access and use of insurance is as
important as access to banking services and credit sources. This is perhaps due to the
reason that in the absence of specific purpose insurance products viz. health insurance,
when people fall ill they have to run down all savings built up over the years. In addition
to this, very often, they may have to borrow conditionally from informal sources, which
slide them into complete debt trap and abject poverty. Hence, to protect people against
these odds in life, they need to be equipped with adequate insurance products.
Broadly, insurance products are categorized into two: Mandatory and
Discretionary Insurance Products. Vehicle insurance, for instance, is a kind of mandatory
insurance. The access to this insurance happens when the customer agrees to own a
vehicle and hence it has nothing to do with other economic characteristics of the insurer.
Another example is credit plus insurance, where when credit is disbursed to the borrower,
a condition is laid down that the borrower will have to take an insurance against risks that
lead to the loan being unpaid, as in the case of a home loan being not repaid when the
borrower breaths the last. Researchers especially those in the field of economics seldom
focus on these types of insurance products. Quite distinct from mandatory insurance
products, people avail of discretionary insurance products when they themselves feel the
necessity of having it, if they have the ability to buy such products. A fitting example to
this is life insurance, and to some extent health insurance, although in recent times some
governments have made health insurance compulsory.
Now a pertinent question that arises is whether the low-income social groups like
the tribes needs insurance products. As said earlier, insurance as far as it insulates people
from vulnerabilities of various kinds, which adversely affect their capability to participate
in the economic process, then undoubtedly, insurance for low-income people appears to
be as important as in the case of a general population. Tribes live on meager income,
which they earn from jobs pertaining primarily to agricultural sector characterized by
seasonal fluctuations in activities. Insurance against mishaps in their life, hence, appears
to be a necessity. Since, they live on low-income, and stay in places and houses unsafe in
many respects they are prone to communicable diseases that take on their lives. When the
breadwinner of the household fall ill, hospital expenses wash away the entire savings and
assets they posses, which in turn lead them to irreparable miseries in life. Increasing
insurance cover for low-income people is made imminent in the light of the fact that even
Chapter 6 Extent and Nature of Financial Exclusion of Tribes
Financial Exclusion among the Scheduled Tribes: A Study of Wayanad District in Kerala 195
temporary shocks translate into long terms losses (Collins, et al 2009). Over time, low-
income households end up depleting their assets in their attempts to pay for hospital
expenses including medicines. In poor households, persistent incapability to cope with
temporary fall in income ‘leads to choices that directly harm children (Rose, 1999). To
put concisely, studies have found the unquestionable relation between ill health and abject
poverty, and hence, recommend proper health insurance measures that mitigate the
problem of abject poverty. Besides, the holding of insurance product especially life
insurance products inject a feeling of security in the minds of people, which make them
more confident in taking riskier jobs and earn more income.
6.3.1 Insurance Exclusion among the Tribes
At the outset, we need to examine the extent of exclusion of tribes from the
insurance sector. For this, the study put the question before the respondents from each
household that whether they hold an insurance product or not. Insurance product covers
any type of insurance product either life insurance or medical insurance, or any other kind
of insurance products barring those, which are mandatory like the vehicle insurance.
Figure 6.7 Extend of Insurance Exclusion
Source: Field Survey, 2012.
In this study, it has been revealed that 59 percent of tribe households do have an
insurance policy (Figure No: 6.5). It does mean that 41 percent of tribe households have
been excluded from having an insurance product. This appears to be slightly rosy
compared to the data on almost similar aspect at all India level. For instance, a study in
rural India suggests that only 15 percent households report having any insurance (Basu,
2006). For a better understanding of the problem of insurance exclusion, one needs to
look at the tribe community wise distribution of the extent of insurance exclusion.
Yes, do have an insurance
policy59%
No, do not have an insurance
policy41%
Other41%
Chapter 6 Extent and Nature of Financial Exclusion of Tribes
Financial Exclusion among the Scheduled Tribes: A Study of Wayanad District in Kerala 196
6.3.2 Tribe Wise Distribution of the Extent of Insurance Exclusion
The pertinent question is to enquire whether the economic and social
backwardness play any role in determining the extent of financial exclusion among the
tribes. In this study, we have chosen two groups of tribes depending on the level of
economic and social advancement. As stated elsewhere in this work, the Kurichya and
Kuruma tribe exhibit high standard of economic enhancement whereas the Paniya and
Adiya tribe have lagged behind in progress and social advancement (Rajasenan, 2009).
Running contrary to this deep-rooted belief, the tribe wise distribution of the insurance
exclusion brings us startling inferences. As is evident from the table, in the case of all
tribes barring Adiya tribe, the percentage of households holding any insurance outweighs
those having no insurance policy. More astonishing is the improvement that the Paniya
tribe has made in terms of having access to insurance policies compared to Kuruma tribe.
The reason for this contrasting difference lies mainly in the canvassing strategy adopted
by the insurance agents in the study area, and has apparently nothing to do with any
socio-economic features.
As we know, vibrant policy agents in every nook and corner of India market the
life insurance policies. From the observation and discussions we had with the stake
holders in the field of insurance marketing, we have understood that it is on account of the
frequent visit and persuasion by the agents that tribes commit themselves to avail of
insurance policies, a fact which perhaps applies to general population as well. Since the
Paniya is, on prima facie, landless agricultural workers, and they live in housing colonies
provided by governments, agents find it easy to market insurance products among this
community. On the other hand, in the case of Kurichya, and largely for Kurumas as well,
as they are land-owning class, their dwellings are farther away from each other, which
make it difficult for agents to reach on foot the households of these tribes. This aspect has
made considerable impact on the difference in access to insurance that has been witnessed
among the tribal communities.
Chapter 6 Extent and Nature of Financial Exclusion of Tribes
Financial Exclusion among the Scheduled Tribes: A Study of Wayanad District in Kerala 197
Table 6.30 Tribe Wise Distribution of Exclusion from Insurance
Status of having insurance
Tribal Communities
Total Kurichya Kuruma Paniya Adiya
Yes, do have an insurance policy
70 43 167 17 298
(67.30) (56.60) (64.00) (28.80) (59.40)
No, do not have an insurance policy
34 33 94 42 203
(32.70) (43.40) (36.00) (71.20) (40.60)
Total
104 76 261 59 500
(100) (100) (100) (100) (100)
Source: Field Survey, 2012. Figures in parenthesis are in percentages, P=.000.
The Chi-square test has shown that there prevails significant difference among
tribe communities with respect to the access to insurance products (Table No.6.30). As
has been discussed above the difference among tribe communities in access to insurance
products appears to have hardly anything that connects with the socio-economic status of
these tribe groups.
6.3.3 Type of Insurance
In the above section, we have elaborated on whether tribe households under our
study hold any kind of insurance products or not, without any due regard to the type of
insurance products they hold. Nevertheless, it is obvious that the nature and the type of
insurance products that are held by the households matter a lot. This is on account of the
reason that nowadays as a part of the government programme the poor, that is those who
fall under the BPL category, have been compulsorily provided with health insurance
products by the state health department in association with even private entities in the
health sector. It is to be worthy of mentioning at this juncture that such freebies do not
bear any economic significance as such products appear to have been not demanded by
tribe households which should have reflected, had demanded otherwise, their buying
power backed by the self felt necessity of having it. On the contrary, the holding of life
insurance products, if they are not mandatory supplied by the government, is a pointer
towards the understanding of the tribes about the need to have such policies. In the case of
general insurance, as well the above said argument holds good. Our study has found that a
little more than 53 percent of tribe household’s irrespective of tribe communities do
posses life insurance products whereas 46 percent have health insurance, and less than
Chapter 6 Extent and Nature of Financial Exclusion of Tribes
Financial Exclusion among the Scheduled Tribes: A Study of Wayanad District in Kerala 198
one percent hold general insurance products (Table No.6.31). The relatively high
percentage of tribe household possessing life insurance products can be partly attributed
to the vigorous marketing campaign that has been unleashed by the smart insurance
agents among the tribe households.
Undeniably, it is proper to argue that holding life insurance products may be
deemed as the hallmark of economic advancement that the households have attained. This
is equally true for tribe households as well. The data on tribe wise distribution of the type
of insurance held by the respondents clearly provides information on the pattern of
holding different type of insurance products (Table No.6.31).
Table 6.31 Tribe Wise Distribution of Type of Insurance
Type of Insurance Tribal Communities
Total Kurichya Kuruma Paniya Adiya
life insurance 71.40 79.10 35.90 82.40 53.20
health insurance 28.60 18.60 64.10 11.80 46.10
general insurance 0.00 2.30 0.00 5.90 0.70
Total 100 100 100 100 100
Source: Field Survey, 2012. Figures are in percentages
As far as the Kurichya and Kuruma households are concerned, more than 70
percent of the households do hold life insurance products, which undoubtedly tell the role
of relative economic advancement along with other factors including marketing by the
agents, in determining the demand for life insurance products by these tribe communities.
On the other hand, only around 36 percent of the insurance holding households falling
under the Paniya tribe do posses life insurance products. It is to be born in mind that
Paniya tribe is economically backward among the non-primitive tribes in the study area
(Rajasenan, 2009). Nevertheless, unlike the Paniya tribe, the study has found that Adiya
households appear to be holding more life insurance products to the tune of around 82
percent. Turning to health insurance4, which is, as described in the preceding section,
almost a freebie from the government, the study reveals that 64 percent of the Paniya tribe 4 The objective of RSBY (Rashtriya Swastya Bima Yojana) is to provide financial security to BPL families from hospitalization related expenses; improve access to quality health care; provide beneficiaries the right to select the health care provider; It provides a coverage up to Rs.30, 000 for a family of five. Both the Centre Governent (75%) and the State governments (25%) jointly provide the premium fund.
Chapter 6 Extent and Nature of Financial Exclusion of Tribes
Financial Exclusion among the Scheduled Tribes: A Study of Wayanad District in Kerala 199
have accessed this whereas among all other tribes only a fewer percentage of households
do hold them although such health insurance products are meant for all tribes falling
under the BPL category. In the case of general insurance since only a negligible meager
percent of tribes as a whole hold it, a tribe wise discussion on this becomes redundant.
The inference that we get from the above analysis is that it is the socially and
economically forward tribes viz. the Kurichya and the Kuruma who have accessed the life
insurance products whereas the Paniya tribe being backward in key economic and social
parameters hold less insurance products and more health insurance supplied almost free
of cost by the government. This apparently throws light on the fact that the exclusion of
tribes especially backward tribes like Paniya from life insurance owes much to the fact
that they have lagged behind in attaining economic advancement compared to other tribe
communities that come under this study.
6.3.4 Insurance Service Suppliers in the Tribal Area
Now we turn to the discussion on the service providers of insurance products in
the tribal area that fall under this study. As we know that with the implementation of
insurance reforms in line with the neo-liberal financial sector reforms that Indian
economy has witnessed since 1991, there have been the emergences of private and
foreign players in the insurance sector along with the modernization of existing public
sector players in tune with the changing competitive environment in the insurance market.
We have today mainly three players in the insurance sector viz. public sector companies,
private sector, and foreign entities. Although, both private and foreign players, often in
collaboration with their Indian counterparts, have made inroads into the insurance market
especially in urban and sub urban areas, public sector players still continues to hold the
chunk of insurance business India. The story however does not appear to be different in
the case of tribal communities as well. Our study has found that among the tribal
households who have availed of insurance of different types, an overwhelming majority
hovering around nearly 52 percent has sought insurance services from the public sector
giant Life Insurance Corporation whereas nearly 46 percent households have been
benefited from the government supplying insurance policies (Table No.6.32).
Unsurprisingly, our study has not found the presence of either private or foreign firms
marketing insurance products among tribes most probably due to the reason that tribes, in
Chapter 6 Extent and Nature of Financial Exclusion of Tribes
Financial Exclusion among the Scheduled Tribes: A Study of Wayanad District in Kerala 200
technical parlance, seem to be unworthy of being insured profitably from the point of
view of these insurance companies.
Table 6.32 Insurance Service Providers: Tribe wise
Service Providers
Tribal Communities
Total Kurichya Kuruma Paniya Adiya
LIC 70.00 69.80 35.90 82.40 51.50
Government 28.60 18.60 64.10 11.80 46.10
Others 0.00 2.30 0.00 5.90 0.70
PLI 1.40 9.30 0.00 0.00 1.70
Total 100 100 100 100 100
Source: Field Survey, 2012. Figures are in percentage
Tribe wise distribution of the insurance service providers reveals that an
overwhelming majority of Adiya tribe has availed of insurance service from the LIC
whereas only around 36 percent of Paniya tribe has relied on LIC for insurance. The
dependence of Paniya tribe on Government for insurance that is for health insurance is
remarkably high at more than 64 percent. Interestingly, a certain percentage of
households falling under the Kurichya and Kuruma tribe have availed of PLI.
Surprisingly, not a single household from either the Paniya or the Adiya tribe has
demanded insurance products from the PLI.
It is interesting to have a discussion on the service provider of various types of
insurance products among the tribal households. In India, life insurance policies are
marketed mainly by the LIC in rural and remote areas as it has wide net work of agents
dedicated to market policies in faraway places. This study has found that the life
insurance policies have been offered to tribal households mainly by the LIC, with PLI
contributing barely a negligible part. However, in the case of health insurance, we see that
it is the government, which has been actively engaged in providing compulsory health
coverage to all tribal households. It is to be noted here that in the case of health insurance
the role of LIC is almost nil. Although general insurance is found to be abysmally low
among the tribal households, ‘others’, that is, public sector players like United insurance
and National Insurance offer the existing general insurance products. It is quite
interesting to note that tribes in the study area have never heard the name of any other
Chapter 6 Extent and Nature of Financial Exclusion of Tribes
Financial Exclusion among the Scheduled Tribes: A Study of Wayanad District in Kerala 201
insurance companies except LIC. They are under the impression that life insurance
connotes only LIC policies. What appears to be appreciable is the fact that tribes find
health insurance policies being offered mandatory by the government as most helpful and
they are constantly relying on such avenues when they fall ill. This has immensely
benefited them in the sense that they could now set aside money for many other things
which they would have spent on hospital expenses had they been deprived of compulsory
health insurance scheme by the government.
Figure 6.8 Service Provider Wise Distribution of the type of Insurance
Source: Field Survey, 2012.
6.3.5 Reasons for taking insurance
Now, it is pertinent to enquire about what ultimately led the tribes to go in for
insurance policies especially when they are the recipients of a meager and erratic income
flow unlike the regular income earners and other plainsmen for whom it might not be so
strenuous to take insurance policies. Of course, such an enquiry, that is enquiry into the
reasons for taking insurance may seem to be superfluous, on prima facie, because as has
been narrated occasionally in many contexts in this study, life insurance policies are
availed even by general population, not to speak of tribes, thanks to the marketing
pressure exerted on them by the agents. In this study, too, it has been found that relatively
more percentage (nearly 44 percent) of tribe households have become insured owing to
the frequent demand by the agents (Table No.6.33) while a little less than 47 percent
appear to have accessed insurance especially health insurance because of it being a part of
government programme. What is worthy of mentioning is that only around 10 percent of
tribe households have secured insurance products on account of the felt- need by
themselves which clearly shows that self-demand for insurance products is obviously very
low among tribe households. This is quite unusual as far as the tribes are concerned that
0.00%
50.00%
100.00%
LICGovernment Others
PLIboth LIC and
PLI
96.00%
0.00% 0.00%3.00%
1.00%
0.00%100.00%
0.00% 0.00% 0.00%
0.00% 0.00%100.00%
0.00% 0.00%
life insurance health insurance general insurance
Chapter 6 Extent and Nature of Financial Exclusion of Tribes
Financial Exclusion among the Scheduled Tribes: A Study of Wayanad District in Kerala 202
they remain disinterested in having insurance policies unless they are made aware of the
need to have insurance policies at the behest of the interest of either government or
insurance marketing agents. Suffice to say that the holding of insurance products for a
long time, so that the tribes feel the benefit of having it at the event of raising a claim over
policy, is possible only if the demand for insurance products stems from the tribes
themselves.
Table 6.33 Tribe Wise Distribution of Reasons for Taking Insurance
Reasons for taking insurance Tribal Communities
Total Kurichya Kuruma Paniya Adiya
Frequent demand by agents 58.60 51.20 34.1 58.80 43.80
As a part of government programme 28.60 20.90 64.10 11.80 46.50
Self Decision 11.40 25.60 1.80 29.40 9.10
Any other reasons 1.40 2.30 0.00 0.00 0.70
Total 100 100 100 100 100
Source: Field Survey, 2012. Figures are in percentages
A tribe wise analysis of reasons for accessing insurance products takes us to
fascinating facts. The table (Table No. 6.33) reveals that majority of tribal households
belonging to Kurichya and Kuruma communities have suggested frequent demand from
agents as the reason for buying insurance product while in the case of Paniya tribe only
around 34 percent of households are of the view that they did buy life insurance owing to
pressure from agents. Nevertheless, among the Adiya community around 59 percent of
households have opined that frequent demand from agents persuaded them to go in for
insurance products. Majority of households under the Paniya tribe have bought insurance
product, mainly health insurance product as discussed above, owing to the reason that it
has been offered by government as mandatory. It needs to be jotted here that only a
negligible percent of households from this tribe community has remarked self-decision as
a motivating factor for taking insurance.
As is evident from the preceding discussion, it is obvious that tribe households
hold mainly two types of insurance products viz. life insurance and health insurance. Now
we attempt to elucidate the reasons for availing these two types of insurance products,
Chapter 6 Extent and Nature of Financial Exclusion of Tribes
Financial Exclusion among the Scheduled Tribes: A Study of Wayanad District in Kerala 203
which are mainly accessed by the tribes. In the case of life insurance, it is apparent that
approximately eighty percent of the tribe households have cited frequent demand from the
part of agents as the main reasons that tended them to buy life insurance and nearly
twenty percent have bought due to their own intention to hold it. However, in the case of
health insurance cent percent of the tribe households have opined that they hold health
cards, as it has been made available to them mandatory by the government (Figure
No.6.7) not because of any need felt by them.
Figure 6.9 Insurance Product Wise Distribution of Reasons for Taking Insurance
Source: Field Survey, 2012.
It is observed that frequent demand from the part of agents has been considered as
prime reason for availing life insurance products and the forward tribal communities have
demanded more life insurance product because of the pressure exerted on them by the
agents. Needles to add that along with pressure from the part of agents, the tribes must
have the capacity to pay premium to such insurance products.
Thus it is obvious that insurance is indispensable to a greater extent should one
like to be protected from unforeseen untoward incidences in life which result in
irreparable consequences leading inter alia to a fall in income. Although insurance has
been thought to be something, which fits to the shoes of rich and middle-income group,
now with the entry of micro insurance in tune with the micro finance, it has become a
prerequisite for the low-income group also. Nevertheless, as we have seen in the case of
tribes, for low-income people like tribes, still availing insurance seems to be not as easy
as it is in the case of the general population.
For a comprehensive understanding about the pattern of insurance that the tribes
aspire to have we pose an important query to the tribal households as to the type of
0.00%
100.00%
79.40%
0.00% 20.60%
0.00%
0.00%100.00%
0.00%0.00%
LIC Government
Chapter 6 Extent and Nature of Financial Exclusion of Tribes
Financial Exclusion among the Scheduled Tribes: A Study of Wayanad District in Kerala 204
insurance products they most prefer to have. The query was put across all tribe
households irrespective of whether they hold insurance product or not. The results that we
have, however, do not turn out to be unsurprising. Most of them are, as is evident from
the table (Table No.6.34) that is around 58 percent, are of the view that they require life
insurance followed by health insurance (32.40 percent).
Table 6.34 Tribe Wise Distribution of the Insurance Service Required by Tribes
Type of Insurance Tribal Communities
Total Kurichya Kuruma Paniya Adiya
Life Insurance 57.70 48.70 61.70 52.50 57.80
General Insurance 10.60 0.00 2.30 0.00 3.40
Health Insurance 27.90 35.50 29.90 47.50 32.40
Crop Insurance 3.80 15.80 6.10 0.00 6.40
Total 100 100 100 100 100
Source: Field Survey, 2012. Figures are in percentages
The tribes do not earnestly require crop insurance and general insurance
unlike in the case of both health and life insurance products. Another pertinent question
that deserves to be examined now is how the preference of insurance products differs
among tribal communities. A glance at the table (Table No.6.34) provides us the fact that
majority of households belonging to all tribe communities in our study prefer to have life
insurance products followed by health insurance.
6.4 Exclusion from Pension Schemes
The next financial product that merits attention in this study is the access to
pension, which is important particularly for the elderly. Access to an appropriate pension
scheme, which takes care of the bare needs during the old age, is indispensable, and forms
a fundamental financial prerequisite that one desperately requires to protect oneself from
different type of shocks that are likely to occur as life passes by. The palpable result of
not having an adequate pension provision is nothing but a severe risk of slipping into
poverty and hardship in old age. Moreover, in the process of financialization5, having
5 Financialization means that financial products are less and less avoidable to lead a “normal” life. The word financialization is understood to mean the growing necessity to use financial products to meet everyday needs.
Chapter 6 Extent and Nature of Financial Exclusion of Tribes
Financial Exclusion among the Scheduled Tribes: A Study of Wayanad District in Kerala 205
access to an appropirate pension scheme assumes unparallel significance due to the fact
that every kind of financial product is closely associated with the process of
financialcialization from a bank account to pension schemes. It is apt to mention at this
point the importance that has been attached to consumption during the old age by the Life
Cycles Hyopothesis. If one needs to meet his consumption and health needs at old age,
then he or she must have some appropriate pension schemes.
It is undeniable that lack of specifically desinged pension schemes creates
hazardous for the people living in economically and socially deprived circumstances and
surviving on meagre income. As far as tribes are concerned, they have historically been
deprived of basic amenities of life and devoid of many life supporting systems. They lack
assets to generate income and deprived of opportunities for sustenable works. Under these
conditions, saving during the earning years is likley to be low and insufficieent to
subscribe to a pension scheme that supports their life upon old age. In todays money
based exchange system where even money based transaction is being replaced by cashless
system, access to certain well designed pension scheme is very essential for tribes also.
Although many pension schemes offered by governments carry a little money, when that
reaches the hands of beneficiaries it would be interesting to see the blemish of joy
appearing on the face of them which clearly paints the value that they attach to the
pension scheme. Nevertheless, it has been observed in our study that the extent of
excluion from pension system is rampant among the tribe households. Roughly speaking
it has been observed that nearly only 32 percent of tribe households do have access to
pension schemes, which show a dismal, picture (Figure No.6.7).
Figure 6.10 Tribal Households Covered Under any Pension Scheme
Source: Field Survey, 2012.
Yes, do have
pension scheme32%
No, don't have pension scheme
68%Other68%
Chapter 6 Extent and Nature of Financial Exclusion of Tribes
Financial Exclusion among the Scheduled Tribes: A Study of Wayanad District in Kerala 206
6.4.1 Tribe Wise Distribution of Number of Pension Holders
In this section, an attempt is made to see the distribution of pension holders among
the four tribal communities. A look at the figure (Figure No.6.8) evidently provides the
fact that there is no much difference among tribe communities with regard to the
distribution of pension holders except in the case of Paniya tribe. It is obvious that in the
case of Paniya tribe relatively a good percent of the households have pension schemes,
although most of which are widow pensions. This may on prima facie run contrary to the
general perception that among the Paniya tribe, a backward tribe, the percentage of
households holding pension schemes should have been less compared to other forward
tribes. Discussion with the key informants has revealed that STPs are more active among
the Paniya tribe as this is the most vulnerable group, and this has immensely helped
households belonging to Paniya tribe to apply for pension policies at the right time.
Surprisingly, Kurichya tribe has the least number of pension holders. This is perhaps
partly due to the underreporting of data by the Kurichya tribe. The inference that one can
arrive at is unlike accounts and, to some extent, insurance products, tribe communities are
excluded largely from accessing pension schemes. This pinpoints the limit that has
happened to the extent of access to financial products as far as the tribe communities are
concerned. It is revealed that tribes have not been provided with adequate pension welfare
schemes nor have they been made aware of the existence of pension schemes so that they
could have accessed them in accordance with their financial position. This underlines the
fact that tribes are still in darkness as far as the information on various scheme, both of
government and private providers, are concerned. For a better in-depth into the pattern of
accessing pension schemes among the tribe communities it would be worthwhile to
examine different types of pension products that various tribes communities have
accessed to. The next section looks into this aspect of our analysis.
Chapter 6 Extent and Nature of Financial Exclusion of Tribes
Financial Exclusion among the Scheduled Tribes: A Study of Wayanad District in Kerala 207
Figure 6.11 Tribe Wise Distribution of Pension Holders
Source: Field Survey, 2012.
6.4.2 Pension Schemes that the tribes hold
Pension schemes that are available at present to tribes could be categorized into
welfare pensions, statutory pension, and contributory pension schemes. Old age pension,
widow pension, and agricultural labour pension are the best examples of welfare pension,
which are also available among the tribe households that come under this study. Here we
have one more classification namely ‘any other pension scheme’ that covers statutory
government pension, contributory pension and provident fund pension and the like which
are, however, not popular among the low-income people like tribes. Our study has
revealed that old age pension, widow pension, Agriculture labour pension, and any other
pension are most popular among the tribe households in the study area. Among the
welfare pension schemes it is obvious that a reasonable percentage of households to the
tune of a little less than 27 percent benefit from old age pension (Table No.6.35). Widow
pension, another welfare pension, gives financial relief to nearly around 26 percent of
tribe households. Interestingly, only approximately 21 percent of tribe households have
access to any other pension schemes, which covers mainly service pension and other
pension that the tribes demand backed by their resourcefulness to subscribe it. A relative
low holding of this clearly reveals the lack of active demand from the side of tribes for
pension schemes. Unsurprisingly, agriculture labour pension is a preferred pension
scheme that the tribes rely on. From the discussion with the key informants, it has become
evident that none of the tribe households has access to public provident fund pension
scheme, which is gaining momentum in India in recent times especially since the advent
of aggressive financial sector reforms. A word of caution has to be made here that while
Kurichya
Kuruma
Paniya
Adiya
23.10%
26.30%
38.70%
25.4
76.90%
73.70%
61.30%
74.6
Yes,do have pension No, don't have pension
Chapter 6 Extent and Nature of Financial Exclusion of Tribes
Financial Exclusion among the Scheduled Tribes: A Study of Wayanad District in Kerala 208
reporting the status of having pension schemes, households having more than one pension
schemes, say, one old age pension and agricultural labour pension, are unlikely to report
the latter because of their tendency to underreport the dole out they receive from
government departments.
Looking at the tribe wise distribution of pension schemes, it is obvious (Table
No.6.35) that among the Kurichya community around 33 percent households have old age
pension schemes while a little more than 29 percent hold agriculture labour pension.
What is noteworthy is the fact that unlike Kurichya, the Kuruma community, a forward
tribe like the Kurichya, has nearly 35 percent of households holding ‘any other pension
schemes’ comprising of statutory pension schemes, public and private pension schemes.
Another striking feature is that among the Paniya tribe, shockingly nearly 33 percent of
households survive partially on widow pension. This trend, it is to be noted, is quite
unobserved among other tribes and hence requires serious attention. A probe into this
aspect has led us to the increasing menace of addiction of Paniya adults to alcohol and
other type of narcotics. It is revealed that due to addiction to alcohol many male
breadwinners of the Paniya households fall prey to death at an early age, ending the life of
their counterparts at the mercy of widow pension. Many have opined that this is a
growing social menace that has been plaguing the life of Paniya tribes in the study area. It
is also cautioned that if this trend continues unabated, the Paniya tribe would be
extinguished from the map of Tribes in Kerala in near future. Adiya tribe, another
backward tribe, however, presents a distinctive picture as far as the subscription to
different pension schemes is concerned. Among the Adiya it is observed from the study
that a relatively more percent appear to have been holding old age pension.
Table 6.35 Pension Scheme: Tribe Wise Distribution
Pension Schemes
Tribal Communities
Total Kurichya Kuruma Paniya Adiya
Old Age Pension 33.30 25.00 23.80 40.00 26.90
Widow Pension 16.70 15.00 32.70 13.30 26.30
Any other Pension 20.80 35.00 18.80 20.00 21.30
Agriculture Labour Pension 29.20 25.00 24.80 26.70 25.60
Total 100 100 100 100 100
Source: Field Survey, 2012. Figures are percentages
Chapter 6 Extent and Nature of Financial Exclusion of Tribes
Financial Exclusion among the Scheduled Tribes: A Study of Wayanad District in Kerala 209
6.5 Concluding Observations
In this chapter, the researcher has attempted to examine the extent of financial
exclusion among the tribe communities with regard to banking, credit, insurance, and
pension services besides the analysis of inter-community differences. With regard to
access to banking services, the study enquired into whether the tribe households have any
type of accounts with the formal banks. The study has found that ninety-five percent of
tribe households are ‘banked’, showing that the extent of exclusion from bank accounts is
negligible among the tribe households. Kuruma, a forward tribe, has the largest percent
of ‘banked’ households whereas Paniya, a backward tribe, has the least. Interestingly, the
study has found no significant association between the tribe communities and the status of
having bank accounts. Regarding the type of accounts, the influence of MGNREGS in
compelling the households to open accounts is very evident. More than half of the tribe
households have opened MGNREGS account. Households belonging to the Paniya tribe
hold the largest number of MGNREGS account whereas Kuruma tribe has the least
MGNREGS account holders. The association between the type of accounts and the tribe
communities has been found to be statistically significant. The study has found that most
of the tribe households have opened accounts with the nationalized banks, with RRBs
coming in the second position. As far as the reason for exclusion from having bank
accounts is concerned, self-exclusion has come out to be the prominent reason.
Unsurprisingly, it is among the Paniya tribe that most have suggested self-exclusion to be
the reason for them being ‘unbanked’. To find out the importance of MGNREGS in
making tribes banking included, the study has analyzed the extent of banking inclusion
sans MGNREGS account, and has found that more than half of the tribe household bas
become ‘unbanked’ in the absence of MGNREGS account. Interestingly, Paniya has the
most ‘unbanked’ without MGNREGS and Kuruma has the least. Tribes, it has been
found, do not consider savings bank account as a saving tool, which is evident from the
small sum of money recorded in their passbook as the current balance. The study has
found significant difference among the tribe communities in respect of the current balance
kept in the account. Tribes, it appears, have not benefited from the banking technologies.
More than ninety percent do not have ATM Card and chequebooks. With regard to the
alternative mode of savings, most of tribes prefer to keep money in liquid form.
Chapter 6 Extent and Nature of Financial Exclusion of Tribes
Financial Exclusion among the Scheduled Tribes: A Study of Wayanad District in Kerala 210
Unlike exclusion from having bank accounts, exclusion from credit market, both
formal and informal, has been found to be high among the tribe households, which is
evident from the fact that around half of the tribes households have been excluded from
the credit market. Interestingly, Kuruma has the most percent of indebted households
whereas Adiya has the least. The study has revealed that an overwhelming percent of tribe
are indebted to informal sector, and informal indebtedness is high among the Paniya tribe
whereas it is the least among the Kuruma tribe. On the other hand, formal indebtedness is
high among the Kuruma and low among the Adiya. There is significant difference
between the source of indebtedness and the tribe communities. Among the formal sources
of indebtedness, indebtedness to cooperatives appears to be relatively high. Moneylender
is the preferred choice of many households in the case of informal sources of credit. It is
interesting to note that most of the households take credit to meet household current
expenditure, a reason for the persistent debt trap. The study has found significant
difference among tribe communities with regard to the amount of credit availed by the
tribe households. Formal credit indebtedness appears to be in the vicinity of 80 percent. A
little less than sixteen percent of tribes are ‘actively excluded’ from the credit market
whereas 64 percent face ‘passive exclusion’. Fear of refusal has been cited to be the main
reason discouraging households to seek credit from the formal sources.
Insurance, another financial instrument, appears to have eluded tribes largely. The
study has found that nearly forty percent do not have any type of insurance. Kurichya has
the most insured households whereas Adiya has the least. Life insurance and health
insurance have been the main type of insurance that most of the tribes have accessed. LIC
and government are the main insurance service providers in the study area. Government
supplies mainly health insurance to tribes, which they find most helpful. Regarding access
to pension schemes, the study has observed that nearly seventy percent of tribe
households do not have any form of pension. Surprisingly, Paniya has more pension-
receiving households thanks to health insurance promoted by government and widow
pension, whereas Kurichya tribe has the least. Having gone through the financial products
that the tribes hold, our next attempt is to analyze the influence of socio-economic
features of tribes on their financial exclusion. For this, in the next chapter, we shall first
focus on building an index of financial exclusion.
Chapter 6 Extent and Nature of Financial Exclusion of Tribes
Financial Exclusion among the Scheduled Tribes: A Study of Wayanad District in Kerala 211
Works Cited 1. Anderloni, L. (2008). Financial Services Provision and Prevention of Financial
Exclusion. Europian Commission.
2. Banerjee, A., & Duflo, E. (2007). The Economic Lives of the Poor. Journal of Economic Perspective , 21, 141-167.
3. Basu, P. (2006). Improving acess to finance for India’s rural poor. Washington DC: World Bank Publications.
4. Bridges, S., & Disney, R. (2004). Use of Credit and Arrears on Debt among low income families in the United Kingdom. Fiscal Studies , 25(1).
5. Carbo, S., Gardener, E. P., & Molyneux, P. (2007). Financial Exclusion in Europe. Public Money and Management , 27(11), 21-27.
6. Carbo, S., Gardner, E. P., & Molyneux, P. (2005). Financial Exclusion. New York: Palgrave Macmillan.
7. Collins, D., Morduch, J., Rutherford, S., & Ruthven, O. (2009). Portifolios of the Poor: How the World's Poor Live on $ 2 a Day. Princeton: Princeton University Press.
8. Commission, E. (2008). Financial Services Provision and the Prevention of Financial Exclusion. Directorate General for Employemnt and Social Inclusion.
9. Dreze, J., & Khera, R. (2011). Battle for Employemnt Gurantee. New Delhi: Oxford University Press.
10. Gloukoviezoff, G. (2007). The Paradox of difficulties for People on Low Income? In A. Anderlon, M. D. Braja, & E. M. Carluccio, New Frontiers in Banking Services: Emerging Need and Tailored Proudcts for Untapped Markets (pp. 213-243). Homburg: Springer.
11. GOI. (1998). All India Debt and Investment Survey. New Delhi: NSSO, Ministry of Statistics and Programme Implementation.
12. GOI, N. S. (2003). All India Debt and Investment Survey. New Delhi: Ministry of Statistics and Programme Implementation.
13. Hogarth, J. M., & O'Donnell, K. H. (2000). If you build, will they come? A Simulation Financial Product Holdings amoung Low-to-Moderate Income Households. Journal of Consumer Policy , 23(4), 419-444.
14. Kaladhar, K. (1997). Micro Finance in India: Design, Structure and Governance. Economic and Political Weekly , 32(42), 2687-2706.
Chapter 6 Extent and Nature of Financial Exclusion of Tribes
Financial Exclusion among the Scheduled Tribes: A Study of Wayanad District in Kerala 212
15. Karlan, D., & Morduch, J. (2009). Access to Finance. Hand Book of Development Economics , 1-87.
16. Kempson, E., & Whyley, C. (1999). Kept out or Opted out?: Understanding and Combating Financial Exclusion. Bristol/York: The Policy Press/Joseph Rowntree Foundation.
17. Kempson, E., Bryson, A., & Rowlingson, K. (1994). Hard Times: How Poor Familites make end meet. London: Policy Studies Institue.
18. Llanto, G. M. (1989). Asymmetric Information in Rural Financial Markets and Interlinking of Transactions through Self Help Groups. Journal of Philippine Development , 28, 15(1).
19. Palanisamy, G. (2002). The Economic Conditions of the Primitive Tribes (A Case Study in The Nilgiris of Tamil Nadu). Pondicherry: Unpublished PhD work sumbitted to Pondicherry University.
20. Patil, R. H. (2010, May 8). Financial Sector Reforms: Realities and Myths. Economic and Political Weekly , 48-53.
21. Rajasenan, D. (2009). Human Development Report of Tribal Communities in Kerala. Thiruvanathapuram: UNDP/Planning Commission Project on SSPHD, HRDC Unit, Kerala State Planning Board.
22. Rose, E. (1999). Consumption smoothing and excess female Mortality in Rural India. Review of Economics and Statistics , 81, 41-49.
23. Rustomji, N. (1989). A Philosophy of NEFA: The fundamental Problem. In R. Nari, Verrier Elwin Philantropologists: Selected Writings. Madras: Oxford University Press.
24. Sen, A. (2000). Social Exclusion: Concept, Application, and Scrutiny. Social Development Papers No.1. Manila: Asian Development Bank.
25. Sinclair, S. (2001). Financial Exclusion: An Introductory Survey. Edinburgh: Heriot-Watt University/CRISIS.
27. Singh, R. P., & Balishter, C. (1991). Impact of bank finance on cropping pattern and income on small firms-A comparative study. Indian Cooperative Review , 38(4), 211-200.
Chapter 6 Extent and Nature of Financial Exclusion of Tribes
Financial Exclusion among the Scheduled Tribes: A Study of Wayanad District in Kerala 213
28. Srivastava, H. C., & Chaturvedi, M. K. (1989). Dependency and Common Property Resources of Tribal and Rural Poor. New Delhi: Commonwealth Publishers.
29. Thingalaya, N. K. (2009, April). 'Financial Inclusion-the effectiveness of no-frill accounts'. Industrial Economist , 22-24.
30. Thorat, U. (2008). Inclusive Growth-The role of banks in Emerging Economies. Colombo: at Central Bank of Sri Lanka.