Page 1
ZORIŢA MARIA SCONŢA
EXTRACTION, PURIFICATION, CHARACTERIZATION
AND IN VITRO TESTING OF ANTHOCYANIN RICH
FRACTIONS OBTAINED FROM ARONIA MELANOCARPA AND
VACCINIUM SP.
PhD THESIS ABSTRACT
PhD SUPERVISOR
Prof. CARMEN SOCACIU, PhD
Cluj-Napoca
2012
UNIVERSITY OF AGRICULTURAL SCIENCE AND
VETERINARY MEDICINE
CLUJ-NAPOCA
FACULTY OF ANIMALS SCIENCES AND BIOTECHNOLOGY
Page 2
II
CONTENT
INTRODUCTION: AIMS AND OBJECTIVES ................................................................ V
EXPERIMENTAL RESULTS ..................................................................................... VII
CHAPTER I. ..................................................................................................................... IX
CHEMICAL CHARACTERIZATION OF DIFFERENT VARIETIES OF ARONIA
MELANOCARPA SP. AND VACCINUM MYRTILUS SP. AND THEIR
ANTIOXIDANT ACTIVITY ........................................................................................... IX
MATERIALS AND METHODS .................................................................................. IX
Extraction ................................................................................................................... IX
High-performance liquid chromatography (HPLC) .................................................. IX
Total polyphenolic content. ....................................................................................... IX
Total flavonoid content .............................................................................................. IX
Quantification of total anthocyanins .......................................................................... IX
Scavenging effect on ABTS radicals ........................................................................... X
Ferric reducing antioxidant power (FRAP) Assay. ..................................................... X
Cupric reducing antioxidant potential assay CUPRAC ............................................... X
Oxygen radical absorbance capacity assay (ORAC) ................................................... X
Scavenging effect on hydrogen peroxide (HPS) ......................................................... X
RESULTS AND DISCUSSIONS ................................................................................... X
Quantitative analysis of anthocyanins by HPLC. ........................................................ X
Total polyphenolic content ....................................................................................... XV
Total flavonoid content ............................................................................................. XV
Total anthocyanin content......................................................................................... XV
Total antioxidant activity ....................................................................................... XVII
Trolox equivalent antioxidant capacity (ABTS) assay .......................................... XVII
Ferric reducing antioxidant potential (FRAP) assay ............................................. XVII
Cupric reducing antioxidant potential (CUPRAC) assay ...................................... XVII
Oxygen radical absorbance capacity (ORAC) assay ............................................. XVII
Hydrogen peroxide scavenging activity (HPS) ..................................................... XVII
Conclusions ................................................................................................................ XIX
CHAPTER II. ................................................................................................................. XXI
PURITY EVALUATION OF ANTHOCYANIN RICH-FRACTIONS OBTAINED
FROM CHOKEBERRIES AND BLUEBERRIES USING DIFFERENT SOLID PHASE
EXTRACTION METHODS .......................................................................................... XXI
MATERIALS AND METHODS ............................................................................... XXI
Preparation of anthocyanin rich-fraction ................................................................... XXI
C18 Sep Pack SPE .................................................................................................. XXI
Oasis- MCX SPE .................................................................................................... XXI
Amberlite XAD-7 and Sephadex LH-20 SPE ........................................................ XXI
Purity evaluation ........................................................................................................ XXI
Page 3
III
HPLC-PDA and MS analysis ................................................................................. XXI
RESULTS AND DISCUSSIONS ............................................................................. XXII
Purity evaluation by HPLC-PDA .......................................................................... XXII
Purity evaluation by molar absorptivity ............................................................... XXIV
SPE methods comparison ..................................................................................... XXIV
Purity determination methods comparison ........................................................... XXIV
Confirmation of purity with HPLC-MS analysis .................................................. XXV
CONCLUSIONS .................................................................................................... XXVII
CHAPTER III. .......................................................................................................... XXVIII
CHEMOPROTECTIVE EFFECTS OF AN ANTHOCYANIN-RICH FRACTION
FROM ARONIA PRUNIFOLIA ON B16-F10 MELANOMA MURINE AND HELA
TUMOR CERVICAL CELL LINES ........................................................................ XXVIII
MATERIALS AND METHODS .......................................................................... XXVIII
Extraction preparation of anthocyanin fraction. ................................................ XXVIII
Cell culture. ........................................................................................................ XXVIII
Cellular proliferation ......................................................................................... XXVIII
Intracellular reactive species assay. ................................................................... XXVIII
RESULTS AND DISCUSSION ........................................................................... XXVIII
Inhibition of B16F10 and HeLa tumor cells survival ........................................... XXIX
Intracellular ROS ................................................................................................... XXX
CONCLUSIONS ...................................................................................................... XXXI
CHAPTER IV. .......................................................................................................... XXXIII
ANTHOCYANINS DETERMINATION IN VARIOUS CULTIVARS OF HIGHBUSH
BLUEBERRIES AND THEIR ANTIPROLIFERATION AND APOPTOSIS
PROPERTIES IN B16-F10 METASTATIC MURINE MELANOMA CELLS ..... XXXIII
Materials and methods .......................................................................................... XXXIII
Preparation of anthocyanin fraction. ................................................................. XXXIII
HPLC – DAD analysis of anthocyanins ............................................................ XXXIII
HPLC-ESI-MS analysis of anthocyanins. ......................................................... XXXIII
Cupric reducing antioxidant capacity (CUPRAC) assay ................................... XXXIV
Scavenging effect on ABTS radical .................................................................. XXXIV
Oxygen radical absorbance capacity (ORAC) assay ......................................... XXXIV
Cell and cell culture ........................................................................................... XXXIV
Analysis of cell proliferation ............................................................................. XXXIV
Detection of LDH activity ................................................................................. XXXIV
96-well-based EB/AO staining .......................................................................... XXXIV
TUNEL assay and analysis ................................................................................. XXXV
Results and discussions .......................................................................................... XXXV
Identification and quantification of blueberry anthocyanins .............................. XXXV
Determination of antioxidant activity ....................................................................... XL
Inhibition of tumor cell proliferation ........................................................................ XL
Page 4
IV
Cellular membrane integrity assessment ................................................................. XLI
Acridine orange/ Ethidium bromide staining ......................................................... XLII
Apoptotic cell death .............................................................................................. XLIII
CONCLUSIONS ................................................................................................ XLIV
GENERAL CONCLUSIONS ...................................................................................... XLVI
REFERENCES .................................................................................................................... L
Page 5
INTRODUCTION: AIMS AND OBJECTIVES
Anthocyanins are the exceptional natural pigments, not only due to their
wonderful range of red to blue colours of plants, flowers or fruits, but to their strong
antioxidant potential in vitro and in vivo, with specifal health benefits. The richest
sources of anthocyanins are the small berries like chokeberries, blueberries, elderberries,
cranberries and many others fruits and vegetables.
As abundant polyphenol type of antioxidants in our diets, anthocyanins have
received an increased interest from consumers and food manufacturers (Scalbert and
Williamson, 2000). There are many studies which had suggested a potential health
benefit of anthocyanins (Jing and Giusti, 2011). Also they can be used in technological
field, as natural colorants.
Despite the great potential of anthocyanins use in food, pharmaceutical and
cosmetic industries, this was limited by their relative instability and low extraction
percentages. Currently, most investigations on anthocyanins are focused on solving these
problems, as well as their purification, identification and antioxidant effect in cell culture
(Castaneda- Ovando et al., 2009).
The aim of this PhD thesis was:
Our aim was to investigate the metabolic profile of four Romanian chokeberry
varieties and nine Romanian blueberry varieties regarding anthocyanin , total phenolic
and flavonoid content by High Performance Liquid Chromatography (HPLC) and
spectrophotometric assays. The antioxidant capacity of analyzed samples was evaluated
through five, complementary assays (ABTS, HPS, ORAC, FRAP, CUPRAC). HPS assay
being a new method to evaluate antioxidant activity of foods.
The second major proposal of this work was to obtain a rich fraction of
anthocyanins and to evaluate its antioxidant and chemopreventive potential against tumor
cells. HeLa (human ovarian cancer) and B16F10 (melanoma murine) cells line where
chosen in order to demonstrate the proapoptotic effect of anthocyanins.
Based on recent data literature which reveals the anti-tumor proprieties of
anthocyanins such as inhibition of cell growth, cell cycle progression, induction of
apoptosis, inhibition of angiogenesis, tumor invasion and metastasis we developed an
experiment to evaluate their antiapoptotic and control the cancer cells proliferation.
The main objectives are:
1. The evaluation of the metabolic profile of four Romanian chokeberry varieties
three varieties of cultivated highbush blueberries and two types of wild blueberries
by extraction, spectral and chromatographic characterization and identification of
individual anthocyanins
2. The evaluation of the comparative antioxidant activity (by complementary assays
ABTS, HPS, ORAC, FRAP, CUPRAC) of chokeberry and blueberry extracts and
quantification of their total polyphenol content.
Page 6
PhD Thesis Abstract
VI
3. Purification of an anthocyanin-rich fractions from blueberry and chokeberry
extracts and purity evaluation by HPLC and molar absorptivity methods
4. The evaluation of the chemopreventive potential and the prooxidative effect of the
anthocyanin-rich fraction on HeLa tumor cervical and B16-F10 melanoma murine
cell lines, using MTT proliferation assay and Intracellular reactive species assay
5. Investigation of blueberry anthocyanins potential in melanoma cancer cells, by
MTT proliferation assay, LDH activity, 96-well-based EB/AO staining and
TUNEL assay
Thesis structure. The thesis is structured into two main parts, first one contains a
literature survey and second one is focused on the original contributions (including
results and discussions, as well presentations of experimental measurements).
The first part includes two chapters:
Chapter 1 summarizes the chemical characterization of anthocyanins regarding
their stability, biosynthesis, antioxidant activity and analytical methods used for
purification.
Chapter 2 describes the pathology of cancer disease and anthocyanins
implications in tumoral process. Briefly, recent research studies are sumarized on
antocyanins as inducers of apoptosis and inhibitors of tumor invasion on different types
of cancer.
The second part includes four chapters (4-6):
Chapter 3 reveals a comparative study on antioxidant activity and their
anthocyanin content from the all studied blueberry varieties
Chapter 4 contains an experiment realized in order to evaluate and compare
different anthocyanins solid phase extraction methods
In chapter 5 an experiment regarding evaluation of the chemopreventive effects
of chokeberry anthocyanin-rich fraction on cancer cell lines (B16-F10 melanoma murine
and HeLa tumor cervical cell lines) is shown.
In chapter 6 a study on anthocyanins identification and their antioxidant activity
from blueberry cultivars is presented. The antitumoral and proapoptotic effects of
anthocyanin-rich fraction on B16-F10 melanoma murine cells were also evaluated.
A part of the experimental results are due to the collaborative agreement between
our University of Agricultural Sciences and Veterinary Medicine, Cluj-Napoca, Romania,
Department of Chemistry & Biochemistry with the Ohio State University, Columbus,
OH, Department of Food Chemistry.
The PhD program was funded by the European Social Fund Doctoral Program
POSDRU/88/1.5/S/49598, National Project PN-II-RU-TE-109-2010 and European Social
Fund Postdoctoral Program POSDRU/89/1.5/S/60746.
Page 7
PhD Thesis Abstract
VII
EXPERIMENTAL RESULTS
Anthocyanins belong to the class of plant secondary metabolites named flavonoids
and they are responsible for red, orange or blue colors in many vegetables and fruits
(Giusti and Wrolstad, 2003) (Fig. 2). These pigments are found to be more complex in
flowers and ornamental plants then anthocyanins founds in fruits and vegetables,
blueberries and grapes make exception because they contain a variety of anthocyanins
(Cara et. al., 2008).
They are stable and soluble in aqueous media, proprieties which makes them
interesting for the use as natural water-soluble colorants (Ahmadiani, 2012, Castanelo
Osvaldo et al., 2009; Socaciu ,2007; Pazmino-Duran et al., 2001).
Name
Substitution
Visible color
Visible
max.(nm)
in MeOH-HCl
R1 R2
Cyaniding (Cy) OH H
red
535
Peonidin (Pn) OCH3 H 532
Pelargonidine
(Pg)
H H 520
Malvidin (Mv) OCH3 OCH3 542
Delphinidin
(Dp)
OH OH 546
Petunidin (Pt) OCH3 OH 543
Fig. 1. Structure of the most commonly anthocyanidins (adapted from Harborne ,
1998)
Fig. 2. Structura chimică a celor mai importanţi antociani anthocyanidins (adaptată
după Harborne , 1998)
Anthocyanins stability can be affected also by several factors such as pH,
temperature, light, chemical structure, co-pigmentation, acylation, oxygen, solvents,
magneta
purple
Chromane ring
Page 8
PhD Thesis Abstract
VIII
enzymes, flavonoids, proteins and metallic ions. Chemical structure of anthocyanins
plays an important role in their stability.
Being found in many edible berries anthocyanins offer some hope in the struggle
to prevent and treat cancer. Studies performed on cell cultures, animal cells or on human
intervention cells have shown that berry fruits have great potential to reduce the risk of
many cancer types. This is because they contain phytochemicals and anthocyanins in
their composition. (Kähkönen et al., 2001)
Page 9
PhD Thesis Abstract
IX
CHAPTER I.
CHEMICAL CHARACTERIZATION OF DIFFERENT VARIETIES OF
ARONIA MELANOCARPA SP. AND VACCINUM MYRTILUS SP. AND THEIR
ANTIOXIDANT ACTIVITY
The identification and quantification of anthocyanin founded in chokeberry and
blueberry where evaluated through HPLC analysis. Various antioxidant activity methods
have been used evaluate and compare the antioxidant activity of analyzed extracts:
ABTS, FRAP, CUPRAC, ORAC and H2O2.
MATERIALS AND METHODS
Extraction. Berries analyzed (5 g) were homogenizated in methanol containing
HCl (0.3%) using an ultraturax (Miccra D-9 KT Digitronic, Germany). Extracts were
concentrated at 35˚C under reduced pressure (Rotavapor R-124, Buchi, Switzerland) and
filtered through 0.45 μm Millipore filter for HPLC and antioxidant assays.
Quantitative HPLC analysis of anthocyanins
High-performance liquid chromatography (HPLC) is now one of the most used
technique for cromatografic separation in analytical chemistry. HPLC analyses were
performed on a Shimadzu, equipped with a diode-array detector (DAD) using a Luna
Phenomenex C-18 column (5µm, 25 cm x 4.6 mm) The mobile phase consisted in:
solvent A - formic acid (4.5%) in bidistilled water and solvent B - acetonitrile. The
gradient elution system was: 10% B, 0-9 min; 12% B, 9-17 min; 25% B 17-30 min; 90%
B, 30-50 min; 10% B, 50-55 min.
Total polyphenolic content. Folin's method measures -OH groups in a sample
based on the fact that light absorption increases as OH groups in a sample increase.
Phenolic compounds react with Folin-Ciocâlteu’s reagent only under basic conditions
(adjusted by a sodium carbonate solution to pH =10). Absorption at 765 nm was
measured. Total phenol contents were expressed in gallic acid equivalents.
Total flavonoid content. The total flavonoid content of chokeberry and blueberry
extracts was determined by a colorimetric method as described previously in other studies
(Kim et al., 2003; Zhishen et al., 1999).
Quantification of total anthocyanins. Chokeberry and blueberry total
anthocyanins were determined by the differential pH method based on the property of
anthocyanin pigments to change the color with pH. Total monomeric anthocyanins (mg
cyanidin 3-galactoside equivalent/ 100 g FW) were calculated as follows:
Anthocyanin content (mg/L) = (A x MW x DF x 1000)/ ε x L,
where A = (A510 nm pH 1.0 -A700 nm pH 1.0) - (A510 nm pH 4.5 - A700 nm pH 4.5),
MW= cyanidin 3-galactoside molecular weight (484.84); DF = dilution factor; ε =
Page 10
PhD Thesis Abstract
X
cyanidin 3-galactoside molar absorbtivity in methanol/ HCl (34300 M-1
cm-1
); L = cell
pathlength (1 cm) (Giusti and Wrolstad, 2001).
Scavenging effect on ABTS radicals. The ABTS assay (2, 2-azino-bis (3-
ethylbenzothiazoline- 6-sulfonic acid) diammonium salt) is also called TEAC (Trolox®-
equivalent antioxidant capacity) and is based on the capacity of a sample to scavenge the
ABTS radical cation (ABTS. +) compared to a standard antioxidant (Trolox).
Ferric reducing antioxidant power (FRAP) Assay. Antioxidants are evaluated
as reducers of Fe3+ to Fe2+, which is chelated by TPTZ (2,4,6-Tri(2-pyridyl)-s-triazine)
to form Fe2+ - TPTZ complex, with a maximum absorbance at 593 nm (Benzie and
Strain, 1999).
Cupric reducing antioxidant potential assay CUPRAC was determined
according to a method reported before (Apak et al., 2004).
Oxygen radical absorbance capacity assay (ORAC) measure the peroxyl radical
scavenging activity using as standard 6-hydroxy-2, 5, 7, 8-tetrametylchroman-2-
carboxylic acid (Trolox) (Huang et al., 2005).
Scavenging effect on hydrogen peroxide (HPS) this assay was carried out
following the procedure of Ruch et al., 1989.
RESULTS AND DISCUSSIONS
Quantitative analysis of anthocyanins by HPLC. Anthocyanins identification
and peak assignment are based on their retention times, UV-VIS spectra comparing with
standards (cyanidin-3 galactoside, cyanidin-3 glucoside, delphinidin-3 rhamnoside,
pelargonidin-3 glucoside, delphinidin, paeonidin-3-glucoside, malvidin-3-glucoside,
cyanidin, malvidin) and the literature data. The total anthocyanin content in chokeberries
varied from 290.69 mg/ 100 g FW in AmA to 1319.18 mg/ 100 g FW in AmN (Table 1).
The HPLC chromatograms of the chokeberry extracts are presented in Fig. 2.
Table 1
Cyanidin derivatives and their determined content in chokeberries (mg/100 g of FW),
expressed as cyanidin-3-O-galactoside equivalents
Tabel 1
Derivaţii cianidinei şi conţinutul lor din fructele de aronia (mg/100 g of FW), exprimaţi
ȋn echivalenţi ai cianidin 3-O-glucozidei
Anthocyanin Chokeberry samples
Ap AmA AmN AmV
mg/100g % mg/100g % mg/100g % mg/100g %
Cy-3-O-galactoside 576.7 ± 18 a 67.1 200.9 ± 13
a 69.1 906.9 ± 20
a 68.7 271.5 ± 10
a 67.7
Cy-3-O-glucoside 23.1 ± 4 d 2.6 6.8 ± 2
c 2.3 14.9 ± 3
d 1.1 8.2 ± 1
c 2.0
Cy-3-Oarabinoside 209.5 ± 12 b 24.3 68.1 ± 7
b 23.4 352.4 ± 15
b 26.7 108.2 ± 11
b 27.0
Cy-3-O-xyloside 49.9 ± 9 c 5.8 14.7 ± 3
c 5.0 44.8 ± 8
c 3.4 12.6 ± 4
c 3.1
TOTAL 859.41 100 290.69 100 1319.18 100 400.73 100
Rank 2 4 1 3
Notes: means with different letters in the same column are statistically significant at P≤ 0.05
Page 11
PhD Thesis Abstract
XI
Based on their retention time, UV-VIS spectra compared with standards and
literature data, 13 anthocyanins were identified in bluebery extracts.(Fig. 3). In
Vaccinium myrtillus extracts, petunidin-3-glucoside and delphinidin-3-glucoside have the
highest contribution to the anthocyanin content. In Vaccinium corymbosum, in Elliot and
Duke variety the major anthocyanin content was peonidin-3-galactoside but in BlueCrop
this anthocyanin was absent. (Table 2)
A B
C D
Fig. 2. HPLC chromatograms of chokeberry Aronia melanocarpa var. Nero (A),
Aronia melanocarpa var. Viking (B), Aronia prunifolia (C) Aronia melanocarpa var.
Aron (D). Peak identification 1-cyanidin 3-O-galactoside, 2- cyanidin 3-O-glucoside, 3-
cyanidin 3-O-arabinoside, 4- cyanidin 3-O-xyloside.
Fig. 2. Cromatogramele HPLC ale extractelor de Aronia melanocarpa var. Nero
(A), Aronia melanocarpa var. Viking (B), Aronia prunifolia (C) Aronia melanocarpa var.
Page 12
PhD Thesis Abstract
XII
Aron (D). Identificarea peak-urilor 1-cianidin 3-O-galactozid, 2- cianidin 3-O-glucozid,
3- cianidin 3-O-arabinozid, 4- cianidin 3-O-xilozid
Page 13
PhD Thesis Abstract
XIII
Table 2
Anthocyanin concentrations in blueberry extracts (mg/100 g FW), calculated as cy-3-galactoside equivalent
Table 2
Concentraţiile de antociani din extractele de afine (mg/ 100 g FW), exprimate ȋn echivalenţi de cianidin 3-O-glucozid
Elution
order Compounds
Blueberry
BlueCrop Wild 1 Wild 2 Elliot Duke
1. Delphinidin-3-galactoside 53.29 113.67 73.43 0.00 0.00
2. Delphinidin-3-glucoside 24.53 119.86 87.14 53.62 23.69
3. Cyanidin-3-galactoside 9.96 91.85 37.95 0.00 0.00
4. Delphinidin-3-arabinoside 31.78 66.64 76.35 41.07 13.64
5. Cyanidin-3-glucoside 2.08 96.48 43.34 3.09 0.11
6. Petunidin-3-galactoside 28.54 38.36 17.53 0.00 0.00
7. Petunidin-3-glucoside 25.14 146.27 85.19 21.35 8.18
8. Paeonidin-3-galactoside 0.00 8.71 0.00 125.79 37.11
9. Petunidin-3-arabinoside 12.70 12.80 9.66 0.00 0.00
10. Paeonidin-3-glucoside 54.37 108.81 28.91 12.14
11. Malvidin-3-galactoside 37.97 119.53 39.00 67.45 27.55
12. Malvidin-3-glucoside 34.75 17.51 6.04 0.00 0.00
13. Malvidin-3-arabinoside 0.00 tr tr 0.00 0.00
Total 315.11 940.50 504.55 312.38 122.43
Page 14
PhD Thesis Abstract
XIV
Fig. 3. HPLC chromatogram of blueberry extracts: (A) Bluecrop, (B) Duke, (C)
Elliot, (D) Wild 1, (E) Wild 2. Peak identification: 1-Delphinidin-3-O-galactoside, 2-
Delphinidin-3-O-glucoside, 3-Cyanidin-3-O-galactoside, 4-Delphinidin-3-O-arabinoside,
5- Cyanidin-3-O-glucoside, 6-Petunidin-3-O-galactoside, 7-Petunidin-3-glucoside, 8-
Cyanidin-3-O-arabinoside, 9- Paeonidin-3-O-galactoside, 10-Petunidin-3-O-arabinoside,
A B
C D
E
Page 15
PhD Thesis Abstract
XV
11-Malvidin-3-O-galactoside, 12- Malvidin-3-O-glucoside, 13- Malvidin-3-O-
arabinoside
Fig. 3. Cromatogramele HPLC ale extractelor de afine: (A) Bluecrop, (B) Duke,
(C) Elliot, (D) Wild 1, (E) Wild 2. Identificarea peak-urilor: 1-Delphinidin-3-O-
galactoside, 2-Delphinidin-3-O-glucoside, 3-Cyanidin-3-O-galactoside, 4-Delphinidin-3-
O-arabinoside, 5- Cyanidin-3-O-glucoside, 6-Petunidin-3-O-galactoside, 7-Petunidin-3-
glucoside, 8-Cyanidin-3-O-arabinoside, 9- Paeonidin-3-O-galactoside, 10-Petunidin-3-O-
arabinoside, 11-Malvidin-3-O-galactoside, 12-Malvidin-3-O-glucoside, 13-Malvidin-3-
O-arabinoside
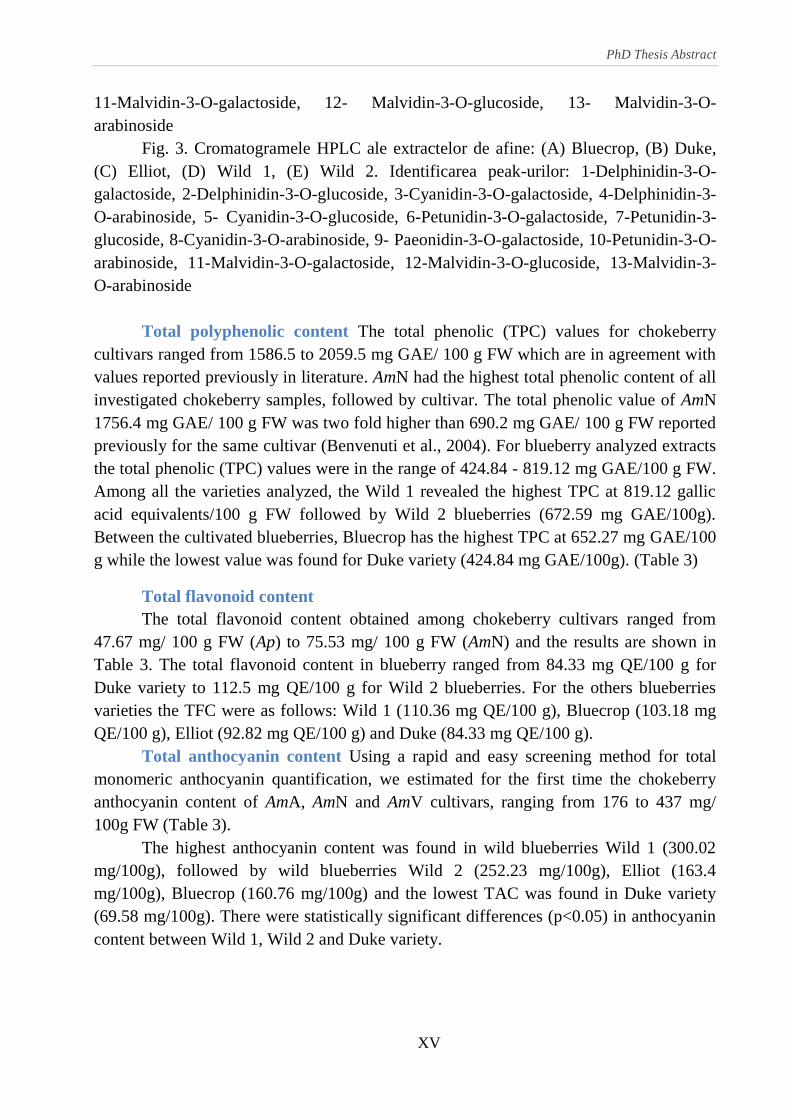
Total polyphenolic content The total phenolic (TPC) values for chokeberry
cultivars ranged from 1586.5 to 2059.5 mg GAE/ 100 g FW which are in agreement with
values reported previously in literature. AmN had the highest total phenolic content of all
investigated chokeberry samples, followed by cultivar. The total phenolic value of AmN
1756.4 mg GAE/ 100 g FW was two fold higher than 690.2 mg GAE/ 100 g FW reported
previously for the same cultivar (Benvenuti et al., 2004). For blueberry analyzed extracts
the total phenolic (TPC) values were in the range of 424.84 - 819.12 mg GAE/100 g FW.
Among all the varieties analyzed, the Wild 1 revealed the highest TPC at 819.12 gallic
acid equivalents/100 g FW followed by Wild 2 blueberries (672.59 mg GAE/100g).
Between the cultivated blueberries, Bluecrop has the highest TPC at 652.27 mg GAE/100
g while the lowest value was found for Duke variety (424.84 mg GAE/100g). (Table 3)
Total flavonoid content
The total flavonoid content obtained among chokeberry cultivars ranged from
47.67 mg/ 100 g FW (Ap) to 75.53 mg/ 100 g FW (AmN) and the results are shown in
Table 3. The total flavonoid content in blueberry ranged from 84.33 mg QE/100 g for
Duke variety to 112.5 mg QE/100 g for Wild 2 blueberries. For the others blueberries
varieties the TFC were as follows: Wild 1 (110.36 mg QE/100 g), Bluecrop (103.18 mg
QE/100 g), Elliot (92.82 mg QE/100 g) and Duke (84.33 mg QE/100 g).
Total anthocyanin content Using a rapid and easy screening method for total
monomeric anthocyanin quantification, we estimated for the first time the chokeberry
anthocyanin content of AmA, AmN and AmV cultivars, ranging from 176 to 437 mg/
100g FW (Table 3).
The highest anthocyanin content was found in wild blueberries Wild 1 (300.02
mg/100g), followed by wild blueberries Wild 2 (252.23 mg/100g), Elliot (163.4
mg/100g), Bluecrop (160.76 mg/100g) and the lowest TAC was found in Duke variety
(69.58 mg/100g). There were statistically significant differences (p<0.05) in anthocyanin
content between Wild 1, Wild 2 and Duke variety.
Page 16
PhD Thesis Abstract
XVI
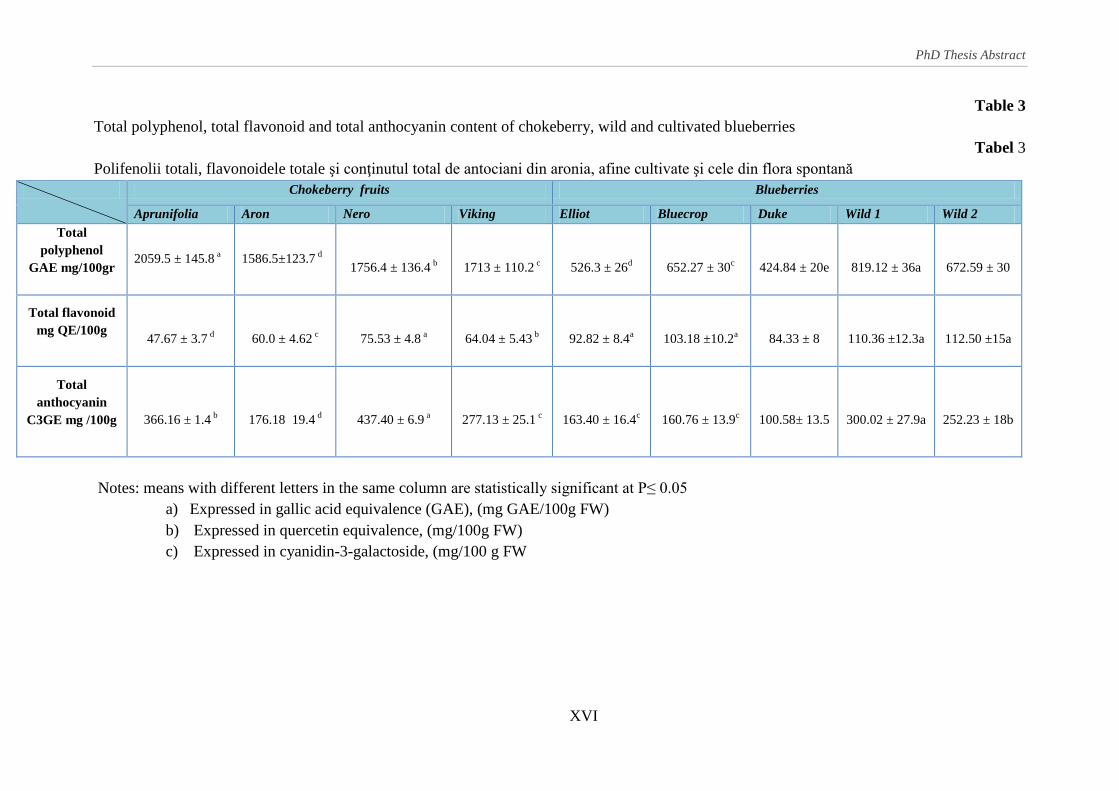
Table 3
Total polyphenol, total flavonoid and total anthocyanin content of chokeberry, wild and cultivated blueberries
Tabel 3
Polifenolii totali, flavonoidele totale şi conţinutul total de antociani din aronia, afine cultivate şi cele din flora spontană
Chokeberry fruits Blueberries
Aprunifolia Aron Nero Viking Elliot Bluecrop Duke Wild 1 Wild 2
Total
polyphenol
GAE mg/100gr
2059.5 ± 145.8 a 1586.5±123.7
d
1756.4 ± 136.4 b
1713 ± 110.2 c
526.3 ± 26d
652.27 ± 30c
424.84 ± 20e
819.12 ± 36a
672.59 ± 30
Total flavonoid
mg QE/100g
47.67 ± 3.7 d
60.0 ± 4.62 c
75.53 ± 4.8 a
64.04 ± 5.43 b
92.82 ± 8.4a
103.18 ±10.2a
84.33 ± 8
110.36 ±12.3a
112.50 ±15a
Total
anthocyanin
C3GE mg /100g
366.16 ± 1.4 b
176.18 19.4 d
437.40 ± 6.9 a
277.13 ± 25.1 c
163.40 ± 16.4c
160.76 ± 13.9c
100.58± 13.5
300.02 ± 27.9a
252.23 ± 18b
Notes: means with different letters in the same column are statistically significant at P≤ 0.05
a) Expressed in gallic acid equivalence (GAE), (mg GAE/100g FW)
b) Expressed in quercetin equivalence, (mg/100g FW)
c) Expressed in cyanidin-3-galactoside, (mg/100 g FW
Page 17
PhD Thesis Abstract
XVII
Total antioxidant activity
Trolox equivalent antioxidant capacity (ABTS) assay
The chokeberry radical scavenging activity ranged from 95 to 180 μmol Trolox/ g FW,
with a statistically significant elevated value for AmN extract. Blueberries Wild 1 extract showed
the highest antioxidant activity ABTS assay (56.65 μmol TE/g). The lowest level in both assays
was obtained for Duke variety.
Ferric reducing antioxidant potential (FRAP) assay
The effective reducing power of chokeberries and blueberry is summarized in Table 4.
AmN extract demonstrated the highest ferric reducing antioxidant potential (341.9±14.2 μmol
Fe2+
/g FW), followed by Ap (300.2±10.6 μmol Fe2+
/g FW), comparing to other two cultivars
AmA and AmV. Towards blueberries, Wild 1 extract showed the highest antioxidant activity
based on FRAP assay (73.71 μM Fe2+/g). The lowest level in both assays was obtained for Duke
variety. (Table 5)
Cupric reducing antioxidant potential (CUPRAC) assay
Ap and AmN cultivars had the highest reducing potential, more than 200 μmol TE/g FW,
values statistically different compared to those obtained for AmA and AmV cultivars, 158.8,
respectively 177.8 μmol TE /g FW. The CUPRAC values for the blueberry varieties were within
20.37-44.58 μmol TE/g. The ability of analyzed extracts to reduce cupric ion (Cu2+
) is shown in
Table 4 and 5.
Oxygen radical absorbance capacity (ORAC) assay
The ORAC values for chokeberry extracts ranged from 35.3 to 42.3 μmol Trolox/ g FW
and for blueberry extracts the values obtained were not significantly different among samples,
ranging from 34.85 to 38.49 μmol TE/g FW.
Hydrogen peroxide scavenging activity (HPS)
AmV, AmN, AmA and Ap exhibited 61.9, 83.6, 53.3 and 65.0 μmol/g FW H2O2
scavenging activity (Table 4). AmN cultivar was an effective scavenger toward H2O2 and AmV
cultivar had the lowest inhibition of H2O2. The values obtained for blueberry were between
25.30-44.37 μmol TE/g
Page 18
PhD Thesis Abstract
XVIII
Table 4
Antioxidant capacity of selected chokeberry cultivars, measured by different complementary assays. Details in Materials and methods.
Table 4
Activitatea antioxidantă a extractelor din fructe de aronia, prin patru metode complementare
Chokeberry cultivar ABTSa FRAP
b CUPRAC
c ORAC
a HPS
a WA
d Rank
Ap 167.6 ± 6.2a 300.2 ± 10.6
b 232.3 ± 14.2
a 42.3 ± 2.0
a 65.0 ± 2.6
b 1.10 2
AmA 95.9 ± 7.3b 185 ± 8.6
c 177.8 ± 9.6
c 35.3 ± 1.7
c 53.3 ± 1.5
c 0.79 4
AmN 180.5 ± 8.1a 341.9 ± 14.2
a 203.8 ± 8.7
b 37.1 ± 1.3
b 83.6 ± 3.2
a 1.15 1
AmV 171.7 ± 6.8a
206.2 ± 9.4c 158.8 ± 8.3
d 41.7 ±1.2
a 61.9 ± 1.9
b 0.94 3
Average capacity 153.9 258.4 193.2 39.2 66.0
Notes: means with different letters in the same column are statistically significant at P≤ 0.05 a Expressed in TE (μmol /g FW)
b Expressed in Fe
2+, (μmol Fe
2+/g FW)
c Expressed in Cu
2+, (μmol Cu
2+/g)
cWA-Weighted average calculation see Results and Discussions section
Page 19
PhD Thesis Abstract
XIX
Table 5
Antioxidant activity for blueberry fruits, using four different complementary assays
(FRAP, ABTS, ORAC)
Tabel 5
Activitatea antioxidantă a extractelor din fructe de afine, prin patru metode
complementare (FRAP, ABTS, ORAC)
FRAP
μM Fe2+/g
ABTS
TEμmol /g
ORAC
TE μmol/g
Vaccinium corymbosum
Elliot
Bluecrop
Duke
50.74 ± 1.9c
60.39 ± 1.6b
33.03 ± 2.54d
36.46 ± 4.26c
37.96 ± 2.98bc
24.33 ± 3.76d
38.05±1.56a
37.04 ± 1.7a
34.85 ± 1.3b
Vaccinium myrtillus
Wild 1
Wild 2
73.71 ± 3.2a
64.87 ± 2.9b
56.65 ± 3.79a
43.08 ± 2.3b
38.49± 1.01a
37.78± 0.89a
CONCLUSIONS
A comparative evaluation of the metabolic profile considering the phytochemical
content of different cultivars of Aronia melanocarpa and Vaccinium sp berries was
performed. Five blueberry and four chokeberry varieties purchased from local Romanian
farmers were analyzed by reverse phase HPLC for identification and the quantification of
anthocyanins
The results obtained can be summarized as follows:
1. The HPLC analysis showed that Aronia melanocarpa ‘Nero’cultivar extract
was the richest one in phenolics, flavonoids and anthocyanins. Cyanidin
glycosides were the major anthocyanin derivatives identified in chokeberry
especially the 3-O-galactoside and 3-O-arabinoside.
2. For blueberry extracts the highest values regarding total phenolics, flavonoids
and anthocyanins were obtained for Wild 1 sample. The most representative
anthocyanidins in Vaccinium myrtillus were delphinidin and petunidin while in
Vaccinium corymbosum, delphinidin and malvidin.
3. The total phenolics concentration found in chokeberry extracts varied from
1586.5 to 2059.5 mg/g fresh weight (expressed in equivalents of gallic acid).
For blueberry the lowest phenolic content was found in Duke variety, while
highest phenolic content in Wild 1.
4. The antioxidant capacity of analyzed extracts (as determined by five,
complementary assays (ABTS, HPS, ORAC, FRAP, CUPRAC) was positively
Page 20
PhD Thesis Abstract
XX
correlated with the anthocyanin content. The highest Pearson’s coefficient for
bluebery extracts analysed was obtained when it has been compared ABTS and
CUPRAC antioxidant methods (0.96) while for the chokeberry samples
analyzed the Pearson’s correlation coefficient (r) showed a high correlation
between antioxidant activity determined by HPS assay versus total anthocyanin
(0.97). The highest antioxidant capacity was obtained for Aronia melanocarpa
‘Nero’cultivar and also high level of antioxidant activity obtained for Wild 1
blueberries, by all the methods.
As a final conclusion, our study demonstrates that the fruits of chokeberry and
blueberry (cultivated and wild) commonly consumed in Romania are a good source of
anthocyanins. The wild blueberries contain a higher amount of anthocyanins than
cultivated ones.
Aslo this is the first study regarding chemical composition and chemoprotective
effects of anthocyanin-rich fractions obtained from Aronia melanocarpa cultivated in
Romania.
Page 21
PhD Thesis Abstract
XXI
CHAPTER II.
PURITY EVALUATION OF ANTHOCYANIN RICH-FRACTIONS OBTAINED
FROM CHOKEBERRIES AND BLUEBERRIES USING DIFFERENT SOLID
PHASE EXTRACTION METHODS
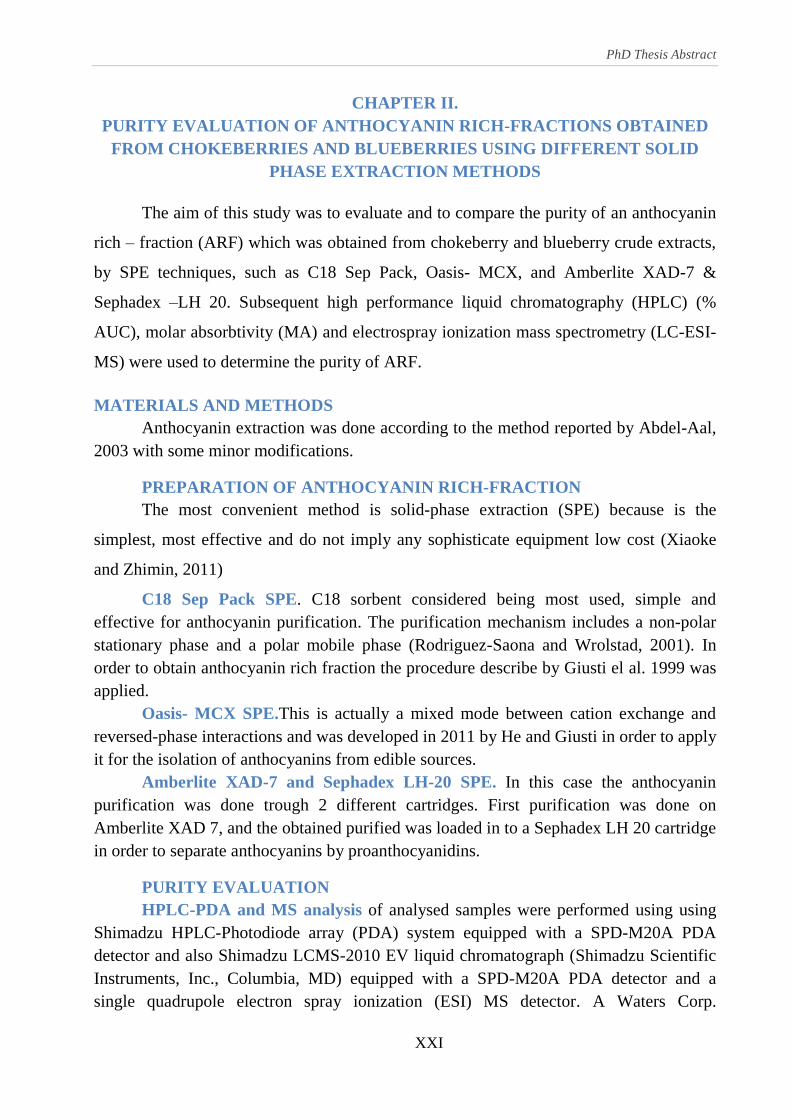
The aim of this study was to evaluate and to compare the purity of an anthocyanin
rich – fraction (ARF) which was obtained from chokeberry and blueberry crude extracts,
by SPE techniques, such as C18 Sep Pack, Oasis- MCX, and Amberlite XAD-7 &
Sephadex –LH 20. Subsequent high performance liquid chromatography (HPLC) (%
AUC), molar absorbtivity (MA) and electrospray ionization mass spectrometry (LC-ESI-
MS) were used to determine the purity of ARF.
MATERIALS AND METHODS
Anthocyanin extraction was done according to the method reported by Abdel-Aal,
2003 with some minor modifications.
PREPARATION OF ANTHOCYANIN RICH-FRACTION
The most convenient method is solid-phase extraction (SPE) because is the
simplest, most effective and do not imply any sophisticate equipment low cost (Xiaoke
and Zhimin, 2011)
C18 Sep Pack SPE. C18 sorbent considered being most used, simple and
effective for anthocyanin purification. The purification mechanism includes a non-polar
stationary phase and a polar mobile phase (Rodriguez-Saona and Wrolstad, 2001). In
order to obtain anthocyanin rich fraction the procedure describe by Giusti el al. 1999 was
applied.
Oasis- MCX SPE.This is actually a mixed mode between cation exchange and
reversed-phase interactions and was developed in 2011 by He and Giusti in order to apply
it for the isolation of anthocyanins from edible sources.
Amberlite XAD-7 and Sephadex LH-20 SPE. In this case the anthocyanin
purification was done trough 2 different cartridges. First purification was done on
Amberlite XAD 7, and the obtained purified was loaded in to a Sephadex LH 20 cartridge
in order to separate anthocyanins by proanthocyanidins.
PURITY EVALUATION
HPLC-PDA and MS analysis of analysed samples were performed using using
Shimadzu HPLC-Photodiode array (PDA) system equipped with a SPD-M20A PDA
detector and also Shimadzu LCMS-2010 EV liquid chromatograph (Shimadzu Scientific
Instruments, Inc., Columbia, MD) equipped with a SPD-M20A PDA detector and a
single quadrupole electron spray ionization (ESI) MS detector. A Waters Corp.
Page 22
PhD Thesis Abstract
XXII
Symmetry® C18 column (3.5µm, 4.6×150mm; Milford, MA) was used for anthocyanins
separation. The mobile phase was solvent A: 4.5% formic acid in LC/MS grade water,
mobile phase B: LC/MS grade acetonitrile.
Molar absorptivity. In order to confirm the anthocyanins purity calculated using
HPLC-PDA data we also evaluate the purity based on molar absorptivity. Anthocyanins
purity was calculated according Lambert-Beer’s law using cyanidin 3 glucoside
extinction factor. Dilutions were prepared in triplicate.
(Experimental conc./actual conc.)*100)
RESULTS AND DISCUSSIONS
Purity evaluation by HPLC-PDA
Four sorbents commonly were used for anthocyanin purification. The highest
purity calculated by % AUC for chokeberry was found fo be obtained using Oasis MCX
(97.7%±2.0) followed by C18 cartridges (93.3% ±2.8), while the lowest value was
obtained for Amberlite XAD-7& Sephadex LH-20 (82.6%±4.3).
For blueberry anthocyanin rich fraction analyzed, the calculated purity using those
three sorbents were in the range of 99.9% ± 1.9 -75.90% ±4.8. Figure 44 and 45 provides
a visual representation of the calculation of purity by % AUC for anthocyanin rich
fraction obtained from chokeberry and blueberry.
Fig. 4. Purity evaluation by HPLC-PDA of chokeberry (A) and blueberry (B) ARFs using
three different SPE methods: C18, Oasis MXC, Amberlite XAD-7& Sephadex LH-20
Fig. 4. Evaluarea purităţii prin metoda HPLC-PDA a antocianilor obţinuti din aronia (A)
şi afine (B) utilizând trei metode SPE: C18, Oasis MCX, Amberlite XAD-7&Sephadex
LH20
Page 23
PhD Thesis Abstract
XXIII
A B
Fig. 5. HPLC-PDA max-plot of purified chokeberry(A) and (B) extracts using three different SPE methods: C18, Oasis MXC,
Amberlite XAD-7& Sephadex LH-20
Fig 44. Cromatogramele HPLC-PDA max-plot ale extractelor obţinute din Aronia (A) şi afine (B), utilizând trei metode SPE:
C18, Oasis MCX, Amberlite XAD-7& Sephadex LH-20
Page 24
PhD Thesis Abstract
XXIV
Purity evaluation by molar absorptivity
Molar absorptivity is a spectrophotometric method used for the purity calculation
by Lambert-Beer’s law.
The highest purity achieved using molar absorptivity analysis for chokeberry ARF
was through MCX cartidges for about 79.18 %, comparing to Amberlite XAD-7 &
Sephadex LH-20 (63.39 %) and C-18 Sep Pack sorbents (72.46%). The calculated purity
values by molar absorptivity for blueberry extracts was found to be higher using Oasis
MCX (78.2%) than C18 cartridges and Amberlite XAD-7 & Sephadex LH-20 (68.3%,
59.8%) (Fig. 6).
The purity data values calculated with this method was lower than values reported
previously, calculated by HPLC.
Fig. 6. Purity evaluation of chokebery (A) and bluebery (B) ARFs by molar absorptivity,
using three different SPE methods: C18, Oasis MXC, Amberlite XAD-7& Sephadex LH-
20
Fig 6. Evaluarea purităţii prin metoda absorptivităţii molare a antocianilor obtinuţi din
aronia (A) şi afine (B) utilizând trei metode SPE: C18, Oasis MCX şi Amberlite XAD-
7& Sephadex LH-20
SPE methods comparison
High-purity (>97%) was achieved for all purified blueberry and chokeberry
anthocyanin mixtures trough Oasis MCX SPE cartridge. The comparison of the
efficiency of the separation procedures was based on sorbent capacity to remove
unwanted compounds.
Purity determination methods comparison
The values for purities evaluation by HPLC-PDA and molar absorptivity are
significant different. The purities values calculated by HPLC –PDA (% AUC) as we
mention before were higher. The calculation of this can be affected by sensitivity of the
Page 25
PhD Thesis Abstract
XXV
detector. In order to evaluate and for a better understanding of difference between those
two methods used for purity calculation further analysis are required.
Confirmation of purity with HPLC-MS analysis
To this method we cannot quantified the purity based on intensity of the signal,
but we can clearly observed the profile or the shapes of the analyzed compounds
comparing to peaks impurities. Figure 6 shows the total ion concentration recorded by a
MS detector for chokeberry and blueberry extracts purified.
Page 26
PhD Thesis Abstract
XXVI
A B
Fig. 7. Impurities recorded in chokeberry (A) and blueberry (B) ARF by the appearance of noise peaks in the MS
chromatogram using three different SPE methods: C18, Oasis MXC, Amberlite&Sephadex
Fig. 7. Impurităţile ȋnregistrate şi evidenţiate prin zgomotul peak-urilor ȋn cromatograma MS pentru fracţiile bogate ȋn
antociani obţinute din aronia (A) şi afine (B) utilizând trei metode SPE: C18, Oasis MCX, Amberlite XAD-7& Sephadex LH-20
Page 27
PhD Thesis Abstract
XXVII
CONCLUSIONS
There were applied three different SPE methods (C18, Oasis-MCX and Amberlite
XAD 7&Sephadex LH 120 sorbents) to purify the anthocyanin extract from chokebery
and blueberry.
The Oasis MCX was found to have the higher efficacy than the others SPE
methods used for obtaining anthocyanin rich fractions. This fact is related to the
adsorption and desorption of anthocyanins on the MCX sorbent which is determined by
the pH dependent electric charge. The positively charged anthocyanin molecules interact
with strong MCX cation-exchange sorbent, while most other compounds without positive
charges could be easily removed.
For evaluation of ARFs purity by HPLC and molar absorptivity assay, the values
obtained were different depending on the method used. The values obtained by HPLC for
chockebery extracts were range between 97.7%±2.0 (Oasis MCX) and 82.6%±4.3
(Amberlite XAD-7& Sephadex LH-20) while for blueberry extracts the obtained values
were the range of 99.9% ± 1.9 -75.90% ±4.8 (Oasis MCX, Amberlite XAD-7& Sephadex
LH-20 respectily). However the purity calculated by molar absorptivity were found to be
lower. The highest purity achieved using molar absorptivity analysis for chokeberry
ARFs was through MCX cartidges for about 79.18 %, comparing to Amberlite XAD-7 &
Sephadex LH-20 (63.39 %). For bluebery extracts the results were similar, the highest
purity being obtained for Oasis MCX sorbent. Accurate balances clean and dry
containers, properly functioning desiccators, large enough sample, sample evaporated to
complete dryness, contamination by compounds that do not absorb in the visible range
are only few fact which can affect all those calculation.
Page 28
PhD Thesis Abstract
XXVIII
CHAPTER III.
CHEMOPROTECTIVE EFFECTS OF AN ANTHOCYANIN-RICH
FRACTION FROM ARONIA PRUNIFOLIA ON B16-F10 MELANOMA
MURINE AND HELA TUMOR CERVICAL CELL LINES
This study evaluate the cytotoxic action and the prooxidative effect of the
anthocyanin fraction on HeLa, respectively B16-F10 cell lines.
MATERIALS AND METHODS
Extraction preparation of anthocyanin-rich fraction. The anthocyanins extract was
obtained by homogenization of chokeberries (5 g) in methanol containing HCl (0.3%) using an
ultraturax (Miccra D-9 KT Digitronic, Germany). Extracts obtained were concentrated at 35˚C
under reduced pressure (Rotavapor R-124, Buchi, Switzerland) in order to remove methanol.
The remaining aqueous extract was loaded into Sep-pak C18 (5ml, 1g sorbent) Waters Corp.
Milford. MA) SPE cartridge. Purification conditions were done according to procedure described
by Giusti et al., 1999.
HPLC – PDA analysis HPLC analyses. Were performed on a Shimadzu, equipped with a
diode-array detector (DAD) using a Luna Phenomenex C-18 column (5µm, 25 cm x 4.6 mm)
The mobile phase consisted in: solvent A - formic acid (4.5%) in bidistilled water and solvent B -
acetonitrile. The gradient elution system was: 10% B, 0-9 min; 12% B, 9-17 min; 25% B 17-30
min; 90% B, 30-50 min; 10% B, 50-55 min.
Cell culture. Human tumor cervical HeLa cell line was maintained in Dulbecco’s
Modified Eagle Medium (DMEM) containing 1g/L glucose supplemented with 10% fetal
bovine serum, 1 mM glutamine, 1% gentamicin, 1% non-essential aminoacids at 37◦C,
5% CO2, and 95% relative humidity. For B16F10 murine melanoma cells the grow media
was consistent in Dulbecco’s Modified Eagle Medium (DMEM) containing 1g/L, fetal
bovine serum to a final concentration of 10%, 1 mM glutamine, 1% penicilin,
streptomicin at 37◦C, 5% CO2, and 95% relative humidity. Cells were plated on 96-well
microplates and allowed to attach for 24h, as follow 5 x 10³ cells/ well for HeLa cell line
and 8 x 10³ cells/ well for B16F10 cell line. The culture medium was then replaced with
complete medium containing different concentrations from 0 to 250 μg/ml anthocyanins
for HeLa and 0 to 600 μg/ mL for B16F10 cell lines.
Cellular proliferation after anthocyanin rich fraction extract treatment was evaluated
using MTT assay.
Intracellular reactive species assay. The determination of intracellular ROS uses the
fluorescent probe 2’, 7’- dichlorodihydrofluorescein diacetate (DCF-DA) which is cell
membrane permeable and it is hydrolyzed by cellular esterases to DCF (2’, 7’
dichlorofluorescein).
RESULTS AND DISCUSSION
HPLC – DAD analysis. After each purification the obtained anthocyanin rich-fraction
was dissolved in a know amount of sterile water, filtered through 0.45μm and analyzed by
Page 29
PhD Thesis Abstract
XXIX
HPLC-DAD. The stock solution obtained was diluted with grow media in range 250-800 μg/
mL.the chromatogram of obtained extract is showed in Fig. 7.
Fig. 8. HPLC chromatogram of purified chokebery extract
Fig. 8. Cromatograma HPLC a extractului purificat din aronia
Inhibition of B16F10 and HeLa tumor cells survival
Cell viability is expressed as mean percentage of control (100%). The C-ARF
treatment with anthocyanin-rich fraction inhibited the proliferation of HeLa cells by 40%
at a concentration, expresses as cyanidin 3-O-galactoside equivalents ,of 200 μg/mL after
48 h (Fig. 9A), respective of B16F10 cellsby 51% , at the dose of 400 μg/mL (Fig. 9B).
Also the morphology of the cells is affected and can be observed in figure 10.
Fig. 9. Results of MTT proliferation assay (proliferation %) of human cervical cancer
HeLa (A) and of B16-F10 (B) metastatic murine melanoma cells -treated cells by C-ARF
Page 30
PhD Thesis Abstract
XXX
Fig. 9. Rezultatele testului MTT de proliferare (proliferare%) pentru linia umană de
cancer cervical HeLa (A) şi pentru linia B16-F10 (B) melanom metastatic dupa
tratamentul cu C-ARF
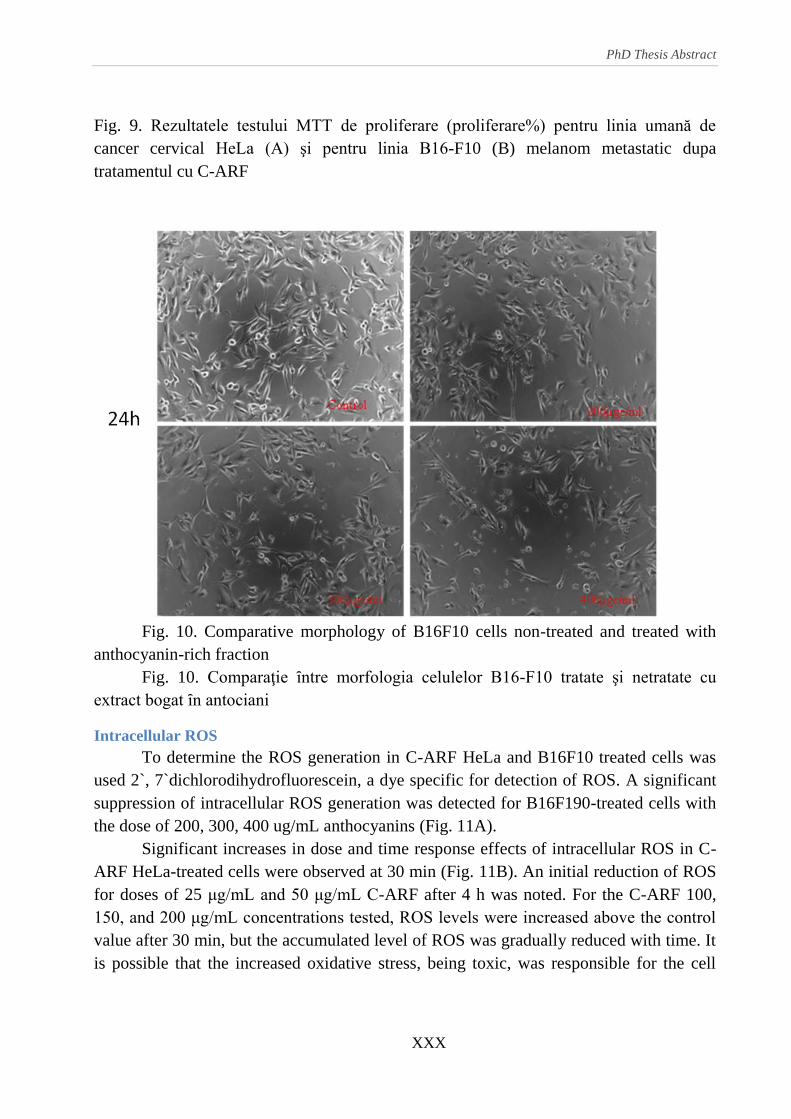
Fig. 10. Comparative morphology of B16F10 cells non-treated and treated with
anthocyanin-rich fraction
Fig. 10. Comparaţie ȋntre morfologia celulelor B16-F10 tratate şi netratate cu
extract bogat ȋn antociani
Intracellular ROS
To determine the ROS generation in C-ARF HeLa and B16F10 treated cells was
used 2`, 7`dichlorodihydrofluorescein, a dye specific for detection of ROS. A significant
suppression of intracellular ROS generation was detected for B16F190-treated cells with
the dose of 200, 300, 400 ug/mL anthocyanins (Fig. 11A).
Significant increases in dose and time response effects of intracellular ROS in C-
ARF HeLa-treated cells were observed at 30 min (Fig. 11B). An initial reduction of ROS
for doses of 25 μg/mL and 50 μg/mL C-ARF after 4 h was noted. For the C-ARF 100,
150, and 200 μg/mL concentrations tested, ROS levels were increased above the control
value after 30 min, but the accumulated level of ROS was gradually reduced with time. It
is possible that the increased oxidative stress, being toxic, was responsible for the cell
Page 31
PhD Thesis Abstract
XXXI
death.
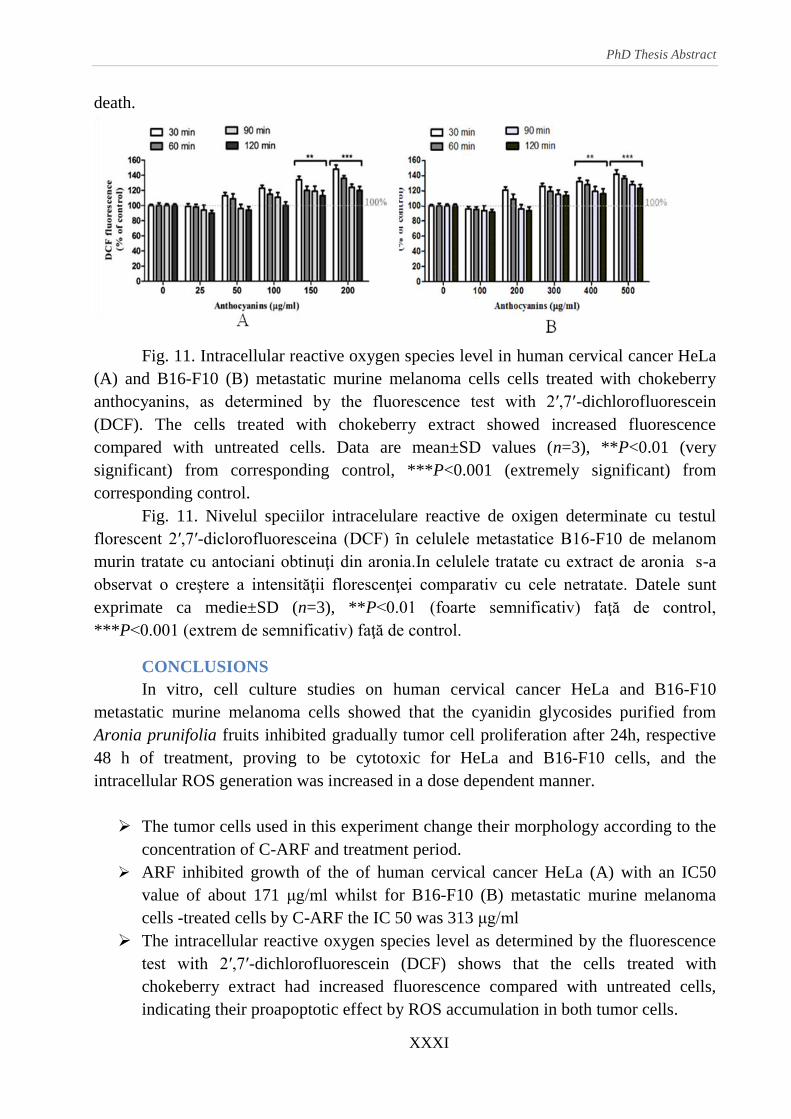
Fig. 11. Intracellular reactive oxygen species level in human cervical cancer HeLa
(A) and B16-F10 (B) metastatic murine melanoma cells cells treated with chokeberry
anthocyanins, as determined by the fluorescence test with 2′,7′-dichlorofluorescein
(DCF). The cells treated with chokeberry extract showed increased fluorescence
compared with untreated cells. Data are mean±SD values (n=3), **P<0.01 (very
significant) from corresponding control, ***P<0.001 (extremely significant) from
corresponding control.
Fig. 11. Nivelul speciilor intracelulare reactive de oxigen determinate cu testul
florescent 2′,7′-diclorofluoresceina (DCF) ȋn celulele metastatice B16-F10 de melanom
murin tratate cu antociani obtinuţi din aronia.In celulele tratate cu extract de aronia s-a
observat o creştere a intensităţii florescenţei comparativ cu cele netratate. Datele sunt
exprimate ca medie±SD (n=3), **P<0.01 (foarte semnificativ) faţă de control,
***P<0.001 (extrem de semnificativ) faţă de control.
CONCLUSIONS
In vitro, cell culture studies on human cervical cancer HeLa and B16-F10
metastatic murine melanoma cells showed that the cyanidin glycosides purified from
Aronia prunifolia fruits inhibited gradually tumor cell proliferation after 24h, respective
48 h of treatment, proving to be cytotoxic for HeLa and B16-F10 cells, and the
intracellular ROS generation was increased in a dose dependent manner.
The tumor cells used in this experiment change their morphology according to the
concentration of C-ARF and treatment period.
ARF inhibited growth of the of human cervical cancer HeLa (A) with an IC50
value of about 171 μg/ml whilst for B16-F10 (B) metastatic murine melanoma
cells -treated cells by C-ARF the IC 50 was 313 μg/ml
The intracellular reactive oxygen species level as determined by the fluorescence
test with 2′,7′-dichlorofluorescein (DCF) shows that the cells treated with
chokeberry extract had increased fluorescence compared with untreated cells,
indicating their proapoptotic effect by ROS accumulation in both tumor cells.
Page 32
PhD Thesis Abstract
XXXII
The effects were significantly higher when 150 or 300 ug/ml anthocyainin fraction
was applied on HeLa and B16-F10 cells, respectively.
The anthocyanins in chokeberries could have a health benefit, acting as antitumor
agents, so these fruits can be recommended for daily consumption.
Page 33
PhD Thesis Abstract
XXXIII
CHAPTER IV.
ANTHOCYANINS DETERMINATION IN VARIOUS CULTIVARS
OF HIGHBUSH BLUEBERRIES AND THEIR ANTIPROLIFERATION
AND APOPTOSIS PROPERTIES IN B16-F10 METASTATIC MURINE
MELANOMA CELLS
The main aim of this study was to investigate the potential of blueberry
anthocyanins for their protective effect against melanoma cancer cells. Therefore, the
objectives of this study were to quantify and identify individual anthocyanins in different
Romanian blueberry varieties and to evaluate their antioxidant potential, in order to select
the richest anthocyanin fraction with the highest antioxidant activity and to test it for its
ability to inhibit the proliferation and to stimulate apoptosis in B16-F10 metastatic
murine melanoma cell line.
MATERIALS AND METHODS
Preparation of anthocyanin fraction.
Seven cultivars of highbush blueberries Bluegold, Nui, Darrow, Legacy, Nelson,
Hannah’s Choice and Toro were used in order to obtain anthocyanin extract. Blueberries
(1 g) were homogenizated whit acidified methanol (0.3 % HCl (v/v)) using the
ultraturax (Miccra D-9 KT Digitronic, Germany), then stored at 4 ºC in dark for 24 h. The
extract obtained was filtered through multiple layers of cotton, then concentrated by
rotary evaporation at 35˚C to remove methanol. The extract containing anthocyanin and
non-anthocyanin compounds was subject to partition procedure using ethyl acetate, for
the less polar compounds removal. The remaining aqueous fraction was then applied to
an Amberlite XAD-7 column (1 x 0.5 cm) chromatography and the obtained purified was
also further purified on a Sephadex LH-20 column (2.5 x 0.5 cm).
HPLC-DAD analysis of anthocyanins analyses were performed on a Shimadzu,
equipped with a diode-array detector (DAD) using a Luna Phenomenex C-18 column (5µm, 25
cm x 4.6 mm) The mobile phase consisted in: solvent A - formic acid (4.5%) in bidistilled water
and solvent B - acetonitrile. The gradient elution system was: 10% B, 0-9 min; 12% B, 9-17 min;
25% B 17-30 min; 90% B, 30-50 min; 10% B, 50-55 min.
HPLC-ESI-MS analysis of anthocyanins. Samples were analyzed on an Agilent
Technologies 1200 HPLC system (Chelmsford, MA, USA) equipped with G1311A Quaternary
Pump, G1322A degasser, G1329A autosampler, G1315D photo-diode array (PDA) detector and
Quadrupole 6110 mass spectrometer (Agilent Technologies, Chelmsford, MA, USA) equipped
with an ESI probe. The mobile phase was composed of solvent A – (1 % formic acid in
bidistilled water) and solvent B – (acetonitrile). The percent of B increased to 12 % at 17
min and continued up to 25 % B at min 30. Between 30 and 50 % B the percentage of B
was 90 %.
Page 34
PhD Thesis Abstract
XXXIV
Cupric reducing antioxidant capacity (CUPRAC) assay
The cupric ion reducing antioxidant capacity of blueberries was determined according to
the method of (Apak et al., 2007). The absorbance was recorded using the
spectrophotometer (JASCO V-630 series, International Co., Ltd., Japan) at 450 nm
against the blank reagent. A standard curve was prepared using different Trolox
concentrations and the results were expressed as μmol Trolox per gram fresh weight (fr.
wt).
Scavenging effect on ABTS radical
The scavenging ability of blueberry extracts against radical anion ABTS.+
was
determined in 96-well plates according to procedure described by Arnao et al. (2001).
Results were expressed as μmol Trolox/ g FW.
Oxygen radical absorbance capacity (ORAC) assay
The antioxidant capacity was measured and calculated by the oxygen radical absorbance
capacity assay, as described previously (Huang et al., 2005). ORAC values were
expressed as μmol Trolox /g fruit fr. wt.
Cell and cell culture
The B16-F10 metastatic murine melanoma cell line was obtained from American Type
Culture Collection (Rockville, MD, USA). B16-F10 cells were grown in DMEM
containing 1g/ l glucose, supplemented with 10 % FBS, 2 mM glutamine, 1 % penicillin
and streptomicin, 0.1 % amphotericin. Cells were cultured in a humidified, 5 % CO2
atmosphere at 37◦C. For microscopic analysis, cells were grown on coverslides
Analysis of cell proliferation
Cell proliferation assay was done using MTT reagent. The results were expressed as percent
survival relative to an untreated control.
Detection of LDH activity
Damage of the plasma membrane was evaluated in B16-F10 cells by measuring LDH
leakage. Absorbance values measured at 490 nm, using the BioTek Synergy HT
microplate reader (BioTek Instruments Inc., USA) were translated into LDH leakage
percents relative to untreated B16-F10 cells.
96-well-based EB/AO staining
In order to assess the apoptotic index and the cell membrane integrity, the acridine orange
(AO)/ ethidium bromide (EB) staining was performed. Early apoptotic cells have bright
green nucleus with condensed or fragmented chromatin and the late apoptotic cells
nucleus with condensed and fragmented chromatin appears orange. The cells that have
died from necrosis have a red nucleus (Ribble et al., 2005).
Page 35
PhD Thesis Abstract
XXXV
TUNEL assay and analysis
Prior to confocal microscopy TUNEL assay the adherent cells B16-F10 were fixed
with 4 % paraformaldehyde for 15 min. The slides were processed for a TUNEL assay
using an ApopTag® Red In Situ Apoptosis Detection Kit (Chemicon, Millipore, USA)
according to the manufacturer's instructions. Nuclei were counterstained with 5 mM
Draq5 diluted 1:1000 in distilled water for 5 min at room temperature. Fluorescent
images were acquired with a confocal laser scanning microscope (Zeiss LSM 710).
RESULTS AND DISCUSSIONS
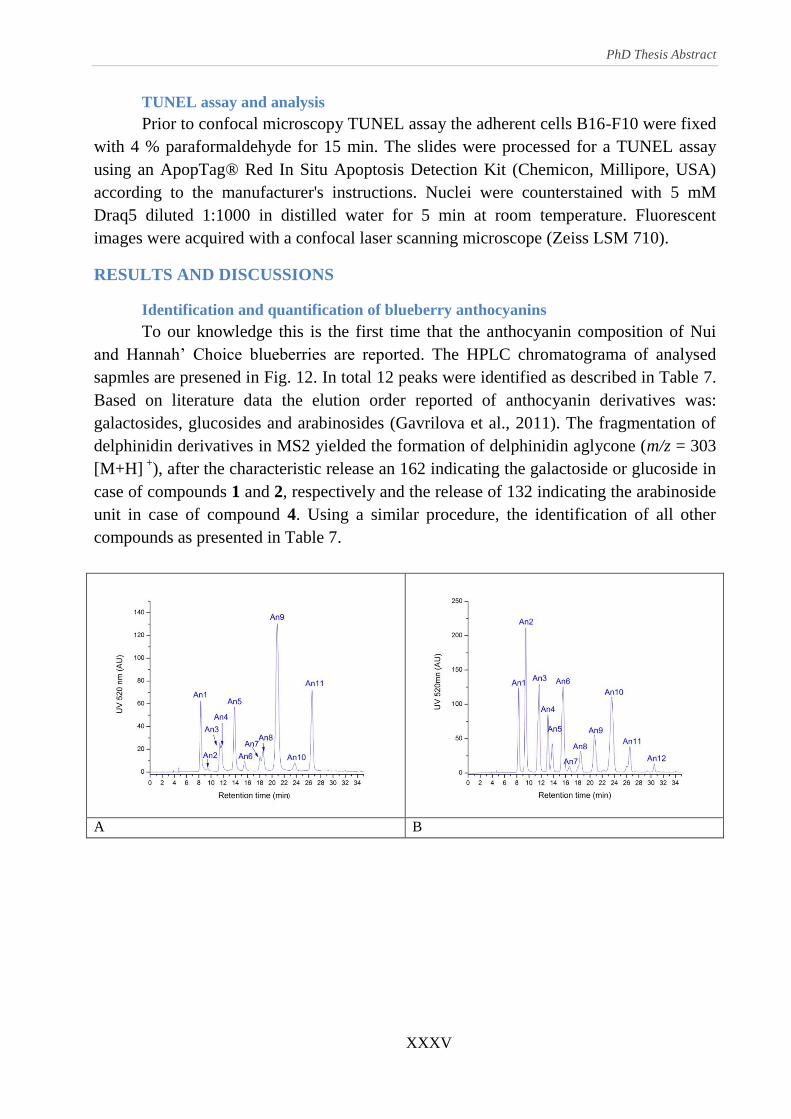
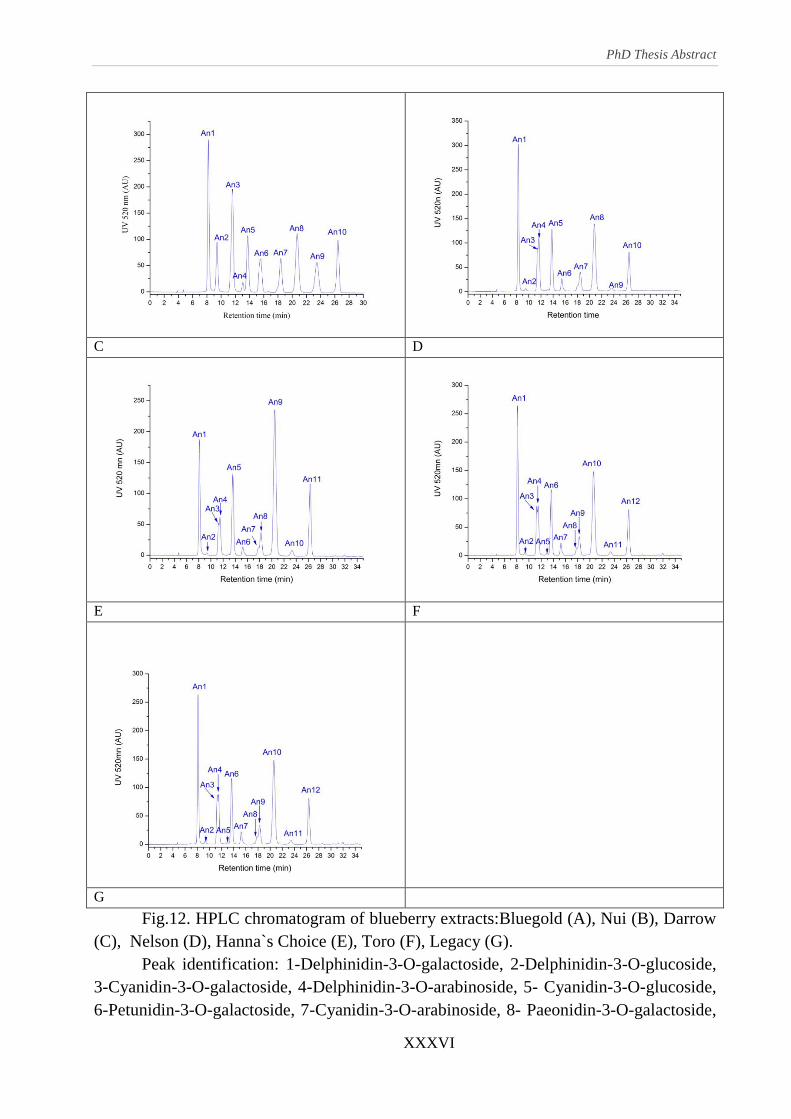
Identification and quantification of blueberry anthocyanins
To our knowledge this is the first time that the anthocyanin composition of Nui
and Hannah’ Choice blueberries are reported. The HPLC chromatograma of analysed
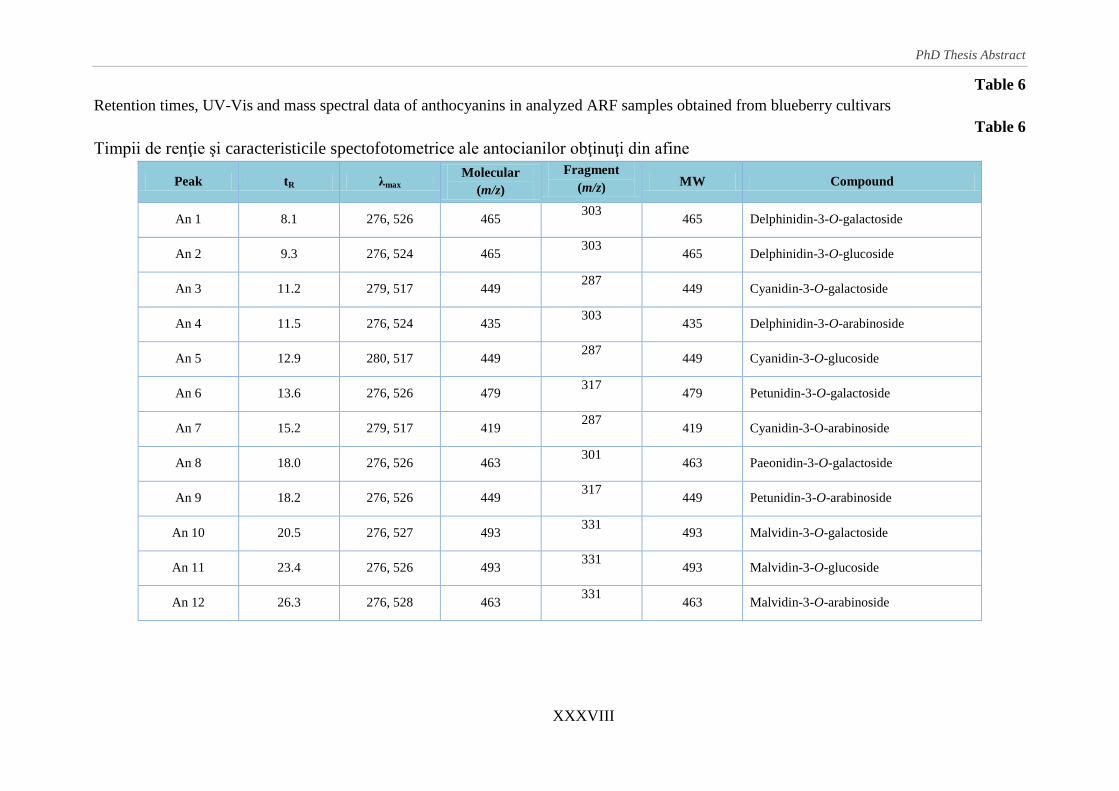
sapmles are presened in Fig. 12. In total 12 peaks were identified as described in Table 7.
Based on literature data the elution order reported of anthocyanin derivatives was:
galactosides, glucosides and arabinosides (Gavrilova et al., 2011). The fragmentation of
delphinidin derivatives in MS2 yielded the formation of delphinidin aglycone (m/z = 303
[M+H] +
), after the characteristic release an 162 indicating the galactoside or glucoside in
case of compounds 1 and 2, respectively and the release of 132 indicating the arabinoside
unit in case of compound 4. Using a similar procedure, the identification of all other
compounds as presented in Table 7.
A B
Page 36
PhD Thesis Abstract
XXXVI
C D
E F
G
Fig.12. HPLC chromatogram of blueberry extracts:Bluegold (A), Nui (B), Darrow
(C), Nelson (D), Hanna`s Choice (E), Toro (F), Legacy (G).
Peak identification: 1-Delphinidin-3-O-galactoside, 2-Delphinidin-3-O-glucoside,
3-Cyanidin-3-O-galactoside, 4-Delphinidin-3-O-arabinoside, 5- Cyanidin-3-O-glucoside,
6-Petunidin-3-O-galactoside, 7-Cyanidin-3-O-arabinoside, 8- Paeonidin-3-O-galactoside,
Page 37
PhD Thesis Abstract
XXXVII
9-Petunidin-3-O-arabinoside, 10-Malvidin-3-O-galactoside, 11- Malvidin-3-O-glucoside,
12-Malvidin-3-O-arabinoside
Fig. 12. Cromatogramele HPLC ale extractelor de afine Bluegold (A), Nui (B),
Darrow (C), Nelson (D), Hanna`s Choice (E), Toro (F), Legacy (G). Identificarea peak-
urilor: 1-Delfinidin-3-O-galactozid, 2-Delfinidin-3-O-glucozid, 3-Cianidin-3-O-
galactozid, 4-Delfinidin-3-O-arabinozid, 5- Cianidin-3-O-glucozid, 6-Petunidin-3-O-
galactozid, 7-Cianidin-3-O-arabinozid, 8- Paeonidin-3-O-galactozid, 9-Petunidin-3-O-
arabinozid, 10-Malvidin-3-O-galactozid, 11- Malvidin-3-O-glucozid, 12- Malvidin-3-O-
arabinozid
Data on the content of individual anthocyanins content in blueberry cultivars are
presented in Table 8. The highest anthocyanin content was found in Toro cultivar (195.01
mg/ 100g fr. wt), followed by Legacy, while the lowest amount was obtained in Bluegold
cultivar (101.88 mg/ 100g fr. wt). Delphinidin-3-O-galactoside (peak 1) was identified as
one of the major compounds in Toro cultivar and one of the minor compounds in
Bluegold cultivar, while malvidin-3-O-galactoside (peak 10) was identified as one of the
major compound in Toro, Bluegold, Legacy, Nelson cultivars and a minor compound in
Hannah’ Choice cultivar. Malvidin-3-O-galactoside was the major anthocyanin followed
by delphinidin-3-O-galactoside and petunidin-3-O-galactoside, which represent together
more than 56 % of all the anthocyanins.
Page 38
PhD Thesis Abstract
XXXVIII
Table 6
Retention times, UV-Vis and mass spectral data of anthocyanins in analyzed ARF samples obtained from blueberry cultivars
Table 6
Timpii de renţie şi caracteristicile spectofotometrice ale antocianilor obţinuţi din afine
Peak tR λmax Molecular
(m/z)
Fragment
(m/z) MW Compound
An 1 8.1 276, 526 465 303
465 Delphinidin-3-O-galactoside
An 2 9.3 276, 524 465 303
465 Delphinidin-3-O-glucoside
An 3 11.2 279, 517 449 287
449 Cyanidin-3-O-galactoside
An 4 11.5 276, 524 435 303
435 Delphinidin-3-O-arabinoside
An 5 12.9 280, 517 449 287
449 Cyanidin-3-O-glucoside
An 6 13.6 276, 526 479 317
479 Petunidin-3-O-galactoside
An 7 15.2 279, 517 419 287
419 Cyanidin-3-O-arabinoside
An 8 18.0 276, 526 463 301
463 Paeonidin-3-O-galactoside
An 9 18.2 276, 526 449 317
449 Petunidin-3-O-arabinoside
An 10 20.5 276, 527 493 331
493 Malvidin-3-O-galactoside
An 11 23.4 276, 526 493 331
493 Malvidin-3-O-glucoside
An 12 26.3 276, 528 463 331
463 Malvidin-3-O-arabinoside
Page 39
PhD Thesis Abstract
XXXIX
Table 7
The anthocyanin content in blueberries determined by HPLC-DAD.
Tabel 7
Antocianii din fructele de afine determinaţi prin metoda HPLC-DAD.
Peak
Compound
Vaccinium corymbosum L. (mg per 100 g FW
Bluegold Nui Darrow Legacy Nelson Hannah ’s
Choice Toro
Anthocyanins: Total 101.88 ± 2.36 150.27 ± 2.01 168.50 ± 2.95 189.26 ± 2.70 161.31 ± 4.66 147.12 ± 2.21 195.01 ± 2.65
An 1 Delphinidin-3-O-galactoside 9.51 ± 3.29e
12.50 ± 1.06e
29.55 ±1.10c
50.41 ± 6.27a
36.52 ± 1.48b
21.23 ±5.67d
35.57 ± 4.36b
An 2 Delphinidin-3-O-glucoside 3.64 ± 0.15de
23.76 ± 1.95a
14.05 ±1.58b
4.37 ± 0.35cd
3.65 ± 1.65de
3.00 ±0.87e
5.01 ± 0.17c
An 3 Cyanidin-3-O-galactoside 6.17 ± 0.01c
7.62 ± 1.77c
nd 19.00 ± 0.84a
11.64 ± 5.12b
7.29 ±0.77c
13.72 ± 1.45b
An 4 Delphinidin-3-O-arabinoside 5.61 ± 1.46e
12.78 ± 1.99cd
28.34 ±0.79a
19.32 ± 6.27b
17.47 ± 7.27bc
9.33 ±0.45de
14.79 ± 3.85bc
An 5 Cyanidin-3-O-glucoside 3.33 ± 0.18b
13.91 ± 5.68a
4.73 ±0.64b
3.53 ± 0.39b
3.17 ± 1.34b
2.65 ±0.32b
3.68 ± 0.50b
An 6 Petunidin-3-O-galactoside 10.78 ± 3.84d
7.22 ± 0.67d
20.52 ±9.84bc
25.28 ± 4.23ab
21.22 ± 7.58bc
19.94 ±5.43c
27.85 ± 3.43a
An 7 Cyanidin-3-O-arabinoside 4.68 ± 0.05e
21.78 ± 1.54a
13.78 ±0.19b
9.16 ± 1.28c
6.88 ± 3.07d
4.50 ±0.65e
6.09 ± 0.95de
An 8 Paeonidin-3-O-galactoside 4.92 ± 0.28bc
3.08 ± 0.47c
nd 5.14 ± 0.28ab
4.49 ± 2.15b
3.93 ±0.78bc
6.27 ± 0.30a
An 9 Petunidin-3-O-arabinoside 5.97 ± 1.33c
6.02 ± 0.89c
12.02 ±1.31b
10.31 ± 2.54bc
9.74 ± 3.55bc
48.73 ±8.99a
9.97 ± 1.73bc
An 10 Malvidin-3-O-galactoside 29.33± 12.69b
11.95 ± 2.21de
19.18 ± 6.14cd
25.66 ± 5.74bc
28.44 ± 4.91b
4.30 ±0.88e
48.33 ± 12.77a
An 11 Malvidin-3-O-glucoside 4.43 ± 0.56d
24.66 ± 3.63a
13.17 ± 2.76c
4.42± 0.17d
4.31 ± 1.80d
19.93 ±1.23b
5.21 ± 0.93d
An 12 Malvidin-3-O-arabinoside 13.53 ± 4.43b
5.01 ± 2.28c
13.15 ± 5.11b
12.67 ± 4.06b
13.78 ± 2.62b
2.29 ±0.56c
18.53 ± 1.86a
Data are expressed as mean ± SD, n=3. Different letters between columns denote statistically difference at p < 0.05 nd -not detected
Page 40
PhD Thesis Abstract
XL
Determination of antioxidant activity
The antioxidant activity of blueberry anthocyanin-rich extracts was determined
using the CUPRAC, ABTS and ORAC assays and expressed as Trolox equivalents (μmol
TE/ g fr. wt). The ability of blueberry ARF to reduce cupric ion (Cu2+
) is shown in Table
8.
CUPRAC values for the blueberry varieties were within the range of 134.76-
185.78 μmol TE/ g fr. wt and the highest antioxidant activity was obtained for the Toro
cultivar. Currently, there are no published data on the antioxidant activity of blueberries
extracts using the CUPRAC method.
The ABTS assay uses K2S2O8 as oxidant and measures the antioxidants ability to
scavenge the radical ABTS+˙ compared with Trolox, a vitamin E analogue. The blueberry
radical scavenging activity shown in Table 14 ranged from 6.05 to 11.96 μmol TE/ g fr.
Wt.
The ORAC assay measures the scavenging capacity of antioxidants against the
peroxyl radical. ORAC values for ARF samples varied from 21.2 to 34.5 μmol TE/ g fr.
wt among blueberry cultivars. The ARF-T received the highest antioxidant ORAC value.
Table 8
Antioxidant activity results obtained by complementary assays ABTS, CUPRAC and
ORAC on selected cultivar of blueberry.
Table 8
Rezultatele privind activitatea antioxidantă obţinută prin metodele complementare ABTS,
CUPRAC si ORAC pentru diferite cultivaruri de afine
Blueberry cultivar Antioxidant activity (μM TE/ g fr.wt)
CUPRAC ABTS ORAC
Bluegold 134.76 ± 53.03a
6.05 ± 1.34a
21.21 ± 3.26a
Nui 163.04 ± 23.45ab
7.91 ± 3.67b
22.35 ± 6.77b
Darrow 168.65 ± 30.33ab
8.43 ± 2.18b
25.43 ± 2.19b
Legacy 171.15 ± 46.49ab
8.73 ± 2.22b
28.99 ± 5.31c
Nelson 175.25 ± 69.06ab
9.12 ± 1.23bc
30.27 ± 4.74d
Hanna’s Choice 153.89 ± 57.12ab
7.68 ± 1.09bc
20.36± 2.23d
Toro 185.78 ± 92.06b
11.96 ± 3.45c
34.58± 3.25d
The data expressed as Mean ± SD. Different letters in each column denote statistical
difference at p < 0.05.
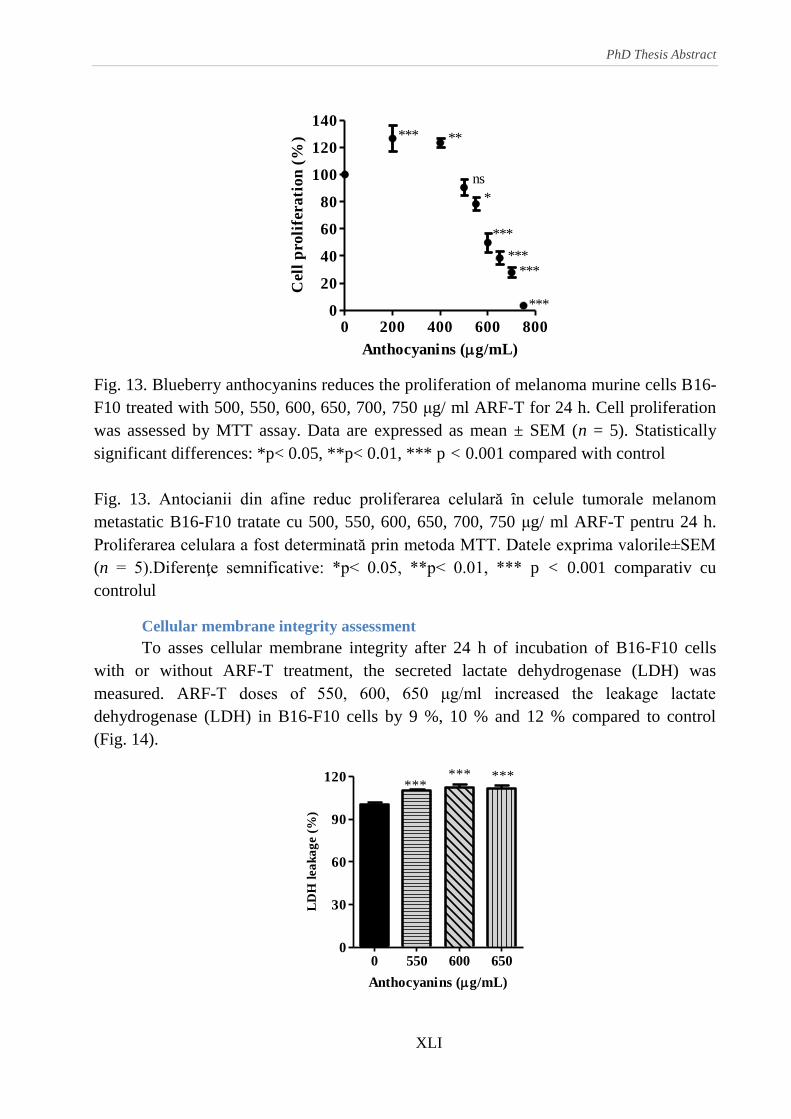
Inhibition of tumor cell proliferation
Blueberry anthocyanins inhibited the proliferation of B16-F10 cells in a dose
dependent manner. Treatment with 200 and 400 μg/ ml for 24 h stimulated the B16-F10
cell proliferation with 20 %. Treatment with 550, 600 and 650 μg/ ml ARF-T for 24 h
decreased with 16.5 %, 46.9 %, and 59.0 % respectively B16-F10 cell proliferation.
Higher concentrations than 650 μg/ ml decreased cell proliferation by more than 70 %.
The calculated IC50 value was 615.2 μg/ ml and was obtained from the dose–response
curve shown in Fig.13.
Page 41
PhD Thesis Abstract
XLI
0 200 400 600 8000
20
40
60
80
100
120
140*** **
ns
*
***
******
***
Anthocyanins (g/mL)
Cel
l p
roli
fera
tio
n (
%)
Fig. 13. Blueberry anthocyanins reduces the proliferation of melanoma murine cells B16-
F10 treated with 500, 550, 600, 650, 700, 750 μg/ ml ARF-T for 24 h. Cell proliferation
was assessed by MTT assay. Data are expressed as mean ± SEM (n = 5). Statistically
significant differences: *p< 0.05, **p< 0.01, *** p < 0.001 compared with control
Fig. 13. Antocianii din afine reduc proliferarea celulară ȋn celule tumorale melanom
metastatic B16-F10 tratate cu 500, 550, 600, 650, 700, 750 μg/ ml ARF-T pentru 24 h.
Proliferarea celulara a fost determinată prin metoda MTT. Datele exprima valorile±SEM
(n = 5).Diferenţe semnificative: *p< 0.05, **p< 0.01, *** p < 0.001 comparativ cu
controlul
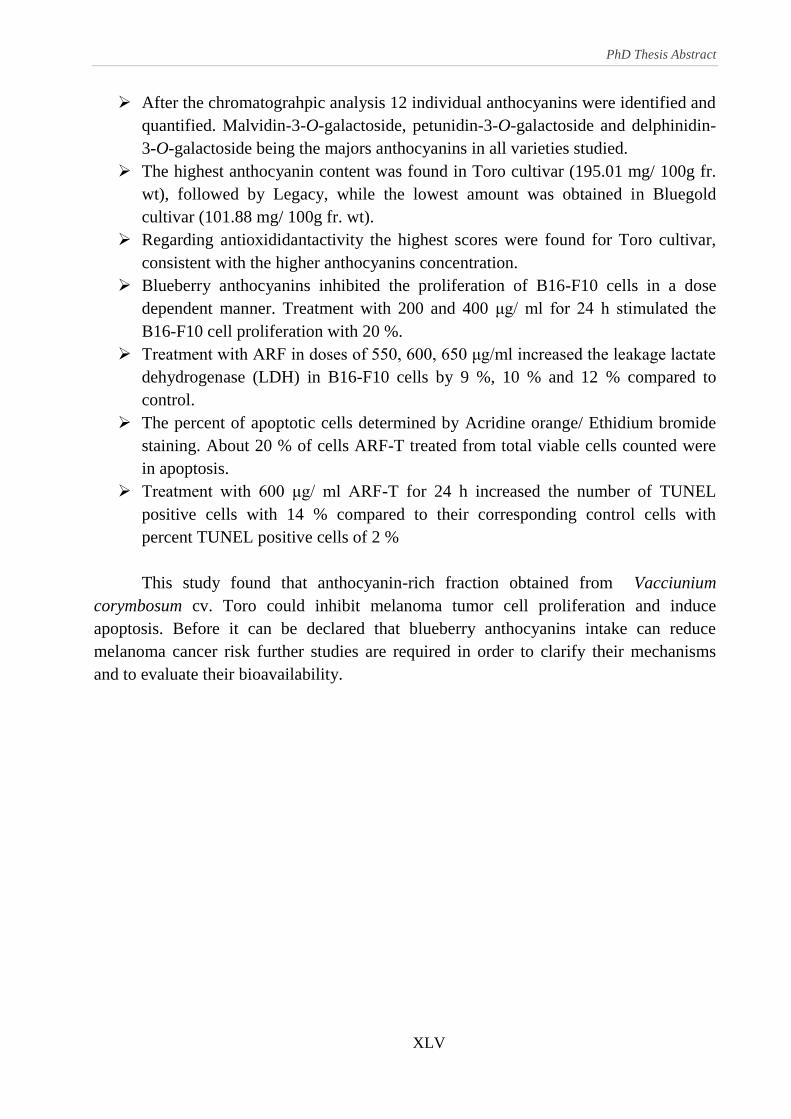
Cellular membrane integrity assessment
To asses cellular membrane integrity after 24 h of incubation of B16-F10 cells
with or without ARF-T treatment, the secreted lactate dehydrogenase (LDH) was
measured. ARF-T doses of 550, 600, 650 μg/ml increased the leakage lactate
dehydrogenase (LDH) in B16-F10 cells by 9 %, 10 % and 12 % compared to control
(Fig. 14).
0 550 600 6500
30
60
90
120***
*** ***
Anthocyanins (g/mL)
LD
H l
ea
ka
ge (
%)
Page 42
PhD Thesis Abstract
XLII
Fig.14. LDH leakage from B16-F10 melanoma murine cells after 24 h incubation with
the 550, 600, 650 μg/ ml ARF-T. Results are presented as mean ± SEM (n = 5).
Statistically significant differences: *p< 0.05, **p< 0.01, *** p < 0.001 compared with
control
Fig. 14. Eliberarea LDH din celulele B16-F10 de melanom murin dupa 24 h de incubare
cu 550, 600, 650 μg/ ml ARF-T. Pezultatele sunt prezentate ca medie ± SEM (n = 5).
Diferenţele statistic semnificative: *p< 0.05, **p< 0.01, *** p < 0.001 comparativ cu
controlul
Acridine orange/ Ethidium bromide staining
The cell membranes blebbing and the formation of the apoptotic bodies in B16-
F10 cells exposed to ARF-T treatment could be observed in Fig. 15A. About 20 % of
cells ARF-T treated from total viable cells counted were in apoptosis (Fig. 58B). The
decrease in observed cell proliferation is due to induction of apoptosis, being the major
mode of anthocyanin-induced cell death. About 18 % of cells counted were colored red,
which could be due to necrosis appearing after a time of sustained apoptosis. Our results
suggest that blueberry anthocyanins (600 μg/ ml) can induce apoptosis in B16-F10
melanoma murine cells after 24 h treatment (Fig. 15B).
Fig. 15. Effects of blueberry anthocyanins on B16-F10 murine melanoma cells
(A). Phase contrast microscopy on B16-F10 cells treated by ARF-T for 24 h. (B) 96-well-
based EB/AO staining without ARF-T treatment and after treatment of B16-F10 cells for
C
ontrol
T
reated
A
B
Page 43
PhD Thesis Abstract
XLIII
24 h with ARF-T. Cells were observed under inverted fluorescence microscope. The
white arrows indicate apoptotic cells (original magnification: × 40)
Fig. 15. Efectele antocianilor din afine asupra celulelor tumorale B16-F10 (A).
Microscopie ȋn contrast de fază pentru celulele B16-F10 tratate cu ARF-T pentru 24 h.
(B) Colorarea EB/AO după tratament şi ȋnaintea tratamentului pentru 24 h a celulelor
B16-F10 cells. Celulele au fost observate cu microscopul cu florescenţă inversată.
Săgetile albe indică celule apoptotice (magnificaţia: × 40)
Apoptotic cell death
Apoptosis leads to nuclear DNA breakdown into multiples of 200–500 bp
oligonucleosomal size fragments. In Fig. 16 a high number of ARF-T treated B16-F10
murine melanoma cells were found TUNEL positive compared to untreated cells using
immunocytochemical staining. Treatment with 600 μg/ ml ARF-T for 24 h increased the
number of TUNEL positive cells with 14 % compared to their corresponding control cells
with percent TUNEL positive cells of 2 % (Fig. 17). Data obtained in this study prove
that ARF-T induce apoptosis in B16-F10 treated melanoma.
Fig. 16. Confocal microscopy of B16-F10 cells TUNEL staining with or without
ARF-T treatment for 24 h. TUNEL-positive cells are shown as green fluorescence.
Numerous normal nuclei stained in red with Draq5
Page 44
PhD Thesis Abstract
XLIV
Fig. 16. Microscopia confocală pentru celulele B16-F10 cu şi fără tratamentul cu ARF-T
pentru 24h. Celulele TUNEL pozitive sunt marcate cu florescenţă. Nucleii nornali sunt colloraţi
ȋn rosu cu Draq5.
0
3
6
9
12
15
18
21***
U
T
Apopto
sis
index
(%
)
Fig. 17. Quantification of apoptosis induction in B16-F10 cells treated with ARF-
T for 24 h. Quantification by TUNEL assay - Data are presented as percentage of
TUNEL-positive cells per 1000 cells; U-untreated cells; T- ARF-T treated cells.
Fig. 17. Cuantificarea apoptozei induse ȋn celulele B16-F10 tratate cu ARF-T
pentru 24 h. Cuantificarea prin testul TUNEL. Datele sunt exprimate ca procent al
celulelor pozitive la TUNEL, din 1000 celule numarate; U-celule netratate; T- ARF-T
celule tratate
Data regarding the effects of blueberry anthocyanins on cell proliferation murine
melanoma cells have not been reported previously and could therefore be recorded as a
novel biological activity. Unfortunately, their mechanism of action remains unknown.
Recently, it was suggested that mulberry anthocyanins could mediate B16-F1 cell
metastasis by reduction of MMP-2 and MMP-9 activities involving the suppression of the
Ras/PI3K signaling pathway (Huang et al., 2008).
CONCLUSIONS
Five varieties of blueberry were purchased from local farmers and analysed by
HPLC-DAD-ESI-MS for the purification, identification and quantification of
anthocyanin content.
The purification of the extracts was done on Ambertite XAD-7&Sephadex LH-20
in order to obtain anthocyanin-rich fraction and to test it for its ability to inhibit
the proliferation and to stimulate apoptosis in B16-F10 metastatic murine
melanoma cell line.
Page 45
PhD Thesis Abstract
XLV
After the chromatograhpic analysis 12 individual anthocyanins were identified and
quantified. Malvidin-3-O-galactoside, petunidin-3-O-galactoside and delphinidin-
3-O-galactoside being the majors anthocyanins in all varieties studied.
The highest anthocyanin content was found in Toro cultivar (195.01 mg/ 100g fr.
wt), followed by Legacy, while the lowest amount was obtained in Bluegold
cultivar (101.88 mg/ 100g fr. wt).
Regarding antioxididantactivity the highest scores were found for Toro cultivar,
consistent with the higher anthocyanins concentration.
Blueberry anthocyanins inhibited the proliferation of B16-F10 cells in a dose
dependent manner. Treatment with 200 and 400 μg/ ml for 24 h stimulated the
B16-F10 cell proliferation with 20 %.
Treatment with ARF in doses of 550, 600, 650 μg/ml increased the leakage lactate
dehydrogenase (LDH) in B16-F10 cells by 9 %, 10 % and 12 % compared to
control.
The percent of apoptotic cells determined by Acridine orange/ Ethidium bromide
staining. About 20 % of cells ARF-T treated from total viable cells counted were
in apoptosis.
Treatment with 600 μg/ ml ARF-T for 24 h increased the number of TUNEL
positive cells with 14 % compared to their corresponding control cells with
percent TUNEL positive cells of 2 %
This study found that anthocyanin-rich fraction obtained from Vacciunium
corymbosum cv. Toro could inhibit melanoma tumor cell proliferation and induce
apoptosis. Before it can be declared that blueberry anthocyanins intake can reduce
melanoma cancer risk further studies are required in order to clarify their mechanisms
and to evaluate their bioavailability.
Page 46
PhD Thesis Abstract
XLVI
GENERAL CONCLUSIONS
Considering the main objectives of the research and the results obtained by
different experimental investigations, we can point out the main achievements:
1. It was performed comparative evaluation of quantity and antioxidant activity of
anthocyanins from four varieties of chokeberry, three varieties of cultivated highbush
blueberries and two types of wild blueberries.
2. There were compared different solid phase extraction methods in order to obtain
high purity extracts.
3. The chemopreventive effects of treatment with chokeberry anthocyanin-rich fraction
two cancer cell lines (B16-F10 melanoma murine and HeLa tumor cervical cell lines)
were demonstrated.
4. It was realized a complete study of various blueberry cultivars regarding
anthocyanins identification and their antioxidant activity and the antitumor and
proapoptotic effects of anthocyanin-rich fraction on B16-F10 melanoma murine cells.
Considering the main results of the research, presented in chapters 3-6 we can
conclude that:
Chapter 3 summarize the antioxidant activity and composition of anthocyanins
using HPLC chromatography revealed the fingerprint of each extract and the quantitative
distribution of different anthocyanin each extract. The chapter conclusions are:
a) The HPLC analysis showed that Aronia melanocarpa ‘Nero’cultivar extract
was found to be the richest in phenolics, flavonoids and anthocyanins, among
the four varieties tested. Cyanidin glycosides were the major anthocyanin
derivatives identified in chokeberry especially the 3-O-galactoside and 3-O-
arabinoside.
b) For blueberry extracts the highest values regarding total phenolics, flavonoids
and anthocyanins were obtained for Wild 1 sample. The most representative
anthocyanidins in Vaccinium myrtillus were delphinidin and petunidin while in
Vaccinium corymbosum, delphinidin and malvidin.
c) The total phenolics concentration found in chokeberry extracts varied from
1586.5 to 2059.5 mg/g fresh weight (expressed in equivalents of gallic acid).
For blueberry the lowest phenolic content was found in Duke variety, while
highest phenolic content in Wild 1.
d) The antioxidant capacity of analyzed extracts (as determined by five,
complementary assays (ABTS, HPS, ORAC, FRAP, CUPRAC) was positively
correlated with the anthocyanin content.
e) As a final conclusion, this study demonstrates that the fruits of chokeberry and
blueberry (cultivated and wild) commonly consumed in Romania are a good
Page 47
PhD Thesis Abstract
XLVII
source of anthocyanins. The wild blueberries contain a higher amount of
anthocyanins than cultivated ones.
As presented in Chapter 4, the results revealed differences among the three solid phase
extraction techniques to obtain high purity anthocyanin fractions. Accordingly:
a) The Oasis MCX was found to have the higher efficacy than the others SPE
methods used for extracts purity determination
b) For the evaluation of ARFs purity by HPLC and molar absorptivity assay,
the values obtained were different depending on the method used. The values
obtained by HPLC for chockebery extracts were range between 97.7%±2.0 (Oasis
MCX) and 82.6%±4.3 (Amberlite XAD-7& Sephadex LH-20) while for blueberry
extracts the obtained values were the range of 99.9% ± 1.9 -75.90% ±4.8 (Oasis
MCX, Amberlite XAD-7& Sephadex LH-20 respectily). However the purity
calculated by molar absorptivity were found to be lower.
c) The highest purity achieved using molar absorptivity analysis for
chokeberry ARF was through MCX cartidges for about 79.18 %, comparing to
Amberlite XAD-7 & Sephadex LH-20 (63.39 %). For bluebery extracts the results
were similar, the highest purity being obtained for Oasis MCX sorbent. Accurate
balances clean and dry containers, properly functioning desiccators, large enough
sample, sample evaporated to complete dryness, contamination by compounds that
do not absorb in the visible range are only few fact which can affect all those
calculation.
d) The use of HPLC method was found to give higher values for anthocyanin
rich-fraction than molar absorptivity method.
As presented in Chapter 5, the chemopreventive effects of chokeberry
anthocyanin-rich fraction upon two cancer cell lines (B16-F10 melanoma murine
and HeLa tumor cervical cell lines) were proven. We noticed that:
a) The cyanidin glycosides purified fraction from Aronia prunifolia fruits
inhibited gradually tumor cell proliferation after 24h or 48 h of treatment, proving
to be cytotoxic for HeLa and B16-F10 cells, respectively
b) The tumor cells used in this experiment change their morphology according
to the concentration of C-ARF and treatment period.
c) ARF inhibited growth of the of human cervical cancer HeLa with an IC50
value of about 171 μg/ml whilst for B16-F10 (B) metastatic murine melanoma cells
-treated cells by C-ARF the IC 50 was 313 μg/ml
d) The intracellular reactive oxygen species level as determined by the
fluorescence test with 2′,7′-dichlorofluorescein (DCF) shows that the cells treated
with chokeberry extract had increased fluorescence compared with untreated cells,
indicating their proapoptotic effect by ROS accumulation in both tumor cells.
Page 48
PhD Thesis Abstract
XLVIII
e) The effects were significantly higher when 150 or 300 ug/ml anthocyainin
fraction was applied on HeLa and B16-F10 cells, respectively.
According to the results obtained in Chapter 6, the chemopreventive effects of
anthocyanin rich-fractions obtained from blueberry on B16-F10 cells . The chapter
conclusions are
a) Five varieties of blueberry were purchased from local farmers and analysed by
HPLC-DAD-ESI-MS for the purification, identification and quantification of
anthocyanin content.
b) The purification of the extracts was done on Ambertite XAD-7&Sephadex LH-
20 in order to obtain anthocyanin-rich fraction and to test it for its ability to
inhibit the proliferation and to stimulate apoptosis in B16-F10 metastatic
murine melanoma cell line.
c) After the chromatograhpic analysis 12 individual anthocyanins were identified
and quantified. Malvidin-3-O-galactoside, petunidin-3-O-galactoside and
delphinidin-3-O-galactoside being the majors anthocyanins in all varieties
studied.
d) The highest anthocyanin content was found in Toro cultivar (195.01 mg/ 100g
fr. wt), followed by Legacy, while the lowest amount was obtained in Bluegold
cultivar (101.88 mg/ 100g fr. wt).
e) Regarding antioxididantactivity the highest scores were found for Toro cultivar,
consistent with the higher anthocyanins concentration.
f) Blueberry anthocyanins inhibited the proliferation of B16-F10 cells in a dose
dependent manner. Treatment with 200 and 400 μg/ ml for 24 h stimulated the
B16-F10 cell proliferation with 20 %.
g) Treatment with ARF in doses of 550, 600, 650 μg/ml increased the leakage
lactate dehydrogenase (LDH) in B16-F10 cells by 9 %, 10 % and 12 %
compared to control.
h) The percent of apoptotic cells determined by Acridine orange/ Ethidium
bromide staining. About 20 % of cells ARF-T treated from total viable cells
counted were in apoptosis.
i) Treatment with 600 μg/ ml ARF-T for 24 h increased the number of TUNEL
positive cells with 14 % compared to their corresponding control cells with
percent TUNEL positive cells of 2 %
This the first study regarding chemical composition and chemoprotective effects
of anthocyanin-rich fractions obtained from Aronia melanocarpa cultivated in Romania
also the effects of blueberry anthocyanins on cell proliferation murine melanoma cells
have not been reported previously and could therefore be recorded as a novel biological
activity. Experiments presented in this stuy are original contributions and bring more
valuable results for the research regarding chemical and biological properties of
Page 49
PhD Thesis Abstract
XLIX
anthocyanins.We demonstrated that the anthocyanins from chokeberries and blueberries
could have a health benefits, acting as antitumor agents, these fruits being hoighy
recommended for daily consumption.
Page 50
PhD Thesis Abstract
L
REFERENCES
ABDEL-AAL E. S. M., J. C. YOUNG, P. J. WOOD, I. RABALSKI, P. HUCL, D. FALK
AND J. FREGEAU-REID, 2002. Einkorn: A potential candidate for developing
high lutein wheat, Cereal Chemistry 79(3) 455-457.
APAK R., GÜÇLÜ K., DEMIRATA B., OZYÜREK M., CELIK S.E., BEKTAŞOĞLU
B., BERKER K.I., OZYURT D., 2007. Comparative evaluation of various total
antioxidant capacity assays applied to phenolic compounds with the CUPRAC
assay, Molecules. 12(7):1496-547
BENZIE, F.F. and STRAIN, J.J., 1999. Ferric Reducing/Antioxidant Power
Assay:DirectMeasure of Total antioxidant Activity of Biological Fluids
and Modified Versionfor Simultaneous Measurement of Total
Antioxidant Power and Ascorbic AcidConcentration. Methods in
enzymology. vol. 299:15-23
CARA R. WELCH, QINGLI WU and JAMES E. SIMON, 2008. Recent Advances in
Anthocyanin Analysis and Characterization, Curr Anal Chem, 4(2): 75–101.
CASTANEDA-OVANDO A., PACHECO-HERNANDEZ M.D.L., PAEZ-
HERNANDEZ M.E., RODRIGUEZ J.A., and GALAN-VIDAL C.A., 2009.
Chemical studies of anthocyanins: A review. Food Chem; 113:859-871.
GAVRILOVA V., KAJDZANOSKA M., GJAMOVSKI V., STEFOVA M., 2011.
Separation, characterization and quantification of phenolic compounds in
blueberries and red and black currants by HPLC-DAD-ESI-MSn. J. Agric. Food
Chem, 59, 4009-4018
GIUSTI M. M., RODRIGUEZ-SAONA L. E. and WROLSTAD R. E., 1999. Molar
absorptivity and color characteristics of acylated and non-acylated pelargonidin-
based anthocyanins. J Agr Food Chem, 47(11):4631-4637.
GIUSTI M.M., WROLSTAD R.E., 2003. Acylated anthocyanins from edible sources and
their applications in food systems. Biochemical Engineering Journal 14: 217-225
HE J. and GIUSTI M.M. 2010.Anthocyanins: natural colorants with health-promoting
properties. Food Sci. Tech. 1: 163-187.
HE J. and M.M. GIUSTI, 2011. High-purity isolation of anthocyanin mixtures from fruits
and vegetables – a novel solid-phase extraction method using mixed mode cation-
exchange chromatography.Journal of Chromatography, A 1218:7914-7922
HUANG D. et al.,2005. The chemistry behind antioxidant capacity assays, J Agric Food
Chem, 53(6): 1841-1856
KÄHKÖNEN M. P., HOPIA A. I., and HEINONEN M., 2001. Berry phenolics and their
antioxidant activity. Journal of Agricultural and Food Chemistry 49, 4076-4082
Page 51
PhD Thesis Abstract
LI
KIM K.S., S. LEE, Y.S. LEE, S.H. YUNG, Y. PARK, K.H. SHIN and B.K. KIM,
2003. Anti-oxidant activities of the extracts from the herbs ofArtemisia apiacea. J.
Ethnopharmacol., 85: 69-72
RIBBLE D., GOLDSTEIN N. B., NORRIS D. A., SHELLMAN Y. G., 2005. A simple
technique for quantifying apoptosis in 96-well plates. BMC Biotechnol, 5, 12.
RODRIGUEZ-SAONA L.E. and R.E. WROLSTAD, 2001. Extraction, isolation, and
purification of anthocyanins. Current Protocols in Food Analytical Chemistry.
Hoboken, NJ, John Wiley & Sons, Inc.: F1.1.1-F1.1.11
RUCH R. J., CHENG S. J., and KLAUNIG J., E., 1989. Prevention of cytotoxicity and
inhibition of intercellular communication by antioxidant catechins isolated from
Chinese green tea. Carcinogenesis 10:1003-1008.
SCALBERT A., WILLIAMSON G., 2000. Dietary intake and bioavailability of
polyphenols. J Nutr, 130(8s):2073S-85S.
SOCACIU C., 2007. Food colorants: chemical and functional properties. Boca Raton:
Taylor & Francis. 616-617
XIAOKE HU and ZHIMIN XU, 2011. Chapter 15. Isolation Characterization of
Bioactive Compounds in Fruits and Cereals Fruit and Cereal Bioactives Edited by
Özlem Tokuşoğlu and Clifford Hall III CRC Press ,319–336 Print ISBN: 978-1-
4398-0665-4
ZHISHEN J., MENGCHENG T., JIANMING W., 1999. The determination of flavonoid
contents in mulberry and their scavenging effects on superoxide radicals. Food
Chem, 64:555-559.
HUANG H.P., SHIH Y.W., CHANG Y.C., HUNG C.N., WANG C.J., 2008.
Chemoinhibitory effect of mulberry anthocyanins on melanoma metastasis
involved in the Ras/PI3K pathway. J. Agric. Food Chem, 56, 9286-9293.