34
Extragalactic Radio and Far-IR Sources in the Planck Frequency Range Gianfranco De Zotti (INAF-OAPd) thanks to: Marcel Clemens, Mattia Negrello, Laura Bonavera

Extragalactic Radio
and Far-IR Sources in
the Planck Frequency
Range
Gianfranco De Zotti (INAF-OAPd)
thanks to: Marcel Clemens, Mattia Negrello,
Laura Bonavera

Radio sources - 1
• A lot of results on radio sources presented in Planck
Early Papers and described at the Paris conference last
year (Planck early results. XIII, XIV, XV).
• Major result: realization that for blazars (flat-spectrum
radio quasars - FSRQs - and BL Lacs) already a ~ 70
GHz we are observing the spectral bending indicative
that we are approaching the synchrotron peak
• Result unexpected in the framework of the `blazar
sequence’ model according to which the peak frequency
is anticorrelated with radio luminosity and occurs in the
millimetric region only for the rare exceptionally
luminous objects, not for the general population.

Planck radio source counts
(more in Hervé Dole’s and Marco Tucci’s talks)
Models relying on the `blazar sequence’ scenario overpredict the counts
at > 100 GHz. Counts well fitted by the Tucci et al. (2011) model, although
some excess over model at the faintest flux densities.
Tucci et al. (2011)

Counts and break frequencies
• Tucci et al., based on physical arguments, concluded
that the spread of break frequencies for blazars must be
very large, so large in fact to blur any trend with
luminosity.
• For FSRQs the distribution of break frequencies should
extend well below the range implied by the blazar
sequence model.
• Their most successful model also envisages different
distributions of break frequencies for BL Lacs and
FSRQs, the former typically being an order of
magnitude higher. More in Marco Tucci’s talk.

Counts and break frequencies - 3
The lack of correlation between luminosity and peak frequency, and the
higher break frequencies of BL Lacs compared to FSRQs confirmed by
extensive quasi-simultaneous multifrequency observations (Massardi
et al. 2011; Bonavera et al. 2011; Richards et al. 2011; Planck early
results. XIV, XV; Giommi et al. 2011). Laura Bonavera’s and Paolo
Giommi’s talks. Above the dashed line in the right-hand panel, the non-thermal
optical light of blazars is bright enough to swamp the emission from the host galaxy.
Bonavera (2011) Giommi et al. (2011)

Radio sources SEDs
Simultaneous
Planck + ATCA
data (PACO
project, PI: M.
Massardi)
show
remarkably
smooth SEDs
over about 2
decades in
frequency,
from ~ 6 cm to
sub-mm
wavelengths
(see Laura
Bonavera’s
talk also for
some counter-
examples ) Bonavera et al. (2011)
Fν (
mJy)
ν (GHz) ν (GHz)
ν (GHz) ν (GHz)
Fν (
mJy)

Counts and break frequencies - 2
Planck data
help
determining
the
synchrotron
peak and
confirm the
large
spread of
νbreak
(Bonavera
et al. 2011)
…
Courtesy of L. Bonavera

Issues with radio source counts
• Determinations of radio source counts in the
range 30 − 217 GHz recently extended up to 545
GHz (Hervé Dole’s talk).
• Issue with the classification of sub-mm sources
due to co-existence of nuclear radio emission
with dust emission from the host galaxy
(emission from a dusty circum-nuclear torus may
also be present but normally does not show up at
sub-mm wavelengths).
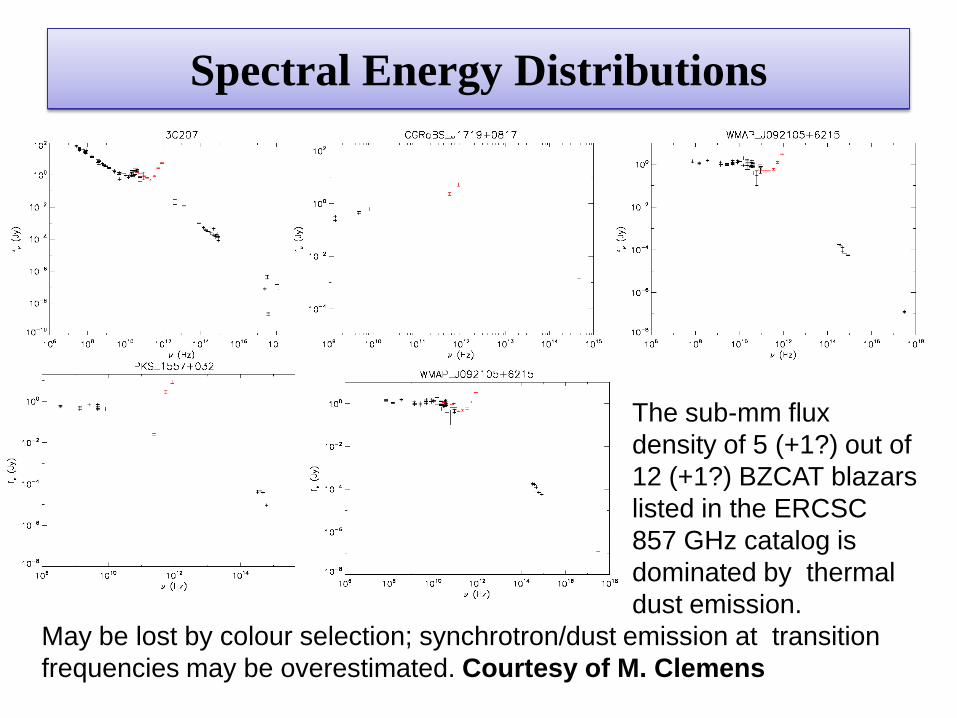
Spectral Energy Distributions
The sub-mm flux
density of 5 (+1?) out of
12 (+1?) BZCAT blazars
listed in the ERCSC
857 GHz catalog is
dominated by thermal
dust emission.
May be lost by colour selection; synchrotron/dust emission at transition
frequencies may be overestimated. Courtesy of M. Clemens
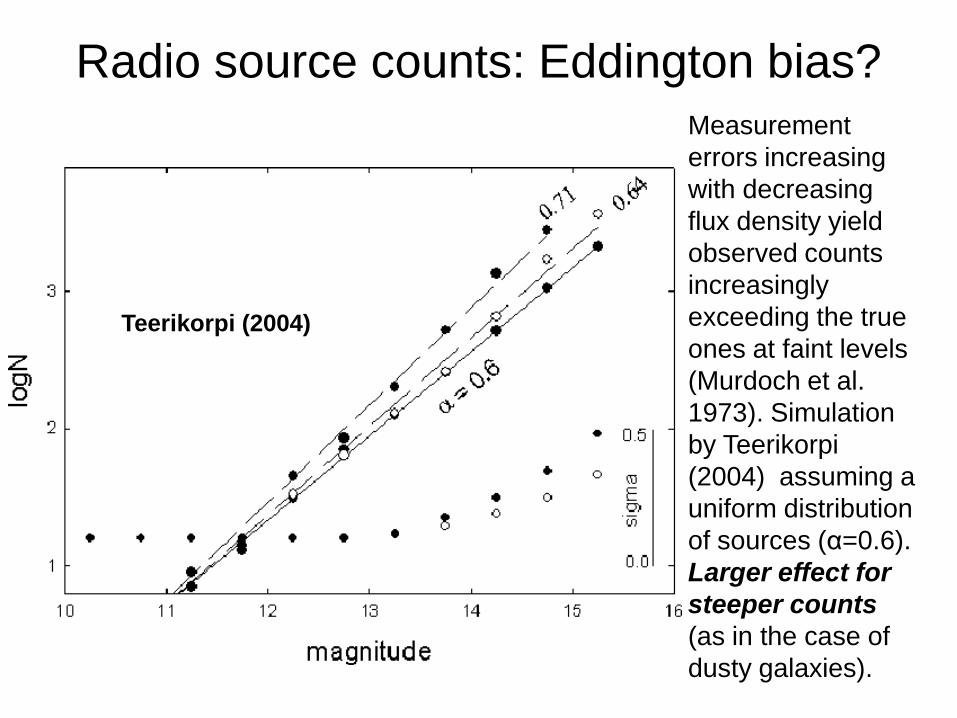
Radio source counts: Eddington bias?
Teerikorpi (2004)
Measurement
errors increasing
with decreasing
flux density yield
observed counts
increasingly
exceeding the true
ones at faint levels
(Murdoch et al.
1973). Simulation
by Teerikorpi
(2004) assuming a
uniform distribution
of sources (α=0.6).
Larger effect for
steeper counts
(as in the case of
dusty galaxies).

Dusty galaxies

Counts (more in Herve’s talk)
Negrello et al. (2007)
Most models (see
also Matthieu
Béthermin’s talk)
predict Euclidean
counts above the
Planck detection limit
at sub-mm
wavelengths

Prediction of 550µm flux densities of Spitzer-SWIRE galaxies (32 deg2) based on photometric redshifts and infrared template fits at 3.6 ‒ 160µm (Rowan-Robinson et al. 2008)

CO contribution to Planck flux measurements
Planck HFI Core Team (2011): Planck early results. VI.
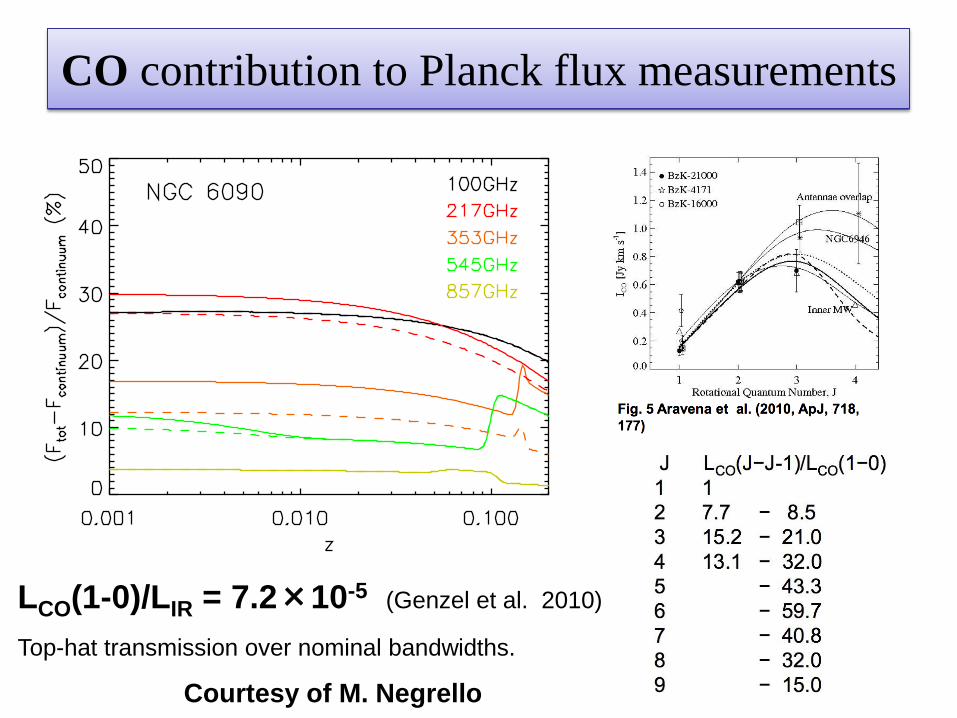
CO contribution to Planck flux measurements
LCO(1-0)/LIR = 7.2×10⁻⁵ (Genzel et al. 2010)
Top-hat transmission over nominal bandwidths.
Courtesy of M. Negrello
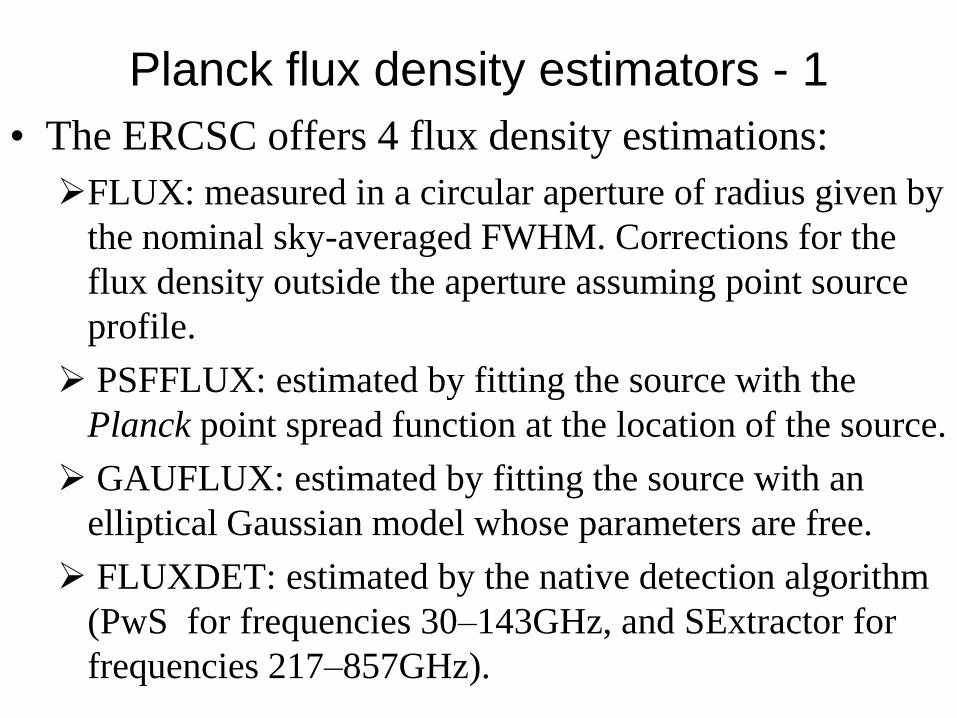
Planck flux density estimators - 1
• The ERCSC offers 4 flux density estimations:
FLUX: measured in a circular aperture of radius given by
the nominal sky-averaged FWHM. Corrections for the
flux density outside the aperture assuming point source
profile.
PSFFLUX: estimated by fitting the source with the
Planck point spread function at the location of the source.
GAUFLUX: estimated by fitting the source with an
elliptical Gaussian model whose parameters are free.
FLUXDET: estimated by the native detection algorithm
(PwS for frequencies 30–143GHz, and SExtractor for
frequencies 217–857GHz).

Which estimator should be used?
FLUX most commonly used. However, even galaxies with
EXTENDED=0 have sizes not much smaller than the Planck
beam at high frequencies (4.41, 4.47, 4.41 arcmin at 353, 545,
853 GHz, respectively). Courtesy of M. Clemens
Distribution of
optical sizes for a
representative
sample flux
limited sample of
ERCSC galaxies
selected at 545
GHz flagged
EXTENDED=0

Planck vs Herschel photometry (545 GHz)
Galaxies at |b| > 20°and with EXTENDED=0 (42 objects).
Black points: KINGFISH (Dale et al. 2011); red points: H-ATLAS (Herranz
et al. 2012). Planck data colour corrected according to the Explanatory
Supplement (factor ~0.9 for the relevant spectral indices). Colour
correction on Herschel data using the individual 500µm− 350µm spectral
index. Small impact of different estimators on source counts in the
range considered in Hervé’s presentation. Courtesy of M. Clemens
FLUX PSFFLUX GAUFLUX
Pla
nc
k (
Jy)
Herschel (Jy)

Planck vs Herschel flux densities: 545 GHz

Redshift distribution of ERCSC sources
Flux limited sample of
ERCSC galaxies selected at
545 GHz. Only 3 galaxies (out
of 110) at z>0.03
Courtesy of M. Clemens

Herschel sub-mm LLFs
Vaccari et al. (2010)
350 µm Vaccari et al. (2010)
500 µm
LLFs either extrapolated from IRAS
(Serjeant & Harrison 2005) or need model
dependent corrections for evolution. Planck
provides truly local samples. Thanks to its
all-sky coverage it has unique capabilities in
sampling with good statistics the upper end
of the LLF, hence of the SFR and of the
dust mass function.
Dye et al. (2010)

Dust mass function
Dunne et al. (2011)
From the Schechter fit one expects 0 galaxies with Mdust > 109
Msun (N(≥ 109 Msun)~10-17 Mpc-3), but a preliminary analysis
(Planck early results. XVI.) finds at least 3 galaxies in this
mass range

SEDs of dusty galaxies
Planck Collaboration.
XVI. Planck provides
information on the presence
of colder dust than
detectable by IRAS or
AKARI all-sky surveys.
While the SEDs of most
galaxies can be fitted with
two dust components at
Tcold=16±4 K and
Twarm=36±9 K, at least 13
galaxies were found with a
dust component with
temperatures as low as 10 K
(green line).

How abundant is the cold dust?
• Accurate flux density measurements and corrections
CO contamination are crucial to answer this question.
• The Eddington bias and the CO contamination may
lead to significant flux density overestimates. On the
other hand, the FLUX estimator may lead to
underestimates.
• More work is needed to assess whether indeed the
Euclidean portion of the (sub-)mm counts of dusty
galaxies is higher than expected based on previous
knowledge of the SEDs, thus providing statistical
evidence for the widespread presence of cold dust.

High-z dusty galaxies
• ERCSC dusty galaxies are at very low
redshifts, as indeed expected on the basis of
most models
• However, Planck surveys provide
important and unique information also on
high-z dusty galaxies and specifically on:
Strongly lensed galaxies
Proto-clusters of dusty galaxies
CIB fluctuations

References:
• Serjeant & Harrison (2005)
• Clements et al. (2010)
• Oliver et al. (2010)
• Coppin et al. (2006)
• Vieira et al. (2010)
Models
un-lensed spheroids
(Lapi et al. 2011)
lensed spheroids
(Negrello et al. 2007)
late-type galaxies
(Negrello et al. 2007)
TOTAL
Sub-mm/mm counts of dusty galaxies
Courtesy of M. Negrello & A. Lapi
Planck detection
limits
tantalizingly close
to expected
detection of high-
z strongly lensed
galaxies

Proto-clusters of dusty galaxies
• Negrello et al. (2005) pointed out that,
although individual high-z galaxies are
generally too faint to be detectable by Planck,
proto-clusters of dusty galaxies, unresolved by
Planck, may show up as peaks on Planck
maps. Examples may have already been found
(see Ludovic Montier’s, Dave Clements’,
Joaquin Gonzalez-Nuevo’s talks)

Power spectrum of CIB fluctuations - 1
• To be discussed by Jean-Loup Puget. Only
a few comments here.
• Well determined by Planck from multipole
l=200 to l=2000 at 217, 353, 545 and 857
GHz (Planck Early Results. XVIII).
• Extension to higher multipoles thanks to
higher resolution Herschel (Amblard et al.
2011), SPT (Hall et al. 2010; Shirokoff et
al. 2011) and ACT (Dunkley et al. 2011;
Das et al. 2011).

Power spectrum of CIB fluctuations - 2
• Data well reproduced in the framework of the
Halo Occupation Distribution Formalism (Planck
Early Results. XVIII; Amblard et al. 2011; Pénin
et al. 2011; Xia et al. 2011).
• Xia et al. (2011) find that all multifrequency data
can be simultaneously reproduced in the
framework of the Granato et al. (2004) model (see
Gigi Danese’s talk) with only 2 free parameters,
the minimum halo mass and the power-law index
of the mean occupation function of galaxies.

Xia et al. (2011)

Power spectrum of CIB fluctuations - 3
• The minimum halo mass, log(Mmin/Msun) = 12.24 ± 0.06,
derived by Xia et al. (2011), is higher but consistent within
the errors, with the estimate by Amblard et al. (2011):
log(Mmin/Msun) = 11.5 (+0.7, -0.2). The corresponding
effective halo mass at z ≈ 2, i.e. at the peak of cosmic star
formation, log(Meff/Msun) =12.7, is reassuringly close to that
of the most efficient star-formers at that redshift (Tacconi et
al. 2008) .
• A somewhat puzzling result, confirmed by independent
analyses, is the implied presence of a substantial non-linear
contributions at z≥1 on angular scales ≥10', corresponding
to physical linear scales ≥ 5 Mpc, corresponding to mass
scales ≥ several 1013 Msun to be compared with
characteristic non linear masses of ≤ 2×10¹¹ Msun

Conclusions: radio sources
• Planck is providing new insights into the SED of
blazars in an essentially unexplored frequency
region, close to the synchrotron peak, both
directly and statistically (via source counts).
• Peak frequency uncorrelated with radio
luminosity, at odds with the `blazar sequence’
scenario. Results support the scenario proposed
by Tucci et al. (2011)
• Some issues with sub-mm radio source counts
need to be clarified

Conclusions: dusty galaxies - 1
• Planck yields the first determination of the Euclidean
portion of sub-mm counts. Some models ruled out by
Planck data alone.
• Issues with flux density estimates (optimal flux density
estimator, CO contamination, amount of Eddington
bias) still need to be fully sorted out
• Evidence of large cold dust masses in at least some
galaxies.
• Indications of a strong excess (compared to Herschel-
based estimates) in the high-mass tail of the dust mass
function

Conclusions: dusty galaxies - 2
• Rare intensity peaks in Planck sub-mm maps dominated
by high-z sources due to proto-clusters of dusty
galaxies. Detection of high-z proto-clusters may be
fostered if they act as gravitational lenses for
background ULIRGs.
• Power spectra of CIB fluctuations consistent with being
dominated by galaxies with halo masses ~ 5×10¹² Msun
at z~2, independently found to be the most prolific star
formers in the universe.
• Puzzling indications of non linear effects on scales ~ 10'
yielded by sources thought to be at z ≥ 1


