2253 Introduction Tolerance of anoxia is the exception rather than the rule for vertebrates (Lutz et al., 1996). The physiology of anoxia- tolerance has been examined in relatively few species of vertebrates, notably the painted turtle Chrysemys picta and the crucian carp Carassius carassius. Anaerobiosis in these organisms is supported by a complex suite of traits that includes the storage of large amounts of glycogen to support glycolytic production of lactate (turtles) or ethanol (crucian carp), and elevated levels of -aminobutyrate (GABA) in neural tissues (Lutz et al., 1996). In both species, the single most critical factor for survival of anoxia appears to be a severe reduction in metabolism (ATP turnover), a state that is achieved via a coordinated downregulation of energy producing and energy consuming processes (Hand and Hardewig, 1996; Jackson, 2000; Krumschnabel, 2000; Lutz and Nilsson, 2004). In this study we investigated the anoxia tolerance of diapausing embryos of the annual killifish Austrofundulus limnaeus. This species occurs in ephemeral ponds in the Maracaibo Basin of Venezuela, which are a harsh and highly variable habitat in which few aquatic vertebrates can survive. Conditions in these ponds change radically during transitions from the rainy season to the dry season. Rainy season ponds may remain inundated for several weeks to several months with some ponds being semi-permanent (Thomerson and Taphorn, 1992). During the dry season, ponds may remain dry for several months and perhaps years. A. limnaeus has evolved a life history strategy similar to many aquatic invertebrate species, which includes the production of drought-tolerant diapausing embryos (Wourms, 1972b; Podrabsky et al., 2001) that are deposited into the muddy pond substrate (Myers, 1952). Oxygen limitation is often imposed by microbial activity in inundated soils, and the habitat of A. limnaeus is no exception (Podrabsky et al., 1998). Consequently, embryos of A. limnaeus are likely to experience long bouts of severe hypoxia or anoxia as a normal part of their developmental environment. Diapausing embryos of A. limnaeus share many metabolic characteristics with other vertebrate facultative anaerobes such as freshwater turtles and crucian carp. A significant metabolic depression (80–90% reduction compared to The annual killifish Austrofundulus limnaeus survives in ephemeral pond habitats by producing drought-tolerant diapausing embryos. These embryos probably experience oxygen deprivation as part of their normal developmental environment. We assessed the anoxia tolerance of A. limnaeus embryos across the duration of embryonic development. Embryos develop a substantial tolerance to anoxia during early development, which peaks during diapause II. This extreme tolerance of anoxia is retained during the first 4·days of post-diapause II development and is then lost. Metabolism during anoxia appears to be supported mainly by production of lactate, with alanine and succinate production contributing to a lesser degree. Anoxic embryos also accumulate large quantities of - aminobutyrate (GABA), a potential protector of neural function. It appears that the suite of characters associated with normal development and entry into diapause II in this species prepares the embryos for long-term survival in anoxia even while the embryos are exposed to aerobic conditions. This is the first report of such extreme anoxia tolerance in a vertebrate embryo, and introduces a new model for the study of anoxia tolerance in vertebrates. Supplementary material available online at http://jeb.biologists.org/cgi/content/full/210/13/2253/DC1 Key words: anaerobiosis, anoxia, development, fish, GABA, lactate, metabolic depression. Summary The Journal of Experimental Biology 210, 2253-2266 Published by The Company of Biologists 2007 doi:10.1242/jeb.005116 Extreme anoxia tolerance in embryos of the annual killifish Austrofundulus limnaeus: insights from a metabolomics analysis Jason E. Podrabsky 1, *, James P. Lopez 2 , Teresa W. M. Fan 3 , Richard Higashi 3 and George N. Somero 4 1 Department of Biology, Portland State University, PO Box 751, Portland, OR 97207-0751, USA, 2 Department of Neurobiology, Pharmacology, and Physiology, The University of Chicago, Chicago, IL 60637, USA, 3 Department of Chemistry, Belknap Research Building, 2210 S. Brook Street, University of Louisville, Louisville, KY 40208, USA and 4 Hopkins Marine Station, Stanford University, Oceanview Boulevard, Pacific Grove, CA 93950, USA *Author for correspondence (e-mail: [email protected]) Accepted 5 April 2007 THE JOURNAL OF EXPERIMENTAL BIOLOGY
Transcript
2253
IntroductionTolerance of anoxia is the exception rather than the rule for
vertebrates (Lutz et al., 1996). The physiology of anoxia-tolerance has been examined in relatively few species ofvertebrates, notably the painted turtle Chrysemys picta and thecrucian carp Carassius carassius. Anaerobiosis in theseorganisms is supported by a complex suite of traits that includesthe storage of large amounts of glycogen to support glycolyticproduction of lactate (turtles) or ethanol (crucian carp), andelevated levels of �-aminobutyrate (GABA) in neural tissues(Lutz et al., 1996). In both species, the single most criticalfactor for survival of anoxia appears to be a severe reductionin metabolism (ATP turnover), a state that is achieved via acoordinated downregulation of energy producing and energyconsuming processes (Hand and Hardewig, 1996; Jackson,2000; Krumschnabel, 2000; Lutz and Nilsson, 2004).
In this study we investigated the anoxia tolerance ofdiapausing embryos of the annual killifish Austrofunduluslimnaeus. This species occurs in ephemeral ponds in theMaracaibo Basin of Venezuela, which are a harsh and highly
variable habitat in which few aquatic vertebrates can survive.Conditions in these ponds change radically during transitionsfrom the rainy season to the dry season. Rainy season pondsmay remain inundated for several weeks to several months withsome ponds being semi-permanent (Thomerson and Taphorn,1992). During the dry season, ponds may remain dry for severalmonths and perhaps years. A. limnaeus has evolved a lifehistory strategy similar to many aquatic invertebrate species,which includes the production of drought-tolerant diapausingembryos (Wourms, 1972b; Podrabsky et al., 2001) that aredeposited into the muddy pond substrate (Myers, 1952).Oxygen limitation is often imposed by microbial activity ininundated soils, and the habitat of A. limnaeus is no exception(Podrabsky et al., 1998). Consequently, embryos of A.limnaeus are likely to experience long bouts of severe hypoxiaor anoxia as a normal part of their developmental environment.
Diapausing embryos of A. limnaeus share many metaboliccharacteristics with other vertebrate facultative anaerobessuch as freshwater turtles and crucian carp. A significantmetabolic depression (80–90% reduction compared to
The annual killifish Austrofundulus limnaeus survives inephemeral pond habitats by producing drought-tolerantdiapausing embryos. These embryos probably experienceoxygen deprivation as part of their normal developmentalenvironment. We assessed the anoxia tolerance of A.limnaeus embryos across the duration of embryonicdevelopment. Embryos develop a substantial tolerance toanoxia during early development, which peaks duringdiapause II. This extreme tolerance of anoxia is retainedduring the first 4·days of post-diapause II developmentand is then lost. Metabolism during anoxia appears to besupported mainly by production of lactate, with alanineand succinate production contributing to a lesser degree.Anoxic embryos also accumulate large quantities of �-
aminobutyrate (GABA), a potential protector of neuralfunction. It appears that the suite of characters associatedwith normal development and entry into diapause II inthis species prepares the embryos for long-term survival inanoxia even while the embryos are exposed to aerobicconditions. This is the first report of such extreme anoxiatolerance in a vertebrate embryo, and introduces a newmodel for the study of anoxia tolerance in vertebrates.
Supplementary material available online athttp://jeb.biologists.org/cgi/content/full/210/13/2253/DC1
The Journal of Experimental Biology 210, 2253-2266Published by The Company of Biologists 2007doi:10.1242/jeb.005116
Extreme anoxia tolerance in embryos of the annual killifish Austrofunduluslimnaeus: insights from a metabolomics analysis
Jason E. Podrabsky1,*, James P. Lopez2, Teresa W. M. Fan3, Richard Higashi3 andGeorge N. Somero4
1Department of Biology, Portland State University, PO Box 751, Portland, OR 97207-0751, USA, 2Department ofNeurobiology, Pharmacology, and Physiology, The University of Chicago, Chicago, IL 60637, USA, 3Department of
Chemistry, Belknap Research Building, 2210 S. Brook Street, University of Louisville, Louisville, KY 40208, USA and4Hopkins Marine Station, Stanford University, Oceanview Boulevard, Pacific Grove, CA 93950, USA
developing embryos) accompanies diapause (Podrabsky andHand, 1999). This metabolic depression is associated with asevere reduction in the rate of protein synthesis (Podrabskyand Hand, 2000). Thus, these embryos are already in a stateof metabolic depression very similar to anoxia-inducedquiescence even when incubated under aerobic conditions. Infact, during aerobic development from fertilization throughentry into diapause II, there is a significant contribution ofanaerobic pathways to the overall metabolism of theseembryos, as assessed by calorimetry and respirometry(Podrabsky and Hand, 1999). The present study wasperformed to further characterize the predicted extremeanoxia tolerance of diapause II embryos of A. limnaeus andidentify the metabolic pathways that may provide this specieswith its remarkable abilities to survive under extremeenvironmental conditions.
Materials and methodsCollection and incubation of embryos
Adult Austrofundulus limnaeus (Schultz 1949) were housedin 20·l aquaria as previously described (Podrabsky, 1999).Temperature in the aquaria was regulated at 26°C. Embryoswere collected twice weekly to keep the spawning intervalbetween 3 and 4·days, which has been shown to produce thehighest number of healthy embryos under laboratory conditions(Podrabsky, 1999). All embryos were incubated in the dark at25°C in embryo medium containing 10·mg·l–1 gentamycinsulfate (Podrabsky, 1999) unless otherwise noted. Theseconditions are known to support entry of embryos into diapauseII, and exposure to a long-day photoperiod has been shown tobreak diapause II (Podrabsky and Hand, 1999). On the day ofexposure to anoxia, the embryos were treated with two 5·minwashes in 0.001% (w/v) hypochlorite bleach to reduce thechances of bacterial and yeast growth during the long-termanoxia exposures (Podrabsky, 1999).
Anoxia tolerance
Embryo medium containing 10·mg·l–1 gentamycin sulfatewas made anoxic by purging the medium with high puritynitrogen gas for 20–30·min. Groups of 20 embryos were sealedinto 20·ml glass screw-cap vials (caps contained a silicon andTeflon septum) containing anoxic embryo medium. Just priorto sealing the vials, sodium sulfite crystals were added to a finalconcentration of 1.0·mg·ml–1 to remove any residual oxygenand to help protect against the reintroduction of oxygen. Vialswere visually inspected to ensure the absence of air bubbles.Calculations suggest that the amount of sulfite added to eachvial would be ten times the amount needed to produce anoxicconditions from fully oxygenated medium. These levels werenon-toxic (see below). Anoxic vials were then sealed in a glassbell jar, which was subsequently purged with nitrogen gasfor 20·min. Anoxic conditions were confirmed using apolarographic oxygen electrode (Model 1302; StrathkelvinInstruments, Motherwell, UK) when each vial was opened forprocessing. At each sampling time, a single vial of embryos
from each replicate was opened and the embryos were washedbriefly in embryo medium, and then placed in fresh,oxygenated embryo medium to recover from the anoxicexposure. Survival of the embryos was assessed immediatelyand after 1·week of aerobic recovery, using an invertedcompound microscope. Embryos were scored as alive if theywere structurally intact and morphologically normal. Survivalafter 1·week was assessed by the same criteria as the initialassessment with the additional requirements of successfulresumption of development (in non-diapausing embryos) ornormal cardiac function (in developing and diapausingembryos). Mean lethal time (to 50% mortality; LT50) estimateswere calculated based on the number of embryos that were ableto survive and resume normal development or physiologicalfunction after 1·week of aerobic recovery.
Anoxia tolerance was assessed in early developing anddiapause II embryos at 1, 2, 4, 8, 12, 16, 24 and 32·days post-fertilization (d.p.f.) and in post-diapause II embryos at 4, 8 and12·days post-diapause II (d.p.d.). Embryos normally enterdiapause II at 24 d.p.f. when incubated at 25°C. Embryos wereinduced to break diapause synchronously by exposure to along-day photoperiod (14·h:10·h L:D) (Podrabsky and Hand,1999) at an incubation temperature of 30°C for 2·days. Afterthe embryos were observed to break diapause they wereimmediately returned to conditions of 25°C in the dark. For alldevelopmental stages, three different spawning events wereused to produce three replicates for statistical analysis at alltime points.
Toxicity of sodium sulfite
The potential toxicity of sodium sulfite during anoxicexposure was assessed in 4 and 8 d.p.f. embryos. Embryos forthese studies were treated as described above, except thatsodium sulfite was added to a final concentration that rangedfrom 0.25 to 2.5·mg·ml–1. For each developmental stage asingle batch of embryos was used to produce three replicatesof 20 embryos for each time point. At the concentrations usedin this study, sodium sulfite appears to have no toxic effect onthe survival of embryos exposed to anoxia (Figs·S1 and S2 insupplementary material).
Preparation of metabolite extracts for gaschromatography–mass spectrometry analysis
During normoxic development embryos at 0, 4, 8, 12, 16,20, 24 and 32·d.p.f. were flash frozen in liquid nitrogen andstored at –80°C prior to extraction of metabolites. Embryos at1, 2, 4, 8, 16, and 32·d.p.f. were exposed to anoxia andsampled at times consistent with their anoxia tolerance: 0.5and 1·day of anoxia for 1 and 2·d.p.f. embryos, 7 and 21·daysfor 4·d.p.f. embryos, and 21 and 60·days for 8, 16 and 32·d.p.f.embryos. Embryos were removed from anoxia and thesurviving embryos were quickly counted and their massdetermined prior to flash freezing. Embryos were lyophilizedin pre-tared microcentrifuge tubes and then pulverized usinga Teflon pellet pestle. The pulverized powder was thenhomogenized with 20 volumes of ice-cold 10% (w/v)
J. E. Podrabsky and others
THE JOURNAL OF EXPERIMENTAL BIOLOGY
2255Anoxia tolerance in killifish embryos
trichloroacetic acid (TCA). The TCA homogenate was thencentrifuged at 14·000·g for 30·min at 4°C to pellet the proteinand other TCA-insoluble materials. The supernatant wascarefully removed and retained. The pellet was then washedonce with 20 volumes of ice-cold 10% TCA and centrifugedas described above. The two supernatants were then pooledand lyophilized overnight to remove the TCA and dehydratethe extract. The dried extract was then resuspended in water(0.2–0.4·ml) and a small fraction of the rehydrated extract(0.04–0.06·ml) was dispensed into a glass gas chromatographyvial and again lyophilized to dehydrate the sample [modifiedfrom Gradwell et al. (Gradwell et al., 1998)].
Silylation gas chromatography–mass spectrometry analysis
The lyophilized TCA extract powder was derivatized with0.025·ml of a 1:1 ratio mix of acetonitrile: N-methyl-N-[tert-butyldimethylsily]trifluoroacetamide (MTBSTFA). The vialswere then sealed and sonicated at room temperature for 3·h.Following sonication, 0.5·�l of the derivatized extract wasinjected into a Varian 3400 gas chromatograph (VarianInstruments, Palo Alto, CA, USA) coupled with a Finnigan ITD806 mass spectrometer (Finnegan MAT, San Jose, CA, USA)according to the methods of Fan et al. (Fan et al., 1993). Amixture of 37 compounds was similarly silylated and analyzedby gas chromatography–mass spectrometry (GC–MS) to serveas calibration standards.
1H nuclear magnetic resonance spectroscopy
Perchloric acid extracts were prepared for three samples foranalysis using nuclear magnetic resonance (NMR)spectroscopy: diapause II, diapause II embryos exposed to75.5% relative humidity for 3·days, and 8·d.p.f. embryos. Theseembryos were extracted twice in 20·vol of ice-cold 10%perchloric acid (PCA). PCA was removed by precipitation withKOH (pH adjusted to between 6 and 7) and centrifugation ofthe precipitated materials at 14·000·g for 15·min (Fan et al.,1986). The neutralized PCA extracts were then passed over aChelex-100 column (Bio-Rad, Hercules, CA, USA) to removeparamagnetic ions, lyophilized and dissolved in D2O.One-dimensional and two-dimensional total correlationspectroscopy (TOCSY) 1H NMR spectra were acquired at 25°Cusing a Varian Unity Plus NMR spectrometer operating at11.75 Tesla.
Statistical analysis
All statistical analyses were performed using SPSS software(SPSS Inc., v.14.0.1, Chicago, IL, USA). LT50 was calculatedfor each time series of anoxic exposures using probit regressionanalysis (Chapman et al., 1995). LT50 values determined foreach developmental stage were compared using analysis ofvariance (ANOVA, general linear models procedure).Comparison of means for all data sets was accomplishedusing ANOVA (as above). Unless noted otherwise, theStudent–Neuman–Keul’s post-hoc test was applied todetermine the differences among means. Statistical significancewas set for P<0.05 in all comparisons.
ResultsAnoxia tolerance
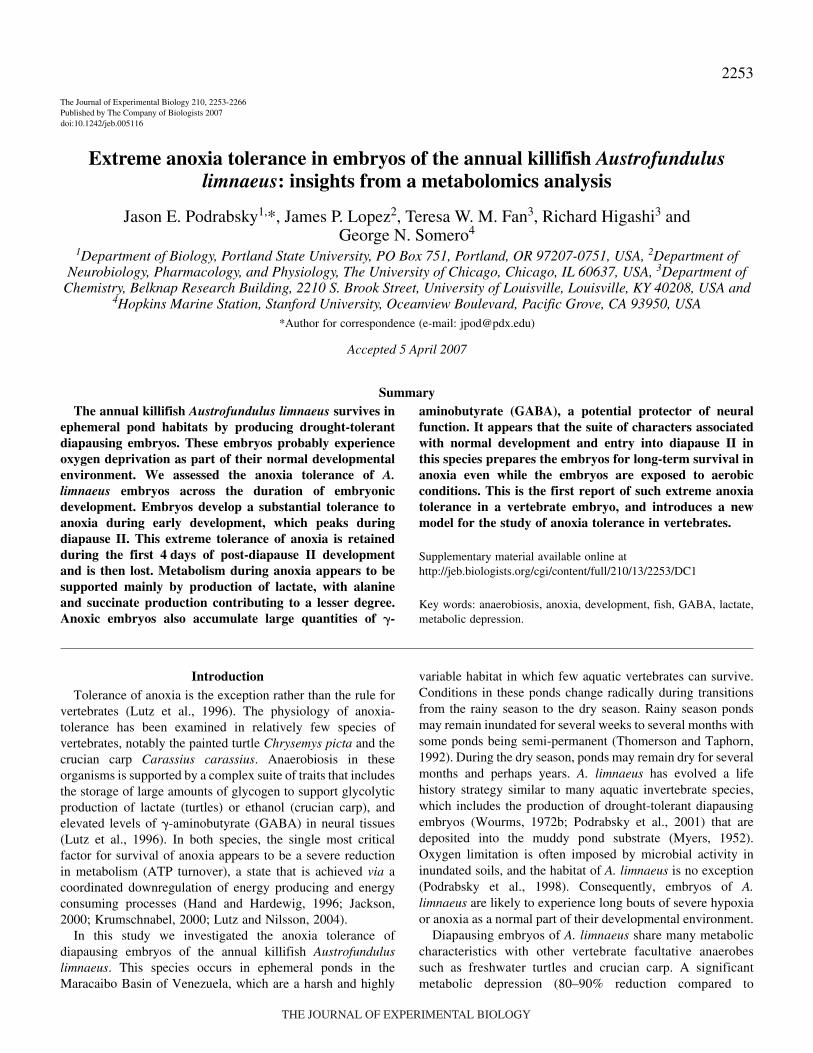
Embryos of A. limnaeus developed a substantial tolerance toanoxia as they progress towards and enter diapause II (Fig.·1).Anoxia tolerance increased during early development fromLT50 values around 1·day of anoxia (1 and 2·d.p.f.) to amaximum of 62±8·days (mean ± s.e.m.) in diapause IIembryos. This high degree of anoxia tolerance was retained forat least 4·days of post-diapause II development, but is then lostby 8·d.p.d.
Recovery from anoxia
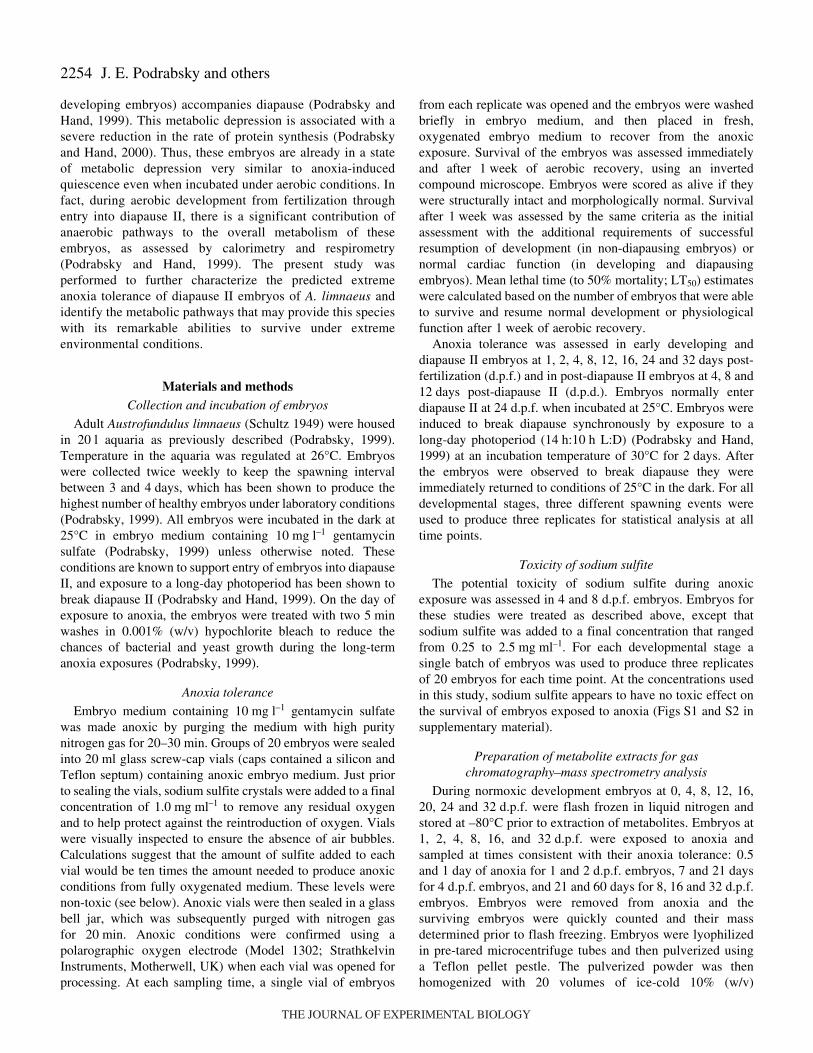
Embryos that are exposed to anoxia for 30·days or less arehighly likely to fully recover from anoxia, as determined by theability to resume normal development (Fig.·2A,B). However,after 60·days of anoxia, a duration that is near or past the LT50
for most stages, a significant number of the embryos thatsurvive the initial exposure failed to resume normaldevelopment and died (Fig.·2C; paired t-test, one-tailedP<0.05). For the 90·days exposure, the sample size was toosmall to make meaningful statistical inferences (data notshown). Embryos that survived 1·week of aerobic recoveryappeared to complete development normally and eventuallyhatched or entered diapause III.
Anoxia-induced quiescence
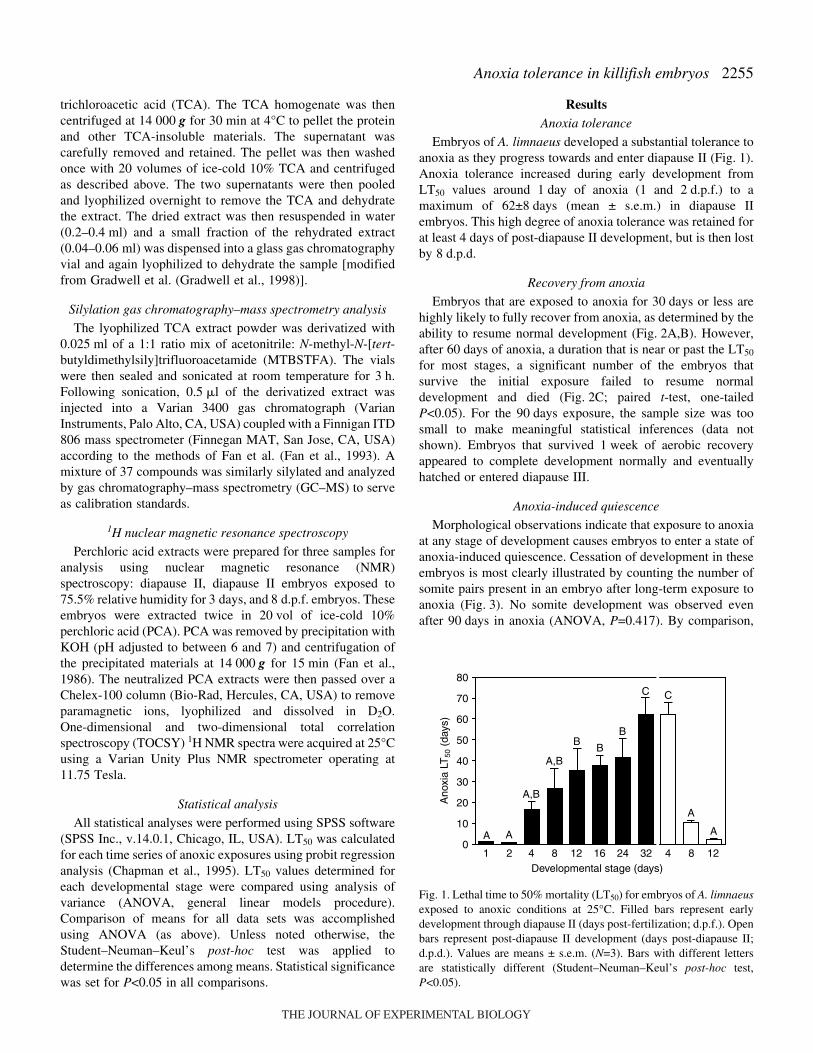
Morphological observations indicate that exposure to anoxiaat any stage of development causes embryos to enter a state ofanoxia-induced quiescence. Cessation of development in theseembryos is most clearly illustrated by counting the number ofsomite pairs present in an embryo after long-term exposure toanoxia (Fig.·3). No somite development was observed evenafter 90·days in anoxia (ANOVA, P=0.417). By comparison,
1 2 4 8 12 4 8 1216 24 320
10
20
30
40
50
60
70
80
A A
A,B
A
A
A,B
BB
B
C C
Developmental stage (days)
Ano
xia
LT50
(da
ys)
Fig.·1. Lethal time to 50% mortality (LT50) for embryos of A. limnaeusexposed to anoxic conditions at 25°C. Filled bars represent earlydevelopment through diapause II (days post-fertilization; d.p.f.). Openbars represent post-diapause II development (days post-diapause II;d.p.d.). Values are means ± s.e.m. (N=3). Bars with different lettersare statistically different (Student–Neuman–Keul’s post-hoc test,P<0.05).
THE JOURNAL OF EXPERIMENTAL BIOLOGY
2256
many of the control embryos (those that broke diapause IIspontaneously) had completed development and hatched priorto the 90·days anoxia time point (unpublished data).
One-dimensional and two-dimensional TOCSY 1H-NMR
The NMR analysis (Figs·S3, S4 in supplementary material)corroborates the GC–MS data presented below, by confirmingthe identity of a number of metabolites present in the embryoextracts. In addition, the NMR data revealed major metabolitesnot observed by GC–MS, including glycinebetaine (GB),phosphorylcholine (PC), and polysaccharides (broadresonances between 3.5 to 5.2·p.p.m. (Fig.·S3 in supplementary
material). These metabolites appeared to accumulate indiapause II embryos, but their response to anoxia was notinvestigated. GB is known to be a compatible solute involvedin osmoregulation whereas PC is important to phospholipidmetabolism. The accumulation of polysaccharides may reflectdevelopment of an energy reserve in the diapause II embryosin preparation for anoxia exposure or dehydration. The roles ofthese metabolites during diapause and exposure to anoxiawarrants further investigation.
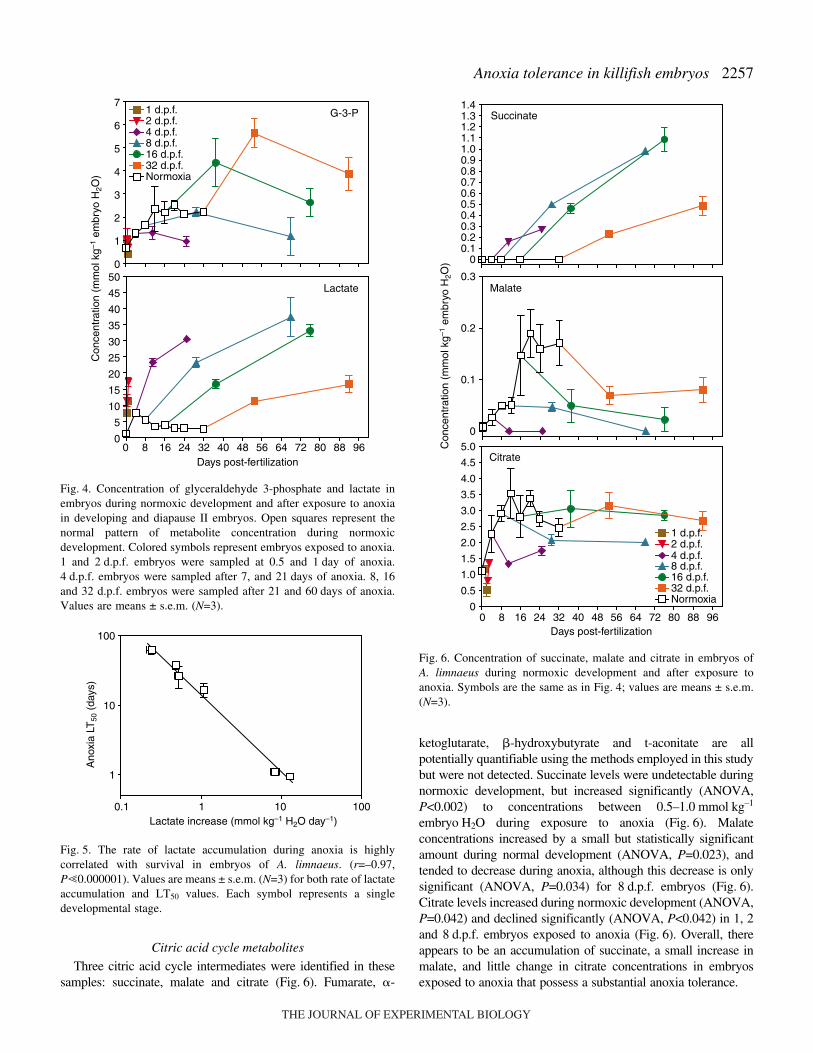
Glycolytic metabolites
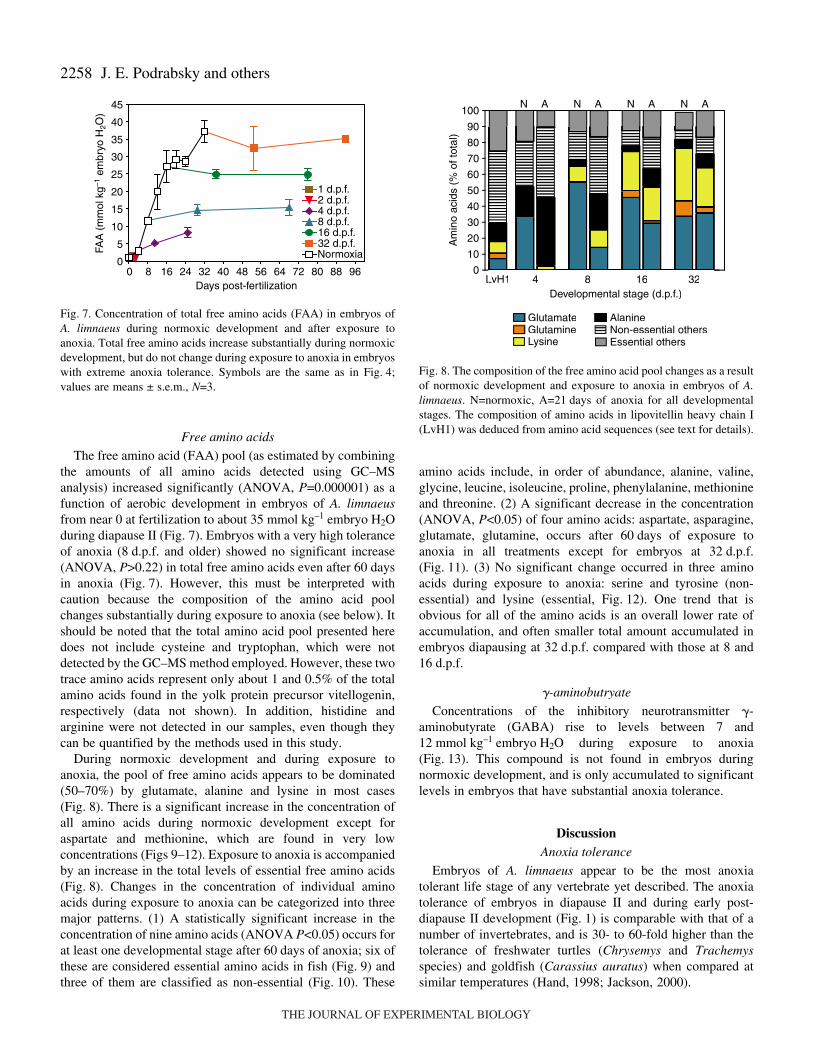
Only two glycolytic intermediates, glyceraldehyde 3-phosphate (G3P) and lactate, were detected in this study,despite the ability of these methods to identify several otherpotentially important metabolites such as pyruvate. Theconcentration of G3P increased from around0.5–2.0·mmol·kg–1·embryo·H2O during early developmentthrough diapause II in embryos incubated aerobically (Fig.·4),however this trend is not statistically significant (ANOVA,P=0.065). During exposure to anoxia, G3P concentrationincreased significantly in 1, 16, and 32·d.p.f. (ANOVA,P<0.014) but not in 2, 4 and 8·d.p.f. embryos. During normoxicdevelopment lactate increased significantly (ANOVA,P�0.000001) until 8·d.p.f. and then declined as embryoscontinued to develop and enter diapause II (Fig.·4). This patternagrees both qualitatively and quantitatively with lactate levelspreviously reported for normoxic embryos (Podrabsky andHand, 1999). During exposure to anoxia, lactate was the mostabundant metabolic end-product accumulated and reachedvalues between 30 and 40·mmol·kg–1·embryo·H2O (Fig.·4).The rate of lactate accumulation during anoxia is inverselycorrelated (r=–0.97, P�0.000001) with the anoxia tolerance ofthe embryos as estimated by the LT50 (Fig.·5). This pattern ofslower accumulation of metabolites in diapausing embryos isapparent in most of the compounds analyzed in this data setand is likely correlated with the metabolic rate of these embryosunder anoxia.
J. E. Podrabsky and others
02468
101214161820
02468
101214161820
02468
101214161820
A
B
C
Num
ber
of e
mbr
yos
surv
ivin
g
** *
*
No
data
4 8 12 4 8 1216 24 32Developmental stage (days)
Fig.·2. Aerobic recovery from anoxia in embryos of A. limnaeusexposed to anoxia for (A) 7, (B) 30 and (C) 60·days. Filled and openpairs of bars represent the number of embryos (out of a total of 20)initially surviving anoxia (filled) and those that resumed normaldevelopment after 1·week of aerobic recovery (open) from earlydevelopment through diapause II (age of embryos given in days post-fertilization). Hatched and open pairs of bars represent the number ofembryos initially surviving anoxia (hatched) and those that resumenormal development (open) after 1·week of aerobic recovery as post-diapause II embryos. The stages of these embryos are given as dayspost diapause II. Bars are means ± s.e.m. (N=3). Asterisks over theopen bars indicate a significant difference between initial survival ofanoxia and survival after 1·week of aerobic recovery (paired t-test,P<0.05, one-tailed).
0 10 20 30 40 50 600
10
20
3012 d.p.f.16 d.p.f.
Days in anoxia
Pai
rs o
f som
ites
Fig.·3. Anoxia induces quiescence in embryos of A. limnaeus. Thenumber of somite pairs does not increase during long-term exposure(ANOVA, P�0.05), indicating a state of anoxia-induced quiescence.Values are means ± s.e.m. (N=3).
THE JOURNAL OF EXPERIMENTAL BIOLOGY
2257Anoxia tolerance in killifish embryos
Citric acid cycle metabolites
Three citric acid cycle intermediates were identified in thesesamples: succinate, malate and citrate (Fig.·6). Fumarate, �-
ketoglutarate, �-hydroxybutyrate and t-aconitate are allpotentially quantifiable using the methods employed in this studybut were not detected. Succinate levels were undetectable duringnormoxic development, but increased significantly (ANOVA,P<0.002) to concentrations between 0.5–1.0·mmol·kg–1
embryo·H2O during exposure to anoxia (Fig.·6). Malateconcentrations increased by a small but statistically significantamount during normal development (ANOVA, P=0.023), andtended to decrease during anoxia, although this decrease is onlysignificant (ANOVA, P=0.034) for 8·d.p.f. embryos (Fig.·6).Citrate levels increased during normoxic development (ANOVA,P=0.042) and declined significantly (ANOVA, P<0.042) in 1, 2and 8·d.p.f. embryos exposed to anoxia (Fig.·6). Overall, thereappears to be an accumulation of succinate, a small increase inmalate, and little change in citrate concentrations in embryosexposed to anoxia that possess a substantial anoxia tolerance.
Fig.·4. Concentration of glyceraldehyde 3-phosphate and lactate inembryos during normoxic development and after exposure to anoxiain developing and diapause II embryos. Open squares represent thenormal pattern of metabolite concentration during normoxicdevelopment. Colored symbols represent embryos exposed to anoxia.1 and 2·d.p.f. embryos were sampled at 0.5 and 1·day of anoxia.4·d.p.f. embryos were sampled after 7, and 21·days of anoxia. 8, 16and 32 d.p.f. embryos were sampled after 21 and 60·days of anoxia.Values are means ± s.e.m. (N=3).
0.1 1 10 100
1
10
100
Lactate increase (mmol kg–1 H2O day–1)
Ano
xia
LT50
(da
ys)
Fig.·5. The rate of lactate accumulation during anoxia is highlycorrelated with survival in embryos of A. limnaeus. (r=–0.97,P�0.000001). Values are means ± s.e.m. (N=3) for both rate of lactateaccumulation and LT50 values. Each symbol represents a singledevelopmental stage.
Fig.·6. Concentration of succinate, malate and citrate in embryos ofA. limnaeus during normoxic development and after exposure toanoxia. Symbols are the same as in Fig.·4; values are means ± s.e.m.(N=3).
THE JOURNAL OF EXPERIMENTAL BIOLOGY
2258
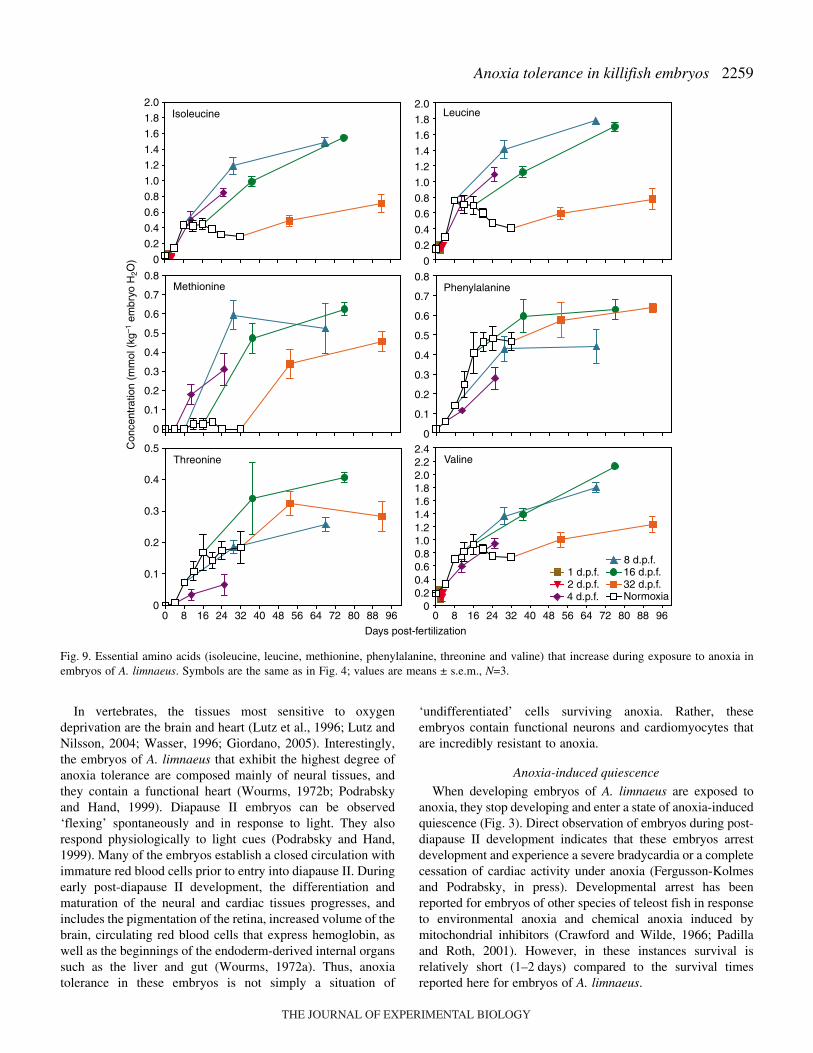
Free amino acids
The free amino acid (FAA) pool (as estimated by combiningthe amounts of all amino acids detected using GC–MSanalysis) increased significantly (ANOVA, P=0.000001) as afunction of aerobic development in embryos of A. limnaeusfrom near 0 at fertilization to about 35·mmol·kg–1 embryo H2Oduring diapause II (Fig.·7). Embryos with a very high toleranceof anoxia (8·d.p.f. and older) showed no significant increase(ANOVA, P>0.22) in total free amino acids even after 60·daysin anoxia (Fig.·7). However, this must be interpreted withcaution because the composition of the amino acid poolchanges substantially during exposure to anoxia (see below). Itshould be noted that the total amino acid pool presented heredoes not include cysteine and tryptophan, which were notdetected by the GC–MS method employed. However, these twotrace amino acids represent only about 1 and 0.5% of the totalamino acids found in the yolk protein precursor vitellogenin,respectively (data not shown). In addition, histidine andarginine were not detected in our samples, even though theycan be quantified by the methods used in this study.
During normoxic development and during exposure toanoxia, the pool of free amino acids appears to be dominated(50–70%) by glutamate, alanine and lysine in most cases(Fig.·8). There is a significant increase in the concentration ofall amino acids during normoxic development except foraspartate and methionine, which are found in very lowconcentrations (Figs 9–12). Exposure to anoxia is accompaniedby an increase in the total levels of essential free amino acids(Fig.·8). Changes in the concentration of individual aminoacids during exposure to anoxia can be categorized into threemajor patterns. (1) A statistically significant increase in theconcentration of nine amino acids (ANOVA P<0.05) occurs forat least one developmental stage after 60·days of anoxia; six ofthese are considered essential amino acids in fish (Fig.·9) andthree of them are classified as non-essential (Fig.·10). These
amino acids include, in order of abundance, alanine, valine,glycine, leucine, isoleucine, proline, phenylalanine, methionineand threonine. (2) A significant decrease in the concentration(ANOVA, P<0.05) of four amino acids: aspartate, asparagine,glutamate, glutamine, occurs after 60·days of exposure toanoxia in all treatments except for embryos at 32·d.p.f.(Fig.·11). (3) No significant change occurred in three aminoacids during exposure to anoxia: serine and tyrosine (non-essential) and lysine (essential, Fig.·12). One trend that isobvious for all of the amino acids is an overall lower rate ofaccumulation, and often smaller total amount accumulated inembryos diapausing at 32·d.p.f. compared with those at 8 and16·d.p.f.
�-aminobutryate
Concentrations of the inhibitory neurotransmitter �-aminobutyrate (GABA) rise to levels between 7 and12·mmol·kg–1·embryo·H2O during exposure to anoxia(Fig.·13). This compound is not found in embryos duringnormoxic development, and is only accumulated to significantlevels in embryos that have substantial anoxia tolerance.
DiscussionAnoxia tolerance
Embryos of A. limnaeus appear to be the most anoxiatolerant life stage of any vertebrate yet described. The anoxiatolerance of embryos in diapause II and during early post-diapause II development (Fig.·1) is comparable with that of anumber of invertebrates, and is 30- to 60-fold higher than thetolerance of freshwater turtles (Chrysemys and Trachemysspecies) and goldfish (Carassius auratus) when compared atsimilar temperatures (Hand, 1998; Jackson, 2000).
Fig.·7. Concentration of total free amino acids (FAA) in embryos ofA. limnaeus during normoxic development and after exposure toanoxia. Total free amino acids increase substantially during normoxicdevelopment, but do not change during exposure to anoxia in embryoswith extreme anoxia tolerance. Symbols are the same as in Fig.·4;values are means ± s.e.m., N=3.
0
10
20
30
40
50
60
70
80
90
100
Non-essential othersGlutamateGlutamineLysine
Alanine
Essential others
LvH1
N A N A N A N A
4 8 16 32
Am
ino
acid
s (%
of t
otal
)
Developmental stage (d.p.f.)
Non-essential othersGlutamateGlutamine
Alanine
LvH1 4 8 16 32Developmental stage (d.p.f.)
Fig.·8. The composition of the free amino acid pool changes as a resultof normoxic development and exposure to anoxia in embryos of A.limnaeus. N=normoxic, A=21·days of anoxia for all developmentalstages. The composition of amino acids in lipovitellin heavy chain I(LvH1) was deduced from amino acid sequences (see text for details).
THE JOURNAL OF EXPERIMENTAL BIOLOGY
2259Anoxia tolerance in killifish embryos
In vertebrates, the tissues most sensitive to oxygendeprivation are the brain and heart (Lutz et al., 1996; Lutz andNilsson, 2004; Wasser, 1996; Giordano, 2005). Interestingly,the embryos of A. limnaeus that exhibit the highest degree ofanoxia tolerance are composed mainly of neural tissues, andthey contain a functional heart (Wourms, 1972b; Podrabskyand Hand, 1999). Diapause II embryos can be observed‘flexing’ spontaneously and in response to light. They alsorespond physiologically to light cues (Podrabsky and Hand,1999). Many of the embryos establish a closed circulation withimmature red blood cells prior to entry into diapause II. Duringearly post-diapause II development, the differentiation andmaturation of the neural and cardiac tissues progresses, andincludes the pigmentation of the retina, increased volume of thebrain, circulating red blood cells that express hemoglobin, aswell as the beginnings of the endoderm-derived internal organssuch as the liver and gut (Wourms, 1972a). Thus, anoxiatolerance in these embryos is not simply a situation of
‘undifferentiated’ cells surviving anoxia. Rather, theseembryos contain functional neurons and cardiomyocytes thatare incredibly resistant to anoxia.
Anoxia-induced quiescence
When developing embryos of A. limnaeus are exposed toanoxia, they stop developing and enter a state of anoxia-inducedquiescence (Fig.·3). Direct observation of embryos during post-diapause II development indicates that these embryos arrestdevelopment and experience a severe bradycardia or a completecessation of cardiac activity under anoxia (Fergusson-Kolmesand Podrabsky, in press). Developmental arrest has beenreported for embryos of other species of teleost fish in responseto environmental anoxia and chemical anoxia induced bymitochondrial inhibitors (Crawford and Wilde, 1966; Padillaand Roth, 2001). However, in these instances survival isrelatively short (1–2·days) compared to the survival timesreported here for embryos of A. limnaeus.
0
0.2
0.4
0.6
0.8
1.0
1.2
1.4
1.6
1.8
2.0
0
0.2
0.4
0.6
0.8
1.0
1.2
1.4
1.6
1.8
2.0
0
0.1
0.2
0.3
0.4
0.5
0.6
0.7
0.8
0
0.1
0.2
0.3
0.4
0.5
0.6
0.7
0.8
0 8 16 24 32 40 48 56 64 72 80 88 960
0.1
0.2
0.3
0.4
0.5
0 8 16 24 32 40 48 56 64 72 80 88 960
0.20.40.60.81.01.21.41.61.82.02.22.4
1 d.p.f.2 d.p.f.4 d.p.f.
8 d.p.f.16 d.p.f.32 d.p.f.Normoxia
Days post-fertilization
Isoleucine Leucine
Methionine Phenylalanine
Threonine Valine
Con
cent
ratio
n (m
mol
(kg
–1 e
mbr
yo H
2O)
Fig.·9. Essential amino acids (isoleucine, leucine, methionine, phenylalanine, threonine and valine) that increase during exposure to anoxia inembryos of A. limnaeus. Symbols are the same as in Fig.·4; values are means ± s.e.m., N=3.
THE JOURNAL OF EXPERIMENTAL BIOLOGY
2260
Early post-diapause II embryos (4·d.p.d.) exhibit a toleranceof anoxia that is equal to that of diapause II embryos (Fig.·1).This result is impressive, considering the increased metabolismand complexity associated with further development in theseembryos (see above). It appears that there is a window of timeduring early post-diapause II development when the embryosretain the ability to enter a profound state of anoxia-inducedquiescence. This is similar to the situation for anoxia-inducedquiescence in post-diapause embryos of the brine shrimpArtemia franciscana (e.g. Hand and Gnaiger, 1988; Clegg,1997). Perhaps this extended tolerance of anoxia reflects theephemeral nature of these species’ habitats, where a return tolow oxygen levels might occur after developmental arrest isover. Thus, the evolution of diapause and anoxia-inducedquiescence appear to be linked in both of these distantly relatedspecies. This possible example of convergent evolution is
probably the result of high selection pressures generated inharsh and highly unpredictable ephemeral habitats.
Recovery from anoxia
Embryos exposed to anoxia for 30–40·days are able to fullyrecover from the anoxic insult (Fig.·2). However, after 60·daysof anoxia, many of the embryos fail to successfully resumedevelopment and eventually die. This failure to recover may bedue to metabolic failure associated with build-up of toxicamounts of lactate (Fig.·4). An alternative explanation is thatthe embryos suffer from damage caused by the reintroductionof oxygen after long-term anoxia in a manner similar toreperfusion injury associated with recovery from ischemia inmammalian tissues (e.g. Gross and Auchampach, 2007). If a‘reperfusion’ of oxygen into the embryos is indeed a source ofdamage after long-term anoxia, then comparing the metabolicchanges and gene expression patterns in embryos recoveringfrom short-term and long-term anoxia may lend insight into themechanisms that induce reperfusion injury.
General considerations for metabolite analysis in embryos
The levels of metabolites reported in this paper are fromwhole embryos. These embryos contain several compartmentsthat must be considered in the interpretation of these data: theperivitelline space, the embryonic tissues, and the yolk. Theperivitelline space is filled with perivitelline fluid (PVF) andcontains about 50% of the total embryo water (Podrabsky etal., 2001). This compartment surrounds the embryonic tissuesand yolk. The PVF is derived partially from the contents ofthe cortical vesicles and is known in many species of teleostfish to contain mostly large macromolecules that attract waterand cause osmotic swelling of the egg immediately followingfertilization (Eddy, 1974; Shephard, 1987). If we assume thatthe perivitelline space is devoid of the metabolites examinedin this study, then their effective concentrations in the embryo+ yolk compartments may be twice that reported, based ontotal embryo water content. The embryonic tissues surroundthe central yolk mass, and for most of the embryonic stagesobserved in this study constitute only 10–20% of the totalembryo mass. The embryonic tissues are separated from theyolk by the yolk syncytial layer, which is a known barrier todiffusion of water and small organic molecules, such ascryoprotectants, in freshwater fish embryos (e.g. Hagedorn etal., 1997). In addition, enzymes have been demonstrated to bedistributed in a non-uniform manner between the yolk andembryonic tissues in embryos of the loach Misgurnus fossilis(Klyachko et al., 1982). Thus, compartmentalization ofmetabolites and metabolic function is a distinct possibility andwithout specific information on where in the embryo/yolk/PVF system these compounds may be located we arelimited in our ability to interpret the results. However, thisstudy does identify the major metabolic pathways thatcontribute to anoxia tolerance in these embryos, and ourfindings represent a first critical step in mechanisticallyunderstanding the metabolic underpinnings of anoxiatolerance in this species.
Fig.·10. Non-essential amino acids (alanine, glycine and proline) thatincrease during exposure to anoxia in embryos of A. limnaeus.Symbols are the same as in Fig.·4; values are means ± s.e.m., N=3.
THE JOURNAL OF EXPERIMENTAL BIOLOGY
2261Anoxia tolerance in killifish embryos
Anaerobic end-product accumulation
In general, animals that can survive long bouts of anoxia relyon utilization of carbohydrates to fuel metabolism (Hochachkaand Somero, 2002). This is true of both the crucian carp andfreshwater turtle species, which have large glycogen reservesused to fuel anaerobic metabolism (Jackson, 2000; Lutz andNilsson, 2004). Metabolism appears to be dominated byglycolytic production of lactate during exposure of A. limnaeusembryos to anoxia (Fig.·4B). Levels of glycogen and glucosethat are presumably available to support anaerobic metabolismduring early development and diapause II, have beenpreviously reported for A. limnaeus (Podrabsky and Hand,1999). About 80–90% of the available glycosyl units are storedas glycogen, and after 2·d.p.f. the average amount of glycosylunits available for the production of lactate during earlydevelopment and diapause II is 36.2±1.0·nmol·embryo–1 (mean± s.e.m.), which would yield about 72.4·nmol of lactate perembryo. This glycogen reserve is similar to that of other fishspecies with similar size embryos such as loach and medaka(Yurowitzky and Milman, 1973; Hishida and Nakano, 1954),and an order of magnitude lower than that of trout embryos(Terner, 1968). Therefore, it does not appear that accumulationof large glycogen stores can explain the exceptional anoxiatolerance of this species.
The exact metabolic pathways that are used to supportmetabolism during anoxia in embryos of A. limnaeus have notyet been confirmed with biochemical studies. However, asimple analysis of end-products accumulated suggests thatavailable glycogen stores can support most, if not all, of theaccumulated compounds. The amounts of lactate, succinate and
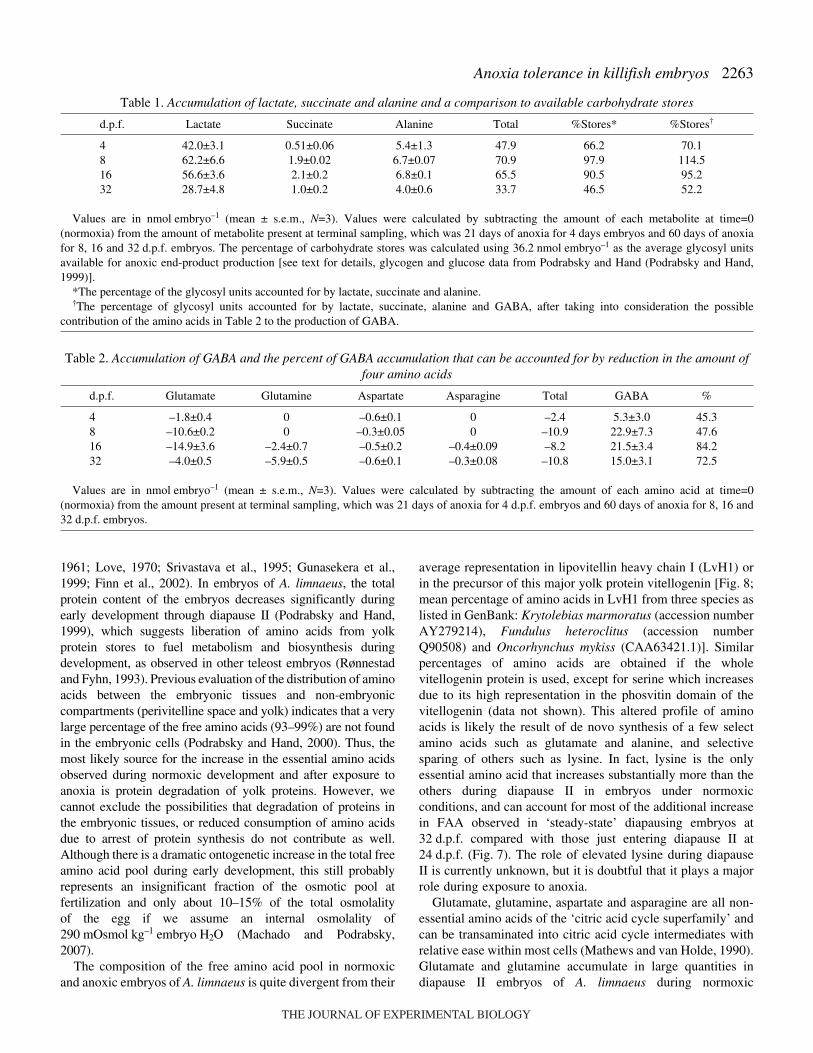
alanine produced after 21 (4·d.p.f.) or 60·days (8, 16, 32·d.p.f.)of anoxia are presented in nmol·embryo–1 in Table·1. Whenthese data are compared with the theoretical amount of three tofour carbon compounds that could be produced from glycogenand glucose, it is apparent that exhaustion of carbohydratestores may be a limiting factor in the survival of embryos4·d.p.f. and older. In contrast, embryos at 1 and 2·d.p.f. die longbefore they run out of fuel to support glycolytic metabolism(data not shown, but see Fig.·4) perhaps due to an inability tobuffer the acidosis that likely accompanies anoxic metabolism[2·moles of H+ per mole of glycosyl unit (Hochachka andMommsen, 1983)], but no data are available for intracellularpH changes associated with anoxia in this species. Roughcalculations based on the mean rate of lactate production indiapausing embryos (0.48±0.08·nmol·day–1) at 32·d.p.f. wouldsuggest an exhaustion of available glycosyl units after about151·days of anoxia. When the survival experiments wereterminated at 90·days of anoxia, about 20% of the 32·d.p.f.embryos survived the treatment, and thus it is possible thatavailable glycogen stores will ultimately limit survival ofanoxia in these embryos as well. The strong negativecorrelation between the rate of lactate production during anoxiaand survival of anoxia (Fig.·5) reinforces the importance ofmetabolic rate depression to long-term survival of anoxia inembryos of A. limnaeus.
Significant increases in succinate and alanine are alsoobserved in embryos of A. limnaeus that are exposed to anoxiaafter 4·d.p.f., although the magnitudes of these increases aredwarfed by lactate production (Figs·6, 10). It is important tonote that in 4, 8 and 16·d.p.f. embryos alanine increases five-
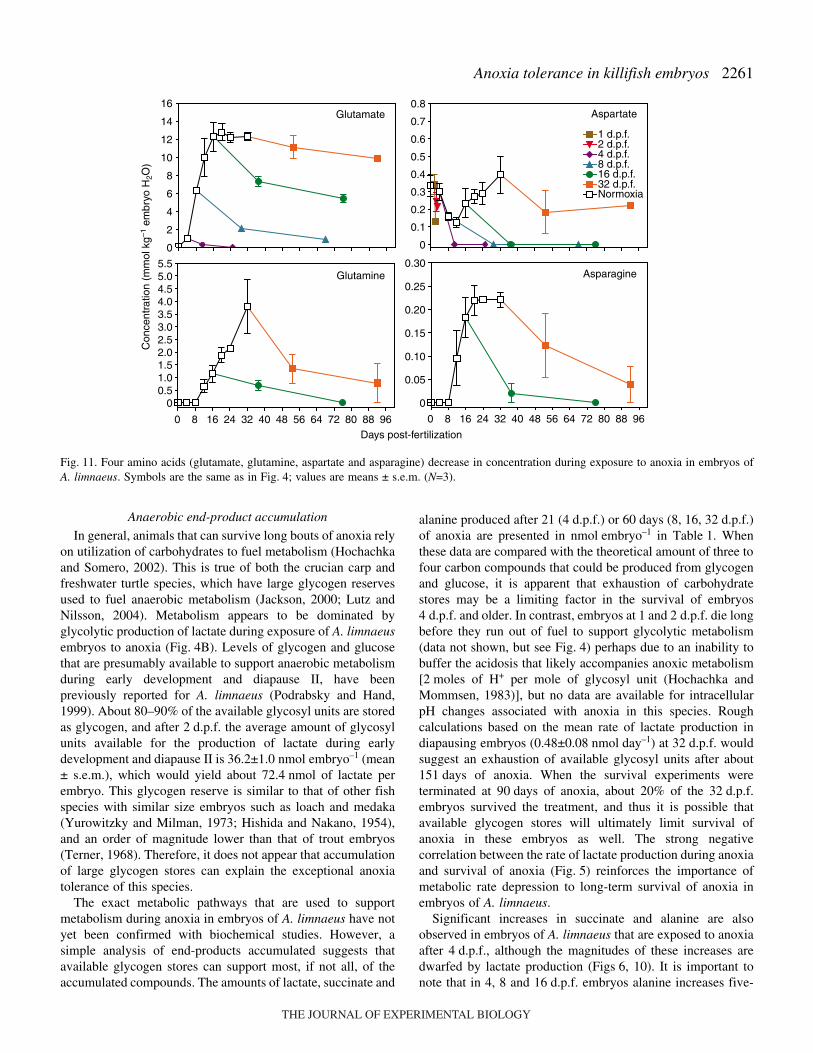
Fig.·11. Four amino acids (glutamate, glutamine, aspartate and asparagine) decrease in concentration during exposure to anoxia in embryos ofA. limnaeus. Symbols are the same as in Fig.·4; values are means ± s.e.m. (N=3).
THE JOURNAL OF EXPERIMENTAL BIOLOGY
2262
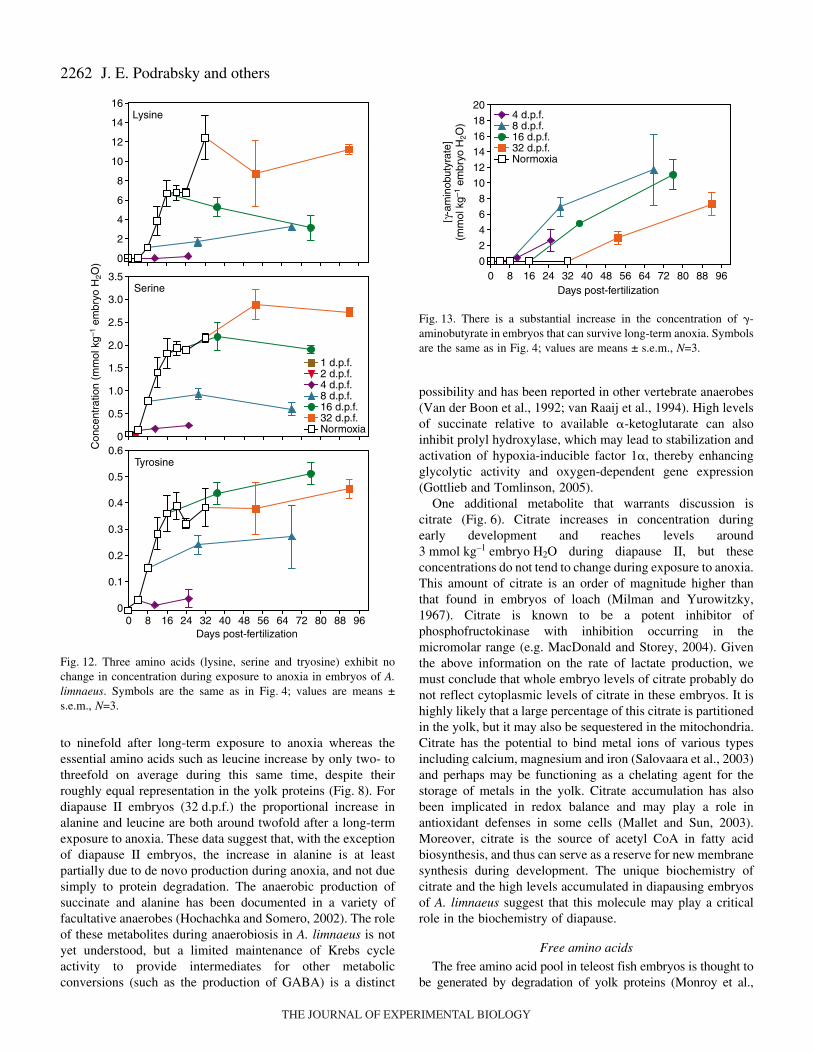
to ninefold after long-term exposure to anoxia whereas theessential amino acids such as leucine increase by only two- tothreefold on average during this same time, despite theirroughly equal representation in the yolk proteins (Fig.·8). Fordiapause II embryos (32·d.p.f.) the proportional increase inalanine and leucine are both around twofold after a long-termexposure to anoxia. These data suggest that, with the exceptionof diapause II embryos, the increase in alanine is at leastpartially due to de novo production during anoxia, and not duesimply to protein degradation. The anaerobic production ofsuccinate and alanine has been documented in a variety offacultative anaerobes (Hochachka and Somero, 2002). The roleof these metabolites during anaerobiosis in A. limnaeus is notyet understood, but a limited maintenance of Krebs cycleactivity to provide intermediates for other metabolicconversions (such as the production of GABA) is a distinct
possibility and has been reported in other vertebrate anaerobes(Van der Boon et al., 1992; van Raaij et al., 1994). High levelsof succinate relative to available �-ketoglutarate can alsoinhibit prolyl hydroxylase, which may lead to stabilization andactivation of hypoxia-inducible factor 1�, thereby enhancingglycolytic activity and oxygen-dependent gene expression(Gottlieb and Tomlinson, 2005).
One additional metabolite that warrants discussion iscitrate (Fig.·6). Citrate increases in concentration duringearly development and reaches levels around3·mmol·kg–1·embryo·H2O during diapause II, but theseconcentrations do not tend to change during exposure to anoxia.This amount of citrate is an order of magnitude higher thanthat found in embryos of loach (Milman and Yurowitzky,1967). Citrate is known to be a potent inhibitor ofphosphofructokinase with inhibition occurring in themicromolar range (e.g. MacDonald and Storey, 2004). Giventhe above information on the rate of lactate production, wemust conclude that whole embryo levels of citrate probably donot reflect cytoplasmic levels of citrate in these embryos. It ishighly likely that a large percentage of this citrate is partitionedin the yolk, but it may also be sequestered in the mitochondria.Citrate has the potential to bind metal ions of various typesincluding calcium, magnesium and iron (Salovaara et al., 2003)and perhaps may be functioning as a chelating agent for thestorage of metals in the yolk. Citrate accumulation has alsobeen implicated in redox balance and may play a role inantioxidant defenses in some cells (Mallet and Sun, 2003).Moreover, citrate is the source of acetyl CoA in fatty acidbiosynthesis, and thus can serve as a reserve for new membranesynthesis during development. The unique biochemistry ofcitrate and the high levels accumulated in diapausing embryosof A. limnaeus suggest that this molecule may play a criticalrole in the biochemistry of diapause.
Free amino acids
The free amino acid pool in teleost fish embryos is thought tobe generated by degradation of yolk proteins (Monroy et al.,
Fig.·12. Three amino acids (lysine, serine and tryosine) exhibit nochange in concentration during exposure to anoxia in embryos of A.limnaeus. Symbols are the same as in Fig.·4; values are means ±s.e.m., N=3.
0 8 16 24 32 40 48 56 64 72 80 88 960
2
4
6
8
10
12
14
16
18
204 d.p.f.8 d.p.f.16 d.p.f.32 d.p.f.Normoxia
Days post-fertilization
[γ-a
min
obut
yrat
e](m
mol
kg–1
em
bryo
H2O
)
Fig.·13. There is a substantial increase in the concentration of �-aminobutyrate in embryos that can survive long-term anoxia. Symbolsare the same as in Fig.·4; values are means ± s.e.m., N=3.
THE JOURNAL OF EXPERIMENTAL BIOLOGY
2263Anoxia tolerance in killifish embryos
1961; Love, 1970; Srivastava et al., 1995; Gunasekera et al.,1999; Finn et al., 2002). In embryos of A. limnaeus, the totalprotein content of the embryos decreases significantly duringearly development through diapause II (Podrabsky and Hand,1999), which suggests liberation of amino acids from yolkprotein stores to fuel metabolism and biosynthesis duringdevelopment, as observed in other teleost embryos (Rønnestadand Fyhn, 1993). Previous evaluation of the distribution of aminoacids between the embryonic tissues and non-embryoniccompartments (perivitelline space and yolk) indicates that a verylarge percentage of the free amino acids (93–99%) are not foundin the embryonic cells (Podrabsky and Hand, 2000). Thus, themost likely source for the increase in the essential amino acidsobserved during normoxic development and after exposure toanoxia is protein degradation of yolk proteins. However, wecannot exclude the possibilities that degradation of proteins inthe embryonic tissues, or reduced consumption of amino acidsdue to arrest of protein synthesis do not contribute as well.Although there is a dramatic ontogenetic increase in the total freeamino acid pool during early development, this still probablyrepresents an insignificant fraction of the osmotic pool atfertilization and only about 10–15% of the total osmolalityof the egg if we assume an internal osmolality of290·mOsmol·kg–1·embryo·H2O (Machado and Podrabsky,2007).
The composition of the free amino acid pool in normoxicand anoxic embryos of A. limnaeus is quite divergent from their
average representation in lipovitellin heavy chain I (LvH1) orin the precursor of this major yolk protein vitellogenin [Fig.·8;mean percentage of amino acids in LvH1 from three species aslisted in GenBank: Krytolebias marmoratus (accession numberAY279214), Fundulus heteroclitus (accession numberQ90508) and Oncorhynchus mykiss (CAA63421.1)]. Similarpercentages of amino acids are obtained if the wholevitellogenin protein is used, except for serine which increasesdue to its high representation in the phosvitin domain of thevitellogenin (data not shown). This altered profile of aminoacids is likely the result of de novo synthesis of a few selectamino acids such as glutamate and alanine, and selectivesparing of others such as lysine. In fact, lysine is the onlyessential amino acid that increases substantially more than theothers during diapause II in embryos under normoxicconditions, and can account for most of the additional increasein FAA observed in ‘steady-state’ diapausing embryos at32·d.p.f. compared with those just entering diapause II at24·d.p.f. (Fig.·7). The role of elevated lysine during diapauseII is currently unknown, but it is doubtful that it plays a majorrole during exposure to anoxia.
Glutamate, glutamine, aspartate and asparagine are all non-essential amino acids of the ‘citric acid cycle superfamily’ andcan be transaminated into citric acid cycle intermediates withrelative ease within most cells (Mathews and van Holde, 1990).Glutamate and glutamine accumulate in large quantities indiapause II embryos of A. limnaeus during normoxic
Table·1. Accumulation of lactate, succinate and alanine and a comparison to available carbohydrate stores
d.p.f. Lactate Succinate Alanine Total %Stores* %Stores†
Values are in nmol·embryo–1 (mean ± s.e.m., N=3). Values were calculated by subtracting the amount of each metabolite at time=0(normoxia) from the amount of metabolite present at terminal sampling, which was 21·days of anoxia for 4·days embryos and 60·days of anoxiafor 8, 16 and 32·d.p.f. embryos. The percentage of carbohydrate stores was calculated using 36.2·nmol·embryo–1 as the average glycosyl unitsavailable for anoxic end-product production [see text for details, glycogen and glucose data from Podrabsky and Hand (Podrabsky and Hand,1999)].
*The percentage of the glycosyl units accounted for by lactate, succinate and alanine.†The percentage of glycosyl units accounted for by lactate, succinate, alanine and GABA, after taking into consideration the possible
contribution of the amino acids in Table·2 to the production of GABA.
Table·2. Accumulation of GABA and the percent of GABA accumulation that can be accounted for by reduction in the amount offour amino acids
d.p.f. Glutamate Glutamine Aspartate Asparagine Total GABA %
Values are in nmol·embryo–1 (mean ± s.e.m., N=3). Values were calculated by subtracting the amount of each amino acid at time=0(normoxia) from the amount present at terminal sampling, which was 21·days of anoxia for 4 d.p.f. embryos and 60·days of anoxia for 8, 16 and32 d.p.f. embryos.
THE JOURNAL OF EXPERIMENTAL BIOLOGY
2264
development. These amino acids are consumed duringexposure to anoxia (Fig.·11), and thus their accumulationduring early development and diapause may be an importantpreparation for the metabolic changes associated with exposureto anoxia. Similarly, decreases in brain tissue glutamateconcentrations have been documented for turtles and cruciancarp (reviewed by Lutz et al., 1996). The amino acids areprobably used as substrates for the production of GABA (seebelow). However, even if 100% of these amino acids areshunted to the production of GABA, there is still a substantialproportion of GABA which cannot be accounted for (Table·2)that could be produced from glycogen stores (Table·1).
�-aminobutyrate
The metabolic pathways that support �-aminobutyrate(GABA) production and degradation are well characterized invertebrate nervous tissues. GABA is typically synthesized fromglutamate by the enzyme glutamate decarboxylase and isdegraded in post-synaptic neurons to succinate (Turner andWhittle, 1983). The large decreases in glutamate and glutamineobserved in embryos exposed to anoxia are probably associatedwith synthesis of GABA. The production of GABA at theexpense of glutamate would seem to be beneficial due to thedecrease in glutamate (an excitatory neurotransmitter), aconsumption of protons, and the increase in GABA asdiscussed above. The degradation pathways for GABA lead tosuccinate, and thus perhaps the accumulation of succinateduring anoxia may be partially due to post-synaptic degradationof GABA.
The evidence available on the role of GABA during oxygenlimitation suggests that GABA is acting to limit excitotoxicneuronal cell death in embryos of A. limnaeus exposed toanoxia. GABA is the most abundant inhibitoryneurotransmitter in the adult vertebrate central nervous system(Turner and Whittle, 1983; Martyniuk et al., 2005) and isgenerally thought to protect the brain of a variety of organismsfrom excitotoxic cell death during oxygen limitation (Lutz andMilton, 2004; Cheung et al., 2006). The best studied receptorsfor GABA are the GABAA receptors, which are ligand-gatedchloride channels (Stephenson, 1995). The action of GABA viathese receptors as excitatory or inhibitory is dependent on theconcentration of intracellular chloride ions ([Cl–i]), with low[Cl–i] resulting in inhibition (Cheung et al., 2006; Tyzio et al.,2006). Recent reports indicate that regulation of [Cl–i] viaexpression of the NKCC1 electroneutral cation–chloridecotransporter may play a critical role in protecting neurons ofa variety of organisms during exposure to hypoxia or ischemia(Cheung et al., 2006; Tyzio et al., 2006).
GABA has been shown to play important roles in thedevelopment of the vertebrate central nervous system (CNS).During development and maturation of the CNS, GABA isknown to act as an excitatory neurotransmitter (Tyzio et al.,2006). The excitatory actions of GABA are due to a high [Cl–
i]early in development (Cherubini et al., 1991) prior to theinsertion of Cl transporters (see above) into the neuronalmembrane. Insertion of the Cl– transporters causes a decrease
in [Cl–i] and GABA then assumes an inhibitory role. Theaccumulation of high levels of GABA in embryos of A.limnaeus suggests that it is likely to be inhibitory at this stageof development. Future studies might examine at what stage indevelopment the Cl– transporter appears in brain tissue.
In embryos of the teleost fish Gasterosteus aculeatus,GABA is the first neurotransmitter to be expressed in thecentral nervous system and is thought to play a role in nervoussystem patterning and in the establishment of the early axonalscaffold (Ekström and Ohlin, 1995). Presently, there is noinformation on the development of GABAergic neurons inembryos of A. limnaeus. The lack of detectable GABA innormoxic embryos may indicate that these neurons have not yetdeveloped or are very few in number in A. limnaeus embryosentering diapause II. However, the large increases observed inGABA concentration during exposure to anoxia could act as asignal to activate the expression of genes involved in GABA-mediated signaling, as has been shown in a variety ofvertebrates including goldfish (Martyniuk et al., 2005). Indeed,in anoxic turtle brains a rise in GABA is accompanied by anincrease in GABAA receptors (Lutz and Milton, 2004), whichis thought to strengthen the inhibitory effects of GABA. Thecomplex interaction between GABA production and theexpression of GABA-related genes, and the pivotal role thatGABA plays in the development of the vertebrate CNSsuggests that production of GABA during anoxia may altergene expression patterns that could have lasting effects on thedevelopment of the CNS in embryos of A. limnaeus.
In addition to its role in the CNS, GABA is known to playa role in the physiology of a number of organ systems,including the heart. GABAB receptors are known to beexpressed in mammalian cardiomyocytes, and activation ofthese channels is thought to result in post-synaptic inhibitionand subsequent protection of cardiac tissue from ischemia(Lorente et al., 2000). Thus, GABA may have a role insupporting survival of cells during anoxia outside of the CNSin embryos of A. limnaeus. A critical next step in elucidatingthe role of GABA in the tolerance of anoxia in A. limnaeus willbe to establish the compartmentalization of GABA within theembryo and establish which receptors (if any) are expressed inthe various tissues of the embryo.
Diapause embryos are ‘primed’ for anoxia tolerance
Metabolic depression is supported in most organisms by acoordinated downregulation of energy consuming and energyproducing pathways (Hand and Hardewig, 1996; Hand, 1998;Hochachka and Somero, 2002). In general, protein synthesisand ion pumping are the two most energetically expensiveprocesses contributing to the basal metabolic rate of a cell(Buttgereit and Brand, 1995; Rolfe and Brown, 1997). Acommon response in all animals that survive long-term anoxiais a downregulation of protein synthesis, and a reduction in ionleakage, which results in reduced ion motive ATPase activities(Hand and Hardewig, 1996). Entry into diapause II in embryosof A. limnaeus is associated with a substantial decrease inmetabolic rate as estimated by both oxygen consumption and
J. E. Podrabsky and others
THE JOURNAL OF EXPERIMENTAL BIOLOGY
2265Anoxia tolerance in killifish embryos
heat dissipation (Podrabsky and Hand, 1999). In addition,anaerobic metabolic pathways are thought to be making asignificant contribution to overall metabolism in diapause IIembryos, even though they are incubated under aerobicconditions (Podrabsky and Hand, 1999). Rates of proteinsynthesis are severely reduced in diapause II embryoscompared to developing embryos, which can account for about30% of the overall depression in metabolic rate (Podrabsky andHand, 1999). Recently, we have found that embryos of A.limnaeus have very low Na+-K+-ATPase activity during all ofearly development, and levels of this enzyme do not increasesubstantially until about 8·d.p.d. (Machado and Podrabsky,2007). Therefore, it is logical to hypothesize that ionhomeostasis with the environment may not be a significantmetabolic demand in these embryos. Thus, the two mostimportant biochemical adjustments associated with metabolicdepression and survival of anoxia, reduction of rates of proteinsynthesis and reduced ion pumping, have already been made inaerobically incubated diapausing embryos. In addition,diapausing embryos of A. limnaeus accumulate large stores ofglutamate and glutamine during normal development, whichcan be easily converted into GABA for protection of neuraltissues. Based on these observations, it appears that diapauseII embryos of A. limnaeus have already made the adjustmentsnecessary to survive anoxia, prior to any anoxic exposure, andare thus ‘primed’ for survival of anoxia as part of their normaldevelopmental program. Importantly, this high tolerance ofanoxia is retained during early post-diapause II developmentand thus embryos may break diapause and still survive longbouts of anoxia. The ecological and evolutionary implicationsof ‘preparing’ for anoxia are intriguing and further explorationof this system seems likely to yield interesting insights into theecology and evolution of anoxia tolerance in vertebrates.
This work was supported by NSF grant IBN 0344578 andAHA grant 0335286N to J.E.P., NSF grant IBN 0133184 toG.N.S., and EPA grant R819658 to T.W.M.F. The authorsalso thank Dr Andrew Lane for the use of NMR Facility at theNational Institute for Medical Research, London, UK.
ReferencesButtgereit, F. and Brand, M. D. (1995). A hierarchy of ATP-consuming
processes in mammalian cells. Biochem. J. 312, 163-167.Chapman, G. A., Denton, D. L. and Lazorchak, J. M. (1995). Short-term
methods for estimating the chronic toxicity of effluents and receiving waterto west coast marine and estuarine organisms (1st edn). EnvironmentalProtection Agency EPA/600/R-95-136, http://www.epa.gov/nerleerd/westmethman.htm.
Cherubini, E., Gaiarsa, J. L. and Ben-Ari, Y. (1991). GABA: an excitatorytransmitter in early postnatal life. Trends Neurosci. 14, 515-519.
Cheung, U., Moghaddasi, M., Hall, H. L., Smith, J. J. B., Buck, L. T. andWoodin, M. A. (2006). Excitatory actions of GABA mediate severe-hypoxia-induced depression of neuronal activity in the pond snail (Lymnaeastagnalis). J. Exp. Biol. 209, 4429-4435.
Clegg, J. S. (1997). Embryos of Artemia franciscana survive four years ofcontinuous anoxia: the case for complete metabolic rate depression. J. Exp.Biol. 200, 467-475.
Crawford, R. B. and Wilde, C. E. J. (1966). Cellular differentiation in the
anamniota II. Oxygen dependency and energetics requirements during earlydevelopment of teleosts and urodeles. Exp. Cell Res. 44, 453-470.
Eddy, F. B. (1974). Osmotic properties of the perivitelline fluid and someproperties of the chorion of Atlantic salmon eggs (Salmo salar). Zool. Lond.174, 237-243.
Ekström, P. and Ohlin, L.-M. (1995). Ontogeny of GABA-immunoreactiveneurons in the central nervous system in a teleost, Gasterosteus aculeatusL. J. Chem. Neuroanat. 94, 271-288.
Fan, T. W. M., Higashi, R. M., Lane, A. N. and Jardetzky, O. (1986).Combined use of 1H-NMR and GC–MS for metabolite monitoring and invivo 1H-NMR assignments. Biochim. Biophys. Acta 882, 154-167.
Fan, T. W. M., Colmer, T. D., Lane, A. M. and Higashi, R. M. (1993).Determination of metabolites by 1H NMR and GC: analysis for organicosmolytes in crude tissue extracts. Anal. Biochem. 214, 260-271.
Fergusson-Kolmes, L. and Podrabsky, J. E. (in press). Differential effectsof anoxia on heart activity in anoxia-tolerant and anoxia-sensitive embryosof the annual killifish Austrofundulus limnaeus. J. Exp. Zool.
Finn, R. N., Østby, G. C., Norberg, B. and Fyhn, H. J. (2002). In vivo oocytehydration in Atlantic halibut (Hippoglossus hippoglossus); proteolyticliberation of free amino acids, and ion transport, are driving forces forosmotic water influx. J. Exp. Biol. 205, 211-224.
Giordano, F. J. (2005). Oxygen, oxidative stress, hypoxia, and heart failure.J. Clin. Invest. 115, 500-508.
Gottlieb, E. and Tomlinson, I. P. M. (2005). Mitochondrial tumoursuppressors: a genetic and biochemical update. Nat. Rev. Cancer 5, 857-866.
Gradwell, M. J., Fan, T. W. M. and Lane, A. N. (1998). Analysis ofphosphorylated metabolites in crayfish extracts by two-dimensional 1H-31PNMR heteronuclear total correlation spectroscopy (hetero TOCSY). Anal.Biochem. 263, 139-149.
Gross, G. J. and Auchampach, J. A. (2007). Reperfusion injury: does it exist?J. Mol. Cell. Cardiol. 42, 12-18.
Gunasekera, R. M., De Silva, S. S. and Ingram, B. A. (1999). The aminoacid profiles in developing eggs and larvae of the freshwater Percichthyidfishes, trout cod, Maccullochella macquariensis and Murray cod,Maccullochella peelii peelii. Aquat. Living Resour. 12, 255-261.
Hagedorn, M., Kleinhans, F. W., Wildt, D. E. and Rall, W. F. (1997). Chillsensitivity and cryoprotectant permeability of dechorionated zebrafishembryos, Brachydanio rerio. Cryobiology 34, 251-263.
Hand, S. C. (1998). Quiescence in Artemia franciscana embryos: reversiblearrest of metabolism and gene expression at low oxygen levels. J. Exp. Biol.201, 1233-1242.
Hand, S. C. and Gnaiger, E. (1988). Anaerobic dormancy quantified inArtemia embryos: a calorimetric test of the control mechanism. Science 239,1425-1427.
Hand, S. C. and Hardewig, I. (1996). Downregulation of cellular metabolismduring environmental stress: mechanisms and implications. Annu. Rev.Physiol. 58, 539-563.
Hochachka, P. W. and Mommsen, T. P. (1983). Protons and anaerobiosis.Science 219, 1391-1397.
Hochachka, P. W. and Somero, G. N. (2002). Biochemical Adaptation.Mechanism and Process in Physiological Evolution. New York: OxfordUniversity Press.
Hishida, T. and Nakano, E. (1954). Respiratory metabolism during fishdevelopment. Embryologia 2, 67-79.
Jackson, D. C. (2000). Living without oxygen: lessons from the freshwaterturtle. Comp. Biochem. Physiol. 125A, 299-315.
Klyachko, O. S., Korzh, V. P., Gorgolyuk, S. I., Timofeev, A. V. andNeyfakh, A. A. (1982). Nonuniform distribution of enzymes in fish eggs. J.Exp. Zool. 222, 137-148.
Krumschnabel, G. (2000). Cellular and molecular basis of anoxia-toleranceand -intolerance in vertebrates: comparative studies using hepatocytes fromgoldfish and trout. Recent Res. Dev. Comp. Biochem. Physiol. 1, 1-11.
Lorente, P., Lacampagne, A., Pouzeratte, Y., Richards, S., Malitschek, B.,Kuhn, R., Bettler, B. and Vassort, G. (2000). �-aminobutyric acid type Breceptors are expressed and functional in mammalian cardiomyocytes. Proc.Natl. Acad. Sci. USA 97, 8664-8669.
Love, R. M. (1970). The Chemical Biology of Fishes. London: Academic Press.Lutz, P. L. and Milton, S. L. (2004). Negotiating brain anoxia survival in the
turtle. J. Exp. Biol. 207, 3141-3147.Lutz, P. L. and Nilsson, G. E. (2004). Vertebrate brains at the pilot light.
Respir. Physiol. Neurobiol. 141, 285-296.Lutz, P. L., Nilsson, G. E. and Peréz-Pinzón, M. A. (1996). Anoxia tolerant
animals from a neurobiological perspective. Comp. Biochem. Physiol. 113B,3-13.
THE JOURNAL OF EXPERIMENTAL BIOLOGY
2266
MacDonald, J. A. and Storey, K. B. (2004). Temperature and phosphateeffects on allosteric phenomena of phosphofructokinase from a hibernatingground squirrel (Spermophilus lateralis). FEBS J. 272, 120-128.
Machado, B. E. and Podrabsky, J. E. (2007). Salinity tolerance in diapausingembryos of the annual killifish Austrofundulus limnaeus is supported byexceptionally low water and ion permeability. J. Comp. Physiol. B In press.
Mallet, R. T. and Sun, J. (2003). Antioxidant properties of myocardial fuels.Mol. Cell. Biochem. 253, 103-111.
Martyniuk, C. J., Crawford, A. B., Hogan, N. S. and Trudeau, V. L.(2005). GABAergic modulation of the expression of genes involved inGABA synaptic transmission and stress in the hypothalamus andtelencephalon of the female goldfish (Carassius auratus). J.Neuroendocrinol. 17, 269-275.
Mathews, C. K. and van Holde, K. E. (1990). Biochemistry. Redwood City,CA: Benjamin Cummings Publishing.
Milman, L. S. and Yurowitzky, Y. G. (1967). The control of glycolysis inearly embryogenesis. Biochim. Biophys. Acta 148, 362-371.
Monroy, A., Ishida, M. and Nakano, E. (1961). The pattern of transfer of theyolk material to the embryo during the development of the teleostean fish,Oryzias latipes. Embryologia 6, 151-158.
Myers, G. S. (1952). Annual fishes. Aquarium J. 23, 125-141.Padilla, P. A. and Roth, M. B. (2001). Oxygen deprivation causes suspended
animation in the zebrafish embryo. Proc. Natl. Acad. Sci. USA 98, 7331-7335.
Podrabsky, J. E. (1999). Husbandry of the annual killifish Austrofunduluslimnaeus with special emphasis on the collection and rearing of embryos.Environ. Biol. Fishes 54, 421-431.
Podrabsky, J. E. and Hand, S. C. (1999). The bioenergetics of embryonicdiapause in an annual killifish, Austrofundulus limnaeus. J. Exp. Biol. 202,2567-2580.
Podrabsky, J. E. and Hand, S. C. (2000). Depression of protein synthesisduring diapause in embryos of the annual killifish Austrofundulus limnaeus.Physiol. Biochem. Zool. 73, 799-808.
Podrabsky, J. E., Hrbek, T. and Hand, S. C. (1998). Physical and chemicalcharacteristics of ephemeral pond habitats in the Maracaibo basin and Llanosregion of Venezuela. Hydrobiologia 362, 67-78.
Podrabsky, J. E., Carpenter, J. F. and Hand, S. C. (2001). Survival of waterstress in annual fish embryos: dehydration avoidance and egg envelopeamyloid fibers. Am. J. Physiol. 280, R123-R131.
Rolfe, D. F. S. and Brown, G. C. (1997). Cellular energy utilization andmolecular origin of standard metabolic rate in mammals. Physiol. Rev. 77,731-758.
Rønnestad, I. and Fyhn, H. J. (1993). Metabolic aspects of free amino acidsin developing marine fish eggs and larvae. Rev. Fish. Sci. 1, 239-259.
Salovaara, S., Sandberg, A. S. and Andlid, T. (2003). Combined impact ofpH and organic acids on iron uptake by Caco-2 cells. J. Agric. Food Chem.51, 7820-7824.
Shephard, K. L. (1987). Ion-exchange phenomena regulate the environmentof embryos in the eggs of freshwater fish. Comp. Biochem. Physiol. 88A,659-662.
Srivastava, R. K., Brown, J. A. and Shahidi, F. (1995). Changes in the aminoacid pool during embryonic development of cultured and wild Atlanticsalmon (Salmo salar). Aquaculture 131, 115-124.
Stephenson, F. A. (1995). The GABAA receptors. Biochem. J. 310, 1-9.Terner, C. (1968). Studies of metabolism in embryonic development–III.
Glycogenolysis and gluconeogenesis in trout embryos. Comp. Biochem.Physiol. 25, 989-1003.
Thomerson, J. and Taphorn, D. (1992). The annual killifishes of Venezuelapart I: Maracaibo basin and coastal plain species. Trop. Fish HobbyistJanuary, 70-96.
Turner, A. J. and Whittle, S. R. (1983). Biochemical dissection of the �-aminobutyrate synapse. Biochem. J. 209, 29-41.
Tyzio, R., Cossart, R., Khalilov, I., Minlebaev, M., Hübner, C. A., Represa,A., Ben-Ari, Y. and Khazipov, R. (2006). Maternal oxytocin triggers atransient inhibitory switch in GABA signaling in the fetal brain duringdelivery. Science 314, 1788-1792.
Van der Boon, J., Eelkema, F. A., van den Thillart, G. E. E. J. M. andAddink, A. D. F. (1992). Influence of anoxia on free amino acid levels inblood, liver and skeletal muscles of the goldfish, Carassius auratus L. Comp.Biochem. Physiol. 101B, 193-198.
van Raaij, M., van den Thillart, G. and Addink, A. (1994). Metabolism of1-14C-acetate and 1-14C-leucine by anoxic goldfish (Carassius auratus, L.):evidence for anaerobic lipid synthesis. Physiol. Zool. 67, 673-692.
Wasser, J. S. (1996). Maintenance of cardiac function during anoxia in turtles:from cell to organism. Comp. Biochem. Physiol. 113B, 15-22.
Wourms, J. P. (1972a). Developmental biology of annual fishes I. Stages inthe normal development of Austrofundulus myersi Dahl. J. Exp. Zool. 182,143-168.
Wourms, J. P. (1972b). The developmental biology of annual fishes III. Pre-embryonic and embryonic diapause of variable duration in the eggs of annualfishes. J. Exp. Zool. 182, 389-414.
Yurowitzky, Y. G. and Milman, L. S. (1973). Factors responsible forglycogenolysis acceleration in early embryogenesis of teleosts. WilhelmRouxs Arch. 173, 9-21.

![Bluefin Killifish (Lucania goodei) ERSS - FWS · 2018. 9. 27. · “Bluefin Killifish eggs hatched with ~80% success at 0 and 10 PSU [practical salinity unit, equivalent to ppt],](https://static.documents.pub/doc/80x56/6137f6040ad5d2067648f6bc/bluefin-killifish-lucania-goodei-erss-fws-2018-9-27-aoebluefin-killifish.jpg)


