Extreme Extra-tropical Cyclone Climatology Joseph M. Sienkiewicz NOAA/NWS Ocean Prediction Center Khalil Ahmad, Gregory McFadden, Zorana Jelenak, Paul Chang, Michael Brennan, Joan Von Ahn 1 2009 Scatterometer and Climate Meeting, Arlington, VA Aug 19-21
Transcript
Extreme Extra-tropical Cyclone Climatology
Joseph M. SienkiewiczNOAA/NWS Ocean Prediction Center
Khalil Ahmad, Gregory McFadden, Zorana Jelenak, Paul Chang, Michael Brennan, Joan Von Ahn
12009 Scatterometer and Climate Meeting, Arlington, VA Aug 19-21
1979 – President’s Day Blizzard
2009 Scatterometer and Climate Meeting, Arlington, VA Aug 19-21
2
-Poorly predicted in Washington, DC
-Rapid intensification as exited coast
-Highlighted limitations of NWP
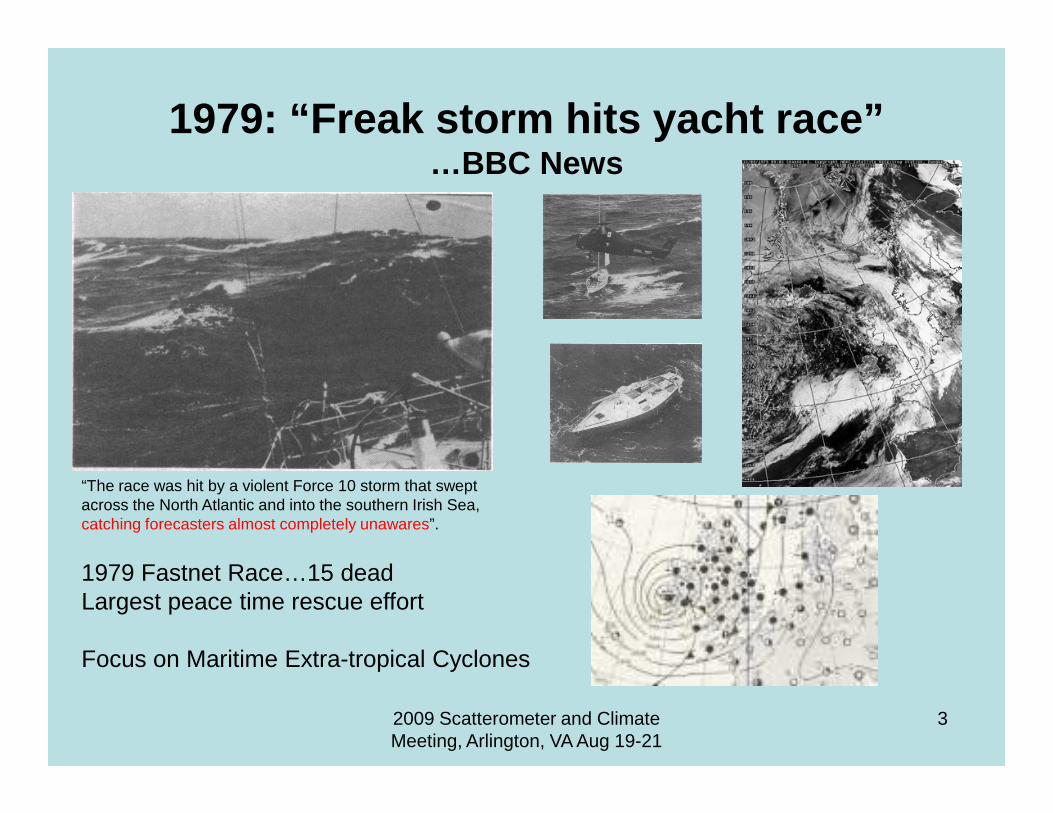
1979: “Freak storm hits yacht race”…BBC News
2009 Scatterometer and Climate Meeting, Arlington, VA Aug 19-21
3
1979 Fastnet Race…15 deadLargest peace time rescue effort
Focus on Maritime Extra-tropical Cyclones
“The race was hit by a violent Force 10 storm that swept across the North Atlantic and into the southern Irish Sea, catching forecasters almost completely unawares”.
Sanders and Gyakum, 1980Synoptic-Dynamic Climatology of the “Bomb”
42009 Scatterometer and Climate Meeting, Arlington, VA Aug 19-21
Triggered two field campaigns – Genesis of Atlantic Lows Experiment (GALE)- Experiment on Rapidly Intensifying Cyclones over the Atlantic (ERICA)
Linked SST gradient to rapid cyclogenesis
• Rapid intensification– Climatology– Role of latent heat release– Fluxes– Jet streaks– Predictability
GALE and ERICA focus
– Predictability– Inadequacies of NWP models
• Evolution of cyclone structure• Unable to focus on:
– evolution of conditions (winds)
2009 Scatterometer and Climate Meeting, Arlington, VA Aug 19-21
5
QuikSCAT era• Wide swath
– reveals much of cyclone wind field • (complete coverage 2x’s/day poleward of 49 degrees)
• Large retrievable wind speed range – (well into hurricane force)
• Limitations - resolution and rain – not as significant in extra-tropical cyclones as opposed to
tropical cyclones– Highest winds typically in area of minimal rain and over large
area
• Allows focus on conditions, not just central pressure• Coverage and capability supports warning function!
2009 Scatterometer and Climate Meeting, Arlington, VA Aug 19-21
6
37
64
51
39
494550
60
70
C Atlantic
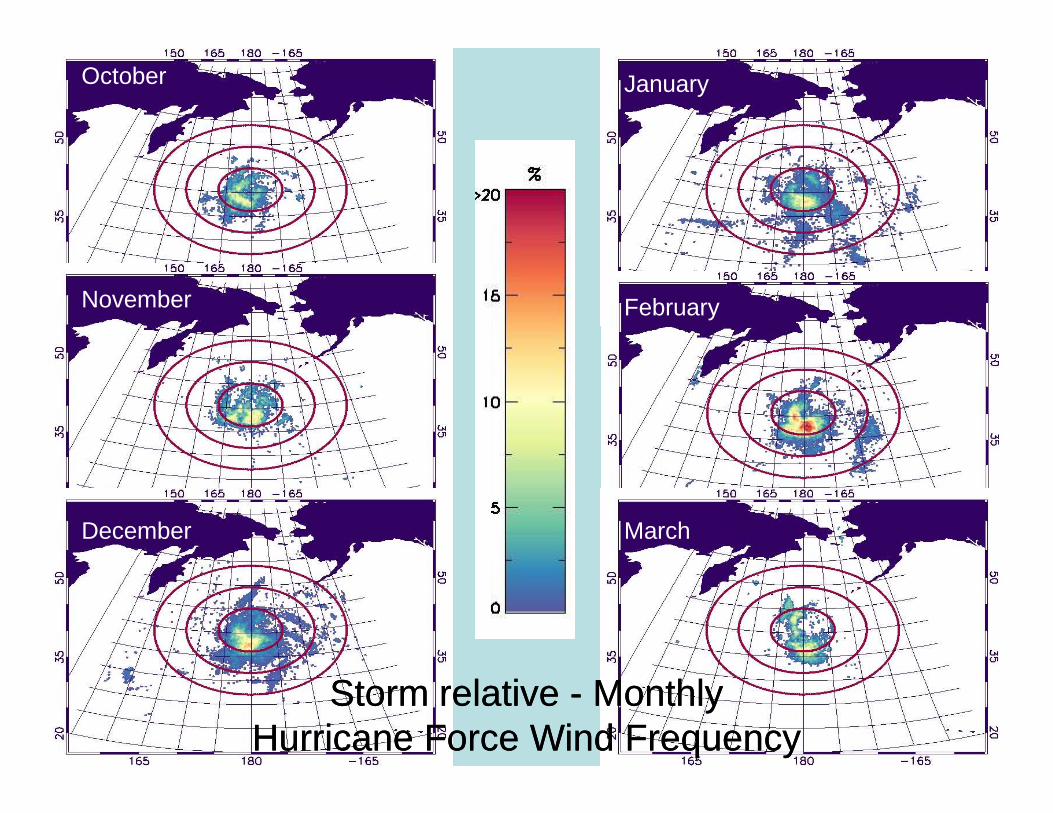
Hurricane Force Extra-tropical Cyclones -Detection and Warning Trend using QuikSCAT
2000-2009
•Hurricane Force Warning Initiated Dec 2000 •Detection increased with:
Storm relative Storm relative -- Monthly Monthly Hurricane Force Wind FrequencyHurricane Force Wind Frequency
0-6h
6-12h
12-18h
18-24h
>24h
Hurricane Force Extra-tropical CyclonesGaining a grasp on behavior
Geographic distributionMonthly frequency Wind field distributionHF winds onset during rapid intensificationThermal structures requiredQuantified short-term predictability
Unknowns:
2009 Scatterometer and Climate Meeting, Arlington, VA Aug 19-21
16
Unknowns:Trend over timeInterannual variabilityDevelopment and relationship to larger scaleContribution to earth system
- Momentum transfer- Heat and moisture fluxes/transport- Wave generation, coastal erosion- Salt spray particles (production of CCN?)
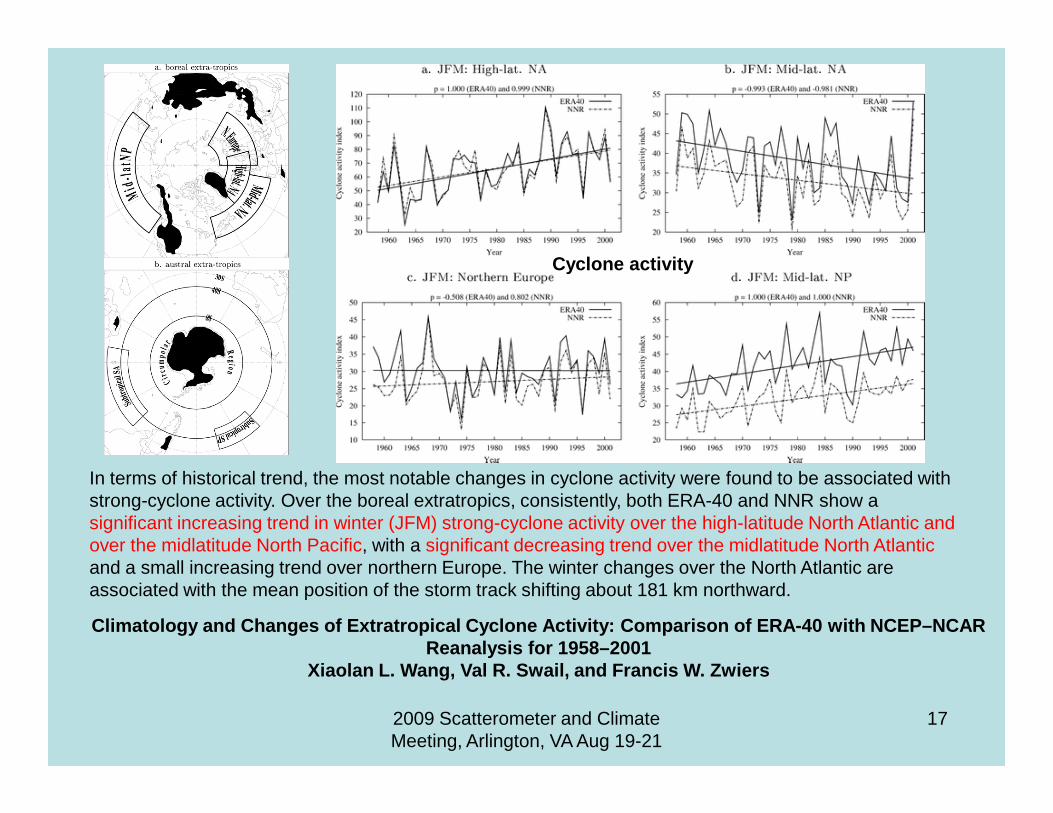
Cyclone activity
2009 Scatterometer and Climate Meeting, Arlington, VA Aug 19-21
17
Climatology and Changes of Extratropical Cyclone Ac tivity: Comparison of ERA-40 with NCEP–NCAR Reanalysis for 1958–2001
Xiaolan L. Wang, Val R. Swail, and Francis W. Zwiers
In terms of historical trend, the most notable changes in cyclone activity were found to be associated with strong-cyclone activity. Over the boreal extratropics, consistently, both ERA-40 and NNR show a significant increasing trend in winter (JFM) strong-cyclone activity over the high-latitude North Atlantic and over the midlatitude North Pacific, with a significant decreasing trend over the midlatitude North Atlantic and a small increasing trend over northern Europe. The winter changes over the North Atlantic are associated with the mean position of the storm track shifting about 181 km northward.
Contribution of ocean cyclone wind forcing to ocean circulation
2009 Scatterometer and Climate Meeting, Arlington, VA Aug 19-21
18
Pickart et al. 2009…The curl pattern arises because of the tendency of cyclones to deepen in two distinct regions over the course of the storm season. While we suspect that the collocation of the cyclonic wind stress curl signal and the two ocean gyres is not a coincidence, it still needsto be demonstrated how such a seasonal input of vorticity can drive a mean double-gyre circulation.
Moore and Renfrew, 2005Deep ocean convection occurs in both the Labrador and Irminger Seas, with high wind speeds
Contribution of ocean cyclone wind forcing to ocean circulation
Tip jet Reverse tip jet Barrier jet Denmark Straitbarrier jet
2009 Scatterometer and Climate Meeting, Arlington, VA Aug 19-21
19
Deep ocean convection occurs in both the Labrador and Irminger Seas, with high wind speeds being crucial for the large air–sea heat and moisture exchanges that densify the surface waters and drive convection (Lab Sea Group 1998; Bacon et al. 2003; Pickart et al. 2003a,b).
Extreme winds and salt spray
2009 Scatterometer and Climate Meeting, Arlington, VA Aug 19-21
20
Reid et al., 2007 (NRL Report)
• High winds, long fetch, in non-precipitating conditions result in high concentrations of sea salt particles •Giant mode salt spray particles in worst conditions probably to ~1.5 km
“extremely high sea salt particle concentrations are a previouslyunconsidered phenomenon in the scientific community”
Summary
2009 Scatterometer and Climate Meeting, Arlington, VA Aug 19-21
21
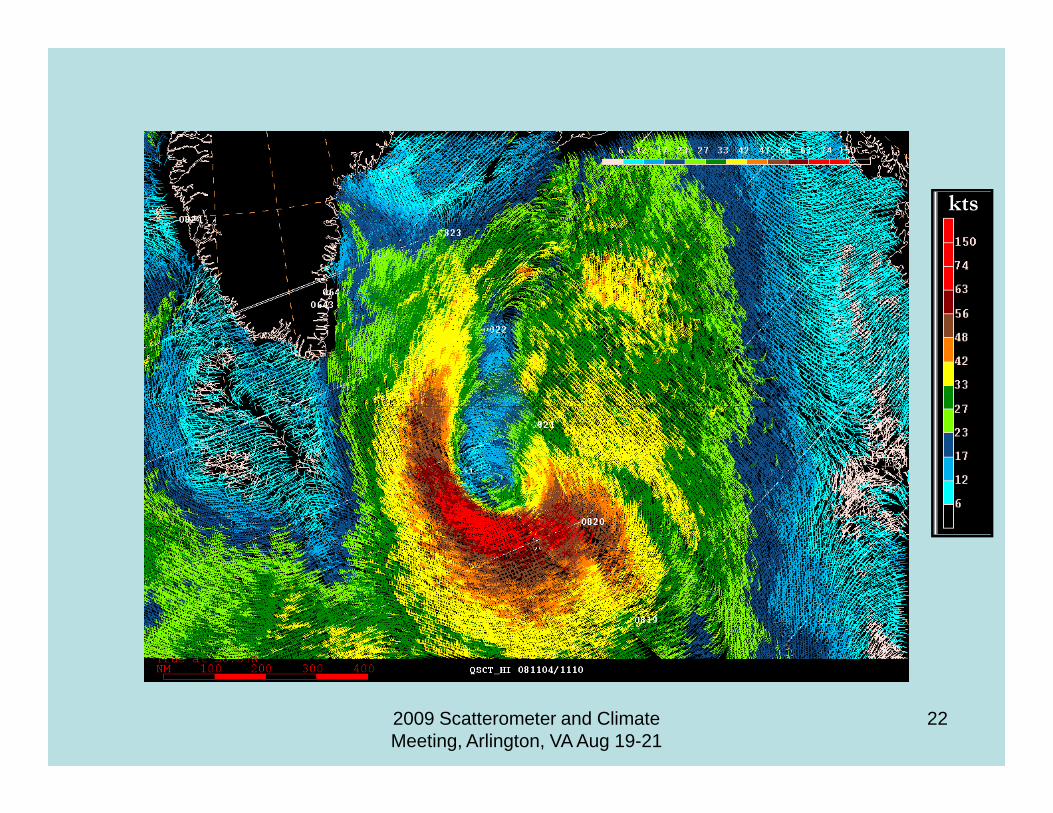
Probability of 925 mb windsto reach hurricane force in anunstable atmosphere
kts
222009 Scatterometer and Climate Meeting, Arlington, VA Aug 19-21


![Climatology [Autosaved]](https://static.documents.pub/doc/80x56/577cd2e91a28ab9e78964bc6/climatology-autosaved.jpg)


