Table of Contents Index to Financial Statements 2010 UNITED STATES SECURITIES AND EXCHANGE COMMISSION WASHINGTON, D.C. 20549 FORM 10-K/A Amendment No. 1 ☒ ANNUAL REPORT PURSUANT TO SECTION 13 OR 15(d) OF THE SECURITIES EXCHANGE ACT OF 1934 For the fiscal year ended December 31, 2010 or ☐ TRANSITION REPORT PURSUANT TO SECTION 13 OR 15(d) OF THE SECURITIES EXCHANGE ACT OF 1934 For the transition period from to Commission File Number 1-2256 EXXON MOBIL CORPORATION (Exact name of registrant as specified in its charter) NEW JERSEY (State or other jurisdiction of incorporation or organization) 13-5409005 (I.R.S. Employer Identification Number) 5959 LAS COLINAS BOULEVARD, IRVING, TEXAS 75039-2298 (Address of principal executive offices) (Zip Code) (972) 444-1000 (Registrant’s telephone number, including area code) Securities registered pursuant to Section 12(b) of the Act: Title of Each Class Name of Each Exchange on Which Registered Common Stock, without par value (4,958,598,361 shares outstanding at January 31, 2011) New York Stock Exchange Registered securities guaranteed by Registrant: SeaRiver Maritime Financial Holdings, Inc. Twenty-Five Year Debt Securities due October 1, 2011 New York Stock Exchange Indicate by check mark if the registrant is a well-known seasoned issuer, as defined in Rule 405 of the Securities Act. Yes ü No Indicate by check mark if the registrant is not required to file reports pursuant to Section 13 or Section 15(d) of the Act. Yes No ü Indicate by check mark whether the registrant (1) has filed all reports required to be filed by Section 13 or 15(d) of the Securities Exchange Act of 1934 during the preceding 12 months (or for such shorter period that the registrant was required to file such reports), and (2) has been subject to such filing requirements for the past 90 days. Yes ü No Indicate by check mark whether the registrant has submitted electronically and posted on its corporate Web site, if any, every Interactive Data File required to be submitted and posted pursuant to Rule 405 of Regulation S-T during the preceding 12 months (or for such shorter period that the registrant was required to submit and post such files). Yes ü No Indicate by check mark if disclosure of delinquent filers pursuant to Item 405 of Regulation S-K is not contained herein, and will not be contained, to the best of registrant’s knowledge, in definitive proxy or information statements incorporated by reference in Part III of this Form 10-K or any amendment to this Form 10-K. ü Indicate by check mark whether the registrant is a large accelerated filer, an accelerated filer, a non-accelerated filer or a smaller reporting company. See the definitions of “large accelerated filer,” “accelerated filer,” and “smaller reporting company” in Rule 12b-2 of the Exchange Act. Large accelerated filer ü Accelerated filer Non-accelerated filer Smaller reporting company Indicate by check mark whether the registrant is a shell company (as defined by Rule 12b-2 of the Act). Yes No ü The aggregate market value of the voting stock held by non-affiliates of the registrant on June 30, 2010, the last business day of the registrant’s most recently completed second fiscal quarter, based on the closing price on that date of $57.07 on the New York Stock Exchange composite tape, was in excess of $290 billion. Documents Incorporated by Reference: Proxy Statement for the 2011 Annual Meeting of Shareholders (Part III)
Transcript
Table of Contents
Index to Financial Statements
2010
UNITED STATESSECURITIES AND EXCHANGE COMMISSION
WASHINGTON, D.C. 20549
FORM 10-K/AAmendment No. 1
☒ ANNUAL REPORT PURSUANT TO SECTION 13 OR 15(d) OFTHE SECURITIES EXCHANGE ACT OF 1934
For the fiscal year ended December 31, 2010or
☐ TRANSITION REPORT PURSUANT TO SECTION 13 OR 15(d) OFTHE SECURITIES EXCHANGE ACT OF 1934
For the transition period from to Commission File Number 1-2256
EXXON MOBIL CORPORATION(Exact name of registrant as specified in its charter)
NEW JERSEY(State or other jurisdiction ofincorporation or organization)
13-5409005(I.R.S. Employer
Identification Number) 5959 LAS COLINAS BOULEVARD, IRVING, TEXAS 75039-2298
(Address of principal executive offices) (Zip Code)(972) 444-1000
(Registrant’s telephone number, including area code) Securities registered pursuant to Section 12(b) of the Act:
Title of Each Class Name of Each Exchange
on Which RegisteredCommon Stock, without par value (4,958,598,361 shares
outstanding at January 31, 2011) New York Stock ExchangeRegistered securities guaranteed by Registrant:
SeaRiver Maritime Financial Holdings, Inc. Twenty-Five Year Debt Securities due October 1, 2011 New York Stock Exchange
Indicate by check mark if the registrant is a well-known seasoned issuer, as defined in Rule 405 of the Securities Act. Yes ü No Indicate by check mark if the registrant is not required to file reports pursuant to Section 13 or Section 15(d) of the Act. Yes No ü Indicate by check mark whether the registrant (1) has filed all reports required to be filed by Section 13 or 15(d) of the Securities Exchange Act of 1934
during the preceding 12 months (or for such shorter period that the registrant was required to file such reports), and (2) has been subject to such filingrequirements for the past 90 days. Yes ü No
Indicate by check mark whether the registrant has submitted electronically and posted on its corporate Web site, if any, every Interactive Data Filerequired to be submitted and posted pursuant to Rule 405 of Regulation S-T during the preceding 12 months (or for such shorter period that the registrant wasrequired to submit and post such files). Yes ü No
Indicate by check mark if disclosure of delinquent filers pursuant to Item 405 of Regulation S-K is not contained herein, and will not be contained, to thebest of registrant’s knowledge, in definitive proxy or information statements incorporated by reference in Part III of this Form 10-K or any amendment to thisForm 10-K. ü
Indicate by check mark whether the registrant is a large accelerated filer, an accelerated filer, a non-accelerated filer or a smaller reporting company. Seethe definitions of “large accelerated filer,” “accelerated filer,” and “smaller reporting company” in Rule 12b-2 of the Exchange Act.
Large accelerated filer ü Accelerated filer Non-accelerated filer Smaller reporting company
Indicate by check mark whether the registrant is a shell company (as defined by Rule 12b-2 of the Act). Yes No ü The aggregate market value of the voting stock held by non-affiliates of the registrant on June 30, 2010, the last business day of the registrant’s most
recently completed second fiscal quarter, based on the closing price on that date of $57.07 on the New York Stock Exchange composite tape, was in excess of$290 billion.
Documents Incorporated by Reference: Proxy Statement for the 2011 Annual Meeting of Shareholders (Part III)
Table of Contents
Index to Financial Statements
EXPLANATORY NOTE This Amendment No. 1 is being filed solely for the purpose of inserting the conformed signature of independent auditors on their report on page 63, which wasinadvertently omitted from the initial filing, and to correct additional typographical printer’s errors in a heading and officer name on page 62. Except for thesecorrections, there have been no changes in any of the financial or other information contained in the report. For convenience, the entire Annual Report on Form10-K, as amended, is being re-filed.
Table of Contents
Index to Financial Statements
EXXON MOBIL CORPORATIONFORM 10-K
FOR THE FISCAL YEAR ENDED DECEMBER 31, 2010
TABLE OF CONTENTS
Page
Number PART I
Item 1. Business 1
Item 1A. Risk Factors 2
Item 1B. Unresolved Staff Comments 5
Item 2. Properties 6
Item 3. Legal Proceedings 31
Executive Officers of the Registrant [pursuant to Instruction 3 to Regulation S-K, Item 401(b)] 32
PART II Item 5. Market for Registrant’s Common Equity, Related Stockholder Matters and Issuer Purchases of Equity Securities 36
Item 6. Selected Financial Data 36
Item 7. Management’s Discussion and Analysis of Financial Condition and Results of Operations 37
Item 7A. Quantitative and Qualitative Disclosures About Market Risk 37
Item 8. Financial Statements and Supplementary Data 37
Item 9. Changes in and Disagreements With Accountants on Accounting and Financial Disclosure 37
Item 9A. Controls and Procedures 38
Item 9B. Other Information 38
PART III Item 10. Directors, Executive Officers and Corporate Governance 38
Item 11. Executive Compensation 39
Item 12. Security Ownership of Certain Beneficial Owners and Management and Related Stockholder Matters 39
Item 13. Certain Relationships and Related Transactions, and Director Independence 40
Item 14. Principal Accounting Fees and Services 40
PART IV Item 15. Exhibits, Financial Statement Schedules 40
Financial Section 41
Signatures 119
Index to Exhibits 121
Exhibit 12 — Computation of Ratio of Earnings to Fixed Charges
Exhibits 31 and 32 — Certifications
Table of Contents
Index to Financial Statements
PART I Item 1. Business. Exxon Mobil Corporation was incorporated in the State of New Jersey in 1882. Divisions and affiliated companies of ExxonMobil operate or marketproducts in the United States and most other countries of the world. Their principal business is energy, involving exploration for, and production of, crude oil andnatural gas, manufacture of petroleum products and transportation and sale of crude oil, natural gas and petroleum products. ExxonMobil is a major manufacturerand marketer of commodity petrochemicals, including olefins, aromatics, polyethylene and polypropylene plastics and a wide variety of specialty products.ExxonMobil also has interests in electric power generation facilities. Affiliates of ExxonMobil conduct extensive research programs in support of thesebusinesses.
Exxon Mobil Corporation has several divisions and hundreds of affiliates, many with names that include ExxonMobil, Exxon, Esso or Mobil. Forconvenience and simplicity, in this report the terms ExxonMobil, Exxon, Esso and Mobil, as well as terms like Corporation, Company, our, we and its, aresometimes used as abbreviated references to specific affiliates or groups of affiliates. The precise meaning depends on the context in question.
On June 25, 2010, ExxonMobil acquired XTO Energy Inc. (“XTO”) by merging a wholly-owned subsidiary of ExxonMobil with and into XTO (the“merger”), with XTO continuing as the surviving corporation and a wholly-owned subsidiary of ExxonMobil. Each share of XTO common stock was convertedinto the right to receive 0.7098 shares of common stock of ExxonMobil plus cash in lieu of fractional shares. The merger combines XTO’s high-qualityunconventional gas and oil shale reserve base and technical expertise in unconventional development with ExxonMobil’s research and development expertise,project management and operational skill, global scale, and financial capacity. Details of the merger transactions are contained in the Financial Section of thisreport under the following: “Note 19: Acquisition of XTO Energy Inc.”
Throughout ExxonMobil’s businesses, new and ongoing measures are taken to prevent and minimize the impact of our operations on air, water and ground.These include a significant investment in refining infrastructure and technology to manufacture clean fuels as well as projects to monitor and reduce nitrogenoxide, sulfur oxide, and greenhouse gas emissions and expenditures for asset retirement obligations. ExxonMobil’s 2010 worldwide environmental expendituresfor all such preventative and remediation steps, including ExxonMobil’s share of equity company expenditures, were about $4.5 billion, of which $1.9 billionwere capital expenditures and $2.6 billion were included in expenses. The total cost for such activities is expected to remain in this range in 2011 and 2012 (withcapital expenditures approximately 40 percent of the total).
The energy and petrochemical industries are highly competitive. There is competition within the industries and also with other industries in supplying theenergy, fuel and chemical needs of both industrial and individual consumers. The Corporation competes with other firms in the sale or purchase of needed goodsand services in many national and international markets and employs all methods of competition which are lawful and appropriate for such purposes.
Operating data and industry segment information for the Corporation are contained in the Financial Section of this report under the following: “QuarterlyInformation”, “Note 17: Disclosures about Segments and Related Information” and “Operating Summary”. Information on oil and gas reserves is contained in the“Oil and Gas Reserves” part of the “Supplemental Information on Oil and Gas Exploration and Production Activities” portion of the Financial Section of thisreport.
ExxonMobil has a long-standing commitment to the development of proprietary technology. We have a wide array of research programs designed to meetthe needs identified in each of our business
1
Table of Contents
Index to Financial Statements
segments. Information on Company-sponsored research and development spending is contained in “Note 3: Miscellaneous Financial Information” of theFinancial Section of this report. ExxonMobil held approximately 11 thousand active patents worldwide at the end of 2010. For technology licensed to thirdparties, revenues totaled approximately $125 million in 2010. Although technology is an important contributor to the overall operations and results of ourCompany, the profitability of each business segment is not dependent on any individual patent, trade secret, trademark, license, franchise or concession.
The number of regular employees was 83.6 thousand, 80.7 thousand and 79.9 thousand at years ended 2010, 2009 and 2008, respectively. Regularemployees are defined as active executive, management, professional, technical and wage employees who work full time or part time for the Corporation and arecovered by the Corporation’s benefit plans and programs. Regular employees do not include employees of the company-operated retail sites (CORS). The numberof CORS employees was 20.1 thousand, 22.0 thousand and 24.8 thousand at years ended 2010, 2009 and 2008, respectively.
Information concerning the source and availability of raw materials used in the Corporation’s business, the extent of seasonality in the business, thepossibility of renegotiation of profits or termination of contracts at the election of governments and risks attendant to foreign operations may be found in “Item1A–Risk Factors” and “Item 2–Properties” in this report.
ExxonMobil maintains a website at exxonmobil.com. Our annual report on Form 10-K, quarterly reports on Form 10-Q, current reports on Form 8-K andany amendments to those reports filed or furnished pursuant to Section 13(a) of the Securities Exchange Act of 1934 are made available through our website assoon as reasonably practical after we electronically file or furnish the reports to the Securities and Exchange Commission. Also available on the Corporation’swebsite are the Company’s Corporate Governance Guidelines and Code of Ethics and Business Conduct, as well as the charters of the audit, compensation andnominating committees of the Board of Directors. Information on our website is not incorporated into this report. Item 1A. Risk Factors. ExxonMobil’s financial and operating results are subject to a variety of risks inherent in the global oil, gas, and petrochemical businesses. Many of theserisk factors are not within the Company’s control and could adversely affect our business, our financial and operating results or our financial condition. These riskfactors include: Supply and Demand. The oil, gas, and petrochemical businesses are fundamentally commodity businesses. This means ExxonMobil’s operations and earnings may besignificantly affected by changes in oil, gas and petrochemical prices and by changes in margins on refined products. Oil, gas, petrochemical and product pricesand margins in turn depend on local, regional and global events or conditions that affect supply and demand for the relevant commodity.
Economic conditions. The demand for energy and petrochemicals correlates closely with general economic growth rates. The occurrence of recessions orother periods of low or negative economic growth will typically have a direct adverse impact on our results. Other factors that affect general economic conditionsin the world or in a major region, such as changes in population growth rates or periods of civil unrest, also impact the demand for energy and petrochemicals.Economic conditions that impair the functioning of financial markets and institutions also pose risks to ExxonMobil, including risks to the safety of our financialassets and to the ability of our partners and customers to fulfill their commitments to ExxonMobil.
2
Table of Contents
Index to Financial Statements
Other demand-related factors. Other factors that may affect the demand for oil, gas and petrochemicals, and therefore impact our results, includetechnological improvements in energy efficiency; seasonal weather patterns, which affect the demand for energy associated with heating and cooling; increasedcompetitiveness of alternative energy sources that have so far generally not been competitive with oil and gas without the benefit of government subsidies ormandates; and changes in technology or consumer preferences that alter fuel choices, such as toward alternative fueled vehicles.
Other supply-related factors. Commodity prices and margins also vary depending on a number of factors affecting supply. For example, increased supplyfrom the development of new oil and gas supply sources and technologies to enhance recovery from existing sources tend to reduce commodity prices to theextent such supply increases are not offset by commensurate growth in demand. Similarly, increases in industry refining or petrochemical manufacturing capacitytend to reduce margins on the affected products. World oil, gas, and petrochemical supply levels can also be affected by factors that reduce available supplies,such as adherence by member countries to OPEC production quotas and the occurrence of wars, hostile actions, natural disasters, disruptions in competitors’operations, or unexpected unavailability of distribution channels that may disrupt supplies. Technological change can also alter the relative costs for competitorsto find, produce, and refine oil and gas and to manufacture petrochemicals.
Other market factors. ExxonMobil’s business results are also exposed to potential negative impacts due to changes in currency exchange rates, interestrates, inflation, and other local or regional market conditions. We generally do not use financial instruments to hedge market exposures. Government and Political Factors. ExxonMobil’s results can be adversely affected by political or regulatory developments affecting our operations.
Access limitations. A number of countries limit access to their oil and gas resources, or may place resources off-limits from development altogether.Restrictions on foreign investment in the oil and gas sector tend to increase in times of high commodity prices, when national governments may have less need ofoutside sources of private capital. Many countries also restrict the import or export of certain products based on point of origin.
Restrictions on doing business. As a U.S. company, ExxonMobil is subject to laws prohibiting U.S. companies from doing business in certain countries,or restricting the kind of business that may be conducted. Such restrictions may provide a competitive advantage to our non-U.S. competitors unless their ownhome countries impose comparable restrictions.
Lack of legal certainty. Some countries in which we do business lack well-developed legal systems, or have not yet adopted clear regulatory frameworksfor oil and gas development. Lack of legal certainty exposes our operations to increased risk of adverse or unpredictable actions by government officials, and alsomakes it more difficult for us to enforce our contracts. In some cases these risks can be partially offset by agreements to arbitrate disputes in an internationalforum, but the adequacy of this remedy may still depend on the local legal system to enforce an award.
Regulatory and litigation risks. Even in countries with well-developed legal systems where ExxonMobil does business, we remain exposed to changes inlaw (including changes that result from international treaties and accords) that could adversely affect our results, such as increases in taxes or government royaltyrates (including retroactive claims); price controls; changes in environmental regulations or other laws that increase our cost of compliance or reduce or delayavailable business opportunities (including changes in laws related to offshore drilling operations, water use, or hydraulic
3
Table of Contents
Index to Financial Statements
fracturing); adoption of regulations mandating the use of alternative fuels or uncompetitive fuel components; government actions to cancel contracts orrenegotiate terms unilaterally; and expropriation. Legal remedies available to compensate us for expropriation or other takings may be inadequate. We also maybe adversely affected by the outcome of litigation or other legal proceedings, especially in countries such as the United States in which very large andunpredictable punitive damage awards may occur.
Security concerns. Successful operation of particular facilities or projects may be disrupted by civil unrest, acts of sabotage or terrorism, and other localsecurity concerns. Such concerns may require us to incur greater costs for security or to shut down operations for a period of time.
Climate change and greenhouse gas restrictions. Due to concern over the risk of climate change, a number of countries have adopted, or are consideringthe adoption of, regulatory frameworks to reduce greenhouse gas emissions. These include adoption of cap and trade regimes, carbon taxes, restrictive permitting,increased efficiency standards, and incentives or mandates for renewable energy. These requirements could make our products more expensive, lengthen projectimplementation times, and reduce demand for hydrocarbons, as well as shifting hydrocarbon demand toward relatively lower-carbon sources such as natural gas.Current and pending greenhouse gas regulations may also increase our compliance costs, such as for monitoring or sequestering emissions.
Government sponsorship of alternative energy. Many governments are providing tax advantages and other subsidies and mandates to make alternativeenergy sources more competitive against oil and gas. Governments are also promoting research into new technologies to reduce the cost and increase thescalability of alternative energy sources. We are conducting our own research efforts into alternative energy, such as through sponsorship of the Global Climateand Energy Project at Stanford University and research into hydrogen fuel cells and fuel-producing algae. Our future results may depend in part on the success ofour research efforts and on our ability to adapt and apply the strengths of our current business model to providing the competitive energy products of the future.See “Management Effectiveness” below. Management Effectiveness. In addition to external economic and political factors, our future business results also depend on our ability to manage successfully those factors that are atleast in part within our control. The extent to which we manage these factors will impact our performance relative to competition. For projects in which we arenot the operator, we depend on the management effectiveness of one or more coventurers whom we do not control.
Exploration and development program. Our ability to maintain and grow our oil and gas production depends on the success of our exploration anddevelopment efforts. Among other factors, we must continuously improve our ability to identify the most promising resource prospects and apply our projectmanagement expertise to bring discovered resources on line on schedule.
Project management. The success of ExxonMobil’s Upstream, Downstream, and Chemical businesses depends on complex, long-term, capital intensiveprojects. These projects in turn require a high degree of project management expertise to maximize efficiency. Specific factors that can affect the performance ofmajor projects include our ability to: negotiate successfully with joint venturers, partners, governments, suppliers, customers, or others; model and optimizereservoir performance; develop markets for project outputs, whether through long-term contracts or the development of effective spot markets; manage changes inoperating conditions and costs, including costs of third party equipment or services such as drilling rigs and shipping; prevent, to the extent possible, and respondeffectively to unforeseen technical difficulties that could delay project startup or cause unscheduled
4
Table of Contents
Index to Financial Statements
project downtime; and influence the performance of project operators where ExxonMobil does not perform that role.
Operational efficiency. An important component of ExxonMobil’s competitive performance, especially given the commodity-based nature of many ofour businesses, is our ability to operate efficiently, including our ability to manage expenses and improve production yields on an ongoing basis. This requirescontinuous management focus, including technology improvements, cost control, productivity enhancements and regular reappraisal of our asset portfolio.
Research and development. To maintain our competitive position, especially in light of the technological nature of our businesses and the need forcontinuous efficiency improvement, ExxonMobil’s research and development organizations must be successful and able to adapt to a changing market and policyenvironment.
Safety, business controls, and environmental risk management. Our results depend on management’s ability to minimize the inherent risks of oil, gas,and petrochemical operations and to control effectively our business activities. We apply rigorous management systems and continuous focus to workplace safetyand to avoiding spills or other adverse environmental events. For example, we work to minimize spills through a combined program of effective operationsintegrity management, ongoing upgrades, key equipment replacements, and comprehensive inspection and surveillance. Similarly, we are implementing cost-effective new technologies and adopting new operating practices to reduce air emissions, not only in response to government requirements but also to addresscommunity priorities. We also maintain a disciplined framework of internal controls and apply a controls management system for monitoring compliance withthis framework. Substantial liabilities and other adverse impacts could result if our management systems and controls do not function as intended. The ability toinsure against such risks is limited by the capacity of the applicable insurance markets, which may not be sufficient.
Preparedness. Our operations may be disrupted by severe weather events, natural disasters, human error, and similar events. For example, hurricanesmay damage our offshore production facilities or coastal refining and petrochemical plants in vulnerable areas. Our ability to mitigate the adverse impacts ofthese events depends in part upon the effectiveness of our rigorous disaster preparedness and response planning, as well as business continuity planning.
Projections, estimates and descriptions of ExxonMobil’s plans and objectives included or incorporated in Items 1, 1A, 2, 7 and 7A of this report areforward-looking statements. Actual future results, including project completion dates, production rates, capital expenditures, costs and business plans could differmaterially due to, among other things, the factors discussed above and elsewhere in this report. Item 1B. Unresolved Staff Comments. None.
5
Table of Contents
Index to Financial Statements
Item 2. Properties. Information with regard to oil and gas producing activities follows: 1. Disclosure of Reserves A. Summary of Oil and Gas Reserves at Year-End 2010 The table below summarizes the oil-equivalent proved reserves in each geographic area and by product type for consolidated subsidiaries and equitycompanies. The Corporation has reported proved reserves on the basis of the average of the first-day-of-the-month price for each month during the last 12-monthperiod. Gas is converted to an oil-equivalent basis at six million cubic feet per one thousand barrels. No major discovery or other favorable or adverse event hasoccurred since December 31, 2010, that would cause a significant change in the estimated proved reserves as of that date.
United States 1,478 — — 15,344 4,035 Canada/South America 133 519 681 1,077 1,512 Europe 361 — — 3,516 947 Africa 1,055 — — 711 1,174 Asia 1,306 — — 6,593 2,405 Australia/Oceania 139 — — 1,174 335
Total Consolidated 4,472 519 681 28,415 10,408 Equity Companies
United States 271 — — 97 287 Europe 21 — — 8,167 1,382 Asia 1,623 — — 20,494 5,039
Total Equity Company 1,915 — — 28,758 6,708
Total Developed 6,387 519 681 57,173 17,116 Undeveloped
Consolidated Subsidiaries United States 474 — — 10,650 2,249 Canada/South America 30 1,583 — 181 1,643 Europe 62 — — 526 150 Africa 744 — — 197 777 Asia 717 — — 667 828 Australia/Oceania 136 — — 6,177 1,165
Total Consolidated 2,163 1,583 — 18,398 6,812 Equity Companies
United States 80 — — 20 83 Europe 10 — — 2,579 440 Asia 250 — — 645 358
Total Equity Company 340 — — 3,244 881
Total Undeveloped 2,503 1,583 — 21,642 7,693
Total Proved Reserves 8,890 2,102 681 78,815 24,809
(1) Liquids includes crude, condensate and natural gas liquids.(2) South America includes developed proved reserves of 0.6 million barrels of liquids and 97 billion cubic feet of natural gas and undeveloped proved
reserves of 0.6 million barrels of liquids and 66 billion cubic feet of natural gas.
6
(1)
(2)
(2)
Table of Contents
Index to Financial Statements
In the preceding reserves information, consolidated subsidiary and equity company reserves are reported separately. However, the Corporation operates itsbusiness with the same view of equity company reserves as it has for reserves from consolidated subsidiaries.
The Corporation’s overall volume capacity outlook, based on projects coming on stream as anticipated, is for production capacity to grow over the period2011-2015. However, actual volumes will vary from year to year due to the timing of individual project start-ups, operational outages, reservoir performance,regulatory changes, asset sales, weather events, price effects on production sharing contracts and other factors as described in Item 1A—Risk Factors of thisreport.
The estimation of proved reserves, which is based on the requirement of reasonable certainty, is an ongoing process based on rigorous technicalevaluations, commercial and market assessments and detailed analysis of well information such as flow rates and reservoir pressure declines. Furthermore, theCorporation only records proved reserves for projects which have received significant funding commitments by management made toward the development of thereserves. Although the Corporation is reasonably certain that proved reserves will be produced, the timing and amount recovered can be affected by a number offactors including completion of development projects, reservoir performance, regulatory approvals and significant changes in projections of long-term oil and gasprice levels.
B. Technologies Used in Establishing Proved Reserves Additions in 2010 Additions to ExxonMobil’s proved reserves in 2010 were based on estimates generated through the integration of available and appropriate geological,engineering and production data, utilizing well established technologies that have been demonstrated in the field to yield repeatable and consistent results.
Data used in these integrated assessments included information obtained directly from the subsurface via wellbores, such as well logs, reservoir coresamples, fluid samples, static and dynamic pressure information, production test data, and surveillance and performance information. The data utilized alsoincluded subsurface information obtained through indirect measurements including high-quality 2-D and 3-D seismic data, calibrated with available well controlinformation. Where applicable, surface geological information was also utilized. The tools used to interpret the data included proprietary seismic processingsoftware, proprietary reservoir modeling and simulation software and commercially available data analysis packages.
In some circumstances, where appropriate analog reservoirs were available, reservoir parameters from these analogs were used to increase the quality ofand confidence in the reserves estimates.
C. Qualifications of Reserves Technical Oversight Group and Internal Controls over Proved Reserves ExxonMobil has a dedicated Reserves Technical Oversight group that is separate from the operating organization. Primary responsibilities of this groupinclude oversight of the reserves estimation process for compliance with Securities and Exchange Commission (SEC) rules and regulations, review of annualchanges in reserves estimates, and the reporting of ExxonMobil’s proved reserves. This group also maintains the official company reserves estimates forExxonMobil’s proved reserves of crude and natural gas liquids, bitumen, synthetic oil and natural gas. In addition, the group provides training to personnelinvolved in the reserves estimation and reporting process within ExxonMobil and its affiliates. The group is managed by and staffed with individuals that have anaverage of more than 20 years of technical experience in the petroleum industry, including expertise in the classification and categorization of reserves under theSEC guidelines. This group includes several individuals who hold advanced degrees in either Engineering or Geology, as well as individuals who hold Bachelor’sdegrees in various technical disciplines. Several members of the group hold professional registrations in their field of expertise and several have served on the Oiland Gas Reserves Committee of the Society of Petroleum Engineers.
7
Table of Contents
Index to Financial Statements
The Reserves Technical Oversight group maintains a central computerized database containing the official company global reserves estimates. Appropriatecontrols, including limitations on database access and update capabilities, are in place to ensure data integrity within this central computerized database. Anannual review of the system’s controls is performed by internal audit. Key components of the reserves estimation process include technical evaluations andanalysis of well and field performance and a rigorous peer review. No changes may be made to the reserves estimates in the central database, including additionsof any new initial reserves estimates or subsequent revisions, unless these changes have been thoroughly reviewed and evaluated by duly authorized personnelwithin the operating organization. In addition, changes to reserves estimates that exceed certain thresholds require further review and approval of the appropriatelevel of management within the operating organization before the changes may be made in the central database. Endorsement by the Reserves TechnicalOversight group for all proved reserves changes is a mandatory component of this review process. After all changes are made, reviews are held with seniormanagement for final endorsement. 2. Proved Undeveloped Reserves At year-end 2010, approximately 7.7 billion oil-equivalent barrels (GOEB) of ExxonMobil’s proved reserves were classified as proved undeveloped. Thisrepresents 31 percent of the 24.8 GOEB reported in proved reserves and includes approximately 1.0 GOEB of new proved undeveloped reserves related to theacquisition of XTO. This compares to the 7.5 GOEB proved undeveloped or 33 percent of the proved reserves reported at the end of 2009. The net reduction inthe percentage of proved undeveloped reserves from 2009 is reflective of our active development programs on many projects worldwide which made significantprogress in converting proved undeveloped reserves into proved developed reserves in 2010. During the year, ExxonMobil completed development work in over80 fields and participated in major project start-ups that resulted in the transfer of approximately 1.4 GOEB from proved undeveloped to proved developedreserves by year-end. This represented the movement of 18 percent of the proved undeveloped reserves into the proved developed category or an average turnovertime of about five years. The largest individual transfer was associated with the completion and startup of the Ras Laffan (3) Train 7 liquefied natural gas (LNG)train in Qatar.
One of ExxonMobil’s requirements for reporting proved reserves is that management has made significant funding commitments toward the developmentof the reserves. ExxonMobil has a disciplined investment strategy and many major fields require a long lead-time in order to be developed. Development projectstypically take two to four years from the time of first recording of proved reserves to the start of production of these reserves. However, the development time forlarge and complex projects can exceed five years. During 2010, new approved projects added approximately 0.2 GOEB of proved undeveloped reserves. Thelargest of these was the Sakhalin 1 Arkutun Dagi development in Russia. Overall, investments of $19.4 billion were made by the Corporation during 2010 toprogress the development of reported proved undeveloped reserves, including $16.8 billion for oil and gas producing activities and an additional $2.6 billion forother non-oil and gas producing activities such as the construction of LNG trains, tankers and regasification facilities that were undertaken to progress thedevelopment of proved undeveloped reserves. These investments represented 71 percent of the $27.3 billion in total reported Upstream capital and explorationexpenditures.
Proved undeveloped reserves in Kazakhstan, Netherlands, United States, Nigeria, and Canada have remained undeveloped for five years or more primarilydue to constraints on the capacity of infrastructure and the pace of co-venture/government funding, as well as the time required to complete development for verylarge projects. The Corporation is reasonably certain that these proved reserves will be produced; however, the timing and amount recovered can be affected by anumber of factors including completion of development projects, reservoir performance and regulatory approvals.
8
Table of Contents
Index to Financial Statements
Approximately one third of the proved undeveloped reserves that have been reported for five or more years are in Kazakhstan and are related to two separatedevelopments. The first is the initial development of the giant offshore Kashagan field which is included in the North Caspian Production Sharing Agreement inwhich ExxonMobil participates. The second is the Tengizchevroil joint venture which includes a production license in the Tengiz field and the nearby Korolevfield. The joint venture is producing and proved undeveloped reserves will continue to move to proved developed as approved development phases progress.
9
Table of Contents
Index to Financial Statements
3. Oil and Gas Production, Production Prices and Production Costs A. Oil and Gas Production The table below summarizes production by final product sold and by geographic area for the last three years. 2010 2009 2008 (thousands of barrels daily) Crude oil and natural gas liquids production
Consolidated Subsidiaries United States 339 311 289 Canada/South America 81 82 106 Europe 330 374 423 Africa 628 685 652 Asia 326 287 319 Australia/Oceania 58 65 67
Total Consolidated Subsidiaries 1,762 1,804 1,856
Equity Companies United States 69 73 78 Europe 5 5 5 Asia 404 320 280
Total Equity Companies 478 398 363
Total crude oil and natural gas liquids production 2,240 2,202 2,219
Bitumen production Consolidated Subsidiaries
Canada/South America 115 120 124
Synthetic oil production Consolidated Subsidiaries
Canada/South America 67 65 62
Total liquids production 2,422 2,387 2,405
(millions of cubic feet daily) Natural gas production available for sale
Consolidated Subsidiaries United States 2,595 1,274 1,245 Canada/South America 569 643 640 Europe 1,859 2,071 2,253 Africa 14 19 32 Asia 1,847 1,414 1,437 Australia/Oceania 332 315 358
Total Consolidated Subsidiaries 7,216 5,736 5,965
Equity Companies United States 1 1 1 Europe 1,977 1,618 1,696 Asia 2,954 1,918 1,433
Total Equity Companies 4,932 3,537 3,130
Total natural gas production available for sale 12,148 9,273 9,095
(thousands of oil-equivalent
barrels daily)
Oil-equivalent production 4,447 3,932 3,921
(1) South America includes liquids production for 2010, 2009 and 2008 of one thousand barrels daily for each year respectively and natural gas productionavailable for sale for 2010, 2009 and 2008 of 52 million, 58 million, and 63 million cubic feet daily for each year respectively.
10
(1)
(1)
Table of Contents
Index to Financial Statements
B. Production Prices and Production Costs The table below summarizes average production prices and average production costs by geographic area and by product type for the last three years.
During 2010 UnitedStates
Canada/S. America Europe Africa Asia
Australia/Oceania Total
Consolidated Subsidiaries Average production prices
Average production costs, per oil-equivalent barrel - total 9.92 20.07 11.62 9.63 5.65 11.20 10.54 Average production costs, per barrel - bitumen — 17.81 — — — — 17.81 Average production costs, per barrel - synthetic oil — 42.79 — — — — 42.79
Equity Companies Average production prices
Crude oil and NGL, per barrel 74.70 — 74.14 — 72.67 — 72.98 Natural gas, per thousand cubic feet 8.30 — 6.91 — 5.42 — 6.02
Average production costs, per oil-equivalent barrel - total 19.11 — 2.41 — 0.98 — 2.31
Total Average production prices
Crude oil and NGL, per barrel 70.98 69.92 73.38 78.08 72.80 68.91 73.81 Natural gas, per thousand cubic feet 3.92 3.41 6.68 2.15 4.56 3.31 5.00 Bitumen, per barrel — 56.61 — — — — 56.61 Synthetic oil, per barrel — 78.42 — — — — 78.42
Average production costs, per oil-equivalent barrel - total 10.67 20.07 8.46 9.63 2.91 11.20 8.14 Average production costs, per barrel - bitumen — 17.81 — — — — 17.81 Average production costs, per barrel - synthetic oil — 42.79 — — — — 42.79
During 2009 Consolidated Subsidiaries
Average production prices Crude oil and NGL, per barrel $ 53.43 $ 54.07 $ 56.88 $ 60.10 $ 60.38 $ 54.84 $ 57.86 Natural gas, per thousand cubic feet 3.10 3.19 5.61 1.70 3.07 2.97 4.00 Bitumen, per barrel — 45.22 — — — — 45.22 Synthetic oil, per barrel — 61.26 — — — — 61.26
Average production costs, per oil-equivalent barrel - total 11.80 17.75 10.19 8.07 6.55 8.98 10.25 Average production costs, per barrel - bitumen — 14.77 — — — — 14.77 Average production costs, per barrel - synthetic oil — 37.47 — — — — 37.47
Equity Companies Average production prices
Crude oil and NGL, per barrel 56.54 — 58.20 — 56.12 — 56.22 Natural gas, per thousand cubic feet 5.75 — 8.20 — 3.79 — 5.81
Average production costs, per oil-equivalent barrel - total 18.07 — 2.48 — 1.07 — 2.72
Total Average production prices
Crude oil and NGL, per barrel 54.02 54.07 56.89 60.10 58.18 54.84 57.56 Natural gas, per thousand cubic feet 3.10 3.19 6.74 1.70 3.48 2.97 4.69 Bitumen, per barrel — 45.22 — — — — 45.22 Synthetic oil, per barrel — 61.26 — — — — 61.26
Average production costs, per oil-equivalent barrel - total 12.57 17.75 8.06 8.07 3.53 8.98 8.36 Average production costs, per barrel - bitumen — 14.77 — — — — 14.77 Average production costs, per barrel - synthetic oil — 37.47 — — — — 37.47
11
Table of Contents
Index to Financial Statements
During 2008 UnitedStates
Canada/S. America Europe Africa Asia
Australia/Oceania Total
Consolidated Subsidiaries Average production prices
Average production costs, per oil-equivalent barrel - total 11.80 18.03 8.97 6.66 5.37 7.18 9.38 Average production costs, per barrel - bitumen — 19.55 — — — — 19.55 Average production costs, per barrel - synthetic oil — 41.47 — — — — 41.47
Equity Companies Average production prices
Crude oil and NGL, per barrel 89.94 — 85.08 — 91.16 — 90.80 Natural gas, per thousand cubic feet 13.97 — 11.09 — 8.46 — 9.89
Average production costs, per oil-equivalent barrel - total 18.55 — 4.06 — 1.54 — 3.86
Total Average production prices
Crude oil and NGL, per barrel 87.95 89.46 89.59 92.69 92.72 86.08 90.93 Natural gas, per thousand cubic feet 7.23 7.82 10.54 3.33 6.67 2.97 8.35 Bitumen, per barrel — 65.45 — — — — 65.45 Synthetic oil, per barrel — 100.35 — — — — 100.35
Average production costs, per oil-equivalent barrel - total 12.72 18.03 7.67 6.66 3.53 7.18 8.14 Average production costs, per barrel - bitumen — 19.55 — — — — 19.55 Average production costs, per barrel - synthetic oil — 41.47 — — — — 41.47
Average production prices have been calculated by using sales quantities from the Corporation’s own production as the divisor. Average production costs
have been computed by using net production quantities for the divisor. The volumes of crude oil and natural gas liquids (NGL) production used for thiscomputation are shown in the oil and gas production table in section 3.A. The volumes of natural gas used in the calculation are the production volumes of naturalgas available for sale and are also shown in section 3.A. The natural gas available for sale volumes are different from those shown in the reserves table in the “Oiland Gas Reserves” part of the “Supplemental Information on Oil and Gas Exploration and Production Activities” portion of the Financial Section of this reportdue to volumes consumed or flared. Gas is converted to an oil-equivalent basis at six million cubic feet per one thousand barrels.
12
Table of Contents
Index to Financial Statements
4. Drilling and Other Exploratory and Development Activities A. Number of Net Productive and Dry Wells Drilled 2010 2009 2008 Net Productive Exploratory Wells Drilled
Consolidated Subsidiaries United States 17 10 10 Canada/South America 12 4 — Europe 3 2 3 Africa 1 2 3 Asia — — 2 Australia/Oceania 2 1 —
Total Consolidated Subsidiaries 35 19 18
Equity Companies United States — — — Europe 2 1 1 Asia — — —
Total Equity Companies 2 1 1
Total productive exploratory wells drilled 37 20 19
Net Dry Exploratory Wells Drilled Consolidated Subsidiaries
United States 2 1 3 Canada/South America 1 — — Europe — 4 2 Africa 1 3 2 Asia 2 1 — Australia/Oceania 1 — 1
Total Consolidated Subsidiaries 7 9 8
Equity Companies United States — — — Europe — — — Asia — — 1
Total Equity Companies — — 1
Total dry exploratory wells drilled 7 9 9
13
Table of Contents
Index to Financial Statements
2010 2009 2008 Net Productive Development Wells Drilled
Consolidated Subsidiaries United States 604 165 105 Canada/South America 229 291 223 Europe 11 10 8 Africa 60 45 39 Asia 7 9 16 Australia/Oceania 2 7 3
Total Consolidated Subsidiaries 913 527 394
Equity Companies United States 282 287 321 Europe 1 1 2 Asia 4 14 14
Total Equity Companies 287 302 337
Total productive development wells drilled 1,200 829 731
Net Dry Development Wells Drilled Consolidated Subsidiaries
United States 2 3 3 Canada/South America — — 1 Europe — 1 — Africa 2 — — Asia — — — Australia/Oceania 1 1 —
Total Consolidated Subsidiaries 5 5 4
Equity Companies United States — — — Europe — — — Asia — — —
Total Equity Companies — — —
Total dry development wells drilled 5 5 4
Total number of net wells drilled 1,249 863 763
14
Table of Contents
Index to Financial Statements
B. Exploratory and Development Activities Regarding Oil and Gas Resources Extracted by Mining Technologies Syncrude Operations Syncrude is a joint venture established to recover shallow deposits of oil sands using open-pit mining methods to extract the crude bitumen, and thenupgrade it to produce a high-quality, light (32 degrees API), sweet, synthetic crude oil. Imperial Oil Limited is the owner of a 25 percent interest in the jointventure. Exxon Mobil Corporation has a 69.6 percent interest in Imperial Oil Limited. In 2010, the company’s share of net production of synthetic crude oil wasabout 67,000 barrels per day. The Syncrude leases cover about 63 thousand acres in the Athabasca oil sands deposit.
Kearl Project The Kearl project is a joint venture established to recover shallow deposits of oil sands using open-pit mining methods to extract the crude bitumen.Imperial Oil Limited holds a 70.96 percent interest in the joint venture and ExxonMobil Canada Properties holds the other 29.04 percent. Exxon MobilCorporation has a 69.6 percent interest in Imperial Oil Limited and a 100 percent interest in ExxonMobil Canada Properties. Kearl is comprised of six oil sandsleases covering about 48 thousand acres in the Athabasca oil sands deposit.
The Kearl project is located approximately 40 miles north of Fort McMurray, Alberta, Canada. Kearl is expected to be developed in two phases. Bitumenwill be extracted from oil sands produced from open-pit mining operations, and processed through a bitumen extraction and froth treatment plant. The product, ablend of bitumen and diluent, is planned to be shipped via pipelines for distribution to North American markets. Diluent is natural gas condensate or other lighthydrocarbons added to the crude bitumen to facilitate transportation to market by pipeline. At year-end 2010, the initial development of the Kearl project wasmore than 50 percent complete with expected startup in 2012.
15
Table of Contents
Index to Financial Statements
5. Present Activities A. Wells Drilling
Year-end
2010 Year-end
2009 Gross Net Gross Net Wells Drilling
Consolidated Subsidiaries United States 1,088 491 185 146 Canada/South America 92 30 83 57 Europe 27 8 20 4 Africa 54 19 24 8 Asia 98 66 20 4 Australia/Oceania 1 — 4 2
Total Consolidated Subsidiaries 1,360 614 336 221
Equity Companies United States 1 1 10 5 Europe 34 10 16 5 Asia 7 1 5 —
Total Equity Companies 42 12 31 10
Total gross and net wells drilling 1,402 626 367 231
B. Review of Principal Ongoing Activities UNITED STATES ExxonMobil’s year-end 2010 acreage holdings totaled 14.8 million net acres, of which 2.2 million net acres were offshore. ExxonMobil was active in areasonshore and offshore in the lower 48 states and in Alaska. The acquisition of XTO Energy Inc. (XTO) was completed in 2010.
During 2010, 879.5 net exploration and development wells were completed in the inland lower 48 states, including development activities in the BarnettShale of North Texas, the Freestone Trend of East Texas, the Haynesville Shale of Texas and Louisiana, the Fayetteville Shale of Arkansas, the Woodford Shaleof Oklahoma, the Bakken oil play in North Dakota and Montana, the Marcellus Shale of Pennsylvania and West Virginia, the Eagle Ford Shale of South Texas,and the Piceance Basin of Colorado. Participation in Alaska production and development continued and a total of 22.2 net exploration and development wellswere completed.
ExxonMobil’s net acreage in the Gulf of Mexico at year-end 2010 was 2.1 million net acres. A total of 3.7 net exploration and development wells werecompleted during the year. The non-operated St. Malo project in the Gulf of Mexico was approved in 2010. Offshore California 1.0 net development well wascompleted.
The Golden Pass LNG regasification terminal in Texas commenced operations in 2010. The terminal will have the capacity to deliver up to two billioncubic feet of gas per day.
16
Table of Contents
Index to Financial Statements
CANADA / SOUTH AMERICA Canada Oil and Gas Operations ExxonMobil’s year-end 2010 acreage holdings totaled 6.0 million net acres, of which 2.3 million net acres were offshore. A total of 129.0 net explorationand development wells were completed during the year. The Hibernia Southern Extension project development plan was approved in 2010.
In Situ Bitumen Operations ExxonMobil’s year-end 2010 in situ bitumen acreage holdings totaled 0.5 million net onshore acres. A total of 110.0 net development wells were completedduring the year.
Argentina ExxonMobil’s net acreage totaled 0.3 million onshore acres at year-end 2010, and there were 2.0 net development wells completed during the year.
Venezuela ExxonMobil’s acreage holdings and assets were expropriated in 2007. Refer to the relevant portion of “Note 15: Litigation and Other Contingencies” of theFinancial Section of this report for additional information. EUROPE Germany A total of 4.8 million net onshore acres and 0.1 million net offshore acres were held by ExxonMobil at year-end 2010, with 7.3 net exploration anddevelopment wells completed during the year.
Netherlands ExxonMobil’s net interest in licenses totaled approximately 1.6 million acres at year-end 2010, of which 1.2 million acres are onshore. A total of 3.0 netexploration and development wells were completed during the year. The non-operated project to redevelop the Schoonebeek oil field was progressed.
Norway ExxonMobil’s net interest in licenses at year-end 2010 totaled approximately 0.6 million acres, all offshore. ExxonMobil participated in 3.5 net explorationand development well completions in 2010.
United Kingdom ExxonMobil’s net interest in licenses at year-end 2010 totaled approximately 0.4 million acres, all offshore. A total of 2.9 net development wells werecompleted during the year. The South Hook liquefied natural gas (LNG) terminal reached full capacity of two billion cubic feet per day in 2010.
17
Table of Contents
Index to Financial Statements
AFRICA Angola ExxonMobil’s year-end 2010 acreage holdings totaled 0.6 million net offshore acres, and 2.2 net exploration and development wells were completed duringthe year. The Angola Gas Gathering Project started up on-block gas handling in 2010, and project work continued on Kizomba Satellites Phase 1. On the non-operated Block 17, the Cravo-Lirio-Orquidea-Violeta project was funded in 2010, while project execution continued at Pazflor. On the non-operated Block 31,project work continued on the Plutao-Saturno-Venus-Marte project.
Chad ExxonMobil’s net year-end 2010 acreage holdings consisted of 63 thousand onshore acres with 46.0 net exploration and development wells completedduring the year.
Equatorial Guinea ExxonMobil’s acreage totaled 0.1 million net offshore acres at year-end 2010, with 5.3 net development wells completed during the year.
Nigeria ExxonMobil’s net acreage totaled 1.0 million offshore acres at year-end 2010, with 9.4 net exploration and development wells completed during the year.Work continued on the deepwater Usan project in 2010. A 3-D seismic acquisition program was completed on the Nigerian Shelf joint venture acreage. ASIA Azerbaijan At year-end 2010, ExxonMobil’s net acreage, located in the Caspian Sea offshore of Azerbaijan, totaled 60 thousand acres. At the Azeri-Chirag-Gunashlifield, 0.6 net development wells were completed. The Chirag Oil Project was funded in 2010, and project activities are under way.
Indonesia At year-end 2010, ExxonMobil had 4.4 million net acres, 3.3 million net acres offshore and 1.1 million net acres onshore. A total of 0.8 net explorationwells were completed during the year.
Iraq At year-end 2010, ExxonMobil’s onshore acreage was 87 thousand net acres. During 2010, a contract was signed with South Oil Company of the IraqiMinistry of Oil to redevelop and expand the West Qurna (Phase 1) oil field. The term of the contract is 20 years with the right to extend for five years. In 2010initial field rehabilitation activities commenced. Field rehabilitation activities across the life of this project will include drilling of new wells, working over ofexisting wells, optimization and debottlenecking of existing facilities, and the establishment of field offices and camps.
Kazakhstan ExxonMobil’s net acreage totaled 0.1 million acres onshore and 0.2 million acres offshore at year-end 2010, with 0.2 net development wells completedduring 2010. Working with our partners, construction of the initial phase of the Kashagan field continued during 2010.
18
Table of Contents
Index to Financial Statements
Malaysia ExxonMobil has interests in production sharing contracts covering 0.5 million net acres offshore Malaysia at year-end 2010. During the year, a total of 5.1net exploration and development wells were completed.
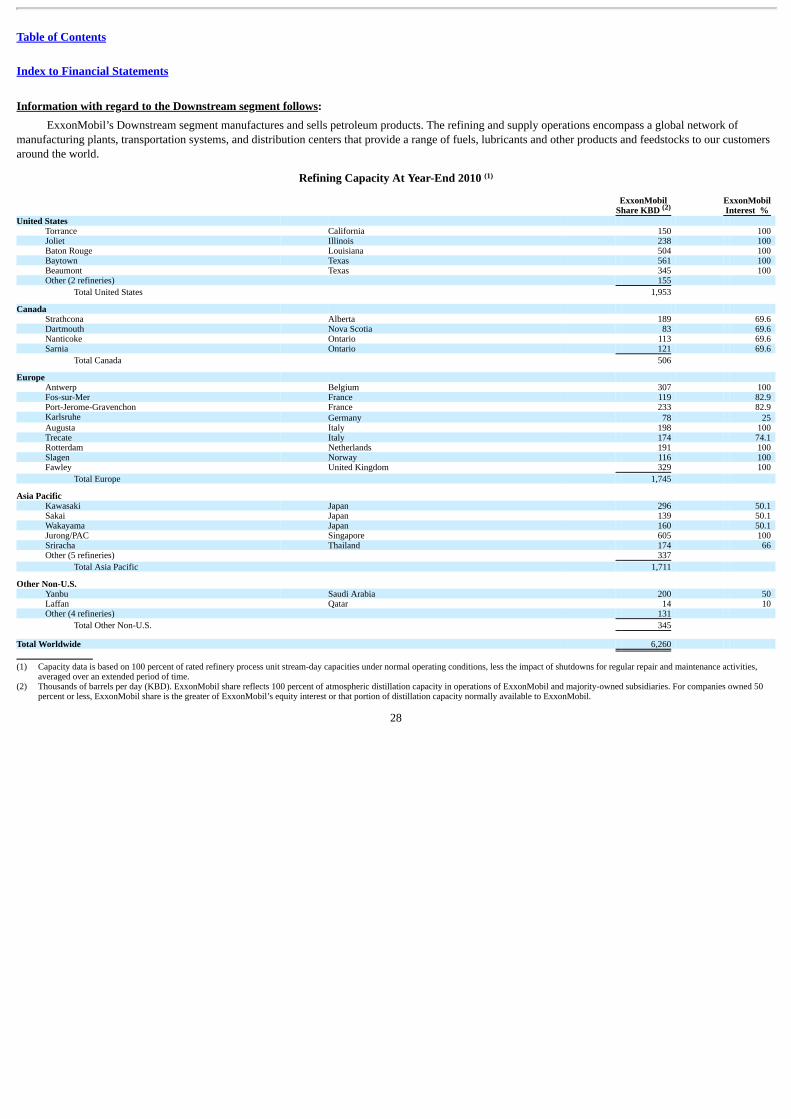
Qatar Through our joint ventures with Qatar Petroleum, ExxonMobil’s net acreage totaled 60 thousand acres offshore at year-end 2010. Following the startup ofRasGas Train 7 during 2010, ExxonMobil participated in 61.8 million tonnes per year gross liquefied natural gas (LNG) capacity at year end.
Republic of Yemen ExxonMobil’s net acreage in the Republic of Yemen production sharing areas totaled 10 thousand acres onshore at year-end 2010.
Russia ExxonMobil’s net acreage holdings at year-end 2010 were 85 thousand acres, all offshore. A total of 1.5 net development wells were completed at theSakhalin-1 Odoptu field during the year which started production in 2010. The Sakhalin-1 Chayvo Expansion and Arkutun-Dagi projects were both funded in2010, and project activities are under way.
Thailand ExxonMobil’s net onshore acreage in Thailand concessions totaled 21 thousand acres at year-end 2010.
United Arab Emirates ExxonMobil’s net acreage in the Abu Dhabi offshore Upper Zakum oil concession was 81 thousand acres at year end 2010. During the year, 0.6 netdevelopment wells were completed, as rig activity focused mainly on workovers and injection wells.
ExxonMobil’s net acreage in the Abu Dhabi onshore oil concession was 0.5 million acres at year-end 2010, of which 0.4 million acres are onshore. Duringthe year, a total of 4.3 net development wells were completed. AUSTRALIA/OCEANIA Australia ExxonMobil’s net year-end 2010 offshore acreage holdings totaled 1.7 million acres. During 2010, a total of 5.3 net exploration and development wellswere drilled. Offshore installation commenced for the Kipper Tuna Turrum project.
Project construction activity for the co-venturer operated Gorgon liquefied natural gas (LNG) project progressed in 2010. The project consists of a subseainfrastructure for offshore production and transportation of the gas, and a 15 million tonnes per year LNG facility and a 280 million cubic feet per day domesticgas plant located on Barrow Island, Western Australia.
19
Table of Contents
Index to Financial Statements
Papua New Guinea A total of 0.4 million net onshore acres were held by ExxonMobil at year-end 2010, with 0.4 net development wells completed during the year. In 2010, thePapua New Guinea liquefied natural gas project commenced construction activities. The project consists of conditioning facilities in the southern PNG Highlands,a 6.6 million tonnes per year LNG facility near Port Moresby and approximately 450 miles of onshore and offshore pipelines. WORLDWIDE EXPLORATION At year-end 2010, exploration activities were under way in several areas in which ExxonMobil has no established production operations and thus are notincluded above. A total of 40.6 million net acres were held at year-end 2010, and 2.6 net exploration wells were completed during the year in these countries. 6. Delivery Commitments ExxonMobil sells crude oil and natural gas from its producing operations under a variety of contractual obligations, some of which may specify thedelivery of a fixed and determinable quantity for periods longer than one year. ExxonMobil also enters into natural gas sales contracts where the source of thenatural gas used to fulfill the contract can be a combination of our own production and the spot market. Worldwide, we are contractually committed to deliverapproximately 17 million barrels of crude oil and 3,900 billion cubic feet of natural gas for the period from 2011 through 2013. We expect to fulfill the majorityof these delivery commitments with production from our proved developed reserves. Any remaining commitments will be fulfilled with production from ourproved undeveloped reserves and spot market purchases as necessary.
20
Table of Contents
Index to Financial Statements
7. Oil and Gas Properties, Wells, Operations and Acreage A. Gross and Net Productive Wells Year-end 2010 Year-end 2009 Oil Gas Oil Gas Gross Net Gross Net Gross Net Gross Net Gross and Net Productive Wells
Consolidated Subsidiaries United States 23,789 8,076 36,189 21,429 15,606 4,821 9,261 5,645 Canada/South America 5,609 5,092 6,650 3,361 5,357 4,828 6,728 3,408 Europe 1,438 395 672 291 1,395 389 649 292 Africa 1,126 454 14 6 1,081 432 13 5 Asia 845 411 207 173 751 352 197 162 Australia/Oceania 687 163 27 13 722 170 41 21
Total gross and net productive wells 45,675 19,999 44,481 25,500 37,404 16,556 17,599 9,760
There were 35,691 gross and 30,494 net operated wells at year-end 2010 and 16,587 gross and 13,737 net operated wells at year-end 2009. The number of
wells with multiple completions was 1,725 gross in 2010 and 1,039 gross in 2009.
B. Gross and Net Developed Acreage Year-end 2010 Year-end 2009 Gross Net Gross Net (thousands of acres) Gross and Net Developed Acreage
Consolidated Subsidiaries United States 16,621 9,861 9,866 5,061 Canada/South America 5,450 2,439 5,570 2,460 Europe 3,956 1,630 5,359 2,454 Africa 1,772 684 1,958 758 Asia 1,411 623 1,226 512 Australia/Oceania 1,955 719 1,956 719
Total Consolidated Subsidiaries 31,165 15,956 25,935 11,964 Equity Companies
United States 137 58 165 59 Europe 4,363 1,356 4,325 1,352 Asia 5,818 648 5,817 648
Total Equity Companies 10,318 2,062 10,307 2,059
Total gross and net developed acreage 41,483 18,018 36,242 14,023
(1) Includes gross and net developed acreage in South America of 618 gross and 202 net thousands of acres for 2010 and 618 gross and 202 net thousands ofacres for 2009.
Separate acreage data for oil and gas are not maintained because, in many instances, both are produced from the same acreage.
21
(1)
Table of Contents
Index to Financial Statements
C. Gross and Net Undeveloped Acreage Year-end 2010 Year-end 2009 Gross Net Gross Net (thousands of acres) Gross and Net Undeveloped Acreage
Consolidated Subsidiaries United States 8,393 4,845 7,650 5,034 Canada/South America 20,612 11,977 26,074 17,107 Europe 34,787 16,118 25,420 13,462 Africa 14,733 8,612 15,768 10,555 Asia 24,203 19,086 25,568 20,400 Australia/Oceania 4,966 1,352 9,780 5,216
Total Consolidated Subsidiaries 107,694 61,990 110,260 71,774 Equity Companies
United States 188 69 208 77 Europe — — 53 8 Asia — — 228 57
Total Equity Companies 188 69 489 142
Total gross and net undeveloped acreage 107,882 62,059 110,749 71,916
(1) Includes gross and net undeveloped acreage in South America of 10,111 gross and 7,442 net thousands of acres for 2010 and 12,005 gross and 11,800 netthousands of acres for 2009.
ExxonMobil’s investment in developed and undeveloped acreage is comprised of numerous concessions, blocks and leases. The terms and conditions under
which the Corporation maintains exploration and/or production rights to the acreage are property-specific, contractually defined and vary significantly fromproperty to property. Work programs are designed to ensure that the exploration potential of any property is fully evaluated before expiration. In some instances,the Corporation may elect to relinquish acreage in advance of the contractual expiration date if the evaluation process is complete and there is not a business basisfor extension. In cases where additional time may be required to fully evaluate acreage, the Corporation has generally been successful in obtaining extensions.The scheduled expiration of leases and concessions for undeveloped acreage over the next three years is not expected to have a material adverse impact on theCorporation.
D. Summary of Acreage Terms UNITED STATES Oil and gas leases have an exploration period ranging from one to ten years, and a production period that normally remains in effect until productionceases. Under certain circumstances, a lease may be held beyond its exploration term even if production has not commenced. In some instances, a “fee interest” isacquired where both the surface and the underlying mineral interests are owned outright. CANADA / SOUTH AMERICA Canada Exploration permits are granted for varying periods of time with renewals possible. Exploration rights in onshore areas acquired from Canadian provincesentitle the holder to obtain leases upon
22
(1)
Table of Contents
Index to Financial Statements
completing specified work. In general, production leases are held as long as there is production on the lease. The majority of Cold Lake leases are held in thismanner. The exploration acreage in eastern Canada and the block in the Beaufort Sea acquired in 2007 are currently held by work commitments of variousamounts.
Argentina The federal onshore concession terms in Argentina are up to four years for the initial exploration period, up to three years for the second exploration periodand up to two years for the third exploration period. A 50-percent relinquishment is required after each exploration period. An extension after the thirdexploration period is possible for up to five years. The total production term is 25 years with a ten-year extension possible, once a field has been developed.Argentine provinces are entitled to modify the concession terms granted within their territories. The exploration permit granted by Neuquen Province to anExxonMobil affiliate in 2010 fixed the initial exploration period at three years, the second at two years and the third at one year, and one of these periods can beextended for an additional year. EUROPE Germany Exploration concessions are granted for an initial maximum period of five years, with an unlimited number of extensions of up to three years each.Extensions are subject to specific, minimum work commitments. Production licenses are normally granted for 20 to 25 years with multiple possible extensions aslong as there is production on the license. In 2007, ExxonMobil affiliates acquired four exploration licenses in the state of Lower Saxony. The explorationlicenses are for a period of five years during which exploration work programs will be carried out. In 2009, ExxonMobil affiliates acquired two explorationlicenses in the state of North Rhine Westphalia for an initial period of five years and an extension to one of the Lower Saxony licenses.
Netherlands Under the Mining Law, effective January 1, 2003, exploration and production licenses for both onshore and offshore areas are issued for a period asexplicitly defined in the license. The term is based on the period of time necessary to perform the activities for which the license is issued. License conditions arestipulated in the Mining Law.
Production rights granted prior to January 1, 2003, remain subject to their existing terms, and differ slightly for onshore and offshore areas. Onshoreproduction licenses issued prior to 1988 were indefinite; from 1988 they were issued for a period as explicitly defined in the license, ranging from 35 to 45 years.Offshore production licenses issued before 1976 were issued for a fixed period of 40 years; from 1976 they were again issued for a period as explicitly defined inthe license, ranging from 15 to 40 years.
Norway Licenses issued prior to 1972 were for an initial period of six years and an extension period of 40 years, with relinquishment of at least one-fourth of theoriginal area required at the end of the sixth year and another one-fourth at the end of the ninth year. Licenses issued between 1972 and 1997 were for an initialperiod of up to six years (with extension of the initial period of one year at a time up to ten years after 1985), and an extension period of up to 30 years, withrelinquishment of at least one-half of the original area required at the end of the initial period. Licenses issued after July 1, 1997, have an
23
Table of Contents
Index to Financial Statements
initial period of up to ten years and a normal extension period of up to 30 years or in special cases of up to 50 years, and with relinquishment of at least one-halfof the original area required at the end of the initial period.
United Kingdom Acreage terms are fixed by the government and are periodically changed. For example, many of the early licenses issued under the first four licensingrounds provided for an initial term of six years with relinquishment of at least one-half of the original area at the end of the initial term, subject to extension for afurther 40 years. At the end of any such 40-year term, licenses may continue in producing areas until cessation of production; or licenses may continue indevelopment areas for periods agreed on a case-by-case basis until they become producing areas; or licenses terminate in all other areas. The licensing regime waslast updated in 2002, and the majority of licenses issued have an initial term of four years with a second term extension of four years and a final term of 18 yearswith a mandatory relinquishment of 50 percent of the acreage after the initial term and of all acreage that is not covered by a development plan at the end of thesecond term. AFRICA Angola Exploration and production activities are governed by production sharing agreements with an initial exploration term of four years and an optional secondphase of two to three years. The production period is for 25 years, and agreements generally provide for a negotiated extension.
Chad Exploration permits are issued for a period of five years, and are renewable for one or two further five-year periods. The terms and conditions of thepermits, including relinquishment obligations, are specified in a negotiated convention. The production term is for 30 years and may be extended at the discretionof the government.
Equatorial Guinea Exploration and production activities are governed by production sharing contracts negotiated with the State Ministry of Mines, Industry and Energy. Theexploration periods are for ten to 15 years with limited relinquishments in the absence of commercial discoveries. The production period for crude oil is 30 yearswhile the production period for gas is 50 years. A new Hydrocarbons Law was enacted in November 2006. Under the new law, the exploration terms for newproduction sharing contracts are four to five years with a maximum of two one-year extensions, unless the Ministry agrees otherwise.
Nigeria Exploration and production activities in the deepwater offshore areas are typically governed by production sharing contracts (PSCs) with the national oilcompany, the Nigerian National Petroleum Corporation (NNPC). NNPC holds the underlying Oil Prospecting License (OPL) and any resulting Oil Mining Lease(OML). The terms of the PSCs are generally 30 years, including a ten-year exploration period (an initial exploration phase plus one or two optional periods)covered by an OPL. Upon commercial discovery, an OPL may be converted to an OML. Partial relinquishment is required under the PSC at the end of the ten-year exploration period, and OMLs have a 20-year production period that may be extended.
24
Table of Contents
Index to Financial Statements
Some exploration activities are carried out in deepwater by joint ventures with local companies holding interests in an OPL. OPLs in deepwater offshoreareas are valid for ten years and are non-renewable, while in all other areas the licenses are for five years and also are non-renewable. Demonstrating acommercial discovery is the basis for conversion of an OPL to an OML.
OMLs granted prior to the 1969 Petroleum Act (i.e., under the Mineral Oils Act 1914, repealed by the 1969 Petroleum Act) were for 30 years onshore and40 years in offshore areas and have been renewed, effective December 1, 2008, for a further period of 20 years, with a further renewal option of 20 years.Operations under these pre-1969 OMLs are conducted under a joint venture agreement with NNPC rather than a PSC. In 2000, a Memorandum of Understanding(MOU) was executed defining commercial terms applicable to existing joint venture oil production. The MOU may be terminated on one calendar year’s notice.
OMLs granted under the 1969 Petroleum Act, which include all deepwater OMLs, have a maximum term of 20 years without distinction for onshore oroffshore location and are renewable, upon 12 months’ written notice, for another period of 20 years. OMLs not held by NNPC are also subject to a mandatory 50-percent relinquishment after the first ten years of their duration. ASIA Azerbaijan The production sharing agreement (PSA) for the development of the Azeri-Chirag-Gunashli field is established for an initial period of 30 years startingfrom the PSA execution date in 1994.
Other exploration and production activities are governed by PSAs negotiated with the national oil company of Azerbaijan. The exploration period consistsof three or four years with the possibility of a one to three-year extension. The production period, which includes development, is for 25 years or 35 years withthe possibility of one or two five-year extensions.
Indonesia Exploration and production activities in Indonesia are generally governed by cooperation contracts, usually in the form of a production sharing contract,negotiated with BPMIGAS, a government agency established in 2002 to manage upstream oil and gas activities. Formerly this activity was carried out byPertamina, the government owned oil company, which is now a competing limited liability company.
Iraq Development and production activities in the state-owned oil and gas fields are governed by contracts with regional oil companies of the Iraq Ministry ofOil. An ExxonMobil affiliate entered into a contract with South Oil Company of the Ministry of Iraq for the rights to participate in the development andproduction activities of the West Qurna (Phase I) oil and gas field effective March 1, 2010. The term of the contract is 20 years with the right to extend for 5years.
Kazakhstan Onshore exploration and production activities are governed by the production license, exploration license and joint venture agreements negotiated with theRepublic of Kazakhstan. Existing production operations have a 40-year production period that commenced in 1993.
Offshore exploration and production activities are governed by a production sharing agreement negotiated with the Republic of Kazakhstan. Theexploration period is six years followed by separate appraisal periods for each discovery. The production period for each discovery, which includes development,is for 20 years from the date of declaration of commerciality with the possibility of two ten-year extensions.
25
Table of Contents
Index to Financial Statements
Malaysia Exploration and production activities are governed by production sharing contracts (PSCs) negotiated with the national oil company. The more recent PSCsgoverning exploration and production activities have an overall term of 24 to 38 years, depending on water depth, with possible extensions to the explorationand/or development periods. The exploration period is five to seven years with the possibility of extensions, after which time areas with no commercialdiscoveries will be deemed relinquished. The development period is from four to six years from commercial discovery, with the possibility of extensions underspecial circumstances. Areas from which commercial production has not started by the end of the development period will be deemed relinquished if no extensionis granted. All extensions are subject to the national oil company’s prior written approval. The total production period is 15 to 25 years from first commerciallifting, not to exceed the overall term of the contract.
In 2008, the Company reached agreement with the national oil company for a new PSC, which was subsequently signed in 2009. Under the new PSC, from2008 until March 31, 2012, the Company is entitled to undertake new development and production activities in oil fields under an existing PSC, subject to newminimum work and spending commitments, including an enhanced oil recovery project in one of the oil fields. When the existing PSC expires on March 31,2012, the producing fields covered by the existing PSC will automatically become part of the new PSC, which has a 25-year duration from April 2008.
Qatar The State of Qatar grants gas production development project rights to develop and supply gas from the offshore North Field to permit the economicdevelopment and production of gas reserves sufficient to satisfy the gas and LNG sales obligations of these projects.
Republic of Yemen The Jannah production sharing agreement has a development period extending 20 years from first commercial declaration, which was made in June 1995.
Russia Terms for ExxonMobil’s acreage are fixed by the production sharing agreement (PSA) that became effective in 1996 between the Russian government andthe Sakhalin-1 consortium, of which ExxonMobil is the operator. The term of the PSA is 20 years from the Declaration of Commerciality, which would be 2021.The term may be extended thereafter in 10-year increments as specified in the PSA.
Thailand The Petroleum Act of 1971 allows production under ExxonMobil’s concession for 30 years with a ten-year extension at terms generally prevalent at thetime.
United Arab Emirates Exploration and production activities for the major onshore oil fields in the Emirate of Abu Dhabi are governed by a 75-year oil concession agreementexecuted in 1939 and subsequently amended through various agreements with the government of Abu Dhabi. An interest in the Upper Zakum field, a majoroffshore field, was acquired effective as of January 2006, for a term expiring March 2026.
26
Table of Contents
Index to Financial Statements
AUSTRALIA/OCEANIA Australia Exploration and production activities conducted offshore in Commonwealth waters are governed by Federal legislation. Exploration permits are granted foran initial term of six years with two possible five-year renewal periods. Retention leases may be granted for resources that are not commercially viable at the timeof application, but are expected to become commercially viable within 15 years. These are granted for periods of five years and renewals may be requested. Priorto July 1998, production licenses were granted initially for 21 years, with a further renewal of 21 years and thereafter “indefinitely”, i.e., for the life of the field.Effective from July 1998, new production licenses are granted “indefinitely”. In each case, a production license may be terminated if no production operationshave been carried on for five years.
Papua New Guinea Exploration and production activities are governed by the Oil and Gas Act. Petroleum Prospecting licenses are granted for an initial term of six years with afive-year extension possible (an additional extension of three years is possible in certain circumstances). Generally, a 50-percent relinquishment of the licensearea is required at the end of the initial six-year term, if extended. Petroleum Development licenses are granted for an initial 25-year period. An extension of up to20 years may be granted at the Minister’s discretion. Petroleum Retention licenses may be granted for gas resources that are not commercially viable at the timeof application, but may become commercially viable within the maximum possible retention time of 15 years. Petroleum Retention licenses are granted for five-year terms, and may be extended, at the Minister’s discretion, twice for the maximum retention time of 15 years. Extensions of Petroleum Retention licenses maybe for periods of less than one year, renewable annually, if the Minister considers at the time of extension that the resources could become commercially viable inless than five years.
27
Table of Contents
Index to Financial Statements
Information with regard to the Downstream segment follows: ExxonMobil’s Downstream segment manufactures and sells petroleum products. The refining and supply operations encompass a global network ofmanufacturing plants, transportation systems, and distribution centers that provide a range of fuels, lubricants and other products and feedstocks to our customersaround the world.
Refining Capacity At Year-End 2010
ExxonMobil
Share KBD ExxonMobilInterest %
United States Torrance California 150 100 Joliet Illinois 238 100 Baton Rouge Louisiana 504 100 Baytown Texas 561 100 Beaumont Texas 345 100 Other (2 refineries) 155
Total United States 1,953
Canada Strathcona Alberta 189 69.6 Dartmouth Nova Scotia 83 69.6 Nanticoke Ontario 113 69.6 Sarnia Ontario 121 69.6
Total Canada 506
Europe Antwerp Belgium 307 100 Fos-sur-Mer France 119 82.9 Port-Jerome-Gravenchon France 233 82.9 Karlsruhe Germany 78 25 Augusta Italy 198 100 Trecate Italy 174 74.1 Rotterdam Netherlands 191 100 Slagen Norway 116 100 Fawley United Kingdom 329 100
Total Europe 1,745
Asia Pacific Kawasaki Japan 296 50.1 Sakai Japan 139 50.1 Wakayama Japan 160 50.1 Jurong/PAC Singapore 605 100 Sriracha Thailand 174 66 Other (5 refineries) 337
Total Asia Pacific 1,711
Other Non-U.S. Yanbu Saudi Arabia 200 50 Laffan Qatar 14 10 Other (4 refineries) 131
Total Other Non-U.S. 345
Total Worldwide 6,260
(1) Capacity data is based on 100 percent of rated refinery process unit stream-day capacities under normal operating conditions, less the impact of shutdowns for regular repair and maintenance activities,
averaged over an extended period of time.(2) Thousands of barrels per day (KBD). ExxonMobil share reflects 100 percent of atmospheric distillation capacity in operations of ExxonMobil and majority-owned subsidiaries. For companies owned 50
percent or less, ExxonMobil share is the greater of ExxonMobil’s equity interest or that portion of distillation capacity normally available to ExxonMobil.
28
(1)
(2)
Table of Contents
Index to Financial Statements
The marketing operations sell products and services throughout the world. Our Exxon, Esso and Mobil brands serve customers at over 26,000 retail servicestations.
Information with regard to the Chemical segment follows: ExxonMobil’s Chemical segment manufactures and sells petrochemicals. The Chemical business supplies olefins, polyolefins, aromatics, and a widevariety of other petrochemicals.
Middle East Al Jubail Saudi Arabia 0.6 0.6 — — 50 Yanbu Saudi Arabia 1.0 0.7 0.2 — 50
Total Middle East 1.6 1.3 0.2 —
Asia Pacific Fujian China 0.2 0.2 0.1 0.2 25 Kawasaki Japan 0.5 0.1 — — 50 Singapore Singapore 0.9 0.6 0.4 0.9 100 Sriracha Thailand — — — 0.5 66
Total Asia Pacific 1.6 0.9 0.5 1.6
All Other — — — 0.6
Total Worldwide 8.8 7.3 2.2 3.8
(1) Capacity for ethylene, polyethylene, polypropylene and paraxylene in millions of metric tons per year.(2) Capacity reflects 100 percent for operations of ExxonMobil and majority-owned subsidiaries. For companies owned 50 percent or less, capacity is
ExxonMobil’s interest.(3) Net ExxonMobil ethylene capacity is 35%. Net ExxonMobil polyethylene capacity is 100%.
30
(1)(2)
(3)
Table of Contents
Index to Financial Statements
Item 3. Legal Proceedings. Regarding a matter previously reported in the Corporation’s Form 10-Q for the second quarter of 2010, ExxonMobil Oil Corporation’s Beaumont, Texasrefinery entered into an Agreed Order with the Texas Commission on Environmental Quality on November 15, 2010 and paid a civil penalty of $106 thousand toresolve Notices of Violation issued in January and February 2010 relating to six alleged violations of air emission regulations.
With regard to the matter most recently reported in the Corporation’s Form 10-Q for the second quarter of 2007, the New York State Attorney General,Exxon Mobil Corporation and ExxonMobil Oil Corporation have agreed to enter into a Consent Decree to resolve issues relating to alleged contamination atExxonMobil’s former Brooklyn, New York terminal and refinery. The Consent Decree was lodged in the U.S. District Court for the Eastern District of New Yorkon November 17, 2010 and was subject to public comment until January 25, 2011. On January 24, 2011, the United States Department of Justice filed the onlycomments, which sought clarification of some elements of the Consent Decree. Those comments have been incorporated into the Consent Decree, which issubject to review and approval by the Court. If approved, the Consent Decree would require ExxonMobil to undertake actions to investigate and remediate certainenvironmental conditions at the Brooklyn terminal and refinery, pay $19.5 million to fund Environmental Benefit Projects to benefit the Greenpoint Community;pay a civil penalty of $250 thousand; pay $250 thousand for Natural Resources Damages Restoration Projects; pay past costs of the State for oversight of,investigation and remedial activities in the amount of $1.5 million and pay future State oversight costs, up to $3.5 million.
On November 29, 2010, XTO Energy Inc. received a Notice of Violation (NOV) from the Pennsylvania Department of Environmental Protection (PaDEP)alleging that an unpermitted discharge of brine or produced fluid occurred from a tank located at the Marquardt Well Site in Penn Township, Pennsylvania, whichdischarge reached a water of the State and that XTO failed to notify the PaDEP of the incident, had litter on the site, and failed to post well permit numbers andoperator information at the well site. The NOV does not contain a specific penalty demand, but XTO believes that PaDEP may seek a penalty in excess of $100thousand. XTO responded to the NOV on December 9, 2010 and, while not admitting to a violation for the alleged release, agreed to cooperate with PaDEP inresponding to and remediating it.
As reported in the Corporation’s 2009 Form 10-K, in October 2009, a purported shareholder complaint captioned Resnik v. Boskin et al., alleging direct andderivative claims, was filed in the United States District Court for the District of New Jersey, naming the directors serving at the time, the “named executiveofficers” listed in the Corporation’s 2009 Proxy Statement (as defined in Securities and Exchange Commission regulations) and ExxonMobil as defendants. Thecomplaint was amended in December 2009, alleging that the defendants made materially false or misleading proxy solicitations in connection with the 2008 and2009 shareholder votes regarding the election of directors and failed to seek stockholder reapproval of the Exxon Mobil Corporation 2003 Incentive Program toqualify certain incentive compensation paid to the named executive officers as properly deductible expenditures. The amended complaint seeks various injunctiveremedies, including corrective disclosure, new election of directors after corrective disclosure, enjoining candidates from serving on the Board until a newelection occurs, stockholder reapproval of the program, enjoining payments under the program and short term incentive program to the named executive officers,damages (the amount of which is not specified) from the individual defendants in favor of ExxonMobil, and costs and expenses of the action. The defendantsmoved to dismiss the lawsuit on several grounds, including that the plaintiff’s allegations concerning the Corporation’s proxy solicitations do not state claimsunder the federal securities laws and that the plaintiff’s derivative claims cannot stand since the plaintiff failed to make a demand on the Corporation or allegefacts that would excuse a demand. The motion was argued to the district court in August 2010. On February 17, 2011, the court granted defendants’ motion todismiss, finding fatal flaws in the plaintiff’s three causes of action. Notably, the court determined that
31
Table of Contents
Index to Financial Statements
the Internal Revenue Code and Treasury Regulations did not require the Corporation to seek stockholder reapproval of its incentive programs at the time itdistributed the 2008 and 2009 proxy statements. Notwithstanding the plaintiff’s dismissal, the court granted the plaintiff 21 days to amend the three causes ofaction. If the plaintiff does not timely amend, plaintiff will have 30 days thereafter to file a notice of appeal.
Refer to the relevant portions of “Note 15: Litigation and Other Contingencies” of the Financial Section of this report for additional information on legalproceedings. Executive Officers of the Registrant [pursuant to Instruction 3 to Regulation S-K, Item 401(b)](ages as of March 1, 2011). Rex W. Tillerson Chairman of the Board
Held current title since: January 1, 2006 Age: 58Mr. Rex W. Tillerson became a Director and President of Exxon Mobil Corporation on March 1, 2004. He became Chairman of the Board and ChiefExecutive Officer on January 1, 2006. He still holds these positions as of this filing date.
Mark W. Albers Senior Vice President
Held current title since: April 1, 2007 Age: 54Mr. Mark W. Albers was President of ExxonMobil Development Company October 1, 2004 – April 13, 2007. He became Senior Vice President of ExxonMobil Corporation on April 1, 2007, a position he still holds as of this filing date.
Michael J. Dolan Senior Vice President
Held current title since: April 1, 2008 Age: 57Mr. Michael J. Dolan was President of ExxonMobil Chemical Company September 1, 2004 – March 31, 2008. He was Vice President of Exxon MobilCorporation September 1, 2004 – March 31, 2008. He became Senior Vice President of Exxon Mobil Corporation on April 1, 2008, a position he still holdsas of this filing date.
Donald D. Humphreys Senior Vice President and Treasurer
Mr. Donald D. Humphreys was Vice President and Controller of Exxon Mobil Corporation (formerly Exxon Corporation) July 1, 1997 – June 30, 2004. Hewas the Vice President and Treasurer of Exxon Mobil Corporation July 1, 2004 – January 24, 2006. He became Senior Vice President and Treasurer ofExxon Mobil Corporation on January 25, 2006, positions he still holds as of this filing date.
Andrew P. Swiger Senior Vice President
Held current title since: April 1, 2009 Age: 54Mr. Andrew P. Swiger was Executive Vice President of ExxonMobil Production Company May 1, 2004 – September 30, 2006. He was President ofExxonMobil Gas & Power Marketing Company and Vice President of Exxon Mobil Corporation October 1, 2006 – March 31, 2009. He became SeniorVice President of Exxon Mobil Corporation on April 1, 2009, a position he still holds as of this filing date.
32
Table of Contents
Index to Financial Statements
S. Jack Balagia Vice President and General Counsel
Held current title since: March 1, 2010 Age: 59Mr. S. Jack Balagia was Assistant General Counsel of Exxon Mobil Corporation April 1, 2004 to March 1, 2010. He became Vice President and GeneralCounsel of Exxon Mobil Corporation on March 1, 2010, a position he still holds as of this filing date.
William M. Colton Vice President - Strategic Planning
Held current title since: February 1, 2009 Age: 57Mr. William M. Colton was Assistant Treasurer of Exxon Mobil Corporation January 25, 2006 to January 31, 2009. He became Vice President—StrategicPlanning of Exxon Mobil Corporation on February 1, 2009, a position he still holds as of this filing date.
Harold R. Cramer Vice President
Held current title since: November 30, 1999 Age: 60Mr. Harold R. Cramer became President of ExxonMobil Fuels Marketing Company and Vice President of Exxon Mobil Corporation on November 30,1999, positions he still holds as of this filing date.
Neil W. Duffin President, ExxonMobil Development Company
Held current title since: April 13, 2007 Age: 54Mr. Neil W. Duffin was Vice President of ExxonMobil Production Company July 1, 2004 – August 31, 2006. He was Executive Vice President ofExxonMobil Development Company September 1, 2006 – April 13, 2007, becoming President on April 13, 2007, a position he still holds as of this filingdate.
Robert S. Franklin Vice President
Held current title since: May 1, 2009 Age: 53Mr. Robert S. Franklin was Vice President, New Business Development of ExxonMobil Gas & Power Marketing Company July 1, 2001 – April 15, 2007.He was Executive Assistant to the Chairman, Exxon Mobil Corporation April 16, 2007 – March 31, 2008. He was Vice President, Europe/Russia/Caspianof ExxonMobil Production Company April 1, 2008 – May 1, 2009. He became Vice President of Exxon Mobil Corporation and President, ExxonMobilUpstream Ventures on May 1, 2009, positions he still holds as of this filing date.
Sherman J. Glass, Jr. Vice President
Held current title since: April 1, 2008 Age: 63Mr. Sherman J. Glass, Jr. was Senior Vice President of ExxonMobil Chemical Company September 1, 2005 – March 31, 2008. He became President ofExxonMobil Refining & Supply Company and Vice President of Exxon Mobil Corporation on April 1, 2008. He still holds these positions as of this filingdate.
33
Table of Contents
Index to Financial Statements
Stephen M. Greenlee Vice President
Held current title since: September 1, 2010 Age: 53Mr. Stephen M. Greenlee was Vice President of ExxonMobil Exploration Company June 1, 2004 – June 1, 2009. He was President of ExxonMobilUpstream Research Company June 1, 2009 – August 31, 2010. He became President of ExxonMobil Exploration Company and Vice President of ExxonMobil Corporation on September 1, 2010, positions he still holds as of this filing date.
Alan J. Kelly Vice President
Held current title since: December 1, 2007 Age: 53Mr. Alan J. Kelly was Manager, Global Logistics of ExxonMobil Refining & Supply Company February 1, 2005 – February 28, 2006. He was on SpecialAssignment for the National Petroleum Council March 1, 2006 – November 30, 2007. He became President of ExxonMobil Lubricants & PetroleumSpecialties Company and Vice President of Exxon Mobil Corporation on December 1, 2007. He still holds these positions as of this filing date.
Richard M. Kruger Vice President
Held current title since: April 1, 2008 Age: 51Mr. Richard M. Kruger was Vice President of ExxonMobil Production Company January 1, 2003 – September 30, 2006, and then Executive Vice PresidentOctober 1, 2006 – March 31, 2008. He became President of ExxonMobil Production Company and Vice President of Exxon Mobil Corporation on April 1,2008. He still holds these positions as of this filing date.
Patrick T. Mulva Vice President and Controller
Held current title since:
February 1, 2002 (Vice President)July 1, 2004 (Controller) Age: 59
Mr. Patrick T. Mulva was Vice President—Investor Relations and Secretary of Exxon Mobil Corporation February 1, 2002 – July 1, 2004. On July 1, 2004,he became Vice President and Controller, positions he still holds as of this filing date.
Stephen D. Pryor Vice President
Held current title since: December 1, 2004 Age: 61Mr. Stephen D. Pryor was President of ExxonMobil Refining & Supply Company and Vice President of Exxon Mobil Corporation December 1, 2004 –March 31, 2008. He became President of ExxonMobil Chemical Company and Vice President of Exxon Mobil Corporation on April 1, 2008, positions hestill holds as of this filing date.
34
Table of Contents
Index to Financial Statements
David S. Rosenthal Vice President - Investor Relations and Secretary
Held current title since: October 1, 2008 Age: 54Mr. David S. Rosenthal was Controller of ExxonMobil Production Company April 1, 2002 – May 31, 2006. He was Assistant Controller of Exxon MobilCorporation on June 1, 2006 – September 30, 2008. He became Vice President—Investor Relations and Secretary of Exxon Mobil Corporation onOctober 1, 2008, positions he still holds as of this filing date.
James M. Spellings, Jr. Vice President and General Tax Counsel
Held current title since: March 1, 2010 Age: 49Mr. James M. Spellings, Jr. was General Manager—Corporate Planning of Exxon Mobil Corporation February 1, 2005 – March 31, 2007, and thenAssociate General Tax Counsel April 1, 2007 – March 1, 2010. He became Vice President and General Tax Counsel on March 1, 2010, positions he stillholds as of this filing date.
Thomas R. Walters Vice President
Held current title since: April 1, 2009 Age: 56Mr. Thomas R. Walters was President of Global Services Company from September 1, 2005 – April 4, 2007. He was Executive Vice President ofExxonMobil Development Company April 13, 2007 – April 1, 2009. He became President of ExxonMobil Gas & Power Marketing Company and VicePresident of Exxon Mobil Corporation on April 1, 2009, positions he still holds as of this filing date.
Jack P. Williams, Jr. President, XTO Energy Inc.
Held current title since: June 25, 2010 Age: 47Mr. Jack P. Williams, Jr. was Upstream Advisor, Exxon Mobil Corporation July 1, 2005 – May 1, 2007. He was Vice President, Engineering, ExxonMobilProduction Company May 1, 2007 – April 30, 2009. He was Vice President of ExxonMobil Development Company May 1, 2009 – July 1, 2010. Hebecame President of XTO Energy Inc. on June 25, 2010, a position he still holds as of this filing date.
Officers are generally elected by the Board of Directors at its meeting on the day of each annual election of directors, with each such officer serving until asuccessor has been elected and qualified.
35
Table of Contents
Index to Financial Statements
PART II Item 5. Market for Registrant’s Common Equity, Related Stockholder Matters and Issuer Purchases of Equity Securities. Reference is made to the “Quarterly Information” portion of the Financial Section of this report.
Issuer Purchases of Equity Securities for Quarter Ended December 31, 2010
Note 1—On August 1, 2000, the Corporation announced its intention to resume purchases of shares of its common stock for the treasury both to offsetshares issued in conjunction with company benefit plans and programs and to gradually reduce the number of shares outstanding. The announcement did notspecify an amount or expiration date. Repurchases were temporarily suspended due to regulatory requirements in connection with the XTO transaction. TheCorporation has continued to purchase shares since this announcement and to report purchased volumes in its quarterly earnings releases. In its most recentearnings release dated January 31, 2011, the Corporation stated that first quarter 2011 share purchases are continuing at a pace consistent with fourth quarter 2010share reduction spending of $5 billion. Purchases may be made in both the open market and through negotiated transactions, and purchases may be increased,decreased or discontinued at any time without prior notice. Item 6. Selected Financial Data. Years Ended December 31, 2010 2009 2008 2007 2006 (millions of dollars, except per share amounts)
Net income attributable to ExxonMobil $ 30,460 $ 19,280 $ 45,220 $ 40,610 $ 39,500
Earnings per common share $ 6.24 $ 3.99 $ 8.70 $ 7.31 $ 6.64
Earnings per common share - assuming dilution $ 6.22 $ 3.98 $ 8.66 $ 7.26 $ 6.60
Cash dividends per common share $ 1.74 $ 1.66 $ 1.55 $ 1.37 $ 1.28
Total assets $302,510 $233,323 $228,052 $242,082 $219,015
Long-term debt $ 12,227 $ 7,129 $ 7,025 $ 7,183 $ 6,645 (1) See Note 19: Acquisition of XTO Energy Inc. contained in the Financial Section of this report.
36
(1)
(2)
Table of Contents
Index to Financial Statements
Item 7. Management’s Discussion and Analysis of Financial Condition and Results of Operations. Reference is made to the section entitled “Management’s Discussion and Analysis of Financial Condition and Results of Operations” in the FinancialSection of this report. Item 7A. Quantitative and Qualitative Disclosures About Market Risk. Reference is made to the section entitled “Market Risks, Inflation and Other Uncertainties”, excluding the part entitled “Inflation and Other Uncertainties,”in the Financial Section of this report. All statements other than historical information incorporated in this Item 7A are forward-looking statements. The actualimpact of future market changes could differ materially due to, among other things, factors discussed in this report. Item 8. Financial Statements and Supplementary Data. Reference is made to the following in the Financial Section of this report:
• Consolidated financial statements, together with the report thereon of PricewaterhouseCoopers LLP dated February 25, 2011, beginning with the sectionentitled “Report of Independent Registered Public Accounting Firm” and continuing through “Note 19: Acquisition of XTO Energy Inc.”;
• “Quarterly Information” (unaudited); • “Supplemental Information on Oil and Gas Exploration and Production Activities” (unaudited); and • “Frequently Used Terms” (unaudited).
Financial Statement Schedules have been omitted because they are not applicable or the required information is shown in the consolidated financialstatements or notes thereto.
Item 9. Changes in and Disagreements With Accountants on Accounting and Financial Disclosure. None.
37
Table of Contents
Index to Financial Statements
Item 9A. Controls and Procedures. Management’s Evaluation of Disclosure Controls and Procedures As indicated in the certifications in Exhibit 31 of this report, the Corporation’s chief executive officer, principal financial officer and principal accountingofficer have evaluated the Corporation’s disclosure controls and procedures as of December 31, 2010. Based on that evaluation, these officers have concluded thatthe Corporation’s disclosure controls and procedures are effective in ensuring that information required to be disclosed by the Corporation in the reports that itfiles or submits under the Securities Exchange Act of 1934, as amended, is accumulated and communicated to them in a manner that allows for timely decisionsregarding required disclosures and are effective in ensuring that such information is recorded, processed, summarized and reported within the time periodsspecified in the Securities and Exchange Commission’s rules and forms. Management’s Report on Internal Control Over Financial Reporting Management, including the Corporation’s chief executive officer, principal financial officer and principal accounting officer, is responsible for establishingand maintaining adequate internal control over the Corporation’s financial reporting. Management conducted an evaluation of the effectiveness of internal controlover financial reporting based on criteria established in Internal Control - Integrated Framework issued by the Committee of Sponsoring Organizations of theTreadway Commission. Based on this evaluation, management concluded that Exxon Mobil Corporation’s internal control over financial reporting was effectiveas of December 31, 2010.
PricewaterhouseCoopers LLP, an independent registered public accounting firm, audited the effectiveness of the Corporation’s internal control overfinancial reporting as of December 31, 2010, as stated in their report included in the Financial Section of this report. Changes in Internal Control Over Financial Reporting There were no changes during the Corporation’s last fiscal quarter that materially affected, or are reasonably likely to materially affect, the Corporation’sinternal control over financial reporting. Item 9B. Other Information. Effective April 1, 2011, the annual salary for Michael J. Dolan will increase to $1,010,000. Like all other ExxonMobil executive officers, Mr. Dolan is an“at will” employee of the Corporation and does not have an employment contract.
PART III Item 10. Directors, Executive Officers and Corporate Governance. Incorporated by reference to the following from the registrant’s definitive proxy statement for the 2011 annual meeting of shareholders (the “2011 ProxyStatement”): • The section entitled “Election of Directors”;
• The portion entitled “Section 16(a) Beneficial Ownership Reporting Compliance” of the section entitled “Director and Executive Officer Stock
Ownership”; • The portions entitled “Director Qualifications” and “Code of Ethics and Business Conduct” of the section entitled “Corporate Governance”; and
• The “Audit Committee” portion and the membership table of the portion entitled “Board Meetings and Committees; Annual Meeting Attendance” of the
section entitled “Corporate Governance”.
38
Table of Contents
Index to Financial Statements
Item 11. Executive Compensation. Incorporated by reference to the sections entitled “Director Compensation,” “Compensation Committee Report,” “Compensation Discussion and Analysis”and “Executive Compensation Tables” of the registrant’s 2011 Proxy Statement.
Item 12. Security Ownership of Certain Beneficial Owners and Management and Related Stockholder Matters. The information required under Item 403 of Regulation S-K is incorporated by reference to the sections “Director and Executive Officer Stock Ownership”and “Certain Beneficial Owners” of the registrant’s 2011 Proxy Statement.
Equity Compensation Plan Information (a) (b) (c)
Plan Category
Number of Securities to beIssued Upon Exercise of
Outstanding Options,Warrants and Rights
Weighted-Average
Exercise Price ofOutstanding
Options,Warrants and
Rights
Number of SecuritiesRemaining Available forFuture Issuance UnderEquity Compensation
Plans [ExcludingSecurities Reflected in
Column (a)]Equity compensation plans approved by security
holders 29,111,877 $37.12 142,681,756
Equity compensation plans not approved bysecurity holders 0 0 0
Total 29,111,877 $37.12 142,681,756 (1) The exercise price of each option reflected in this table is equal to the fair market value of the Company’s common stock on the date the option was
granted. The weighted-average price reflects one prior option grant that is still outstanding. (2) Includes 19,578,656 options granted under the 1993 Incentive Program and 9,533,221 restricted stock units to be settled in shares. (3) Does not include options that ExxonMobil assumed in the 2010 merger with XTO Energy Inc. At year-end 2010, the number of securities to be issued upon
exercise of outstanding options under XTO Energy Inc. plans was 9,929,860, and the weighted-average exercise price of such options was $59.51. Noadditional awards may be made under those plans.
(4) Available shares can be granted in the form of restricted stock, options, or other stock-based awards. Includes 141,939,056 shares available for award underthe 2003 Incentive Program and 742,700 shares available for award under the 2004 Non-Employee Director Restricted Stock Plan.
(5) Under the 2004 Non-Employee Director Restricted Stock Plan approved by shareholders in May 2004, and the related standing resolution adopted by theBoard, each non-employee director automatically receives 8,000 shares of restricted stock when first elected to the Board and, if the director remains inoffice, an additional 2,500 restricted shares each following year. While on the Board, each non-employee director receives the same cash dividends onrestricted shares as a holder of regular common stock, but the director is not allowed to sell the shares. The restricted shares may be forfeited if the directorleaves the Board early.
39
(1)
(2)(3) (3)(4)(5)
Table of Contents
Index to Financial Statements
Item 13. Certain Relationships and Related Transactions, and Director Independence. Information provided in response to this Item 13 is incorporated by reference to the portions entitled “Related Person Transactions and Procedures” and“Director Independence” of the section entitled “Corporate Governance” of the registrant’s 2011 Proxy Statement. Item 14. Principal Accounting Fees and Services. Incorporated by reference to the portion entitled “Audit Committee” of the section entitled “Corporate Governance” and the section entitled “Ratificationof Independent Auditors” of the registrant’s 2011 Proxy Statement.
PART IV Item 15. Exhibits, Financial Statement Schedules. (a) (1) and (2) Financial Statements:
See Table of Contents of the Financial Section of this report. (a) (3) Exhibits:
See Index to Exhibits of this report.
40
Table of Contents
Index to Financial Statements
FINANCIAL SECTION
TABLE OF CONTENTS Business Profile 42 Financial Summary 43 Frequently Used Terms 44 Quarterly Information 46 Management’s Discussion and Analysis of Financial Condition and Results of Operations
Functional Earnings 47 Forward-Looking Statements 48 Overview 48 Business Environment and Risk Assessment 48 Review of 2010 and 2009 Results 51 Liquidity and Capital Resources 52 Capital and Exploration Expenditures 56 Taxes 56 Environmental Matters 56 Market Risks, Inflation and Other Uncertainties 57 Critical Accounting Policies 58
Management’s Report on Internal Control Over Financial Reporting 62 Report of Independent Registered Public Accounting Firm 62 Consolidated Financial Statements
Statement of Income 64 Balance Sheet 65 Statement of Cash Flows 66 Statement of Changes in Equity 67 Statement of Comprehensive Income 68
Notes to Consolidated Financial Statements 1. Summary of Accounting Policies 69 2. Accounting Changes 71 3. Miscellaneous Financial Information 72 4. Cash Flow Information 72 5. Additional Working Capital Information 72 6. Equity Company Information 73 7. Investments, Advances and Long-Term Receivables 74 8. Property, Plant and Equipment and Asset Retirement Obligations 74 9. Accounting for Suspended Exploratory Well Costs 75 10. Leased Facilities 77 11. Earnings Per Share 77 12. Financial Instruments and Derivatives 78 13. Long-Term Debt 79 14. Incentive Program 84 15. Litigation and Other Contingencies 87 16. Pension and Other Postretirement Benefits 89 17. Disclosures about Segments and Related Information 97 18. Income, Sales-Based and Other Taxes 99 19. Acquisition of XTO Energy Inc. 101
Supplemental Information on Oil and Gas Exploration and Production Activities 103 Operating Summary 118
41
Table of Contents
Index to Financial Statements
BUSINESS PROFILE
Earnings AfterIncome Taxes
Average CapitalEmployed
Return onAverage Capital
Employed
Capital andExploration
Expenditures Financial 2010 2009 2010 2009 2010 2009 2010 2009 (millions of dollars) (percent) (millions of dollars) Upstream
Total $30,460 $19,280 $145,217 $125,050 21.7 16.3 $32,226 $27,092
See Frequently Used Terms for a definition and calculation of capital employed and return on average capital employed. Operating 2010 2009 2010 2009 (thousands of barrels daily) (thousands of barrels daily) Net liquids production Refinery throughput
United States 408 384 United States 1,753 1,767 Non-U.S. 2,014 2,003 Non-U.S. 3,500 3,583
Total 2,422 2,387 Total 5,253 5,350
(millions of cubic feet daily) (thousands of barrels daily) Natural gas production available
for sale Petroleum product sales United States 2,596 1,275 United States 2,511 2,523 Non-U.S. 9,552 7,998 Non-U.S. 3,903 3,905
Total 12,148 9,273 Total 6,414 6,428
(thousands of oil-equivalent barrels daily) (thousands of metric tons) Oil-equivalent production 4,447 3,932 Chemical prime product sales
United States 9,815 9,649 Non-U.S. 16,076 15,176
Total 25,891 24,825
(1) Gas converted to oil-equivalent at 6 million cubic feet = 1 thousand barrels.
42
(1)
Table of Contents
Index to Financial Statements
FINANCIAL SUMMARY 2010 2009 2008 2007 2006 (millions of dollars, except per share amounts) Sales and other operating revenue $370,125 $301,500 $459,579 $390,328 $365,467 Earnings
Net income attributable to ExxonMobil $ 30,460 $ 19,280 $ 45,220 $ 40,610 $ 39,500
Earnings per common share $ 6.24 $ 3.99 $ 8.70 $ 7.31 $ 6.64 Earnings per common share – assuming dilution $ 6.22 $ 3.98 $ 8.66 $ 7.26 $ 6.60
Cash dividends per common share $ 1.74 $ 1.66 $ 1.55 $ 1.37 $ 1.28
Earnings to average ExxonMobil share of equity (percent) 23.7 17.3 38.5 34.5 35.1
Working capital $ (3,649) $ 3,174 $ 23,166 $ 27,651 $ 26,960 Ratio of current assets to current liabilities (times) 0.94 1.06 1.47 1.47 1.55
Additions to property, plant and equipment $ 74,156 $ 22,491 $ 19,318 $ 15,387 $ 15,462 Property, plant and equipment, less allowances $199,548 $ 139,116 $121,346 $120,869 $ 113,687 Total assets $302,510 $233,323 $228,052 $242,082 $219,015
Exploration expenses, including dry holes $ 2,144 $ 2,021 $ 1,451 $ 1,469 $ 1,181 Research and development costs $ 1,012 $ 1,050 $ 847 $ 814 $ 733
Long-term debt $ 12,227 $ 7,129 $ 7,025 $ 7,183 $ 6,645 Total debt $ 15,014 $ 9,605 $ 9,425 $ 9,566 $ 8,347 Fixed-charge coverage ratio (times) 42.2 25.8 54.6 51.6 47.8 Debt to capital (percent) 9.0 7.7 7.4 7.1 6.6 Net debt to capital (percent) 4.5 (1.0) (23.0) (24.0) (20.4)
ExxonMobil share of equity at year end $146,839 $ 110,569 $ 112,965 $121,762 $ 113,844 ExxonMobil share of equity per common share $ 29.48 $ 23.39 $ 22.70 $ 22.62 $ 19.87 Weighted average number of common shares outstanding (millions) 4,885 4,832 5,194 5,557 5,948
Number of regular employees at year end (thousands) 83.6 80.7 79.9 80.8 82.1
CORS employees not included above (thousands) 20.1 22.0 24.8 26.3 24.3 (1) See Note 19: Acquisition of XTO Energy Inc.(2) Sales and other operating revenue includes sales-based taxes of $28,547 million for 2010, $25,936 million for 2009, $34,508 million for 2008, $31,728
million for 2007 and $30,381 million for 2006.(3) Debt net of cash, excluding restricted cash.(4) Regular employees are defined as active executive, management, professional, technical and wage employees who work full time or part time for the
Corporation and are covered by the Corporation’s benefit plans and programs.(5) CORS employees are employees of company-operated retail sites.
43
(1)
(2)
(3)
(4)
(5)
Table of Contents
Index to Financial Statements
FREQUENTLY USED TERMS
Listed below are definitions of several of ExxonMobil’s key business and financial performance measures. These definitions are provided to facilitateunderstanding of the terms and their calculation.
CASH FLOW FROM OPERATIONS AND ASSET SALES
Cash flow from operations and asset sales is the sum of the net cash provided by operating activities and proceeds from sales of subsidiaries, investments andproperty, plant and equipment from the Consolidated Statement of Cash Flows. This cash flow reflects the total sources of cash from both operating theCorporation’s assets and from the divesting of assets. The Corporation employs a long-standing and regular disciplined review process to ensure that all assets arecontributing to the Corporation’s strategic objectives. Assets are divested when they are no longer meeting these objectives or are worth considerably more toothers. Because of the regular nature of this activity, we believe it is useful for investors to consider sales proceeds together with cash provided by operatingactivities when evaluating cash available for investment in the business and financing activities, including shareholder distributions. Cash flow from operations and asset sales 2010 2009 2008 (millions of dollars) Net cash provided by operating activities $48,413 $28,438 $59,725 Sales of subsidiaries, investments and property, plant and equipment 3,261 1,545 5,985
Cash flow from operations and asset sales $51,674 $29,983 $65,710
CAPITAL EMPLOYED
Capital employed is a measure of net investment. When viewed from the perspective of how the capital is used by the businesses, it includes ExxonMobil’s netshare of property, plant and equipment and other assets less liabilities, excluding both short-term and long-term debt. When viewed from the perspective of thesources of capital employed in total for the Corporation, it includes ExxonMobil’s share of total debt and equity. Both of these views include ExxonMobil’s shareof amounts applicable to equity companies, which the Corporation believes should be included to provide a more comprehensive measure of capital employed. Capital employed 2010 2009 2008 (millions of dollars) Business uses: asset and liability perspective Total assets $302,510 $233,323 $228,052 Less liabilities and noncontrolling interests share of assets and liabilities
Total current liabilities excluding notes and loans payable (59,846) (49,585) (46,700) Total long-term liabilities excluding long-term debt (74,971) (58,741) (54,404) Noncontrolling interests share of assets and liabilities (6,532) (5,642) (6,044)
Add ExxonMobil share of debt-financed equity company net assets 4,875 5,043 4,798
Total capital employed $166,036 $124,398 $125,702
Total corporate sources: debt and equity perspective Notes and loans payable $ 2,787 $ 2,476 $ 2,400 Long-term debt 12,227 7,129 7,025 ExxonMobil share of equity 146,839 110,569 112,965 Less noncontrolling interests share of total debt (692) (819) (1,486) Add ExxonMobil share of equity company debt 4,875 5,043 4,798
Total capital employed $166,036 $124,398 $125,702
44
Table of Contents
Index to Financial Statements
RETURN ON AVERAGE CAPITAL EMPLOYED
Return on average capital employed (ROCE) is a performance measure ratio. From the perspective of the business segments, ROCE is annual business segmentearnings divided by average business segment capital employed (average of beginning and end-of-year amounts). These segment earnings include ExxonMobil’sshare of segment earnings of equity companies, consistent with our capital employed definition, and exclude the cost of financing. The Corporation’s total ROCEis net income attributable to ExxonMobil excluding the after-tax cost of financing, divided by total corporate average capital employed. The Corporation hasconsistently applied its ROCE definition for many years and views it as the best measure of historical capital productivity in our capital-intensive, long-termindustry, both to evaluate management’s performance and to demonstrate to shareholders that capital has been used wisely over the long term. Additionalmeasures, which are more cash flow-based, are used to make investment decisions. Return on average capital employed 2010 2009 2008 (millions of dollars)
Net income attributable to ExxonMobil $ 30,460 $ 19,280 $ 45,220 Financing costs (after tax)
Gross third-party debt (803) (303) (343) ExxonMobil share of equity companies (333) (285) (325) All other financing costs – net 35 (483) 1,485
(1) Gas converted to oil-equivalent at 6 million cubic feet = 1 thousand barrels.(2) Includes amounts for sales-based taxes.(3) Gross profit equals sales and other operating revenue less estimated costs associated with products sold.(4) Computed using the average number of shares outstanding during each period. The sum of the four quarters may not add to the full year.
The price range of ExxonMobil common stock is as reported on the composite tape of the several U.S. exchanges where ExxonMobil common stock is traded.The principal market where ExxonMobil common stock (XOM) is traded is the New York Stock Exchange, although the stock is traded on other exchanges inand outside the United States.
There were 507,028 registered shareholders of ExxonMobil common stock at December 31, 2010. At January 31, 2011, the registered shareholders ofExxonMobil common stock numbered 505,330.
On January 26, 2011, the Corporation declared a $0.44 dividend per common share, payable March 10, 2011.
46
(1)
(2)
(3)
(4)
(4)
Table of Contents
Index to Financial Statements
MANAGEMENT’S DISCUSSION AND ANALYSIS OF FINANCIAL CONDITION AND RESULTS OF OPERATIONS
FUNCTIONAL EARNINGS 2010 2009 2008
(millions of dollars, except per
share amounts) Earnings (U.S. GAAP) Upstream
United States $ 4,272 $ 2,893 $ 6,243 Non-U.S. 19,825 14,214 29,159
Downstream United States 770 (153) 1,649 Non-U.S. 2,797 1,934 6,502
Chemical United States 2,422 769 724 Non-U.S. 2,491 1,540 2,233
Corporate and financing (2,117) (1,917) (1,290)
Net income attributable to ExxonMobil $30,460 $19,280 $45,220
Earnings per common share $ 6.24 $ 3.99 $ 8.70 Earnings per common share – assuming dilution $ 6.22 $ 3.98 $ 8.66
Special items included in earnings Non-U.S. Upstream
Gain on German natural gas transportation business sale $ — $ — $ 1,620 Corporate and financing
Valdez litigation $ — $ (140) $ (460)
References in this discussion to total corporate earnings mean net income attributable to ExxonMobil (U.S. GAAP) from the consolidated income statement.Unless otherwise indicated, references to earnings, special items, Upstream, Downstream, Chemical and Corporate and Financing segment earnings, and earningsper share are ExxonMobil’s share after excluding amounts attributable to noncontrolling interests.
47
Table of Contents
Index to Financial Statements
MANAGEMENT’S DISCUSSION AND ANALYSIS OF FINANCIAL CONDITION AND RESULTS OF OPERATIONS FORWARD-LOOKING STATEMENTS
Statements in this discussion regarding expectations, plans and future events or conditions are forward-looking statements. Actual future results, includingdemand growth and energy source mix; capacity increases; production growth and mix; rates of field decline; financing sources; the resolution of contingenciesand uncertain tax positions; environmental and capital expenditures; could differ materially depending on a number of factors, such as changes in the supply ofand demand for crude oil, natural gas, and petroleum and petrochemical products; the outcome of commercial negotiations; political or regulatory events, andother factors discussed herein and in Item 1A of ExxonMobil’s 2010 Form 10-K.
OVERVIEW
The following discussion and analysis of ExxonMobil’s financial results, as well as the accompanying financial statements and related notes to consolidatedfinancial statements to which they refer, are the responsibility of the management of Exxon Mobil Corporation. The Corporation’s accounting and financialreporting fairly reflect its straightforward business model involving the extracting, manufacturing and marketing of hydrocarbons and hydrocarbon-basedproducts. The Corporation’s business model involves the production (or purchase), manufacture and sale of physical products, and all commercial activities aredirectly in support of the underlying physical movement of goods.
ExxonMobil, with its resource base, financial strength, disciplined investment approach and technology portfolio, is well-positioned to participate insubstantial investments to develop new energy supplies. While commodity prices are volatile on a short-term basis and depend on supply and demand,ExxonMobil’s investment decisions are based on our long-term business outlook, using a disciplined approach in selecting and pursuing the most attractiveinvestment opportunities. The corporate plan is a fundamental annual management process that is the basis for setting near-term operating and capital objectivesin addition to providing the longer-term economic assumptions used for investment evaluation purposes. Volumes are based on individual field productionprofiles, which are also updated annually. Prices for crude oil, natural gas and refined products are based on corporate plan assumptions developed annually bymajor region and are utilized for investment evaluation purposes. Potential investment opportunities are tested over a wide range of economic scenarios toestablish the resiliency of each opportunity. Once investments are made, a reappraisal process is completed to ensure relevant lessons are learned andimprovements are incorporated into future projects.
BUSINESS ENVIRONMENT AND RISK ASSESSMENT
Long-Term Business Outlook
By 2030, the world’s population is projected to grow to approximately 8 billion people, or about 1.5 billion more than in 2005. Coincident with this populationincrease, the Corporation expects worldwide economic growth to average 2.8 percent per year. This combination of population and economic growth is expectedto lead to an increase in primary energy demand of about 35 percent by 2030 versus 2005, even with substantial efficiency gains around the world. This demandincrease is expected to be concentrated in developing countries (i.e., those that are not member nations of the Organization for Economic Cooperation andDevelopment).
As economic progress drives demand higher, increasing penetration of energy-efficient and lower-emission fuels, technologies and practices are expectedto contribute to significantly lower levels of energy consumption and emissions per unit of economic output over time. Efficiency gains will result fromanticipated improvements in the transportation and power generation sectors, driven by the introduction of new technologies, as well as many other improvementsthat span the residential, commercial and industrial sectors.
Energy for transportation – including cars, trucks, ships, trains and airplanes – is expected to increase by nearly 40 percent from 2005 to 2030. The globalgrowth in transportation demand is likely to account for approximately 80 percent of the growth in oil demand over this period. Nearly all the world’stransportation fleets will continue to run on liquid fuels because they provide a large quantity of energy in small volumes, making them easy to transport andwidely available.
Demand for electricity around the world will grow significantly through 2030. Consistent with this projection, power generation will remain the largest andfastest-growing major segment of global energy demand. Meeting the expected growth in power demand will require a diverse set of energy sources. Natural gasdemand will grow most significantly and gain the most market share, although coal demand will also grow and retain the largest share through 2030 despite alsolosing share to nuclear and wind.
Liquid fuels provide the largest share of energy supply today due to their availability, affordability and ease of transport. By 2030, global demand forliquids is expected to grow to approximately 103 million barrels of oil-equivalent per day, an increase of more than 20 percent from 2005. Global demand forliquid fuels will be met by a wide variety of sources. Conventional non-OPEC crude and condensate production is expected to remain relatively flat through 2030.However, growth is expected from a number of supply sources, including biofuels, oil sands and natural gas liquids, as well as crude oil from OPEC countries.While the world’s resource base is sufficient to meet projected demand, access to resources and timely investments will remain critical to meeting global needswith reliable, affordable supplies.
48
Table of Contents
Index to Financial Statements
Increases in natural gas demand in North America, Europe and Asia Pacific will require new sources of supply. Helping meet these needs will be additionallocal supplies of unconventional natural gas – the result of recent improvements in technologies used to tap these hard-to-produce resources – as well as imports.The growing need for natural gas imports will have a dramatic impact on the worldwide liquefied natural gas (LNG) market, which is expected to approximatelytriple in volume from 2005 to 2030.
The world’s energy mix is highly diverse and will remain so through 2030. Oil is expected to remain the largest source of energy supply at close to 32percent. From 2005 to 2030, natural gas is expected to grow the fastest of the major energy types and overtake coal as the second-largest energy source. Nuclearpower is projected to grow significantly, on par with coal in terms of absolute growth and surpassing biomass as the fourth-largest source of energy. Hydro andgeothermal will also grow, though remain limited by the availability of natural sites. Wind, solar and biofuels are expected to grow at close to 10 percent per yearon average, the highest growth rate of all fuels, and are projected to reach approximately 2.5 percent of world energy by 2030.
The Corporation anticipates that the world’s available oil and gas resource base will grow not only from new discoveries, but also from reserve increases inpreviously discovered fields. Technology will underpin these increases. The cost to develop and supply these resources will be significant. According to theInternational Energy Agency, the investment required to meet total oil and gas energy needs worldwide over the period 2010-2035 will be approximately $15trillion (measured in 2009 dollars) or close to $580 billion per year on average.
International accords and underlying regional and national regulations for greenhouse gas reduction are evolving with uncertain timing and outcome,making it difficult to predict their business impact. ExxonMobil includes estimates of potential costs related to possible public policies covering energy-relatedgreenhouse gas emissions in its long-term Energy Outlook, which is used for assessing the business environment and in its investment evaluations.
The information provided in the Long-Term Business Outlook includes ExxonMobil’s internal estimates and forecasts based upon internal data andanalyses as well as publicly available information from external sources including the International Energy Agency.
Upstream
ExxonMobil continues to maintain a large portfolio of exploration and development opportunities, which enables the Corporation to be selective, maximizingshareholder value and mitigating political and technical risks. ExxonMobil’s fundamental Upstream business strategies guide our global exploration,development, production, and gas and power marketing activities. These strategies include identifying and selectively pursuing the highest quality explorationopportunities, investing in projects that deliver superior returns, maximizing profitability of existing oil and gas production, and capitalizing on growing naturalgas and power markets. These strategies are underpinned by a relentless focus on operational excellence, commitment to innovative technologies, development ofour employees and investment in the communities in which we operate.
As future development projects and drilling activities bring new production online, the Corporation expects a shift in the geographic mix of its productionvolumes between now and 2015. Oil and natural gas output from North America is expected to increase over the next five years based on current capital activityplans. Currently, this growth area accounts for 27 percent of the Corporation’s production. By 2015, it is expected to generate about 35 percent of total volumes.The remainder of the Corporation’s production is expected to be sourced from Asia, Europe, Africa and Australia, with contributions from both establishedoperations and new projects.
In addition to an evolving geographic mix, there will also be continued change in the type of opportunities from which volumes are produced. Productionfrom diverse resource types utilizing specialized technologies such as arctic technology, deepwater drilling and production systems, heavy oil recovery processes,unconventional gas production and LNG is expected to grow from about 40 percent to around 55 percent of the Corporation’s output between now and 2015. Wedo not anticipate that the expected change in the geographic mix of production volumes, and in the types of opportunities from which volumes will be produced,will have a material impact on the nature and the extent of the risks disclosed in Item 1A of ExxonMobil’s 2010 Form 10-K, or result in a material change in ourlevel of unit operating expenses. The Corporation’s overall volume capacity outlook, based on projects coming onstream as anticipated, is for production capacityto grow over the period 2011-2015. However, actual volumes will vary from year to year due to the timing of individual project start-ups and other capitalactivities, operational outages, reservoir performance, performance of enhanced oil recovery projects, regulatory changes, asset sales, weather events, price effectsunder production sharing contracts and other factors described in Item 1A of ExxonMobil’s 2010 Form 10-K. Enhanced oil recovery projects extracthydrocarbons from reservoirs in excess of that which may be produced through primary recovery, i.e., through pressure depletion or natural aquifer support. Theyinclude the injection of water, gases or chemicals into a reservoir to produce hydrocarbons otherwise unobtainable.
49
Table of Contents
Index to Financial Statements
MANAGEMENT’S DISCUSSION AND ANALYSIS OF FINANCIAL CONDITION AND RESULTS OF OPERATIONS Downstream
ExxonMobil’s Downstream is a large, diversified business with refining and marketing complexes around the world. The Corporation has a strong presence inmature markets in North America and Europe, as well as the growing Asia Pacific region. ExxonMobil’s fundamental Downstream business strategies positionthe company to deliver long-term growth in shareholder value that is superior to competition across a range of market conditions. These strategies includemaintaining best-in-class operations in all aspects of the business, maximizing value from leading-edge technologies, capitalizing on integration acrossExxonMobil businesses, selectively investing for resilient, advantaged returns, leading the industry in efficiency and effectiveness, and providing quality, valuedproducts and services to customers.
ExxonMobil has an ownership interest in 36 refineries, located in 21 countries, with distillation capacity of 6.3 million barrels per day and lubricantbasestock manufacturing capacity of about 131 thousand barrels per day. ExxonMobil’s fuels and lubes marketing business portfolios include operations aroundthe world, with multiple channels to market serving a globally diverse customer base.
The downstream industry environment remains challenging. Although demand for refined products has improved from the lower levels in 2009 due to therecent global economic recession, we expect the challenging business environment to continue, reflecting the increase in global refining capacity and regulatory-related policies. Over the prior 20-year period, inflation-adjusted refining margins have been flat.
Refining margins are largely driven by differences in commodity prices and are a function of the difference between what a refinery pays for its rawmaterials (primarily crude oil) and the market prices for the range of products produced (primarily gasoline, heating oil, diesel oil, jet fuel and fuel oil). Crude oiland many products are widely traded with published prices, including those quoted on multiple exchanges around the world (e.g., New York Mercantile Exchangeand Intercontinental Exchange). Prices for these commodities are determined by the global marketplace and are influenced by many factors, including global andregional supply/demand balances, inventory levels, refinery operations, import/export balances, currency fluctuations, seasonal demand, weather and politicalclimate.
ExxonMobil’s long-term outlook is that refining margins will remain weak as competition in the refining industry remains intense and, in the near term,new capacity additions outpace the growth in global demand. Additionally, as described in more detail in Item 1A of ExxonMobil’s 2010 Form 10-K, proposedcarbon policy and other climate-related regulations in many countries, as well as the continued growth in biofuels mandates, could have negative impacts on therefining business.
In the retail fuels marketing business, competition continues to cause inflation-adjusted margins to decline. In 2010, ExxonMobil progressed the transitionof the direct served (i.e., dealer, company-operated) retail network in the U.S. to a branded distributor model. This transition was announced in 2008 and will be amultiyear process.
ExxonMobil takes a disciplined approach to managing the Downstream capital employed. The Downstream portfolio is continually evaluated during allparts of the business cycle, and numerous asset divestments have been made over the past decade. When investing in the Downstream, ExxonMobil remainsfocused on selective and resilient projects. These investments capitalize on the Corporation’s world-class scale and integration, industry-leading efficiency,leading-edge technology and respected brands, enabling ExxonMobil to take advantage of attractive emerging-growth opportunities around the globe. In 2010,ExxonMobil invested over $1 billion in three refineries to increase the supply of cleaner-burning diesel by about 140 thousand barrels per day. The companycompleted construction of new units and modification of existing facilities at its Baton Rouge, Louisiana; Baytown, Texas; and Antwerp, Belgium, refineries. Inaddition, construction has commenced at the Sriracha, Thailand, refinery to produce lower sulfur diesel and gasoline to meet upcoming product specifications inThailand. Completion is expected in the fourth quarter of 2011. At the Jurong/PAC refinery in Singapore, plans are under way to build a new diesel hydrotreater,which will add a capacity of more than 2 million gallons per day to meet increasing demand in the Asia Pacific region.
Chemical
Worldwide petrochemical demand recovered from the economic downturn in 2008 and the first half of 2009. Tighter industry supply/ demand balancesthroughout the year supported improved industry margins, particularly in the U.S. Asia Pacific commodity margins were lower, reflecting the start-up ofsignificant new industry capacity in the region.
ExxonMobil benefited from continued operational excellence and a balanced portfolio of products. In addition to being a worldwide supplier of commoditypetrochemical products, ExxonMobil Chemical also has a number of less-cyclical business lines, which delivered strong results in 2010. Chemical’s competitiveadvantages are due to its business mix, broad geographic coverage, investment and cost discipline, integration with refineries or upstream gas processingfacilities, superior feedstock management, leading proprietary technology and product application expertise.
50
Table of Contents
Index to Financial Statements
REVIEW OF 2010 AND 2009 RESULTS 2010 2009 2008 (millions of dollars) Earnings (U.S. GAAP) $30,460 $19,280 $45,220
2010
Earnings in 2010 of $30,460 million increased $11,180 million from 2009. Earnings for 2010 did not include any special items.
2009
Earnings in 2009 of $19,280 million decreased $25,940 million from 2008. Earnings for 2009 included an after-tax special charge of $140 million for interestrelated to the Valdez punitive damages award.
Upstream 2010 2009 2008 (millions of dollars) Upstream
United States $ 4,272 $ 2,893 $ 6,243 Non-U.S. 19,825 14,214 29,159
Total $24,097 $17,107 $35,402
2010
Upstream earnings were $24,097 million, up $6,990 million from 2009. Higher realizations increased earnings approximately $6.5 billion. Higher volumesincreased earnings by $1.2 billion, while all other items, including higher operating costs, decreased earnings by $690 million. On an oil-equivalent basis,production was up 13 percent compared to 2009. Excluding the impacts of entitlement volumes, OPEC quota effects and divestments, production was up 14percent. Liquids production of 2,422 kbd (thousands of barrels per day) increased 35 kbd compared with 2009. Excluding the impacts of entitlement volumes,OPEC quota effects and divestments, liquids production increased 2 percent from 2009, as project ramp-ups in Qatar were offset by net field decline. Natural gasproduction of 12,148 mcfd (millions of cubic feet per day) increased 2,875 mcfd from 2009, driven by higher volumes from Qatar projects and additional U.S.unconventional gas volumes. Earnings from U.S. Upstream operations for 2010 were $4,272 million, an increase of $1,379 million from 2009. Non-U.S.Upstream earnings were $19,825 million, up $5,611 million from 2009.
2009
Upstream earnings for 2009 were $17,107 million, down $18,295 million from 2008, including the absence of an after-tax special gain in 2008 of $1,620 millionfrom the sale of a natural gas transportation business in Germany. Lower crude oil and natural gas realizations reduced earnings $15.2 billion. Volume and mixeffects increased earnings $700 million. Higher operating expenses and increased exploration activities decreased earnings $1.4 billion. Lower gains on assetdivestments reduced earnings approximately $900 million. Oil-equivalent production increased slightly versus 2008, including impacts from entitlement effects,quotas and divestments. Excluding these items, oil-equivalent production was up about 2 percent. Liquids production of 2,387 kbd decreased 18 kbd. Productionincreases from new projects in the U.S., Qatar and Africa along with higher volumes in Kazakhstan were offset by field decline. Natural gas production of 9,273mcfd increased 178 mcfd from 2008. Higher volumes from projects in Qatar were partially offset by field decline. Earnings from U.S. Upstream operations for2009 were $2,893 million, a decrease of $3,350 million. Earnings outside the U.S. for 2009 of $14,214 million declined $14,945 million.
Downstream 2010 2009 2008 (millions of dollars) Downstream
United States $ 770 $ (153) $1,649 Non-U.S. 2,797 1,934 6,502
Total $3,567 $1,781 $8,151
2010
Downstream earnings of $3,567 million were $1,786 million higher than 2009. Higher industry refining margins increased earnings by $1.2 billion. Positivevolume and mix effects increased earnings by $420 million, while all other items, including lower operating expenses, increased earnings by $210 million.Petroleum product sales of 6,414 kbd decreased 14 kbd. U.S. Downstream earnings were $770 million, up $923 million from 2009. Non-U.S. Downstreamearnings were $2,797 million, $863 million higher than 2009.
2009
Downstream earnings were $1,781 million, down $6.4 billion from 2008. Weaker margins reduced earnings $5.1 billion. Lower divestment activity reducedearnings about $1.0 billion. Volumes decreased earnings approximately $300 million. Petroleum product sales of 6,428 kbd decreased 333 kbd, mainly reflectingasset divestments and lower demand. Refinery throughput was 5,350 kbd, down 66 kbd from 2008. Earnings from the U.S. Downstream were $1,802 millionlower than in 2008. Non-U.S. Downstream earnings were $1,934 million, down $4,568 million from 2008.
51
Table of Contents
Index to Financial Statements
MANAGEMENT’S DISCUSSION AND ANALYSIS OF FINANCIAL CONDITION AND RESULTS OF OPERATIONS Chemical 2010 2009 2008 (millions of dollars) Chemical
United States $2,422 $ 769 $ 724 Non-U.S. 2,491 1,540 2,233
Total $4,913 $2,309 $2,957
2010
Chemical earnings were a record $4,913 million, up $2,604 million from 2009. Improved margins increased earnings by $2.0 billion while higher volumesincreased earnings $380 million. Prime product sales of 25,891 kt were up 1,066 kt from 2009. Prime product sales are total chemical product sales, includingExxonMobil’s share of equity-company volumes and finished product transfers to the Downstream business. U.S. Chemical earnings of $2,422 million increased$1,653 million. Non-U.S. Chemical earnings of $2,491 million increased $951 million.
2009
Earnings declined $648 million versus 2008 to a total of $2,309 million. Weaker margins reduced earnings by $340 million, mostly in commodities. Lowervolumes decreased earnings $190 million. All other items, including unfavorable foreign exchange impacts, reduced earnings $115 million. Prime product salesof 24,825 kt decreased 157 kt from 2008. U.S. Chemical earnings of $769 million increased $45 million. Non-U.S. Chemical earnings were $1,540 million, down$693 million.
Corporate and Financing 2010 2009 2008 (millions of dollars) Corporate and financing $(2,117) $(1,917) $(1,290)
2010
Corporate and financing expenses were $2,117 million, up $200 million from 2009 mainly due to a tax charge related to the U.S. health care legislation during thefirst quarter of 2010 and financing activities, partially offset by the absence of a 2009 charge for interest related to the Valdez punitive damages award.
2009
Corporate and financing expenses of $1,917 million in 2009 increased $627 million, primarily due to lower interest income.
LIQUIDITY AND CAPITAL RESOURCES
Sources and Uses of Cash 2010 2009 2008 (millions of dollars) Net cash provided by/(used in)
Total cash and cash equivalents $ 8,453 $ 10,693 $ 31,437
Total cash and cash equivalents were $8.5 billion at the end of 2010, $2.2 billion lower than the prior year. Higher earnings and reduced share purchases wereoffset by a higher level of capital spending and increased level of debt repurchases. Included in total cash and cash equivalents at year-end 2010 was $0.6 billionof restricted cash.
Cash and cash equivalents were $10.7 billion at the end of 2009, $20.7 billion lower than the prior year, reflecting lower earnings and a higher level ofcapital spending partially offset by a lower level of purchases of ExxonMobil shares. Cash flows from operating, investing and financing activities are discussedbelow. For additional details, see the Consolidated Statement of Cash Flows.
Although the Corporation has access to significant capacity of long-term and short-term liquidity, internally generated funds cover the majority of itsfinancial requirements. The management of cash that may be temporarily available as surplus to the Corporation’s immediate needs is carefully controlled toensure it is secure and readily available to meet the Corporation’s cash requirements and to optimize returns on the cash balances.
To support cash flows in future periods the Corporation will need to continually find and develop new fields, and continue to develop and apply newtechnologies and recovery processes to existing fields, in order to maintain or increase production. After a period of production at plateau rates, it is the nature ofoil and gas fields eventually to produce at declining rates for the remainder of their economic life. Averaged over all the Corporation’s existing oil and gas fieldsand without new projects, ExxonMobil’s production is expected to decline at an average of approximately 3 percent per year over the next few years. Decline
rates can vary widely by individual field due to a number of factors, including, but not limited to, the type of reservoir, fluid properties, recovery mechanisms,work activity, and age of the field. Furthermore, the Corporation’s net interest in production for individual fields can vary with price and contractual terms.
52
Table of Contents
Index to Financial Statements
The Corporation has long been successful at offsetting the effects of natural field decline through disciplined investments in quality opportunities andproject execution. Over the last decade, this has resulted in net annual additions to proved reserves that have exceeded the amount produced. Projects are inprogress or planned to increase production capacity. However, these volume increases are subject to a variety of risks including project start-up timing,operational outages, reservoir performance, crude oil and natural gas prices, weather events, and regulatory changes. The Corporation’s cash flows are also highlydependent on crude oil and natural gas prices. Please refer to Item 1A. Risk Factors for a more complete discussion of risks.
The Corporation’s financial strength enables it to make large, long-term capital expenditures. Capital and exploration expenditures in 2010 were $32.2billion, reflecting the Corporation’s continued active investment program. The Corporation expects annual expenditures to range from $33 billion to $37 billionfor the next several years. Actual spending could vary depending on the progress of individual projects. The Corporation has a large and diverse portfolio ofdevelopment projects and exploration opportunities, which helps mitigate the overall political and technical risks of the Corporation’s Upstream segment andassociated cash flow. Further, due to its financial strength, debt capacity and diverse portfolio of opportunities, the risk associated with failure or delay of anysingle project would not have a significant impact on the Corporation’s liquidity or ability to generate sufficient cash flows for operations and its fixedcommitments. The purchase and sale of oil and gas properties have not had a significant impact on the amount or timing of cash flows from operating activities.
Cash Flow from Operating Activities
2010
Cash provided by operating activities totaled $48.4 billion in 2010, $20.0 billion higher than 2009. The major source of funds was net income includingnoncontrolling interests of $31.4 billion, adjusted for the noncash provision of $14.8 billion for depreciation and depletion, both of which increased. The neteffects of changes in prices and the timing of collection of accounts receivable and of payments of accounts and other payables and of income taxes payableincreased cash provided by operating activities in 2010 compared to a decrease in 2009, and resulted in net working capital of $(3.6) billion as total currentliabilities of $62.6 billion exceeded total current assets of $59.0 billion at year-end 2010.
2009
Cash provided by operating activities totaled $28.4 billion in 2009, $31.3 billion lower than 2008. The major source of funds was net income includingnoncontrolling interests of $19.7 billion, adjusted for the noncash provision of $11.9 billion for depreciation and depletion, both of which declined. Pension fundcontributions in 2009 of $4.5 billion increased from $1.0 billion in 2008. The net effects of changes in prices and the timing of collection of accounts receivableand of payments of accounts and other payables and of income taxes payable reduced cash provided by operating activities in 2009 compared to an increase in2008.
Cash Flow from Investing Activities
2010
Cash used in investment activities netted to $24.2 billion in 2010, $1.8 billion higher than in 2009. Spending for property, plant and equipment of $26.9 billionincreased $4.4 billion from 2009. Proceeds from the sale of subsidiaries, investments and property, plant and equipment of $3.3 billion in 2010 compared to $1.5billion in 2009, the increase reflecting the sale of some U.S. service stations and Upstream Gulf of Mexico and other producing properties.
2009
Cash used in investing activities netted to $22.4 billion in 2009, $6.9 billion higher than in 2008. Spending for property, plant and equipment of $22.5 billion in2009 increased $3.2 billion from 2008. Proceeds from the sales of subsidiaries, investments and property, plant and equipment of $1.5 billion in 2009 comparedto $6.0 billion in 2008, the decrease reflecting the absence of the sale of the natural gas transportation business in Germany and lower sales of Downstream assetsand investments.
Cash Flow from Financing Activities
2010
Cash used in financing activities was $26.9 billion in 2010, $0.4 billion lower than 2009. Dividend payments on common shares increased to $1.74 per share from$1.66 per share and totaled $8.5 billion, a pay-out of 28 percent. Total debt increased to $15.0 billion at year end, an increase of $5.4 billion from 2009, primarilyas a result of debt assumed with the XTO merger.
ExxonMobil share of equity increased $36.3 billion to $146.8 billion. The addition to equity for earnings of $30.5 billion and the issuance of stock for theXTO merger of $24.7 billion was partially offset by reductions to equity for distributions to ExxonMobil shareholders of $8.5 billion of dividends and $11.2billion of purchases of shares of ExxonMobil stock to reduce shares outstanding.
During 2010, Exxon Mobil Corporation issued 416 million shares for the XTO merger. Exxon Mobil Corporation purchased 199 million shares of itscommon stock for the treasury at a gross cost of $13.1 billion. These purchases were to reduce the number of shares outstanding and to offset shares issued inconjunction with company benefit plans and programs. Shares outstanding increased by 5.3 percent from 4,727 million at the end of 2009 to 4,979 million at theend of 2010. Purchases were made in both the open market and negotiated transactions. Purchases may be increased, decreased or discontinued at any timewithout prior notice.
2009
Cash used in financing activities was $27.3 billion in 2009, $16.7 billion lower than 2008, reflecting a lower level of purchases of ExxonMobil shares. Dividendpayments on common shares increased to $1.66 per share from $1.55 per share and totaled $8.0 billion, a pay-out of 42 percent. Total consolidated short-term andlong-term debt increased
53
Table of Contents
Index to Financial Statements
MANAGEMENT’S DISCUSSION AND ANALYSIS OF FINANCIAL CONDITION AND RESULTS OF OPERATIONS $0.2 billion to $9.6 billion at year-end 2009.
ExxonMobil share of equity decreased $2.4 billion in 2009, to $110.6 billion. The addition to equity for earnings of $19.3 billion was more than offset byreductions for distributions to ExxonMobil shareholders of $8.0 billion of dividends and $18.0 billion of purchases of shares of ExxonMobil stock to reduceshares outstanding. Equity, and net assets and liabilities, increased $3.3 billion, representing the foreign exchange translation effects of generally stronger foreigncurrencies at the end of 2009 on ExxonMobil’s operations outside the United States. The change in the funded status of the postretirement benefits reserves in2009 increased equity by $1.2 billion.
During 2009, Exxon Mobil Corporation purchased 277 million shares of its common stock for the treasury at a gross cost of $19.7 billion. These purchaseswere to reduce the number of shares outstanding and to offset shares issued in conjunction with company benefit plans and programs. Shares outstanding werereduced by 5.0 percent from 4,976 million at the end of 2008 to 4,727 million at the end of 2009. Purchases were made in both the open market and throughnegotiated transactions.
Commitments
Set forth below is information about the outstanding commitments of the Corporation’s consolidated subsidiaries at December 31, 2010. It combines data fromthe Consolidated Balance Sheet and from individual notes to the Consolidated Financial Statements. Payments Due by Period
Commitments
NoteReferenceNumber 2011
2012-2015
2016and
Beyond Total (millions of dollars) Long-term debt 13 $ — $ 5,464 $ 6,763 $12,227
- Due in one year 5 345 — — 345 Asset retirement obligations 8 775 2,196 6,643 9,614 Pension and other postretirement obligations 16 2,541 4,130 13,231 19,902 Operating leases 10 2,095 3,943 1,738 7,776 Unconditional purchase obligations 15 287 748 487 1,522 Take-or-pay obligations 1,704 6,275 8,832 16,811 Firm capital commitments 14,851 12,329 948 28,128
This table excludes commodity purchase obligations (volumetric commitments but no fixed or minimum price) which are resold shortly after purchase,either in an active, highly liquid market or under long-term, unconditional sales contracts with similar pricing terms. Examples include long-term, noncancelableLNG and natural gas purchase commitments and commitments to purchase refinery products at market prices. Inclusion of such commitments would not bemeaningful in assessing liquidity and cash flow, because these purchases will be offset in the same periods by cash received from the related sales transactions.The table also excludes unrecognized tax benefits totaling $4.1 billion as of December 31, 2010, because the Corporation is unable to make reasonably reliableestimates of the timing of cash settlements with the respective taxing authorities. Further details on the unrecognized tax benefits can be found in note 18, Income,Sales-Based and Other Taxes.
Notes:
(1) Includes capitalized lease obligations of $304 million.(2) The amount due in one year is included in notes and loans payable of $2,787 million.(3) The fair value of asset retirement obligations, primarily upstream asset removal costs at the completion of field life.(4) The amount by which the benefit obligations exceeded the fair value of fund assets for certain U.S. and non-U.S. pension and other postretirement plans at
year end. The payments by period include expected contributions to funded pension plans in 2011 and estimated benefit payments for unfunded plans in allyears.
(5) Minimum commitments for operating leases, shown on an undiscounted basis, cover drilling equipment, tankers, service stations and other properties.(6) Unconditional purchase obligations (UPOs) are those long-term commitments that are noncancelable or cancelable only under certain conditions, and that
third parties have used to secure financing for the facilities that will provide the contracted goods or services. The undiscounted obligations of $1,522million mainly pertain to pipeline throughput agreements and include $996 million of obligations to equity companies.
(7) Take-or-pay obligations are noncancelable, long-term commitments for goods and services other than UPOs. The undiscounted obligations of $16,811million mainly pertain to manufacturing supply, pipeline and terminaling agreements and include $507 million of obligations to equity companies.
(8) Firm commitments related to capital projects, shown on an undiscounted basis, totaled approximately $28.1 billion. These commitments were primarilyassociated with Upstream projects outside the U.S., of which $17.2 billion was associated with projects in Australia, Africa, Malaysia and Canada. TheCorporation expects to fund the majority of these projects through internal cash flow.
54
(1)
(2)
(3)
(4)
(5)
(6)
(7)
(8)
Table of Contents
Index to Financial Statements
Guarantees
The Corporation and certain of its consolidated subsidiaries were contingently liable at December 31, 2010, for $8,771 million, primarily relating to guaranteesfor notes, loans and performance under contracts (note 15). Included in this amount were guarantees by consolidated affiliates of $5,290 million, representingExxonMobil’s share of obligations of certain equity companies. The below-mentioned guarantees are not reasonably likely to have a material effect on theCorporation’s financial condition, changes in financial condition, revenues or expenses, results of operations, liquidity, capital expenditures or capital resources. Dec. 31, 2010
EquityCompany
Obligations
OtherThird-PartyObligations Total
(millions of dollars) Guarantees $ 5,290 $ 3,481 $8,771
Financial Strength
On December 31, 2010, unused credit lines for short-term financing totaled approximately $5.6 billion (note 5).
The table below shows the Corporation’s fixed-charge coverage and consolidated debt-to-capital ratios. The data demonstrate the Corporation’screditworthiness. 2010 2009 2008 Fixed-charge coverage ratio (times) 42.2 25.8 54.6 Debt to capital (percent) 9.0 7.7 7.4 Net debt to capital (percent) 4.5 (1.0) (23.0)
Management views the Corporation’s financial strength, as evidenced by the above financial ratios and other similar measures, to be a competitiveadvantage of strategic importance. The Corporation’s sound financial position gives it the opportunity to access the world’s capital markets in the full range ofmarket conditions, and enables the Corporation to take on large, long-term capital commitments in the pursuit of maximizing shareholder value.
Litigation and Other Contingencies
Litigation. As discussed in note 15, a variety of claims have been made against ExxonMobil and certain of its consolidated subsidiaries in a number of pendinglawsuits. Based on a consideration of all relevant facts and circumstances, the Corporation does not believe the ultimate outcome of any currently pending lawsuitagainst ExxonMobil will have a materially adverse effect upon the Corporation’s operations, financial condition, or financial statements taken as a whole. Thereare no events or uncertainties beyond those already included in reported financial information that would indicate a material change in future operating results orfinancial condition.
Other Contingencies. In accordance with a nationalization decree issued by Venezuela’s president in February 2007, by May 1, 2007, a subsidiary of theVenezuelan National Oil Company (PdVSA) assumed the operatorship of the Cerro Negro Heavy Oil Project. This Project had been operated and owned byExxonMobil affiliates holding a 41.67 percent ownership interest in the Project. The decree also required conversion of the Cerro Negro Project into a “mixedenterprise” and an increase in PdVSA’s or one of its affiliate’s ownership interest in the Project, with the stipulation that if ExxonMobil refused to accept theterms for the formation of the mixed enterprise within a specified period of time, the government would “directly assume the activities” carried out by the jointventure. ExxonMobil refused to accede to the terms proffered by the government, and on June 27, 2007, the government expropriated ExxonMobil’s 41.67percent interest in the Cerro Negro Project.
On September 6, 2007, affiliates of ExxonMobil filed a Request for Arbitration with the International Centre for Settlement of Investment Disputes(ICSID) invoking ICSID jurisdiction under Venezuela’s Investment Law and the Netherlands-Venezuela Bilateral Investment Treaty. The ICSID Tribunal issued adecision on June 10, 2010, finding that it had jurisdiction to proceed on the basis of the Netherlands-Venezuela Bilateral Investment Treaty. The ICSID arbitrationproceeding is continuing and a hearing on the merits is currently scheduled for the first quarter of 2012. An affiliate of ExxonMobil has also filed an arbitrationunder the rules of the International Chamber of Commerce (ICC) against PdVSA and a PdVSA affiliate for breach of their contractual obligations under certainCerro Negro Project agreements. A hearing on the merits of the ICC arbitration concluded in September 2010 and the parties have filed post-hearing briefs. Atthis time, the net impact of this matter on the Corporation’s consolidated financial results cannot be reasonably estimated. However, the Corporation does notexpect the resolution to have a material effect upon the Corporation’s operations or financial condition. ExxonMobil’s remaining net book investment in CerroNegro producing assets is about $750 million.
55
Table of Contents
Index to Financial Statements
MANAGEMENT’S DISCUSSION AND ANALYSIS OF FINANCIAL CONDITION AND RESULTS OF OPERATIONS CAPITAL AND EXPLORATION EXPENDITURES 2010 2009 U.S. Non-U.S. U.S. Non-U.S. (millions of dollars) Upstream $6,349 $20,970 $3,585 $17,119 Downstream 982 1,523 1,511 1,685 Chemical 279 1,936 319 2,829 Other 187 — 44 —
Total $7,797 $24,429 $5,459 $21,633
(1) Exploration expenses included.
Capital and exploration expenditures in 2010 were $32.2 billion, reflecting the Corporation’s continued active investment program. The Corporation expectsannual expenditures to range from $33 billion to $37 billion for the next several years. Actual spending could vary depending on the progress of individualprojects.
Upstream spending of $27.3 billion in 2010 was up 32 percent from 2009, reflecting unconventional gas activities in the U.S. and continued progress onworld-class projects in Canada, Australia and Papua New Guinea. The majority of expenditures are on development projects, which typically take two to fouryears from the time of recording proved undeveloped reserves to the start of production from those reserves. The percentage of proved developed reserves was 69percent of total proved reserves at year-end 2010, and has been over 60 percent for the last five years, indicating that proved reserves are consistently moved fromundeveloped to developed status. Capital investments in the Downstream totaled $2.5 billion in 2010, a decrease of $0.7 billion from 2009, due to completion ofenvironmental-related refining projects, primarily in the U.S. The Chemical capital expenditures of $2.2 billion were $0.9 billion lower in 2010 as investments inAsia to meet demand growth progressed toward completion.
TAXES 2010 2009 2008 (millions of dollars) Income taxes $21,561 $15,119 $ 36,530
Effective income tax rate 45% 47% 46% Sales-based taxes 28,547 25,936 34,508 All other taxes and duties 39,127 37,571 45,223
Total $89,235 $78,626 $116,261
2010
Income, sales-based and all other taxes and duties totaled $89.2 billion in 2010, an increase of $10.6 billion or 13 percent from 2009. Income tax expense, bothcurrent and deferred, was $21.6 billion, $6.4 billion higher than 2009, reflecting higher pre-tax income in 2010. A lower share of pre-tax income from theUpstream segment in 2010 decreased the effective tax rate to 45 percent compared to 47 percent in 2009. Sales-based and all other taxes and duties of $67.7billion in 2010 increased $4.2 billion, reflecting higher prices.
2009
Income, sales-based and all other taxes and duties totaled $78.6 billion in 2009, a decrease of $37.6 billion or 32 percent from 2008. Income tax expense, bothcurrent and deferred, was $15.1 billion, $21.4 billion lower than 2008, reflecting lower pre-tax income in 2009. A higher share of total income from the Upstreamsegment in 2009 increased the effective income tax rate to 47 percent compared to 46 percent in 2008. Sales-based and all other taxes and duties of $63.5 billionin 2009 decreased $16.2 billion from 2008, reflecting lower prices and foreign exchange effects.
ENVIRONMENTAL MATTERS
Environmental Expenditures 2010 2009 (millions of dollars) Capital expenditures $1,947 $2,481 Other expenditures 2,593 2,610
Total $4,540 $5,091
Throughout ExxonMobil’s businesses, new and ongoing measures are taken to prevent and minimize the impact of our operations on air, water and ground. Theseinclude a significant investment in refining infrastructure and technology to manufacture clean fuels as well as projects to monitor and reduce nitrogen oxide,sulfur oxide and greenhouse gas emissions and expenditures for asset retirement obligations. ExxonMobil’s 2010 worldwide environmental expenditures for allsuch preventative and remediation steps, including ExxonMobil’s share of equity company expenditures, were about $4.5 billion. The total cost for such activitiesis expected to remain in this range in 2011 and 2012 (with capital expenditures approximately 40 percent of the total).
Environmental Liabilities
The Corporation accrues environmental liabilities when it is probable that obligations have been incurred and the amounts can be reasonably estimated. Thispolicy applies to assets or businesses currently owned or previously disposed. ExxonMobil has accrued liabilities for probable environmental remediationobligations at various sites, including multiparty sites where the U.S. Environmental Protection Agency has identified ExxonMobil as one of the potentiallyresponsible parties. The involvement of other financially responsible companies at these multiparty sites could mitigate ExxonMobil’s actual joint and severalliability exposure. At present, no individual site is expected to have losses material to ExxonMobil’s operations or financial condition. Consolidated company
(1)
provisions made in 2010 for environmental liabilities were $448 million ($504 million in 2009) and the balance sheet reflects accumulated liabilities of $948million as of December 31, 2010, and $943 million as of December 31, 2009.
56
Table of Contents
Index to Financial Statements
Asset Retirement Obligations
The fair values of asset retirement obligations are recorded as liabilities on a discounted basis when they are incurred, which is typically at the time assets areinstalled, with an offsetting amount booked as additions to property, plant and equipment ($1,094 million for 2010). Over time, the liabilities are accreted for theincrease in their present value, with this effect included in expenses ($563 million in 2010). Consolidated company expenditures for asset retirement obligationsin 2010 were $638 million and the obligations recorded on the balance sheet at December 31, 2010, totaled $9,614 million.
MARKET RISKS, INFLATION AND OTHER UNCERTAINTIES Worldwide Average Realizations 2010 2009 2008 Crude oil and NGL ($/barrel) $74.04 $57.86 $90.96 Natural gas ($/kcf) 4.31 4.00 7.54 (1) Consolidated subsidiaries.
Crude oil, natural gas, petroleum product and chemical prices have fluctuated in response to changing market forces. The impacts of these price fluctuations onearnings from Upstream, Downstream and Chemical operations have varied. In the Upstream, a $1 per barrel change in the weighted-average realized price of oilwould have approximately a $375 million annual after-tax effect on Upstream consolidated plus equity company earnings. Similarly, a $0.10 per kcf change in theworldwide average gas realization would have approximately a $200 million annual after-tax effect on Upstream consolidated plus equity company earnings. Forany given period, the extent of actual benefit or detriment will be dependent on the price movements of individual types of crude oil, taxes and other governmenttake impacts, price adjustment lags in long-term gas contracts, and crude and gas production volumes. Accordingly, changes in benchmark prices for crude oil andnatural gas only provide broad indicators of changes in the earnings experienced in any particular period.
In the very competitive downstream and chemical environments, earnings are primarily determined by margin capture rather than absolute price levels ofproducts sold. Refining margins are a function of the difference between what a refiner pays for its raw materials (primarily crude oil) and the market prices forthe range of products produced. These prices in turn depend on global and regional supply/demand balances, inventory levels, refinery operations, import/exportbalances and weather.
The global energy markets can give rise to extended periods in which market conditions are adverse to one or more of the Corporation’s businesses. Suchconditions, along with the capital-intensive nature of the industry and very long lead times associated with many of our projects, underscore the importance ofmaintaining a strong financial position. Management views the Corporation’s financial strength as a competitive advantage.
In general, segment results are not dependent on the ability to sell and/or purchase products to/from other segments. Instead, where such sales take place,they are the result of efficiencies and competitive advantages of integrated refinery/chemical complexes. Additionally, intersegment sales are at market-basedprices. The products bought and sold between segments can also be acquired in worldwide markets that have substantial liquidity, capacity and transportationcapabilities. About 40 percent of the Corporation’s intersegment sales are crude oil produced by the Upstream and sold to the Downstream. Other intersegmentsales include those between refineries and chemical plants related to raw materials, feedstocks and finished products.
Although price levels of crude oil and natural gas may rise or fall significantly over the short to medium term due to political events, OPEC actions andother factors, industry economics over the long term will continue to be driven by market supply and demand. Accordingly, the Corporation tests the viability ofall of its investments over a broad range of future prices. The Corporation’s assessment is that its operations will continue to be successful in a variety of marketconditions. This is the outcome of disciplined investment and asset management programs. Investment opportunities are tested against a variety of marketconditions, including low-price scenarios.
The Corporation has an active asset management program in which underperforming assets are either improved to acceptable levels or considered fordivestment. The asset management program includes a disciplined, regular review to ensure that all assets are contributing to the Corporation’s strategicobjectives. The result is an efficient capital base, and the Corporation has seldom had to write down the carrying value of assets, even during periods of lowcommodity prices.
Risk Management
The Corporation’s size, strong capital structure, geographic diversity and the complementary nature of the Upstream, Downstream and Chemical businessesreduce the Corporation’s enterprise-wide risk from changes in interest rates, currency rates and commodity prices. As a result, the Corporation makes limited useof derivative instruments to mitigate the impact of such changes. With respect to derivatives activities, the Corporation believes that there are no material marketor credit risks to the Corporation’s financial position, results of operations or liquidity as a result of the derivatives described in note 12. The Corporation does notengage in speculative derivative activities or derivative trading activities nor does it use derivatives with leveraged features. Credit risk associated with theCorporation’s derivative position is mitigated by several factors, including the quality of and financial limits placed on derivative counterparties. The Corporationmaintains a system of controls that includes the authorization, reporting and monitoring of derivative activity.
57
(1)
Table of Contents
Index to Financial Statements
MANAGEMENT’S DISCUSSION AND ANALYSIS OF FINANCIAL CONDITION AND RESULTS OF OPERATIONS
The Corporation is exposed to changes in interest rates, primarily on its short-term debt and the portion of long-term debt that carries floating interest rates.The impact of a 100-basis-point change in interest rates affecting the Corporation’s debt would not be material to earnings, cash flow or fair value. Although theCorporation issues long-term debt from time to time and maintains a commercial paper program, internally generated funds are expected to cover the majority ofits net near-term financial requirements. However, some joint-venture partners are dependent on the credit markets, and their funding ability may impact thedevelopment pace of joint-venture projects.
The Corporation conducts business in many foreign currencies and is subject to exchange rate risk on cash flows related to sales, expenses, financing andinvestment transactions. The impacts of fluctuations in exchange rates on ExxonMobil’s geographically and functionally diverse operations are varied and oftenoffsetting in amount. The Corporation makes limited use of currency exchange contracts to mitigate the impact of changes in currency values, and exposuresrelated to the Corporation’s limited use of the currency exchange contracts are not material. The Corporation makes limited use of commodity forwards, swapsand futures contracts to mitigate the impact of changes in commodity prices. A substantial portion of the commodity futures contracts and swap agreementsacquired as part of the XTO merger settled during 2010 and the majority of the remainder will settle by year-end 2011.
Inflation and Other Uncertainties
The general rate of inflation in many major countries of operation has remained moderate over the past few years, and the associated impact on non-energy costshas generally been mitigated by cost reductions from efficiency and productivity improvements. Increased demand for certain services and materials has resultedin higher operating and capital costs in recent years. The Corporation works to counter upward pressure on costs through its economies of scale in globalprocurement and its efficient project management practices.
CRITICAL ACCOUNTING POLICIES
The Corporation’s accounting and financial reporting fairly reflect its straightforward business model involving the extracting, refining and marketing ofhydrocarbons and hydrocarbon-based products. The preparation of financial statements in conformity with U.S. Generally Accepted Accounting Principles(GAAP) requires management to make estimates and judgments that affect the reported amounts of assets, liabilities, revenues and expenses and the disclosure ofcontingent assets and liabilities. The following summary provides further information about the critical accounting policies and the judgments that are made bythe Corporation in the application of those policies.
Oil and Gas Reserves
Evaluations of oil and gas reserves are important to the effective management of Upstream assets. They are integral to making investment decisions about oil andgas properties such as whether development should proceed. Oil and gas reserve quantities are also used as the basis for calculating unit-of-productiondepreciation rates and for evaluating impairment. Oil and gas reserves include both proved and unproved reserves. Consistent with the definitions in the Securitiesand Exchange Commission’s Rule 4-10(a) of Regulation S-X, proved oil and gas reserves are those quantities of oil and gas, which, by analysis of geoscience andengineering data, can be estimated with reasonable certainty to be economically producible – from a given date forward, from known reservoirs, and underexisting economic conditions, operating methods and government regulations – prior to the time at which contracts providing the right to operate expire, unlessevidence indicates that renewal is reasonably certain. Unproved reserves are those with less than reasonable certainty of recoverability and include probablereserves. Probable reserves are reserves that are more likely to be recovered than not.
The estimation of proved reserves, which is based on the requirement of reasonable certainty, is an ongoing process based on rigorous technicalevaluations, commercial and market assessment, and detailed analysis of well information such as flow rates and reservoir pressure declines. The estimation ofproved reserves is controlled by the Corporation through long-standing approval guidelines. Reserve changes are made within a well-established, disciplinedprocess driven by senior level geoscience and engineering professionals, assisted by the Reserves Technical Oversight group which has significant technicalexperience, culminating in reviews with and approval by senior management. Notably, the Corporation does not use specific quantitative reserve targets todetermine compensation.
Key features of the reserves estimation process include:
– rigorous peer-reviewed technical evaluations and analysis of well and field performance information (such as flow rates and reservoir pressure
declines) and
– a requirement that management make significant funding commitments toward the development of the reserves prior to reporting as proved.
Although the Corporation is reasonably certain that proved reserves will be produced, the timing and amount recovered can be affected by a number offactors including completion of development projects, reservoir performance, regulatory approvals and significant changes in long-term oil and gas price levels.
58
Table of Contents
Index to Financial Statements
Proved reserves can be further subdivided into developed and undeveloped reserves. The percentage of proved developed reserves was 69 percent of totalproved reserves at year-end 2010 (including both consolidated and equity company reserves), and has been over 60 percent for the last five years, indicating thatproved reserves are consistently moved from undeveloped to developed status. Over time, these undeveloped reserves will be reclassified to the developedcategory as new wells are drilled, existing wells are recompleted and/or facilities to collect and deliver the production from existing and future wells are installed.Major development projects typically take two to four years from the time of recording proved reserves to the start of production from these reserves.
Revisions can include upward or downward changes in previously estimated volumes of proved reserves for existing fields due to the evaluation or re-evaluation of (1) already available geologic, reservoir or production data, (2) new geologic, reservoir or production data or (3) changes in prices and costs that areused in the estimation of reserves. This category can also include significant changes in either development strategy or production equipment/facility capacity.
The Corporation uses the “successful efforts” method to account for its exploration and production activities. Under this method, costs are accumulated ona field-by-field basis with certain exploratory expenditures and exploratory dry holes being expensed as incurred. Costs of productive wells and development dryholes are capitalized and amortized on the unit-of-production method. The Corporation uses this accounting policy instead of the “full cost” method because itprovides a more timely accounting of the success or failure of the Corporation’s exploration and production activities. If the full cost method were used, all costswould be capitalized and depreciated on a country-by-country basis. The capitalized costs would be subject to an impairment test by country. The full cost methodwould tend to delay the expense recognition of unsuccessful projects.
Impact of Oil and Gas Reserves on Depreciation. The calculation of unit-of-production depreciation is a critical accounting estimate that measures thedepreciation of upstream assets. It is the ratio of actual volumes produced to total proved developed reserves (those proved reserves recoverable through existingwells with existing equipment and operating methods), applied to the asset cost. The volumes produced and asset cost are known and, while proved developedreserves have a high probability of recoverability, they are based on estimates that are subject to some variability. While the revisions the Corporation has made inthe past are an indicator of variability, they have had a very small impact on the unit-of-production rates because they have been small compared to the largereserves base.
Impact of Oil and Gas Reserves and Prices on Testing for Impairment. Proved oil and gas properties held and used by the Corporation are reviewed forimpairment whenever events or circumstances indicate that the carrying amounts may not be recoverable. Assets are grouped at the lowest level for which thereare identifiable cash flows that are largely independent of the cash flows of other groups of assets.
The Corporation estimates the future undiscounted cash flows of the affected properties to judge the recoverability of carrying amounts. In general,analyses are based on proved reserves. Where probable reserves exist, an appropriately risk-adjusted amount of these reserves may be included in the impairmentevaluation. An asset would be impaired if the undiscounted cash flows were less than its carrying value. Impairments are measured by the amount by which thecarrying value exceeds its fair value. Significant unproved properties are assessed for impairment individually and valuation allowances against the capitalizedcosts are recorded based on the estimated economic chance of success and the length of time that the Corporation expects to hold the properties. Properties thatare not individually significant are aggregated by groups and amortized based on development risk and average holding period.
The Corporation performs asset valuation analyses on an ongoing basis as a part of its asset management program. These analyses monitor the performanceof assets against corporate objectives. They also assist the Corporation in assessing whether the carrying amounts of any of its assets may not be recoverable. Inaddition to estimating oil and gas reserve volumes in conducting these analyses, it is also necessary to estimate future oil and gas prices. Trigger events forimpairment evaluation include a significant decrease in current and projected reserve volumes, an accumulation of project costs significantly in excess of theamount originally expected, and historical and forecast operating losses.
In general, the Corporation does not view temporarily low oil and gas prices as a trigger event for conducting the impairment tests. The markets for crudeoil and natural gas have a history of significant price volatility. Although prices will occasionally drop significantly, industry prices over the long term willcontinue to be driven by market supply and demand. On the supply side, industry production from mature fields is declining, but this is being offset by productionfrom new discoveries and field developments. OPEC production policies also have an impact on world oil supplies. The demand side is largely a function ofglobal economic growth. The relative growth/decline in supply versus demand will determine industry prices over the long term, and these cannot be accuratelypredicted. Accordingly, any impairment tests that the Corporation performs make use of the Corporation’s price assumptions developed in the annual planningand budgeting process for the crude oil and natural gas markets, petroleum products and chemicals. These are the same price assumptions that are used
59
Table of Contents
Index to Financial Statements
MANAGEMENT’S DISCUSSION AND ANALYSIS OF FINANCIAL CONDITION AND RESULTS OF OPERATIONS for capital investment decisions. Volumes are based on individual field production profiles, which are updated annually. Cash flow estimates for impairmenttesting exclude the effects of derivative instruments.
Supplemental information regarding oil and gas results of operations, capitalized costs and reserves is provided following the notes to consolidatedfinancial statements. Future prices used for any impairment tests will vary from the one used in the supplemental oil and gas disclosure and could be lower orhigher for any given year.
Suspended Exploratory Well Costs
The Corporation carries as an asset exploratory well costs when the well has found a sufficient quantity of reserves to justify its completion as a producing welland where the Corporation is making sufficient progress assessing the reserves and the economic and operating viability of the project. Exploratory well costs notmeeting these criteria are charged to expense. Assessing whether a project has made sufficient progress is a subjective area and requires careful consideration ofthe relevant facts and circumstances. The facts and circumstances that support continued capitalization of suspended wells as of year-end 2010 are disclosed innote 9 to the financial statements.
Consolidations
The Consolidated Financial Statements include the accounts of those subsidiaries that the Corporation controls. They also include the Corporation’s share of theundivided interest in certain upstream assets and liabilities. Amounts representing the Corporation’s percentage interest in the underlying net assets of othersignificant affiliates that it does not control, but exercises significant influence, are included in “Investments, advances and long-term receivables”; theCorporation’s share of the net income of these companies is included in the Consolidated Statement of Income caption “Income from equity affiliates.” Theaccounting for these non-consolidated companies is referred to as the equity method of accounting.
Majority ownership is normally the indicator of control that is the basis on which subsidiaries are consolidated. However, certain factors may indicate that amajority-owned investment is not controlled and therefore should be accounted for using the equity method of accounting. These factors occur where the minorityshareholders are granted by law or by contract substantive participating rights. These include the right to approve operating policies, expense budgets, financingand investment plans and management compensation and succession plans.
Additional disclosures of summary balance sheet and income information for those subsidiaries accounted for under the equity method of accounting canbe found in note 6.
Investments in companies that are partially owned by the Corporation are integral to the Corporation’s operations. In some cases they serve to balanceworldwide risks and in others they provide the only available means of entry into a particular market or area of interest. The other parties who also have an equityinterest in these companies are either independent third parties or host governments that share in the business results according to their percentage ownership. TheCorporation does not invest in these companies in order to remove liabilities from its balance sheet. In fact, the Corporation has long been on record supporting analternative accounting method that would require each investor to consolidate its percentage share of all assets and liabilities in these partially owned companiesrather than only its percentage in the net equity. This method of accounting for investments in partially owned companies is not permitted by GAAP except wherethe investments are in the direct ownership of a share of upstream assets and liabilities. However, for purposes of calculating return on average capital employed,which is not covered by GAAP standards, the Corporation includes its share of debt of these partially owned companies in the determination of average capitalemployed.
Pension Benefits
The Corporation and its affiliates sponsor approximately 100 defined benefit (pension) plans in about 50 countries. The funding arrangement for each plandepends on the prevailing practices and regulations of the countries where the Corporation operates. Pension and Other Postretirement Benefits (note 16) providesdetails on pension obligations, fund assets and pension expense.
Some of these plans (primarily non-U.S.) provide pension benefits that are paid directly by their sponsoring affiliates out of corporate cash flow rather thana separate pension fund. Book reserves are established for these plans because tax conventions and regulatory practices do not encourage advance funding. Theportion of the pension cost attributable to employee service is expensed as services are rendered. The portion attributable to the increase in pension obligationsdue to the passage of time is expensed over the term of the obligations, which ends when all benefits are paid. The primary difference in pension expense forunfunded versus funded plans is that pension expense for funded plans also includes a credit for the expected long-term return on fund assets.
For funded plans, including those in the United States, pension obligations are financed in advance through segregated assets or insurance arrangements.These plans are managed in compliance with the requirements of governmental authorities and meet or exceed required funding levels as measured by relevantactuarial and government standards at the mandated measurement dates. In determining liabilities and required contributions, these standards often requireapproaches and assumptions that differ from those used for accounting purposes.
The Corporation will continue to make contributions to these funded plans as necessary. All defined-benefit pension obligations, regardless of the fundingstatus of the underlying plans, are fully supported by the financial strength of the Corporation or the respective sponsoring affiliate.
60
Table of Contents
Index to Financial Statements
Pension accounting requires explicit assumptions regarding, among others, the long-term expected earnings rate on fund assets, the discount rate for thebenefit obligations and the long-term rate for future salary increases. Pension assumptions are reviewed annually by outside actuaries and senior management.These assumptions are adjusted as appropriate to reflect changes in market rates and outlook. The long-term expected earnings rate on U.S. pension plan assets in2010 was 7.5 percent. The 10-year and 20-year actual returns on U.S. pension plan assets are 4 percent and 10 percent, respectively. The Corporation establishesthe long-term expected rate of return by developing a forward-looking, long-term return assumption for each pension fund asset class, taking into account factorssuch as the expected real return for the specific asset class and inflation. A single, long-term rate of return is then calculated as the weighted average of the targetasset allocation and the long-term return assumption for each asset class. A worldwide reduction of 0.5 percent in the long-term rate of return on assets wouldincrease annual pension expense by approximately $140 million before tax.
Differences between actual returns on fund assets and the long-term expected return are not recognized in pension expense in the year that the differenceoccurs. Such differences are deferred, along with other actuarial gains and losses, and are amortized into pension expense over the expected remaining service lifeof employees.
Litigation Contingencies
A variety of claims have been made against the Corporation and certain of its consolidated subsidiaries in a number of pending lawsuits. Management has regularlitigation reviews, including updates from corporate and outside counsel, to assess the need for accounting recognition or disclosure of these contingencies. Thestatus of significant claims is summarized in note 15.
GAAP requires that liabilities for contingencies be recorded when it is probable that a liability has been incurred by the date of the balance sheet and thatthe amount can be reasonably estimated. These amounts are not reduced by amounts that may be recovered under insurance or claims against third parties, butundiscounted receivables from insurers or other third parties may be accrued separately. The Corporation revises such accruals in light of new information. Forcontingencies where an unfavorable outcome is reasonably possible and which are significant, the Corporation discloses the nature of the contingency and, wherefeasible, an estimate of the possible loss.
Significant management judgment is required related to contingent liabilities and the outcome of litigation because both are difficult to predict. However,the Corporation has been successful in defending litigation in the past. Payments have not had a materially adverse effect on operations or financial condition. Inthe Corporation’s experience, large claims often do not result in large awards. Large awards are often reversed or substantially reduced as a result of appeal orsettlement.
Tax Contingencies
The Corporation is subject to income taxation in many jurisdictions around the world. Significant management judgment is required in the accounting for incometax contingencies and tax disputes because the outcomes are often difficult to predict.
GAAP requires recognition and measurement of uncertain tax positions that the Corporation has taken or expects to take in its income tax returns. Thebenefit of an uncertain tax position can only be recognized in the financial statements if management concludes that it is more likely than not that the position willbe sustained with the tax authorities. For a position that is likely to be sustained, the benefit recognized in the financial statements is measured at the largestamount that is greater than 50 percent likely of being realized. A reserve is established for the difference between a position taken in an income tax return and theamount recognized in the financial statements. The Corporation’s unrecognized tax benefits and a description of open tax years are summarized in note 18.
Foreign Currency Translation
The method of translating the foreign currency financial statements of the Corporation’s international subsidiaries into U.S. dollars is prescribed by GAAP. Underthese principles, it is necessary to select the functional currency of these subsidiaries. The functional currency is the currency of the primary economicenvironment in which the subsidiary operates. Management selects the functional currency after evaluating this economic environment. Downstream andChemical operations use the local currency, except in countries with a history of high inflation (primarily in Latin America) and Singapore, which uses the U.S.dollar because it predominantly sells into the U.S. dollar export market. Upstream operations also use the local currency as the functional currency, except wherecrude and natural gas production is predominantly sold in the export market in U.S. dollars. Upstream operations using the U.S. dollar as their functional currencyare primarily in Asia and Africa.
Factors considered by management when determining the functional currency for a subsidiary include: the currency used for cash flows related toindividual assets and liabilities; the responsiveness of sales prices to changes in exchange rates; the history of inflation in the country; whether sales are into localmarkets or exported; the currency used to acquire raw materials, labor, services and supplies; sources of financing; and significance of intercompany transactions.
61
Table of Contents
Index to Financial Statements
MANAGEMENT’S REPORT ON INTERNAL CONTROL OVER FINANCIAL REPORTING
Management, including the Corporation’s chief executive officer, principal financial officer, and principal accounting officer, is responsible for establishing andmaintaining adequate internal control over the Corporation’s financial reporting. Management conducted an evaluation of the effectiveness of internal controlover financial reporting based on criteria established in Internal Control – Integrated Framework issued by the Committee of Sponsoring Organizations of theTreadway Commission. Based on this evaluation, management concluded that Exxon Mobil Corporation’s internal control over financial reporting was effectiveas of December 31, 2010.
PricewaterhouseCoopers LLP, an independent registered public accounting firm, audited the effectiveness of the Corporation’s internal control overfinancial reporting as of December 31, 2010, as stated in their report included in the Financial Section of this report. Rex W. Tillerson Donald D. Humphreys Patrick T. MulvaChief Executive Officer Sr. Vice President and Treasurer Vice President and Controller
REPORT OF INDEPENDENT REGISTERED PUBLIC ACCOUNTING FIRM
To the Shareholders of Exxon Mobil Corporation:
In our opinion, the accompanying Consolidated Balance Sheets and the related Consolidated Statements of Income, Comprehensive Income, Changes in Equityand Cash Flows present fairly, in all material respects, the financial position of Exxon Mobil Corporation and its subsidiaries at December 31, 2010, and 2009,and the results of their operations and their cash flows for each of the three years in the period ended December 31, 2010, in conformity with accountingprinciples generally accepted in the United States of America. Also in our opinion, the Corporation maintained, in all material respects, effective internal controlover financial reporting as of December 31, 2010, based on criteria established in Internal Control – Integrated Framework issued by the Committee ofSponsoring Organizations of the Treadway Commission (COSO). The Corporation’s management is responsible for these financial statements, for maintainingeffective internal control over financial reporting and for its assessment of the effectiveness of internal control over financial reporting, included in theaccompanying Management’s Report on Internal Control over Financial Reporting. Our responsibility is to express opinions on these financial statements and onthe Corporation’s internal control over financial reporting based on our integrated audits. We conducted our audits in accordance with the standards of the PublicCompany Accounting Oversight Board (United States). Those standards require that we plan and perform the audits to obtain reasonable assurance about whetherthe financial statements are free of material misstatement and whether effective internal control over financial reporting was maintained in all material respects.Our audits of the financial statements included examining, on a test basis, evidence supporting the amounts and disclosures in the financial statements, assessingthe accounting principles used and significant estimates made by management, and evaluating the overall financial statement presentation. Our audit of internalcontrol over financial reporting included obtaining an understanding of internal control over financial reporting, assessing the risk that a material weakness exists,and testing and evaluating the design and operating effectiveness of internal control based on the assessed risk. Our audits also included performing such otherprocedures as we considered necessary in the circumstances. We believe that our audits provide a reasonable basis for our opinions.
62
Table of Contents
Index to Financial Statements
A company’s internal control over financial reporting is a process designed to provide reasonable assurance regarding the reliability of financial reporting and thepreparation of financial statements for external purposes in accordance with generally accepted accounting principles. A company’s internal control over financialreporting includes those policies and procedures that (i) pertain to the maintenance of records that, in reasonable detail, accurately and fairly reflect thetransactions and dispositions of the assets of the company; (ii) provide reasonable assurance that transactions are recorded as necessary to permit preparation offinancial statements in accordance with generally accepted accounting principles, and that receipts and expenditures of the company are being made only inaccordance with authorizations of management and directors of the company; and (iii) provide reasonable assurance regarding prevention or timely detection ofunauthorized acquisition, use, or disposition of the company’s assets that could have a material effect on the financial statements.
Because of its inherent limitations, internal control over financial reporting may not prevent or detect misstatements. Also, projections of any evaluation ofeffectiveness to future periods are subject to the risk that controls may become inadequate because of changes in conditions, or that the degree of compliance withthe policies or procedures may deteriorate.
/s/ PRICEWATERHOUSECOOPERS LLP
Dallas, TexasFebruary 25, 2011
63
Table of Contents
Index to Financial Statements
CONSOLIDATED STATEMENT OF INCOME
NoteReferenceNumber 2010 2009 2008
(millions of dollars) Revenues and other income
Sales and other operating revenue $370,125 $301,500 $459,579 Income from equity affiliates 6 10,677 7,143 11,081 Other income 2,419 1,943 6,699
Total revenues and other income $383,221 $310,586 $477,359
Costs and other deductions Crude oil and product purchases $197,959 $152,806 $249,454 Production and manufacturing expenses 35,792 33,027 37,905 Selling, general and administrative expenses 14,683 14,735 15,873 Depreciation and depletion 14,760 11,917 12,379 Exploration expenses, including dry holes 2,144 2,021 1,451 Interest expense 259 548 673 Sales-based taxes 18 28,547 25,936 34,508 Other taxes and duties 18 36,118 34,819 41,719
Total costs and other deductions $330,262 $275,809 $393,962
Income before income taxes $ 52,959 $ 34,777 $ 83,397 Income taxes 18 21,561 15,119 36,530
Net income including noncontrolling interests $ 31,398 $ 19,658 $ 46,867 Net income attributable to noncontrolling interests 938 378 1,647
Net income attributable to ExxonMobil $ 30,460 $ 19,280 $ 45,220
Earnings per common share (dollars) 11 $ 6.24 $ 3.99 $ 8.70
Earnings per common share – assuming dilution (dollars) 11 $ 6.22 $ 3.98 $ 8.66 (1) Sales and other operating revenue includes sales-based taxes of $28,547 million for 2010, $25,936 million for 2009 and $34,508 million for 2008.(2) Other income for 2008 includes a $62 million gain from the sale of a non-U.S. investment and a related $143 million foreign exchange loss.
The information in the Notes to Consolidated Financial Statements is an integral part of these statements.
64
(1)
(2)
(1)
Table of Contents
Index to Financial Statements
CONSOLIDATED BALANCE SHEET
NoteReferenceNumber
Dec. 312010
Dec. 312009
(millions of dollars) Assets
Current assets Cash and cash equivalents $ 7,825 $ 10,693 Cash and cash equivalents – restricted 3 628 — Marketable securities 2 169 Notes and accounts receivable, less estimated doubtful amounts 5 32,284 27,645 Inventories
Crude oil, products and merchandise 3 9,852 8,718 Materials and supplies 3,124 2,835
Other current assets 5,269 5,175
Total current assets $ 58,984 $ 55,235 Investments, advances and long-term receivables 7 35,338 31,665 Property, plant and equipment, at cost, less accumulated depreciation and depletion 8 199,548 139,116 Other assets, including intangibles, net 8,640 7,307
Total assets $ 302,510 $ 233,323
Liabilities Current liabilities
Notes and loans payable 5 $ 2,787 $ 2,476 Accounts payable and accrued liabilities 5 50,034 41,275 Income taxes payable 9,812 8,310
Total current liabilities $ 62,633 $ 52,061 Long-term debt 13 12,227 7,129 Postretirement benefits reserves 16 19,367 17,942 Deferred income tax liabilities 18 35,150 23,148 Other long-term obligations 20,454 17,651
Total liabilities $ 149,831 $ 117,931
Commitments and contingencies 15
Equity Common stock without par value $ 9,371 $ 5,503
(9,000 million shares authorized, 8,019 million shares issued) Earnings reinvested 298,899 276,937 Accumulated other comprehensive income
The information in the Notes to Consolidated Financial Statements is an integral part of these statements.
65
Table of Contents
Index to Financial Statements
CONSOLIDATED STATEMENT OF CASH FLOWS
NoteReferenceNumber 2010 2009 2008
(millions of dollars) Cash flows from operating activities
Net income including noncontrolling interests $ 31,398 $ 19,658 $ 46,867 Adjustments for noncash transactions
Depreciation and depletion 14,760 11,917 12,379 Deferred income tax charges/(credits) (1,135) — 1,399 Postretirement benefits expense in excess of/(less than) net payments 1,700 (1,722) 57 Other long-term obligation provisions in excess of/(less than) payments 160 731 (63)
Dividends received greater than/(less than) equity in current earnings of equity companies (596) (483) 921 Changes in operational working capital, excluding cash and debt
Reduction/(increase) – Notes and accounts receivable (5,863) (3,170) 8,641 – Inventories (1,148) 459 (1,285) – Other current assets 913 132 (509) Increase/(reduction) – Accounts and other payables 9,943 1,420 (5,415)
Net (gain) on asset sales 4 (1,401) (488) (3,757) All other items – net (318) (16) 490
Net cash provided by operating activities $ 48,413 $ 28,438 $ 59,725
Cash flows from investing activities Additions to property, plant and equipment $(26,871) $(22,491) $(19,318) Sales of subsidiaries, investments and property, plant and equipment 4 3,261 1,545 5,985 Decrease/(increase) in restricted cash and cash equivalents 3 (628) — — Additional investments and advances (1,239) (2,752) (2,495) Collection of advances 1,133 724 574 Additions to marketable securities (15) (16) (2,113) Sales of marketable securities 155 571 1,868
Net cash used in investing activities $(24,204) $(22,419) $(15,499)
Cash flows from financing activities Additions to long-term debt $ 1,143 $ 225 $ 79 Reductions in long-term debt (6,224) (68) (192) Additions to short-term debt 598 1,336 1,067 Reductions in short-term debt (2,436) (1,575) (1,624) Additions/(reductions) in debt with three months or less maturity 709 (71) 143 Cash dividends to ExxonMobil shareholders (8,498) (8,023) (8,058) Cash dividends to noncontrolling interests (281) (280) (375) Changes in noncontrolling interests (7) (113) (419) Tax benefits related to stock-based awards 122 237 333 Common stock acquired (13,093) (19,703) (35,734) Common stock sold 1,043 752 753
Net cash used in financing activities $(26,924) $(27,283) $(44,027)
Effects of exchange rate changes on cash $ (153) $ 520 $ (2,743)
Increase/(decrease) in cash and cash equivalents $ (2,868) $(20,744) $ (2,544) Cash and cash equivalents at beginning of year 10,693 31,437 33,981
Cash and cash equivalents at end of year $ 7,825 $ 10,693 $ 31,437
Non-Cash Transactions
The Corporation acquired all the outstanding equity of XTO Energy Inc.in an all-stock transaction valued at $24,659 million in 2010 (see note 19).
The information in the Notes to Consolidated Financial Statements is an integral part of these statements.
66
Table of Contents
Index to Financial Statements
CONSOLIDATED STATEMENT OF CHANGES IN EQUITY ExxonMobil Share of Equity
Common
Stock Earnings
Reinvested
AccumulatedOther
ComprehensiveIncome
CommonStock
Held inTreasury
ExxonMobilShare ofEquity
NoncontrollingInterests
TotalEquity
(millions of dollars) Balance as of December 31, 2007 $ 4,933 $228,518 $ 1,989 $(113,678) $ 121,762 $ 4,282 $126,044
Amortization of stock-based awards 618 618 618 Tax benefits related to stock-based awards 315 315 315 Other (552) (552) (552)
Net income for the year 45,220 45,220 1,647 46,867 Dividends – common shares (8,058) (8,058) (375) (8,433)
Foreign exchange translation adjustment (6,964) (6,964) (334) (7,298) Adjustment for foreign exchange translation loss
included in net income 138 138 17 155 Postretirement benefits reserves adjustment (note 16) (5,853) (5,853) (224) (6,077) Amortization of postretirement benefits reserves
adjustment included in net periodic benefit costs(note 16) 759 759 759
Balance as of December 31, 2009 $ 5,503 $276,937 $ (5,461) $(166,410) $ 110,569 $ 4,823 $ 115,392
Amortization of stock-based awards 751 751 751 Tax benefits related to stock-based awards 280 280 280 Other (683) (683) 10 (673)
Net income for the year 30,460 30,460 938 31,398 Dividends – common shares (8,498) (8,498) (281) (8,779)
Foreign exchange translation adjustment 584 584 450 1,034 Adjustment for foreign exchange translation loss
included in net income 25 25 25 Postretirement benefits reserves adjustment (note 16) (1,014) (1,014) (147) (1,161)
Amortization of postretirement benefits reservesadjustment included in net periodic benefit costs(note 16) 988 988 52 1,040
Change in fair value of cash flow hedges 184 184 184 Realized (gain)/loss from settled cash flow hedges
included in net income (129) (129) (129)
Acquisitions at cost (13,093) (13,093) (5) (13,098) Issued for XTO merger 3,520 21,139 24,659 24,659 Other dispositions 1,756 1,756 1,756
Balance as of December 31, 2010 $ 9,371 $298,899 $ (4,823) $(156,608) $ 146,839 $ 5,840 $152,679
The information in the Notes to Consolidated Financial Statements is an integral part of these statements.
67
Table of Contents
Index to Financial Statements
CONSOLIDATED STATEMENT OF CHANGES IN EQUITY (continued)
Common Stock Share Activity Issued Held in
Treasury Outstanding (millions of shares) Balance as of December 31, 2007 8,019 (2,637) 5,382
Acquisitions (434) (434) Dispositions 28 28
Balance as of December 31, 2008 8,019 (3,043) 4,976 Acquisitions (277) (277) Dispositions 28 28
Balance as of December 31, 2009 8,019 (3,292) 4,727 Acquisitions (199) (199) Issued for XTO merger 416 416 Other dispositions 35 35
Balance as of December 31, 2010 8,019 (3,040) 4,979
CONSOLIDATED STATEMENT OF COMPREHENSIVE INCOME 2010 2009 2008 (millions of dollars) Net income including noncontrolling interests $31,398 $19,658 $46,867 Other comprehensive income (net of income taxes)
Foreign exchange translation adjustment 1,034 3,629 (7,298) Adjustment for foreign exchange translation loss included in net income 25 — 155 Postretirement benefits reserves adjustment (excluding amortization) (1,161) (340) (6,077) Amortization of postretirement benefits reserves adjustment included in net periodic benefit costs 1,040 1,461 759 Change in fair value of cash flow hedges 184 — — Realized (gain)/ loss from settled cash flow hedges included in net income (129) — —
Comprehensive income including noncontrolling interests 32,391 24,408 34,406 Comprehensive income attributable to noncontrolling interests 1,293 658 1,106
Comprehensive income attributable to ExxonMobil $31,098 $23,750 $33,300
The information in the Notes to Consolidated Financial Statements is an integral part of these statements.
68
Table of Contents
Index to Financial Statements
NOTES TO CONSOLIDATED FINANCIAL STATEMENTS
The accompanying consolidated financial statements and the supporting and supplemental material are the responsibility of the management of Exxon MobilCorporation.
The Corporation’s principal business is energy, involving the worldwide exploration, production, transportation and sale of crude oil and natural gas(Upstream) and the manufacture, transportation and sale of petroleum products (Downstream). The Corporation is also a major worldwide manufacturer andmarketer of petrochemicals (Chemical) and participates in electric power generation (Upstream).
The preparation of financial statements in conformity with U.S. Generally Accepted Accounting Principles (GAAP) requires management to makeestimates that affect the reported amounts of assets, liabilities, revenues and expenses and the disclosure of contingent assets and liabilities. Actual results coulddiffer from these estimates. Prior years’ data has been reclassified in certain cases to conform to the 2010 presentation basis.
1. Summary of Accounting Policies
Principles of Consolidation. The Consolidated Financial Statements include the accounts of those subsidiaries owned directly or indirectly with more than 50percent of the voting rights held by the Corporation and for which other shareholders do not possess the right to participate in significant management decisions.They also include the Corporation’s share of the undivided interest in certain upstream assets and liabilities.
Amounts representing the Corporation’s percentage interest in the underlying net assets of other subsidiaries and less-than-majority-owned companies inwhich a significant ownership percentage interest is held are included in “Investments, advances and long-term receivables”; the Corporation’s share of the netincome of these companies is included in the Consolidated Statement of Income caption “Income from equity affiliates.” The Corporation’s share of thecumulative foreign exchange translation adjustment for equity method investments is reported in the Consolidated Statement of Changes in Equity. Evidence ofloss in value that might indicate impairment of investments in companies accounted for on the equity method is assessed to determine if such evidence representsa loss in value of the Corporation’s investment that is other than temporary. Examples of key indicators include a history of operating losses, a negative earningsand cash flow outlook, significant downward revisions to oil and gas reserves, and the financial condition and prospects for the investee’s business segment orgeographic region. If evidence of an other than temporary loss in fair value below carrying amount is determined, an impairment is recognized. In the absence ofmarket prices for the investment, discounted cash flows are used to assess fair value.
Revenue Recognition. The Corporation generally sells crude oil, natural gas and petroleum and chemical products under short-term agreements at prevailingmarket prices. In some cases (e.g., natural gas), products may be sold under long-term agreements, with periodic price adjustments. In all cases, revenues arerecognized when the products are delivered, which occurs when the customer has taken title and has assumed the risks and rewards of ownership, prices are fixedor determinable and collectibility is reasonably assured.
Revenues from the production of natural gas properties in which the Corporation has an interest with other producers are recognized on the basis of theCorporation’s net working interest. Differences between actual production and net working interest volumes are not significant.
Purchases and sales of inventory with the same counterparty that are entered into in contemplation of one another are combined and recorded as exchangesmeasured at the book value of the item sold.
Sales-Based Taxes. The Corporation reports sales, excise and value-added taxes on sales transactions on a gross basis in the Consolidated Statement of Income(included in both revenues and costs). This gross reporting basis is footnoted on the Consolidated Statement of Income.
Derivative Instruments. The Corporation makes limited use of derivative instruments. The Corporation does not engage in speculative derivative activities orderivative trading activities, nor does it use derivatives with leveraged features. When the Corporation does enter into derivative transactions, it is to offsetexposures associated with interest rates, foreign currency exchange rates and hydrocarbon prices that arise from existing assets, liabilities and forecastedtransactions. For derivatives designated as cash flow hedges, the Corporation’s activity is intended to manage the price risk posed by physical transactions.
The Corporation records all derivatives on the balance sheet at fair value. The change in fair value of derivatives designated as fair value hedges isrecognized in earnings, offset by the change in fair value of the hedged item. The change in fair value of derivatives designated as cash flow hedges is recorded inother comprehensive income and recognized in earnings when the hedged transaction is recognized in earnings. The change in fair value of derivatives notdesignated as hedging instruments is recognized in earnings. Any ineffectiveness between the derivative and the hedged item is recorded in earnings.
Hedge effectiveness is reviewed at least quarterly and is generally based on the most recent relevant correlation between the derivative and the
69
Table of Contents
Index to Financial Statements
NOTES TO CONSOLIDATED FINANCIAL STATEMENTS item hedged. Hedge ineffectiveness is calculated based on the difference between the change in fair value of the derivative and change in cash flow or fair valueof the items hedged. If it is determined that a derivative is no longer highly effective, hedge accounting is then discontinued and the change in fair value sinceinception that is on the balance sheet either as other comprehensive income for cash flow hedges, or the underlying hedged item for fair value hedges, is recordedin earnings.
Fair Value. Fair value is the price that would be received to sell an asset or paid to transfer a liability in an orderly transaction between market participants.Hierarchy Levels 1, 2 or 3 are terms for the priority of inputs to valuation techniques used to measure fair value. Hierarchy Level 1 inputs are quoted prices inactive markets for identical assets or liabilities. Hierarchy Level 2 inputs are inputs other than quoted prices included within Level 1 that are directly or indirectlyobservable for the asset or liability. Hierarchy Level 3 inputs are inputs that are not observable in the market.
Inventories. Crude oil, products and merchandise inventories are carried at the lower of current market value or cost (generally determined under the last-in, first-out method – LIFO). Inventory costs include expenditures and other charges (including depreciation) directly and indirectly incurred in bringing the inventory toits existing condition and location. Selling expenses and general and administrative expenses are reported as period costs and excluded from inventory cost.Inventories of materials and supplies are valued at cost or less.
Property, Plant and Equipment. Depreciation, depletion and amortization, based on cost less estimated salvage value of the asset, are primarily determinedunder either the unit-of-production method or the straight-line method, which is based on estimated asset service life taking obsolescence into consideration.Maintenance and repairs, including planned major maintenance, are expensed as incurred. Major renewals and improvements are capitalized and the assetsreplaced are retired.
Interest costs incurred to finance expenditures during the construction phase of multiyear projects are capitalized as part of the historical cost of acquiringthe constructed assets. The project construction phase commences with the development of the detailed engineering design and ends when the constructed assetsare ready for their intended use. Capitalized interest costs are included in property, plant and equipment and are depreciated over the service life of the relatedassets.
The Corporation uses the “successful efforts” method to account for its exploration and production activities. Under this method, costs are accumulated ona field-by-field basis with certain exploratory expenditures and exploratory dry holes being expensed as incurred. Costs of productive wells and development dryholes are capitalized and amortized on the unit-of-production method.
The Corporation carries as an asset exploratory well costs when the well has found a sufficient quantity of reserves to justify its completion as a producingwell and where the Corporation is making sufficient progress assessing the reserves and the economic and operating viability of the project. Exploratory wellcosts not meeting these criteria are charged to expense.
Acquisition costs of proved properties are amortized using a unit-of-production method, computed on the basis of total proved oil and gas reserves.Significant unproved properties are assessed for impairment individually and valuation allowances against the capitalized costs are recorded based on theestimated economic chance of success and the length of time that the Corporation expects to hold the properties. Properties that are not individually significantare aggregated by groups and amortized based on development risk and average holding period. The valuation allowances are reviewed at least annually. Otherexploratory expenditures, including geophysical costs, other dry hole costs and annual lease rentals, are expensed as incurred.
Unit-of-production depreciation is applied to property, plant and equipment, including capitalized exploratory drilling and development costs, associatedwith productive depletable extractive properties in the Upstream segment. Unit-of-production rates are based on the amount of proved developed reserves of oil,gas and other minerals that are estimated to be recoverable from existing facilities using current operating methods.
Under the unit-of-production method, oil and gas volumes are considered produced once they have been measured through meters at custody transfer orsales transaction points at the outlet valve on the lease or field storage tank.
Production costs are expensed as incurred. Production involves lifting the oil and gas to the surface and gathering, treating, field processing and fieldstorage of the oil and gas. The production function normally terminates at the outlet valve on the lease or field production storage tank. Production costs are thoseincurred to operate and maintain the Corporation’s wells and related equipment and facilities. They become part of the cost of oil and gas produced. These costs,sometimes referred to as lifting costs, include such items as labor costs to operate the wells and related equipment; repair and maintenance costs on the wells andequipment; materials, supplies and energy costs required to
70
Table of Contents
Index to Financial Statements
operate the wells and related equipment; and administrative expenses related to the production activity.
Gains on sales of proved and unproved properties are only recognized when there is no uncertainty about the recovery of costs applicable to any interestretained or where there is no substantial obligation for future performance by the Corporation. Losses on properties sold are recognized when incurred or whenthe properties are held for sale and the fair value of the properties is less than the carrying value.
Proved oil and gas properties held and used by the Corporation are reviewed for impairment whenever events or changes in circumstances indicate that thecarrying amounts may not be recoverable. Assets are grouped at the lowest level for which there are identifiable cash flows that are largely independent of thecash flows of other groups of assets.
The Corporation estimates the future undiscounted cash flows of the affected properties to judge the recoverability of carrying amounts. Cash flows used inimpairment evaluations are developed using annually updated corporate plan investment evaluation assumptions for crude oil commodity prices and foreigncurrency exchange rates. Annual volumes are based on individual field production profiles, which are also updated annually. Prices for natural gas and otherproducts are based on corporate plan assumptions developed annually by major region and also for investment evaluation purposes. Cash flow estimates forimpairment testing exclude derivative instruments.
Impairment analyses are generally based on proved reserves. Where probable reserves exist, an appropriately risk-adjusted amount of these reserves maybe included in the impairment evaluation. Impairments are measured by the amount the carrying value exceeds the fair value.
Goodwill. Goodwill is the excess of the consideration transferred over the value of net assets recognized and represents the future economic benefits arising fromother assets acquired that could not be individually identified and separately recognized. Goodwill is evaluated for impairment on at least an annual basis.
Asset Retirement Obligations and Environmental Liabilities. The Corporation incurs retirement obligations for certain assets at the time they are installed.The fair values of these obligations are recorded as liabilities on a discounted basis. The costs associated with these liabilities are capitalized as part of the relatedassets and depreciated. Over time, the liabilities are accreted for the change in their present value.
Liabilities for environmental costs are recorded when it is probable that obligations have been incurred and the amounts can be reasonably estimated. Theseliabilities are not reduced by possible recoveries from third parties and projected cash expenditures are not discounted.
Foreign Currency Translation. The Corporation selects the functional reporting currency for its international subsidiaries based on the currency of the primaryeconomic environment in which each subsidiary operates. Downstream and Chemical operations primarily use the local currency. However, the U.S. dollar isused in countries with a history of high inflation (primarily in Latin America) and Singapore, which predominantly sells into the U.S. dollar export market.Upstream operations which are relatively self-contained and integrated within a particular country, such as Canada, the United Kingdom, Norway and continentalEurope, use the local currency. Some Upstream operations, primarily in Asia and Africa, use the U.S. dollar because they predominantly sell crude and naturalgas production into U.S. dollar-denominated markets. For all operations, gains or losses from remeasuring foreign currency transactions into the functionalcurrency are included in income.
Stock-Based Payments. The Corporation awards stock-based compensation to employees in the form of restricted stock and restricted stock units. Compensationexpense is measured by the market price of the restricted shares at the date of grant and is recognized in the income statement over the requisite service period ofeach award. See note 14, Incentive Program, for further details.
2. Accounting Changes
Variable-Interest Entities. Effective January 1, 2010, ExxonMobil adopted the authoritative guidance for variable-interest entities (VIEs). The guidance requiresthe enterprise to qualitatively assess if it is the primary beneficiary of the VIE and, if so, the VIE must be consolidated. The adoption of the guidance did not havea material impact on the Corporation’s financial statements.
71
Table of Contents
Index to Financial Statements
NOTES TO CONSOLIDATED FINANCIAL STATEMENTS 3. Miscellaneous Financial Information
Research and development costs totaled $1,012 million in 2010, $1,050 million in 2009 and $847 million in 2008.
Net income included before-tax aggregate foreign exchange transaction losses of $251 million, and gains of $54 million and $54 million in 2010, 2009 and2008, respectively.
In 2010, 2009 and 2008, net income included gains of $317 million, $207 million and $341 million, respectively, attributable to the combined effects ofLIFO inventory accumulations and draw-downs. The aggregate replacement cost of inventories was estimated to exceed their LIFO carrying values by $21.3billion and $17.1 billion at December 31, 2010, and 2009, respectively.
Crude oil, products and merchandise as of year-end 2010 and 2009 consist of the following: 2010 2009 (billions of dollars) Petroleum products $ 3.5 $ 3.2 Crude oil 3.8 3.2 Chemical products 2.1 2.0 Gas/other 0.5 0.3
Total $ 9.9 $ 8.7
The December 31, 2010, total cash and cash equivalents balance of $8,453 million includes $628 million of restricted funds.
4. Cash Flow Information
The Consolidated Statement of Cash Flows provides information about changes in cash and cash equivalents. Highly liquid investments with maturities of threemonths or less when acquired are classified as cash equivalents.
The “Net (gain) on asset sales” in net cash provided by operating activities on the Consolidated Statement of Cash Flows includes before-tax gains from thesale of some Upstream Gulf of Mexico and other producing properties, the sale of U.S. service stations and other Downstream assets and investments and theformation of a Chemical joint venture in 2010; from the sale of Downstream assets and investments and producing properties in the Upstream in 2009; and fromthe sale of a natural gas transportation business in Germany and other producing properties in the Upstream and Downstream assets and investments in 2008.These gains are reported in “Other income” on the Consolidated Statement of Income. 2010 2009 2008 (millions of dollars) Cash payments for interest $ 703 $ 820 $ 650
Cash payments for income taxes $18,941 $15,427 $33,941
5. Additional Working Capital Information
Dec. 31
2010 Dec. 31
2009 (millions of dollars) Notes and accounts receivable
Trade, less reserves of $152 million and $198 million $25,439 $22,186 Other, less reserves of $34 million and $31 million 6,845 5,459
Total $32,284 $27,645
Notes and loans payable Bank loans $ 532 $ 1,043 Commercial paper 1,346 201 Long-term debt due within one year 345 348 Other 564 884
Total $ 2,787 $ 2,476
Accounts payable and accrued liabilities Trade payables $30,780 $24,236 Payables to equity companies 5,450 4,979 Accrued taxes other than income taxes 6,778 5,921 Other 7,026 6,139
Total $50,034 $41,275
On December 31, 2010, unused credit lines for short-term financing totaled approximately $5.6 billion. Of this total, $2.8 billion support commercial paperprograms under terms negotiated when drawn. The weighted-average interest rate on short-term borrowings outstanding at December 31, 2010, and 2009, was 1.2percent and 3.6 percent, respectively.
72
Table of Contents
Index to Financial Statements
6. Equity Company Information
The summarized financial information below includes amounts related to certain less-than-majority-owned companies and majority-owned subsidiaries whereminority shareholders possess the right to participate in significant management decisions (see note 1). These companies are primarily engaged in crudeproduction, natural gas marketing and refining operations in North America; natural gas production, natural gas distribution and downstream operations inEurope; crude production in Kazakhstan; and liquefied natural gas (LNG) operations in Qatar. Also included are several power generation, refining,petrochemical manufacturing and chemical ventures. The Corporation’s ownership in these ventures is in the form of shares in corporate joint ventures as well asinterests in partnerships. The share of total equity company revenues from sales to ExxonMobil consolidated companies was 18 percent, 19 percent and 21percent in the years 2010, 2009 and 2008, respectively. 2010 2009 2008
Equity Company Financial Summary Total ExxonMobil
Share Total ExxonMobil
Share Total ExxonMobil
Share (millions of dollars) Total revenues $153,020 $ 48,355 $ 112,153 $ 36,570 $148,477 $ 49,999
Income before income taxes $ 48,075 $ 14,735 $ 28,472 $ 9,632 $ 42,588 $ 15,082 Income taxes 13,962 4,058 7,775 2,489 12,020 4,001
Income from equity affiliates $ 34,113 $ 10,677 $ 20,697 $ 7,143 $ 30,568 $ 11,081
A list of significant equity companies as of December 31, 2010, together with the Corporation’s percentage ownership interest, is detailed below:
PercentageOwnership
Interest Upstream Aera Energy LLC 48 BEB Erdgas und Erdoel GmbH 50 Cameroon Oil Transportation Company S.A. 41 Castle Peak Power Company Limited 60 Golden Pass LNG Terminal LLC 18 Nederlandse Aardolie Maatschappij B.V. 50 Qatar Liquefied Gas Company Limited 10 Qatar Liquefied Gas Company Limited 2 24 Ras Laffan Liquefied Natural Gas Company Limited 25 Ras Laffan Liquefied Natural Gas Company Limited II 31 Ras Laffan Liquefied Natural Gas Company Limited (3) 30 South Hook LNG Terminal Company Limited 24 Tengizchevroil, LLP 25 Terminale GNL Adriatico S.r.l. 69
Downstream Chalmette Refining, LLC 50 Fujian Refining & Petrochemical Co. Ltd. 25 Saudi Aramco Mobil Refinery Company Ltd. 50
Chemical Al-Jubail Petrochemical Company 50 Infineum Holdings B.V. 50 Saudi Yanbu Petrochemical Co. 50 Toray Tonen Specialty Separator Godo Kaisha 50
73
Table of Contents
Index to Financial Statements
NOTES TO CONSOLIDATED FINANCIAL STATEMENTS 7. Investments, Advances and Long-Term Receivables
Dec 312010
Dec 312009
(millions of dollars) Companies carried at equity in underlying assets
Investments $17,429 $15,742 Advances 9,286 8,669
$26,715 $24,411 Companies carried at cost or less and stock investments carried at fair value 1,557 1,577
$28,272 $25,988 Long-term receivables and miscellaneous investments at cost or less, net of reserves of $292 million and $368 million 7,066 5,677
Total $35,338 $31,665
8. Property, Plant and Equipment and Asset Retirement Obligations Dec. 31, 2010 Dec. 31, 2009 Property, Plant and Equipment Cost Net Cost Net (millions of dollars) Upstream $264,136 $148,152 $198,036 $ 88,319 Downstream 68,652 30,095 68,092 30,499 Chemical 29,524 14,255 28,464 13,511 Other 11,626 7,046 11,314 6,787
Total $373,938 $199,548 $305,906 $139,116
In the Upstream segment, depreciation is generally on a unit-of production basis, so depreciable life will vary by field. In the Downstream segment, investmentsin refinery and lubes basestock manufacturing facilities are generally depreciated on a straight-line basis over a 25-year life and service station buildings andfixed improvements over a 20-year life. In the Chemical segment, investments in process equipment are generally depreciated on a straight-line basis over a 20-year life.
Accumulated depreciation and depletion totaled $174,390 million at the end of 2010 and $166,790 million at the end of 2009. Interest capitalized in 2010,2009 and 2008 was $532 million, $425 million and $510 million, respectively.
Asset Retirement Obligations
The Corporation incurs retirement obligations for its upstream assets. The fair values of these obligations are recorded as liabilities on a discounted basis, which istypically at the time the assets are installed. The Corporation uses estimates, assumptions and judgments regarding such factors as the existence of a legalobligation for an ARO; technical assessments of the assets; estimated amounts and timing of settlements; the credit-adjusted risk-free rate to be used; andinflation rates. AROs incurred in the current period were Level 3 (unobservable inputs) fair value measurements. The costs associated with these liabilities arecapitalized as part of the related assets and depreciated as the reserves are produced. Over time, the liabilities are accreted for the change in their present value.Asset retirement obligations for downstream and chemical facilities generally become firm at the time the facilities are permanently shut down and dismantled.These obligations may include the costs of asset disposal and additional soil remediation. However, these sites have indeterminate lives based on plans forcontinued operations and as such, the fair value of the conditional legal obligations cannot be measured, since it is impossible to estimate the future settlementdates of such obligations.
The following table summarizes the activity in the liability for asset retirement obligations: 2010 2009 (millions of dollars) Beginning balance $8,473 $5,352
Accretion expense and other provisions 563 372 Reduction due to property sales (183) (18) Payments made (638) (448) Liabilities incurred 1,094 156 Foreign currency translation (45) 535 Revisions 350 2,524
Ending balance $9,614 $8,473
74
Table of Contents
Index to Financial Statements
9. Accounting for Suspended Exploratory Well Costs
The Corporation continues capitalization of exploratory well costs beyond one year after the well is completed if (a) the well found a sufficient quantity ofreserves to justify its completion as a producing well and (b) sufficient progress is being made in assessing the reserves and the economic and operating viabilityof the project.
The following two tables provide details of the changes in the balance of suspended exploratory well costs as well as an aging summary of those costs.
Change in capitalized suspended exploratory well costs: 2010 2009 2008 (millions of dollars) Balance beginning at January 1 $2,005 $1,585 $1,291
Additions pending the determination of proved reserves 1,103 624 448 Charged to expense (104) (51) — Reclassifications to wells, facilities and equipment based on the determination of proved reserves (136) (200) (101) Other 25 47 (53)
Ending balance $2,893 $2,005 $1,585
Ending balance attributed to equity companies included above $ — $ 9 $ 10
Period end capitalized suspended exploratory well costs: 2010 2009 2008 (millions of dollars) Capitalized for a period of one year or less $1,103 $ 624 $ 448
Capitalized for a period of between one and five years 1,294 924 636 Capitalized for a period of between five and ten years 278 220 225 Capitalized for a period of greater than ten years 218 237 276
Capitalized for a period greater than one year – subtotal $1,790 $1,381 $1,137
Total $2,893 $2,005 $1,585
Exploration activity often involves drilling multiple wells, over a number of years, to fully evaluate a project The table below provides a numerical breakdown ofthe number of projects with suspended exploratory well costs which had their first capitalized well drilled in the preceding 12 months and those that have hadexploratory well costs capitalized for a period greater than 12 months. 2010 2009 2008 Number of projects with first capitalized well drilled in the preceding 12 months 9 18 12 Number of projects that have exploratory well costs capitalized for a period of greater than 12 months 59 57 50
Total 68 75 62
75
Table of Contents
Index to Financial Statements
NOTES TO CONSOLIDATED FINANCIAL STATEMENTS Of the 59 projects that have exploratory well costs capitalized for a period greater than 12 months as of December 31, 2010, 25 projects have drilling in thepreceding 12 months or exploratory activity planned in the next two years, while the remaining 34 projects are those with completed exploratory activityprogressing toward development. The table below provides additional detail for those 34 projects, which total $692 million.
Country/Project
Dec. 31,2010
Years WellsDrilled Comment
(millions of dollars) Angola
- Perpetua-Zina-Acacia
$ 15
2008 - 2009
Oil field near Pazflor development, awaiting capacity in existing/plannedinfrastructure.
Australia - East Pilchard
10
2001
Gas field near Kipper/Tuna development, awaiting capacity in existing/plannedinfrastructure.
Indonesia - Natuna
118
1981 - 1983
Development activity under way, while continuing discussions with thegovernment on contract terms pursuant to recently executed Heads ofAgreement.
Kazakhstan - Kairan
53
2004 - 2007
Declarations involving field commerciality filed with Kazakhstan government in2008; progressing commercialization and field development studies.
Nigeria - Bolia
15
2002 - 2006
Evaluating development plan, while continuing discussions with the governmentregarding regional hub strategy.
- Bonga North 34 2004 - 2009 Pursuing alignment with operator and government regarding development plan.- Bosi
79
2002 - 2006
Development activity under way while continuing discussions with thegovernment regarding development plan.
- Other (5 projects)
16
2001 - 2002
Pursuing development of several additional offshore satellite discoveries whichwill tie back to existing/planned production facilities.
Norway - Gamma 20 2008 - 2009 Evaluating development plan for tieback to existing production facilities.- H-North 15 2007 Discovery near existing facilities in Fram area; evaluating development options.- Lavrans
23
1995 - 1999
Development awaiting capacity in existing Kristin production facility;evaluating development concepts for phased ullage scenarios.
- Noatun 19 2008 Evaluating development plan for tieback to existing production facilities.- Nyk High 20 2008 Evaluating field development alternatives.- Other (8 projects)
34
1992 - 2009
Evaluating development plans, including potential for tieback to existingproduction facilities.
Papua New Guinea - Juha 28 2007 Working on development plans to tie into planned LNG facilities.
United Kingdom - Fram 55 2009 Progressing development and commercialization plans.- Other (3 projects) 21 2001 - 2008 Projects primarily awaiting capacity in existing or planned infrastructure.
United States - Julia Unit
78
2007 - 2008
Julia Unit owners are progressing development plans and have agreed to sharefunding on facilities at the Chevron-operated Jack-Saint Malo platform.Suspension of Production for the Julia Unit is under review by the Bureau ofOcean Energy Management, Regulation and Enforcement.
- Tip Top 31 2009 Evaluating development concept and requisite facility upgrades.Other
- Various (2 projects) 8 1979 - 1995 Projects primarily awaiting capacity in existing or planned infrastructure.Total 2010 (34 projects) $ 692
76
Table of Contents
Index to Financial Statements
10. Leased Facilities
At December 31, 2010, the Corporation and its consolidated subsidiaries held noncancelable operating charters and leases covering drilling equipment, tankers,service stations and other properties with minimum undiscounted lease commitments totaling $7,776 million as indicated in the table. Estimated related rentalincome from noncancelable subleases is $62 million.
Lease PaymentsUnder Minimum
Commitments
RelatedSublease Rental
Income (millions of dollars) 2011 $ 2,095 $ 8 2012 1,570 8 2013 1,061 7 2014 731 6 2015 581 6 2016 and beyond 1,738 27
Total $ 7,776 $ 62
Net rental cost under both cancelable and noncancelable operating leases incurred during 2010, 2009 and 2008 were as follows: 2010 2009 2008 (millions of dollars) Rental cost $3,762 $4,426 $ 4,115 Less sublease rental income 90 98 123
Net rental cost $3,672 $4,328 $3,992
11. Earnings Per Share 2010 2009 2008 Earnings per common share
Net income attributable to ExxonMobil (millions of dollars) $30,460 $19,280 $45,220
Weighted average number of common shares outstanding (millions of shares) 4,885 4,832 5,194
Earnings per common share (dollars) $ 6.24 $ 3.99 $ 8.70
Earnings per common share – assuming dilution
Net income attributable to ExxonMobil (millions of dollars) $30,460 $19,280 $45,220
Weighted average number of common shares outstanding (millions of shares) 4,885 4,832 5,194 Effect of employee stock-based awards 12 16 27
Weighted average number of common shares outstanding – assuming dilution 4,897 4,848 5,221
Earnings per common share – assuming dilution (dollars) $ 6.22 $ 3.98 $ 8.66
Dividends paid per common share (dollars) $ 1.74 $ 1.66 $ 1.55
77
Table of Contents
Index to Financial Statements
NOTES TO CONSOLIDATED FINANCIAL STATEMENTS 12. Financial Instruments and Derivatives
Financial Instruments. The fair value of financial instruments is determined by reference to observable market data and other valuation techniques asappropriate. The only category of financial instruments where the difference between fair value and recorded book value is notable is long-term debt. Theestimated fair value of total long-term debt, including capitalized lease obligations, was $12.8 billion and $7.7 billion at December 31, 2010, and 2009,respectively, as compared to recorded book values of $12.2 billion and $7.1 billion at December 31, 2010, and 2009, respectively. The fair value hierarchy forlong-term debt is primarily Level 1 (quoted prices for identical assets in active markets).
Derivative Instruments. The Corporation’s size, strong capital structure, geographic diversity and the complementary nature of the Upstream, Downstream andChemical businesses reduce the Corporation’s enterprise-wide risk from changes in interest rates, currency rates and commodity prices. As a result, theCorporation makes limited use of derivatives to mitigate the impact of such changes. The Corporation does not engage in speculative derivative activities orderivative trading activities nor does it use derivatives with leveraged features.
When the Corporation does enter into derivative transactions, it is to offset exposures associated with interest rates, foreign currency exchange rates andhydrocarbon prices that arise from existing assets, liabilities and forecasted transactions. For derivatives designated as cash flow hedges, the Corporation’sactivity is intended to manage the price risk posed by physical transactions.
The estimated fair value of derivative instruments outstanding and recorded on the balance sheet was a net asset of $172 million at year-end 2010 and a netliability of $5 million at year-end 2009. This is the amount that the Corporation would have received from, or paid to, third parties if these derivatives had beensettled in the open market. Assets and liabilities associated with derivatives are predominantly recorded either in “Other current assets” or “Accounts payable andaccrued liabilities.” The year-end 2010 net asset balance includes the Corporation’s outstanding cash flow hedge position, acquired as a result of the XTO merger,of $219 million. As the current cash flow hedge positions settle, these programs will be discontinued.
The Corporation’s fair value measurement of its derivative instruments uses primarily Level 2 inputs (derivatives that are determined by either marketprices on an active market for similar assets or by prices quoted by a broker or other market-corroborated prices).
The Corporation recognized a before-tax gain or (loss) related to derivative instruments of $221 million, $(73) million and $154 million during 2010, 2009and 2008, respectively. Income statement effects associated with derivatives are recorded either in “Sales and other operating revenue” or “Crude oil and productpurchases.” Of the amount stated above for 2010, cash flow hedges resulted in a before-tax gain of $218 million. The ineffective portion of derivatives designatedas hedges is de minimis.
The principal natural gas futures contracts and swap agreements acquired as part of the XTO merger that are in place as of December 31, 2010, will expireby the end of 2011. The associated volume of natural gas is 250 mcfd at a weighted average NYMEX price of $7.02 per thousand cubic feet. These derivativecontracts qualify for cash flow hedge accounting. The Corporation will receive the cash flow related to these derivative contracts at the price indicated above.However, the amount of the income statement gain or loss realized from these contracts will be limited to the change in fair value of the derivative instrumentsfrom the acquisition date of XTO.
The Corporation believes that there are no material market or credit risks to the Corporation’s financial position, results of operations or liquidity as a resultof the derivative activities described above. The fair value of derivatives outstanding at year-end 2010 and the gain recognized during the year are immaterial.
78
Table of Contents
Index to Financial Statements
13. Long-term Debt
At December 31, 2010, long-term debt consisted of $11,610 million due in U.S. dollars and $617 million representing the U.S. dollar equivalent at year-endexchange rates of amounts payable in foreign currencies. These amounts exclude that portion of long-term debt, totaling $345 million, which matures within oneyear and is included in current liabilities. The amounts of long-term debt maturing, together with sinking fund payments required, in each of the four years afterDecember 31, 2011, in millions of dollars, are: 2012 – $3,222, 2013 – $1,019, 2014 – $622 and 2015 – $601. At December 31, 2010, the Corporation's unusedlong-term credit lines were not material.
Summarized long-term debt at year-end 2010 and 2009 are shown in the table below: 2010 2009 (millions of dollars) SeaRiver Maritime Financial Holdings, Inc. Guaranteed debt securities due 2011 $ — $ 13 Guaranteed deferred interest debentures due 2012
– Face value net of unamortized discount plus accrued interest 2,389 2,144 XTO Energy Inc. (premium in millions of dollars) 7.500% senior note due 2012 includes premium of $15 199 — 5.900% senior note due 2012 includes premium of $16 233 — 6.250% senior note due 2013 includes premium of $18 193 — 4.625% senior note due 2013 includes premium of $9 149 — 5.750% senior note due 2013 includes premium of $37 359 — 4.900% senior note due 2014 includes premium of $19 267 — 5.000% senior note due 2015 includes premium of $13 142 — 5.300% senior note due 2015 includes premium of $28 262 — 5.650% senior note due 2016 includes premium of $27 227 — 6.250% senior note due 2017 includes premium of $80 534 — 5.500% senior note due 2018 includes premium of $49 420 — 6.500% senior note due 2018 includes premium of $86 524 — 6.100% senior note due 2036 includes premium of $29 204 — 6.750% senior note due 2037 includes premium of $69 329 — 6.375% senior note due 2038 includes premium of $46 258 —
Mobil Services (Bahamas) Ltd. Variable note due 2035 972 972 Variable note due 2034 311 311
Mobil Producing Nigeria Unlimited Variable notes due 2012-2017 415 621
Esso (Thailand) Public Company Ltd. Variable notes due 2012-2017 522 165
Mobil Corporation 8.625% debentures due 2021 248 248
Industrial revenue bonds due 2012-2040 2,247 1,685 Other U.S. dollar obligations 454 536 Other foreign currency obligations 65 66 Capitalized lease obligations 304 368
Total long-term debt $12,227 $7,129
(1) Additional information is provided for this subsidiary on the following pages.(2) Average effective interest rate of 1.6% in 2009.(3) Average effective interest rate of 0.3% in 2010 and 0.3% in 2009.(4) Average effective interest rate of 0.4% in 2010 and 0.9% in 2009.(5) Average effective interest rate of 4.6% in 2010 and 5.4% in 2009.(6) Average effective interest rate of 1.7% in 2010 and 2.2% in 2009.(7) Average effective interest rate of 0.2% in 2010 and 0.2% in 2009.(8) Average effective interest rate of 4.7% in 2010 and 5.0% in 2009.(9) Average imputed interest rate of 8.1% in 2010 and 8.8% in 2009.
79
(1)
(2)
(3)
(4)
(5)
(6)
(7)
(8)
(9)
Table of Contents
Index to Financial Statements
NOTES TO CONSOLIDATED FINANCIAL STATEMENTS
Condensed consolidating financial information related to guaranteed securities issued by subsidiaries Exxon Mobil Corporation has fully and unconditionally guaranteed the deferred interest debentures due 2012 ($2,389 million long-term debt at December 31,2010) and the debt securities due 2011 ($13 million short-term) of SeaRiver Maritime Financial Holdings, Inc.
SeaRiver Maritime Financial Holdings, Inc. is a 100-percent-owned subsidiary of Exxon Mobil Corporation.
The following condensed consolidating financial information is provided for Exxon Mobil Corporation, as guarantor, and for SeaRiver Maritime FinancialHoldings, Inc., as issuer, as an alternative to providing separate financial statements for the issuer. The accounts of Exxon Mobil Corporation and SeaRiverMaritime Financial Holdings, Inc. are presented utilizing the equity method of accounting for investments in subsidiaries.
Exxon Mobil
CorporationParent
Guarantor
SeaRiverMaritimeFinancial
Holdings, Inc. All Other
Subsidiaries
Consolidatingand
EliminatingAdjustments Consolidated
(millions of dollars) Condensed consolidated statement of income for 12 months ended December 31, 2010 Revenues and other income
Sales and other operating revenue, including sales-based taxes $ 15,382 $ — $354,743 $ — $ 370,125 Income from equity affiliates 28,401 (2) 10,589 (28,311) 10,677 Other income 790 — 1,629 — 2,419 Intercompany revenue 39,433 4 332,483 (371,920) —
Total revenues and other income 84,006 2 699,444 (400,231) 383,221
Costs and other deductions Crude oil and product purchases 40,788 — 518,961 (361,790) 197,959 Production and manufacturing expenses 7,627 — 33,400 (5,235) 35,792 Selling, general and administrative expenses 2,871 — 12,482 (670) 14,683 Depreciation and depletion 1,761 — 12,999 — 14,760 Exploration expenses, including dry holes 251 — 1,893 — 2,144 Interest expense 217 246 4,035 (4,239) 259 Sales-based taxes — — 28,547 — 28,547 Other taxes and duties 29 — 36,089 — 36,118
Total costs and other deductions 53,544 246 648,406 (371,934) 330,262
Income before income taxes 30,462 (244) 51,038 (28,297) 52,959 Income taxes 2 (90) 21,649 — 21,561
Net income including noncontrolling interests 30,460 (154) 29,389 (28,297) 31,398 Net income attributable to noncontrolling interests — — 938 — 938
Net income attributable to ExxonMobil $ 30,460 $ (154) $ 28,451 $ (28,297) $ 30,460
80
Table of Contents
Index to Financial Statements
Exxon MobilCorporation
ParentGuarantor
SeaRiverMaritimeFinancial
Holdings, Inc. All Other
Subsidiaries
Consolidatingand
EliminatingAdjustments Consolidated
(millions of dollars) Condensed consolidated statement of income for 12 months ended December 31, 2009 Revenues and other income
Sales and other operating revenue, including sales-based taxes $ 11,352 $ — $290,148 $ — $ 301,500 Income from equity affiliates 19,852 7 7,060 (19,776) 7,143 Other income 813 — 1,130 — 1,943 Intercompany revenue 30,889 4 271,663 (302,556) —
Total revenues and other income 62,906 11 570,001 (322,332) 310,586
Costs and other deductions Crude oil and product purchases 31,419 — 411,689 (290,302) 152,806 Production and manufacturing expenses 7,811 — 30,805 (5,589) 33,027 Selling, general and administrative expenses 2,574 — 12,852 (691) 14,735 Depreciation and depletion 1,571 — 10,346 — 11,917 Exploration expenses, including dry holes 230 — 1,791 — 2,021 Interest expense 1,200 222 5,126 (6,000) 548 Sales-based taxes — — 25,936 — 25,936 Other taxes and duties (29) — 34,848 — 34,819
Total costs and other deductions 44,776 222 533,393 (302,582) 275,809
Income before income taxes 18,130 (211) 36,608 (19,750) 34,777 Income taxes (1,150) (81) 16,350 — 15,119
Net income including noncontrolling interests 19,280 (130) 20,258 (19,750) 19,658 Net income attributable to noncontrolling interests — — 378 — 378
Net income attributable to ExxonMobil $ 19,280 $ (130) $ 19,880 $ (19,750) $ 19,280
Condensed consolidated statement of income for 12 months ended December 31, 2008 Revenues and other income
Sales and other operating revenue, including sales-based taxes $ 17,481 $ — $442,098 $ — $ 459,579 Income from equity affiliates 45,664 9 11,055 (45,647) 11,081 Other income 302 — 6,397 — 6,699 Intercompany revenue 48,414 45 442,305 (490,764) —
Total revenues and other income 111,861 54 901,855 (536,411) 477,359
Costs and other deductions Crude oil and product purchases 48,346 — 669,107 (467,999) 249,454 Production and manufacturing expenses 8,327 — 35,298 (5,720) 37,905 Selling, general and administrative expenses 3,349 — 13,364 (840) 15,873 Depreciation and depletion 1,552 — 10,827 — 12,379 Exploration expenses, including dry holes 192 — 1,259 — 1,451 Interest expense 3,859 207 13,143 (16,536) 673 Sales-based taxes — — 34,508 — 34,508 Other taxes and duties 67 — 41,652 — 41,719
Total costs and other deductions 65,692 207 819,158 (491,095) 393,962
Income before income taxes 46,169 (153) 82,697 (45,316) 83,397 Income taxes 949 (56) 35,637 — 36,530
Net income including noncontrolling interests 45,220 (97) 47,060 (45,316) 46,867 Net income attributable to noncontrolling interests — — 1,647 — 1,647
Net income attributable to ExxonMobil $ 45,220 $ (97) $ 45,413 $ (45,316) $ 45,220
81
Table of Contents
Index to Financial Statements
NOTES TO CONSOLIDATED FINANCIAL STATEMENTS
Condensed consolidating financial information related to guaranteed securities issued by subsidiaries
Exxon MobilCorporation
ParentGuarantor
SeaRiverMaritimeFinancial
Holdings, Inc. All Other
Subsidiaries
Consolidatingand
EliminatingAdjustments Consolidated
(millions of dollars) Condensed consolidated balance sheet for year ended December 31, 2010 Cash and cash equivalents $ 309 $ — $ 7,516 $ — $ 7,825 Cash and cash equivalents – restricted 371 — 257 — 628 Marketable securities — — 2 — 2 Notes and accounts receivable – net 2,104 — 30,346 (166) 32,284 Inventories 1,457 — 11,519 — 12,976 Other current assets 239 — 5,030 — 5,269
Total current assets 4,480 — 54,670 (166) 58,984 Investments, advances and long-term receivables 254,781 446 454,489 (674,378) 35,338 Property, plant and equipment – net 18,830 — 180,718 — 199,548 Other long-term assets 224 12 8,404 — 8,640 Intercompany receivables 18,186 2,457 528,405 (549,048) —
Total assets $ 296,501 $ 2,915 $1,226,686 $(1,223,592) $ 302,510
Cash flows from financing activities Additions to short- and long-term debt — — 1,741 — 1,741 Reductions in short- and long-term debt (3) (13) (8,644) — (8,660) Additions/(reductions) in debt with three months or less maturity 997 — (288) — 709 Cash dividends (8,498) — (5,697) 5,697 (8,498) Common stock acquired (13,093) — — — (13,093) Net intercompany financing activity — — 202 (202) — All other financing, net 1,164 150 (286) (151) 877
Cash flows from financing activities Additions to short- and long-term debt — — 1,561 — 1,561 Reductions in short- and long-term debt (3) (13) (1,627) — (1,643) Additions/(reductions) in debt with three months or less maturity 39 — (110) — (71) Cash dividends (8,023) — (27,082) 27,082 (8,023) Common stock acquired (19,703) — — — (19,703) Net intercompany financing activity — — 168 (168) — All other financing, net 988 150 (392) (150) 596
Cash flows from financing activities Additions to short- and long-term debt — — 1,146 — 1,146 Reductions in short- and long-term debt (4) (13) (1,799) — (1,816) Additions/(reductions) in debt with three months or less maturity — — 143 — 143 Cash dividends (8,058) — (42,644) 42,644 (8,058) Common stock acquired (35,734) — — — (35,734) Net intercompany financing activity — — 81 (81) — All other financing, net 1,085 100 (793) (100) 292
Effects of exchange rate changes on cash — — (2,743) — (2,743)
Increase/(decrease) in cash and cash equivalents $ 2,618 $ — $ (5,162) $ — $ (2,544)
14. Incentive Program
The 2003 Incentive Program provides for grants of stock options, stock appreciation rights (SARs), restricted stock and other forms of award. Awards may begranted to eligible employees of the Corporation and those affiliates at least 50 percent owned. Outstanding awards are subject to certain forfeiture provisionscontained in the program or award instrument. The maximum number of shares of stock that may be issued under the 2003 Incentive Program is 220 million.Awards that are forfeited or expire, or are settled in cash, do not count against this maximum limit. The 2003 Incentive Program does not have a specified term.New awards may be made until the available shares are depleted, unless the Board terminates the plan early. At the end of 2010, remaining shares available foraward under the 2003 Incentive Program were 141,939 thousand.
As under earlier programs, options and SARs may be granted at prices not less than 100 percent of market value on the date of grant and have a maximumlife of 10 years. Most of the options and SARs normally first become exercisable one year following the date of grant. All remaining stock options and SARsoutstanding were either granted prior to 2002 or were converted XTO stock options as a result of the XTO merger.
Under the terms of the XTO merger agreement, outstanding XTO stock-based awards were converted into ExxonMobil stock-based awards based on themerger exchange ratio. The converted XTO awards, granted under XTO’s 1998 or 2004 Stock Incentive Plans, include restricted stock awards, stock options andperformance stock awards. The grant date for the converted XTO awards is considered to be the effective date of the merger for purposes of calculating fair value.Compensation cost for the converted XTO awards is recognized in income over the requisite service period. The maximum term of the XTO awards is ten yearsunder the 1998 plan and seven years under the 2004 plan. No additional awards will be issued under either XTO plan. In connection with the closing of themerger, the Corporation also made new grants of restricted stock under the Corporation’s 2003 Incentive Program to certain current or former XTO employees asdescribed in more detail below.
Restricted Stock. Excluding XTO merger-related grants, long-term incentive awards totaling 10,648 thousand of restricted (nonvested) common stock andrestricted (nonvested) common stock units were granted in 2010. Awards totaling 10,133 thousand and 10,116 thousand of restricted (nonvested) common stockand restricted (nonvested) common stock units were granted in 2009 and 2008, respectively. These shares are issued to employees from treasury stock. The totalcompensation expense is recognized over the requisite service period. The units that are settled in cash are recorded as liabilities and their changes in fair valueare recognized over the vesting period. During the applicable restricted periods, the shares may not be sold or transferred and are subject to forfeiture. Themajority of the awards have graded vesting periods, with 50 percent of the shares in each award vesting after three years and the remaining 50 percent vestingafter seven years. A small
84
Table of Contents
Index to Financial Statements
number of awards granted to certain senior executives have vesting periods of five years for 50 percent of the award and of 10 years or retirement, whicheveroccurs later, for the remaining 50 percent of the award.
Additionally, long-term incentive awards totaling 4,206 thousand of restricted (nonvested) common stock were granted in 2010 in association with theXTO merger. This included the granting of 1,423 thousand of restricted common stock awards under the Corporation’s 2003 Incentive Program and2,783 thousand of converted XTO restricted common stock awards. The majority of the converted XTO awards vest in three installments over a period of threeyears or three and a half years after the initial grant. The remainder of converted XTO awards that were granted to certain senior XTO employees will vest on thefirst anniversary of the effective date of the merger. Awards granted to certain former senior executives of XTO in connection with consulting agreementsnegotiated as part of the merger have vesting periods of one year for 50 percent of the award and of two or three years for the remaining 50 percent of the award,depending on the actual term of the consulting engagements.
The Corporation has purchased shares in the open market and through negotiated transactions to offset shares issued in conjunction with benefit plans andprograms. Purchases may be discontinued at any time without prior notice.
In 2002, the Corporation began issuing restricted stock as stock-based compensation in lieu of stock options. Compensation expense for these awards isbased on the price of the stock at the date of grant and has been recognized in income over the requisite service period. Prior to 2002, the Corporation issued stockoptions as stock-based compensation and since these awards vested prior to the effective date of current authoritative guidance, they continue to be accounted forunder the prior prescribed method. Under this method, compensation expense for awards granted in the form of stock options is measured at the intrinsic value ofthe options (the difference between the market price of the stock and the exercise price of the options) on the date of grant. Since these two prices were the sameon the date of grant, no compensation expense has been recognized in income for these awards.
The following tables summarize information about restricted stock and restricted stock units for the year ended December 31, 2010. 2010
Restricted stock and units outstanding Shares
Weighted AverageGrant-Date
Fair Value per Share (thousands) Issued and outstanding at January 1 43,503 $67.52 2009 award issued in 2010 10,132 $75.40 Merger-related granted and converted XTO awards 4,206 $59.31 Vested (10,377) $61.72 Forfeited (158) $67.91
Issued and outstanding at December 31 47,306 $69.74
Value of restricted stock and units 2010 2009 2008 Grant price $66.07 $75.40 $78.24 Value at date of grant: (millions of dollars) Restricted stock and units settled in stock $ 672 $ 711 $ 735 Merger-related granted and converted XTO awards 250 — — Units settled in cash 60 53 56
Total value $ 982 $ 764 $ 791
As of December 31, 2010, there was $2,133 million of unrecognized compensation cost related to the nonvested restricted awards. This cost is expected to berecognized over a weighted-average period of 4.3 years. The compensation cost charged against income for the restricted stock and restricted units was $801million, $723 million and $648 million for 2010, 2009 and 2008, respectively. The income tax benefit recognized in income related to this compensation expensewas $81 million, $76 million and $75 million for the same periods, respectively. The fair value of shares and units vested in 2010, 2009 and 2008 was $718million, $763 million and $438 million, respectively. Cash payments of $42 million, $41 million and $25 million for vested restricted stock units settled in cashwere made in 2010, 2009 and 2008, respectively.
85
Table of Contents
Index to Financial Statements
NOTES TO CONSOLIDATED FINANCIAL STATEMENTS Performance Stock. The Corporation granted 157 thousand of converted XTO performance stock awards with a grant-date fair value of $5 million as a result ofthe merger. Compensation cost for the performance stock awards is based on the estimated grant-date fair value. Vesting of XTO performance stock awardsdepended on the achievement of certain XTO stock thresholds. Upon conversion of these awards to ExxonMobil performance stock awards in connection with themerger, the performance thresholds were adjusted to equivalent market price thresholds for common stock of the Corporation. The performance stock awards aresubject to forfeiture if the performance criteria are not met within the maximum term. Otherwise, holders of performance stock awards generally have all voting,dividend and other rights of other common stockholders.
The following table provides information about these converted performance stock awards as of December 31, 2010. Dec. 31, 2010 Performance stock awards Shares (thousands) Vesting Price: $108.49 38 $119.76 38
During 2010, 80 thousand performance share awards vested.
Unrecognized compensation cost was $1 million at December 31, 2010. Compensation expense recognized in 2010 was $3 million. Stock Options. The Corporation granted 12,393 thousand of converted XTO stock options with a grant-date fair value of $182 million as a result of the XTOmerger. The grant included 893 thousand of unvested options. The converted XTO stock option awards are accounted for under current authoritative guidance,which requires the measurement and recognition of compensation expense based on estimated grant-date fair values. Upon conversion of these stock options toExxonMobil stock options in connection with the merger, the performance thresholds were adjusted to equivalent market price thresholds for common stock ofthe Corporation. These stock options generally vest and become exercisable ratably over a three-year period, and may include a provision for accelerated vestingwhen the common stock price reaches specified levels. Some stock option tranches vest only when the common stock price reaches specified levels. As ofDecember 31, 2010, unvested stock options of 574 thousand included 130 thousand options that vest ratably over three years and 444 thousand options that vestat stock prices ranging from $76.08 to $126.80.
Changes that occurred in the Corporation’s stock options in 2010 are summarized below (shares in thousands): 2010
Stock options Shares Avg. Exercise
Price Weighted Average
Remaining Contractual Term Outstanding at January 1 41,473 $ 40.92 Merger-related converted XTO awards 12,393 $ 55.15 Exercised (24,305) $ 43.62 Forfeited (52) $ 45.91
Outstanding at December 31 29,509 $ 44.65 2.0 Years
Exercisable at December 31 28,935 $ 43.94 1.9 Years
Unrecognized compensation cost related to the nonvested merger-related converted XTO stock options was $1 million as of December 31, 2010. Compensationexpense recognized in 2010 was $2 million. No compensation expense was recognized for stock options in 2009 and 2008, as all remaining outstanding stockoptions were granted prior to 2002 and were fully vested. Cash received from stock option exercises was $1,043 million, $752 million and $753 million for 2010,2009 and 2008, respectively. The cash tax benefit realized for the options exercised was $89 million, $164 million and $273 million for 2010, 2009 and 2008,respectively. The aggregate intrinsic value of stock options exercised in 2010, 2009 and 2008 was $539 million, $563 million and $894 million, respectively. Theintrinsic value for the balance of outstanding stock options at December 31, 2010, was $868 million. The intrinsic value for the balance of exercisable stockoptions at December 31, 2010, was $865 million.
86
Table of Contents
Index to Financial Statements
Estimated Fair Value of XTO Merger-Related Grants. For restricted stock grants, the fair value was equal to the price of the common stock on the grant date.For the converted XTO stock options and performance stock, the Corporation used a Monte Carlo simulation model to estimate fair value. The Monte Carlosimulation model requires inputs for the risk-free interest rate, dividend yield, volatility, contract term, target vesting price, post-vesting turnover rate and sub-optimal exercise factor. Expected life, derived vesting period and fair value are outputs of this model.
The risk-free interest rate is based on the constant maturity nominal rates of U.S. Treasury securities with remaining lives throughout the contract term onthe day of the grant. The dividend yield is the expected common stock annual dividend yield over the expected life of the option or performance stock, expressedas a percentage of the stock price on the date of grant. The volatility factors are based on a combination of both the historical volatilities of ExxonMobil’s stockand the implied volatility of traded options on ExxonMobil common stock. Estimates of fair value are not intended to predict actual future events or the valueultimately realized by certain employees who receive stock option grants, and subsequent events are not indicative of the reasonableness of the original fair valueestimates.
The total estimated fair value calculated at the time of the merger for the converted XTO stock-based awards was $352 million.
Fair values were determined using the following assumptions: Weighted average expected term 2.5 years Range of risk-free interest rates 0.1% - 2.6%
Weighted average risk-free interest rates 0.9% Dividend yield 3.0%
Weighted average volatility 28.5% Range of volatility 22.5% - 33.6%
15. Litigation and Other Contingencies
Litigation. A variety of claims have been made against ExxonMobil and certain of its consolidated subsidiaries in a number of pending lawsuits. Managementhas regular litigation reviews, including updates from corporate and outside counsel, to assess the need for accounting recognition or disclosure of thesecontingencies. The Corporation accrues an undiscounted liability for those contingencies where the incurrence of a loss is probable and the amount can bereasonably estimated. If a range of amounts can be reasonably estimated and no amount within the range is a better estimate than any other amount, then theminimum of the range is accrued. The Corporation does not record liabilities when the likelihood that the liability has been incurred is probable but the amountcannot be reasonably estimated or when the liability is believed to be only reasonably possible or remote. For contingencies where an unfavorable outcome isreasonably possible and which are significant, the Corporation discloses the nature of the contingency and, where feasible, an estimate of the possible loss.ExxonMobil will continue to defend itself vigorously in these matters. Based on a consideration of all relevant facts and circumstances, the Corporation does notbelieve the ultimate outcome of any currently pending lawsuit against ExxonMobil will have a materially adverse effect upon the Corporation’s operations,financial condition, or financial statements taken as a whole.
87
Table of Contents
Index to Financial Statements
NOTES TO CONSOLIDATED FINANCIAL STATEMENTS Other Contingencies. The Corporation and certain of its consolidated subsidiaries were contingently liable at December 31, 2010, for $8,771 million, primarilyrelating to guarantees for notes, loans and performance under contracts. Included in this amount were guarantees by consolidated affiliates of $5,290 million,representing ExxonMobil’s share of obligations of certain equity companies. Dec. 31, 2010
EquityCompany
Obligations
OtherThird-PartyObligations Total
(millions of dollars)
Guarantees $ 5,290 $ 3,481 $8,771
Additionally, the Corporation and its affiliates have numerous long-term sales and purchase commitments in their various business activities, all of whichare expected to be fulfilled with no adverse consequences material to the Corporation’s operations or financial condition. Unconditional purchase obligations asdefined by accounting standards are those long-term commitments that are noncancelable or cancelable only under certain conditions, and that third parties haveused to secure financing for the facilities that will provide the contracted goods or services. Payments Due by Period
(1) Undiscounted obligations of $1,522 million mainly pertain to pipeline throughput agreements and include $996 million of obligations to equity companies.The present value of these commitments, which excludes imputed interest of $273 million, totaled $1,249 million.
In accordance with a nationalization decree issued by Venezuela’s president in February 2007, by May 1, 2007, a subsidiary of the Venezuelan National OilCompany (PdVSA) assumed the operatorship of the Cerro Negro Heavy Oil Project. This Project had been operated and owned by ExxonMobil affiliates holdinga 41.67 percent ownership interest in the Project. The decree also required conversion of the Cerro Negro Project into a “mixed enterprise” and an increase inPdVSA’s or one of its affiliate’s ownership interest in the Project, with the stipulation that if ExxonMobil refused to accept the terms for the formation of themixed enterprise within a specified period of time, the government would “directly assume the activities” carried out by the joint venture. ExxonMobil refused toaccede to the terms proffered by the government, and on June 27, 2007, the government expropriated ExxonMobil’s 41.67 percent interest in the Cerro NegroProject.
On September 6, 2007, affiliates of ExxonMobil filed a Request for Arbitration with the International Centre for Settlement of Investment Disputes(ICSID) invoking ICSID jurisdiction under Venezuela’s Investment Law and the Netherlands-Venezuela Bilateral Investment Treaty. The ICSID Tribunal issued adecision on June 10, 2010, finding that it had jurisdiction to proceed on the basis of the Netherlands-Venezuela Bilateral Investment Treaty. The ICSID arbitrationproceeding is continuing and a hearing on the merits is currently scheduled for the first quarter of 2012. An affiliate of ExxonMobil has also filed an arbitrationunder the rules of the International Chamber of Commerce (ICC) against PdVSA and a PdVSA affiliate for breach of their contractual obligations under certainCerro Negro Project agreements. A hearing on the merits of the ICC arbitration concluded in September 2010 and the parties filed post-hearing briefs. At thistime, the net impact of this matter on the Corporation’s consolidated financial results cannot be reasonably estimated. However, the Corporation does not expectthe resolution to have a material effect upon the Corporation’s operations or financial condition. ExxonMobil’s remaining net book investment in Cerro Negroproducing assets is about $750 million.
88
(1)
Table of Contents
Index to Financial Statements
16. Pension and Other Postretirement Benefits
The benefit obligations and plan assets associated with the Corporation’s principal benefit plans are measured on December 31. Pension Benefits Other Postretirement
Benefits U.S. Non-U.S. 2010 2009 2010 2009 2010 2009 (percent) Weighted-average assumptions used to determine benefit obligations at December 31
Benefit obligation at December 31 $15,007 $13,981 $25,722 $23,344 $7,331 $ 6,748
Accumulated benefit obligation at December 31 $12,764 $11,615 $22,958 $20,909 $ — $ — (1) Benefit payments for funded and unfunded plans.(2) For 2010 and 2009, other postretirement benefits paid are net of $15 million and $28 million of Medicare subsidy receipts, respectively.
For U.S. plans, the discount rate is determined by constructing a portfolio of high-quality, noncallable bonds with cash flows that match estimated outflows forbenefit payments. For major non-U.S. plans, the discount rate is determined by using bond portfolios with an average maturity approximating that of the liabilitiesor spot yield curves, both of which are constructed using high-quality, local-currency-denominated bonds.
The measurement of the accumulated postretirement benefit obligation assumes an initial health care cost trend rate of 6.0 percent that declines to 4.5percent by 2015. A one-percentage-point increase in the health care cost trend rate would increase service and interest cost by $57 million and the postretirementbenefit obligation by $599 million. A one-percentage-point decrease in the health care cost trend rate would decrease service and interest cost by $45 million andthe post-retirement benefit obligation by $494 million. Pension Benefits Other Postretirement
Benefits U.S. Non-U.S. 2010 2009 2010 2009 2010 2009 (millions of dollars) Change in plan assets
Fair value at January 1 $10,277 $ 6,634 $15,401 $11,260 $ 514 $ 443 Actual return on plan assets 1,235 2,013 1,482 2,201 63 93 Foreign exchange rate changes — — 99 1,300 — — Company contribution — 3,070 1,184 1,456 38 36 Benefits paid (677) (1,440) (873) (795) (59) (57) Other — — (528) (21) 2 (1)
Fair value at December 31 $10,835 $10,277 $16,765 $15,401 $ 558 $ 514
(1) Benefit payments for funded plans.
89
(1) (2)
(1)
Table of Contents
Index to Financial Statements
NOTES TO CONSOLIDATED FINANCIAL STATEMENTS The funding levels of all qualified pension plans are in compliance with standards set by applicable law or regulation. As shown in the table below, certainsmaller U.S. pension plans and a number of non-U.S. pension plans are not funded because local tax conventions and regulatory practices do not encouragefunding of these plans. All defined benefit pension obligations, regardless of the funding status of the underlying plans, are fully supported by the financialstrength of the Corporation or the respective sponsoring affiliate. Pension Benefits U.S. Non-U.S. 2010 2009 2010 2009 (millions of dollars) Assets in excess of/(less than) benefit obligation
Balance at December 31 Funded plans $(2,349) $(1,940) $(2,769) $(2,085) Unfunded plans (1,823) (1,764) (6,188) (5,858)
Total $(4,172) $(3,704) $(8,957) $(7,943)
The authoritative guidance for defined benefit pension and other post-retirement plans requires an employer to recognize the overfunded or underfunded status ofa defined benefit postretirement plan as an asset or liability in its statement of financial position and to recognize changes in that funded status in the year inwhich the changes occur through other comprehensive income. Pension Benefits Other Postretirement
Benefits U.S. Non-U.S. 2010 2009 2010 2009 2010 2009 (millions of dollars) Assets in excess of/(less than) benefit obligation
Balance at December 31 $(4,172) $(3,704) $(8,957) $(7,943) $(6,773) $(6,234)
Amounts recorded in the consolidated balance sheet consist of: Other assets $ 1 $ 1 $ 400 $ 961 $ — $ — Current liabilities (257) (235) (336) (348) (343) (318) Postretirement benefits reserves (3,916) (3,470) (9,021) (8,556) (6,430) (5,916)
Total recorded $(4,172) $(3,704) $(8,957) $(7,943) $(6,773) $(6,234)
Amounts recorded in accumulated other comprehensive income consist of: Net actuarial loss/(gain) $ 5,028 $ 5,830 $ 7,795 $ 7,036 $ 1,985 $ 1,878 Prior service cost 83 5 674 622 154 181
Total recorded in accumulated other comprehensive income $ 5,111 $ 5,835 $ 8,469 $ 7,658 $ 2,139 $ 2,059
(1) Fair value of assets less benefit obligation shown on the preceding page.
90
(1)
Table of Contents
Index to Financial Statements
The long-term expected rate of return on funded assets shown below is established for each benefit plan by developing a forward-looking, long-term returnassumption for each asset class, taking into account factors such as the expected real return for the specific asset class and inflation
A single, long-term rate of return is then calculated as the weighted average of the target asset allocation and the long-term return assumption for each asset class. Pension Benefits Other Postretirement U.S. Non-U.S. Benefits 2010 2009 2008 2010 2009 2008 2010 2009 2008 (percent) Weighted-average assumptions used to determine net periodic
benefit cost for years ended December 31 Discount rate 6.00 6.25 6.25 5.20 5.50 5.40 6.00 6.25 6.25 Long-term rate of return on funded assets 7.50 8.00 9.00 6.70 7.30 7.50 7.50 8.00 9.00 Long-term rate of compensation increase 5.00 5.00 5.00 5.00 4.70 4.50 5.00 5.00 5.00
(millions of dollars) Components of net periodic benefit cost
Service cost $ 468 $ 438 $ 378 $ 480 $ 421 $ 434 $ 101 $ 94 $ 100 Interest cost 798 809 729 1,175 1,121 1,152 395 408 414 Expected return on plan assets (726) (656) (915) (1,010) (886) (1,200) (37) (35) (59) Amortization of actuarial loss/(gain) 525 694 239 554 648 318 147 176 197 Amortization of prior service cost 2 — (2) 84 79 93 52 69 76 Net pension enhancement and curtailment/settlement
Costs for defined contribution plans were $347 million, $339 million and $309 million in 2010, 2009 and 2008, respectively.
A summary of the change in accumulated other comprehensive income is shown in the table below: Total Pension and Other Postretirement Benefits 2010 2009 2008 (millions of dollars) (Charge)/credit to other comprehensive income, before tax
U.S. pension $ 724 $ 1,410 $ (4,864) Non-U.S. pension (811) 85 (3,413) Other postretirement benefits (80) 350 263
Total (charge)/credit to other comprehensive income, before tax (167) 1,845 (8,014) (Charge)/credit to income tax (see note 18) 35 (591) 2,723 (Charge)/credit to investment in equity companies 11 (133) (27)
(Charge)/credit to other comprehensive income including noncontrolling interests, after tax $ (121) $ 1,121 $ (5,318) Charge/(credit) to equity of noncontrolling interests 95 93 224
(Charge)/credit to other comprehensive income attributable to ExxonMobil $ (26) $ 1,214 $ (5,094)
91
Table of Contents
Index to Financial Statements
NOTES TO CONSOLIDATED FINANCIAL STATEMENTS The Corporation’s investment strategy for benefit plan assets reflects a long-term view, a careful assessment of the risks inherent in various asset classes andbroad diversification to reduce the risk of the portfolio. The benefit plan assets are primarily invested in passive equity and fixed income index funds to diversifyrisk while minimizing costs. The equity funds hold ExxonMobil stock only to the extent necessary to replicate the relevant equity index. The fixed income fundsare largely invested in high-quality corporate and government debt securities.
Studies are periodically conducted to establish the preferred target asset allocation. The target asset allocation for the U.S. benefit plans is 60% equitysecurities and 40% debt securities. The target asset allocation for the non-U.S. plans in aggregate is 56% equities, 41% debt and 3% real estate funds. The equitytargets for the U.S. and non-U.S. plans include an allocation to private equity partnerships that primarily focus on early-stage venture capital of 5% and 3%,respectively.
The fair value measurement levels are accounting terms that refer to different methods of valuing assets. The terms do not represent the relative risk orcredit quality of an investment.
The 2010 fair value of the benefit plan assets, including the level within the fair value hierarchy, is shown in the tables below: U.S. Pension Non-U.S. Pension
Fair Value Measurement atDecember 31, 2010, Using:
Fair Value Measurement atDecember 31, 2010, Using:
Quoted Pricesin Active
Markets forIdenticalAssets
(Level 1)
SignificantOther
ObservableInputs
(Level 2)
SignificantUnobservable
Inputs(Level 3) Total
Quoted Pricesin Active
Markets forIdenticalAssets
(Level 1)
SignificantOther
ObservableInputs
(Level 2)
SignificantUnobservable
Inputs(Level 3) Total
(millions of dollars) (millions of dollars) Asset category:
Total at fair value $ 68 $ 10,208 $ 536 $10,812 $ 439 $ 15,432 $ 736 $16,607 Insurance contracts at contract value 23 158
Total plan assets $10,835 $16,765
(1) For U.S. and non-U.S. equity securities held in the form of fund units that are redeemable at the measurement date, the unit value is treated as a Level 2
input. The fair value of the securities owned by the funds is based on observable quoted prices on active exchanges, which are Level 1 inputs.(2) For non-U.S. equity securities held in separate accounts, fair value is based on observable quoted prices on active exchanges.(3) For private equity, fair value is generally established by using revenue or earnings multiples or other relevant market data including Initial Public
Offerings.(4) For corporate, government and asset-backed debt securities, fair value is based on observable inputs of comparable market transactions.(5) For corporate and government debt securities that are traded on active exchanges, fair value is based on observable quoted prices.(6) For private mortgages, fair value is based on proprietary credit spread matrices developed using market data and monthly surveys of active mortgage
bankers.(7) For real estate funds, fair value is based on appraised values developed using comparable market transactions.(8) For cash balances that are subject to withdrawal penalties or other adjustments, the fair value is treated as a Level 2 input.
92
(1) (1)
(1) (2) (1)
(3) (3)
(4) (5) (4)
(4) (5) (4)
(4) (4)
(6) (6)
(7)
(8)
Table of Contents
Index to Financial Statements
Other Postretirement
Fair Value Measurement atDecember 31, 2010, Using:
(1) For U.S. and non-U.S. equity securities held in the form of fund units that are redeemable at the measurement date, the unit value is treated as a Level 2
input. The fair value of the securities owned by the funds is based on observable quoted prices on active exchanges, which are Level 1 inputs.(2) For private equity, fair value is generally established by using revenue or earnings multiples or other relevant market data including Initial Public
Offerings.(3) For corporate, government and asset-backed debt securities, fair value is based on observable inputs of comparable market transactions.(4) For private mortgages, fair value is based on proprietary credit spread matrices developed using market data and monthly surveys of active mortgage
bankers.
The change in the fair value in 2010 of Level 3 assets that use significant unobservable inputs to measure fair value is shown in the table below: 2010 Pension Other Postretirement U.S. Non U.S.
PrivateEquity
PrivateMortgages
PrivateEquity
PrivateMortgages
RealEstate
PrivateEquity
PrivateMortgages
(millions of dollars) Fair value at January 1 $ 349 $ 280 $ 239 $ 5 $413 $ 4 $ 3
Net realized gains/(losses) — 36 (1) (1) — — 1 Net unrealized gains/(losses) 47 (3) 26 1 (4) 1 — Net purchases/(sales) 12 (185) 51 (1) 8 — (2)
Fair value at December 31 $ 408 $ 128 $ 315 $ 4 $417 $ 5 $ 2
93
(1)
(1)
(2)
(3)
(3)
(3)
(4)
Table of Contents
Index to Financial Statements
NOTES TO CONSOLIDATED FINANCIAL STATEMENTS The 2009 fair value of the benefit plan assets, including the level within the fair value hierarchy, is shown in the tables below: U.S. Pension Non-U.S. Pension
Fair Value Measurement atDecember 31, 2009, Using:
Fair Value Measurement atDecember 31, 2009, Using:
Quoted Pricesin Active
Markets forIdenticalAssets
(Level 1)
SignificantOther
ObservableInputs
(Level 2)
SignificantUnobservable
Inputs(Level 3) Total
Quoted Pricesin Active
Markets forIdenticalAssets
(Level 1)
SignificantOther
ObservableInputs
(Level 2)
SignificantUnobservable
Inputs(Level 3) Total
(millions of dollars) (millions of dollars) Asset category:
Total at fair value $ 140 $ 9,484 $ 629 $10,253 $ 378 $ 14,218 $ 657 $15,253 Insurance contracts at contract value 24 148
Total plan assets $10,277 $15,401
(1) For U.S. and non-U.S. equity securities held in the form of fund units that are redeemable at the measurement date, the unit value is treated as a Level 2
input. The fair value of the securities owned by the funds is based on observable quoted prices on active exchanges, which are Level 1 inputs.(2) For non-U.S. equity securities held in separate accounts, fair value is based on observable quoted prices on active exchanges.(3) For private equity, fair value is generally established by using revenue or earnings multiples or other relevant market data including Initial Public
Offerings.(4) For corporate, government and asset-backed debt securities, fair value is based on observable inputs of comparable market transactions.(5) For corporate and government debt securities that are traded on active exchanges, fair value is based on observable quoted prices.(6) For private mortgages, fair value is based on proprietary credit spread matrices developed using market data and monthly surveys of active mortgage
bankers.(7) For real estate funds, fair value is based on appraised values developed using comparable market transactions.(8) For cash balances that are subject to withdrawal penalties or other adjustments, the fair value is treated as a Level 2 input.
94
(1) (1)
(1) (2) (1)
(3) (3)
(4) (5) (4)
(4) (5) (4)
(4) (4)
(6) (6)
(7)
(8)
Table of Contents
Index to Financial Statements
Other Postretirement
Fair Value Measurement atDecember 31, 2009, Using:
(1) For U.S. and non-U.S. equity securities held in the form of fund units that are redeemable at the measurement date, the unit value is treated as a Level 2
input. The fair value of the securities owned by the funds is based on observable quoted prices on active exchanges, which are Level 1 inputs.(2) For private equity, fair value is generally established by using revenue or earnings multiples or other relevant market data including Initial Public
Offerings.(3) For corporate, government and asset-backed debt securities, fair value is based on observable inputs of comparable market transactions.(4) For private mortgages, fair value is based on proprietary credit spread matrices developed using market data and monthly surveys of active mortgage
bankers.
The change in the fair value in 2009 of Level 3 assets that use significant unobservable inputs to measure fair value is shown in the table below: 2009 Pension Other Postretirement U.S. Non U.S.
PrivateEquity
PrivateMortgages
PrivateEquity
PrivateMortgages
RealEstate
PrivateEquity
PrivateMortgages
(millions of dollars) Fair value at January 1 $ 346 $ 476 $ 238 $ 5 $409 $ 4 $ 6
Net realized gains/(losses) 4 11 (10) — (7) — — Net unrealized gains/(losses) (35) 7 (35) — (11) — — Net purchases/(sales) 34 (214) 46 — 22 — (3)
Fair value at December 31 $ 349 $ 280 $ 239 $ 5 $413 $ 4 $ 3
95
(1)
(1)
(2)
(3)
(3)
(3)
(4)
Table of Contents
Index to Financial Statements
NOTES TO CONSOLIDATED FINANCIAL STATEMENTS A summary of pension plans with an accumulated benefit obligation in excess of plan assets is shown in the table below: Pension Benefits U.S. Non-U.S. 2010 2009 2010 2009 (millions of dollars) For funded pension plans with an accumulated benefit obligation in excess of plan assets:
Projected benefit obligation $13,184 $12,217 $ 9,865 $ 13,152 Accumulated benefit obligation 11,383 10,312 9,074 12,260 Fair value of plan assets 10,834 10,276 7,131 10,447
Pension Benefits Other Postretirement U.S. Non-U.S. Benefits (millions of dollars) Estimated 2011 amortization from accumulated other comprehensive income:
Net actuarial loss/(gain) $ 835 $ 615 $ 159 Prior service cost 9 97 35
(1) The Corporation amortizes the net balance of actuarial losses/(gains) as a component of net periodic benefit cost over the average remaining service
period of active plan participants.(2) The Corporation amortizes prior service cost on a straight-line basis as permitted under authoritative guidance for defined benefit pension and other
postretirement benefit plans. Pension Benefits Other Postretirement Benefits U.S. Non-U.S. Gross Medicare Subsidy Receipt (millions of dollars) Contributions expected in 2011 $ 270 $ 1,130 $ — $ —
17. Disclosures about Segments and Related Information
The Upstream, Downstream and Chemical functions best define the operating segments of the business that are reported separately. The factors used to identifythese reportable segments are based on the nature of the operations that are undertaken by each segment. The Upstream segment is organized and operates toexplore for and produce crude oil and natural gas. The Downstream segment is organized and operates to manufacture and sell petroleum products. The Chemicalsegment is organized and operates to manufacture and sell petrochemicals. These segments are broadly understood across the petroleum and petrochemicalindustries.
These functions have been defined as the operating segments of the Corporation because they are the segments (1) that engage in business activities fromwhich revenues are earned and expenses are incurred; (2) whose operating results are regularly reviewed by the Corporation’s chief operating decision maker tomake decisions about resources to be allocated to the segment and assess its performance; and (3) for which discrete financial information is available.
Earnings after income tax include special items, and transfers are at estimated market prices. Earnings for 2009 included a special charge of $140 million inthe corporate and financing segment for interest related to the Valdez punitive damages award. Special items included in 2008 after-tax earnings were a $1,620million gain in Non-U.S. Upstream on the sale of a natural gas transportation business in Germany and special charges of $460 million in the corporate andfinancing segment related to the Valdez litigation.
Interest expense includes non-debt-related interest expense of $41 million, $500 million and $498 million in 2010, 2009 and 2008, respectively. Higherexpenses in 2009 and 2008 primarily reflect interest provisions related to the Valdez litigation.
In corporate and financing activities, interest revenue relates to interest earned on cash deposits and marketable securities.
97
Table of Contents
Index to Financial Statements
NOTES TO CONSOLIDATED FINANCIAL STATEMENTS Upstream Downstream Chemical Corporate and Corporate U.S. Non-U.S. U.S. Non-U.S. U.S. Non-U.S. Financing Total (millions of dollars) As of December 31, 2010 Earnings after income tax $ 4,272 $ 19,825 $ 770 $ 2,797 $ 2,422 $ 2,491 $ (2,117) $ 30,460 Earnings of equity companies included above 1,261 8,415 23 225 171 1,163 (581) 10,677 Sales and other operating revenue (1) 8,895 26,046 93,599 206,042 13,402 22,119 22 370,125 Intersegment revenue 8,102 39,066 13,546 52,697 9,694 8,421 282 — Depreciation and depletion expense 3,506 7,574 681 1,565 421 432 581 14,760 Interest revenue — — — — — — 118 118 Interest expense 20 25 1 19 1 4 189 259 Income taxes 2,219 18,627 360 560 736 347 (1,288) 21,561 Additions to property, plant and equipment 52,300 16,937 888 1,332 247 1,733 719 74,156 Investments in equity companies 2,636 9,625 254 1,240 285 3,586 (197) 17,429 Total assets 76,725 115,646 18,378 47,402 7,148 19,087 18,124 302,510
As of December 31, 2009 Earnings after income tax $ 2,893 $ 14,214 $ (153) $ 1,934 $ 769 $ 1,540 $ (1,917) $ 19,280 Earnings of equity companies included above 1,216 5,269 (102) 188 164 906 (498) 7,143 Sales and other operating revenue (1) 3,406 21,355 76,467 173,404 9,962 16,885 21 301,500 Intersegment revenue 6,718 32,982 10,168 39,190 7,185 6,947 284 — Depreciation and depletion expense 1,768 6,376 687 1,665 400 457 564 11,917 Interest revenue — — — — — — 179 179 Interest expense 38 27 10 18 4 1 450 548 Income taxes 1,451 15,183 (164) (22) 281 (182) (1,428) 15,119 Additions to property, plant and equipment 2,973 13,307 1,449 1,447 294 2,553 468 22,491 Investments in equity companies 2,440 8,864 323 1,190 259 2,873 (207) 15,742 Total assets 24,940 102,372 17,493 45,098 7,044 17,117 19,259 233,323
As of December 31, 2008 Earnings after income tax $ 6,243 $ 29,159 $ 1,649 $ 6,502 $ 724 $ 2,233 $ (1,290) $ 45,220 Earnings of equity companies included above 1,954 7,597 (2) 518 105 1,411 (502) 11,081 Sales and other operating revenue (1) 6,767 32,346 116,701 265,359 14,136 24,252 18 459,579 Intersegment revenue 9,617 55,069 16,225 65,723 9,925 9,749 273 — Depreciation and depletion expense 1,391 7,266 656 1,672 410 422 562 12,379 Interest revenue — — — — — — 1,400 1,400 Interest expense 47 63 9 28 3 4 519 673 Income taxes 3,451 30,654 728 1,990 177 10 (480) 36,530 Additions to property, plant and equipment 2,699 10,545 1,550 1,552 413 1,987 572 19,318 Investments in equity companies 2,248 7,787 456 1,382 241 2,384 (40) 14,458 Total assets 23,056 83,750 16,328 42,044 6,856 13,300 42,718 228,052
GeographicSales and other operating revenue 2010 2009 2008 (millions of dollars) United States $ 115,906 $ 89,847 $137,615 Non-U.S. 254,219 211,653 321,964
Australia 6,570 4,247 2,857 United Kingdom 6,177 7,609 5,778 Kazakhstan 5,938 4,748 3,535
(1) Sales and other operating revenue includes sales-based taxes of $28,547 million for 2010, $25,936 million for 2009 and $34,508 million for 2008.
See note 1, Summary of Accounting Policies.
98
Table of Contents
Index to Financial Statements
18. Income, Sales-Based and Other Taxes 2010 2009 2008 U.S. Non-U.S. Total U.S. Non-U.S. Total U.S. Non-U.S. Total Income taxes (millions of dollars)
Federal and non-U.S. Current $1,224 $21,093 $22,317 $ (838) $15,830 $14,992 $ 3,005 $ 31,377 $ 34,382 Deferred – net 49 (1,191) (1,142) 650 (665) (15) 168 1,289 1,457
U.S. tax on non-U.S. operations 46 — 46 32 — 32 230 — 230
Total federal and non-U.S. 1,319 19,902 21,221 (156) 15,165 15,009 3,403 32,666 36,069 State 340 — 340 110 — 110 461 — 461
Total income taxes 1,659 19,902 21,561 (46) 15,165 15,119 3,864 32,666 36,530 Sales-based taxes 6,182 22,365 28,547 6,271 19,665 25,936 6,646 27,862 34,508 All other taxes and duties
Other taxes and duties 776 35,342 36,118 581 34,238 34,819 1,663 40,056 41,719 Included in production and manufacturing expenses 1,001 1,237 2,238 699 1,318 2,017 915 1,720 2,635 Included in SG&A expenses 201 570 771 197 538 735 209 660 869
Total other taxes and duties 1,978 37,149 39,127 1,477 36,094 37,571 2,787 42,436 45,223
Total $9,819 $79,416 $89,235 $7,702 $70,924 $78,626 $13,297 $102,964 $116,261
All other taxes and duties include taxes reported in production and manufacturing and selling, general and administrative (SG&A) expenses. The aboveprovisions for deferred income taxes include a net charge of $175 million in 2010 and net credits of $9 million in 2009 and $300 million in 2008 for the effect ofchanges in tax laws and rates.
Income taxes (charged)/credited directly to equity were: 2010 2009 2008 (millions of dollars) Cumulative foreign exchange translation adjustment $ (42) $(247) $ 360 Postretirement benefits reserves adjustment:
Net actuarial loss/(gain) 553 (94) 3,361 Amortization of actuarial loss/(gain) (609) (649) (317) Prior service cost 92 20 4 Amortization of prior service cost (45) (43) (51) Foreign exchange rate changes 44 175 (274)
Total postretirement benefits reserves adjustment 35 (591) 2,723 Other components of equity 246 140 315
The reconciliation between income tax expense and a theoretical U.S. tax computed by applying a rate of 35 percent for 2010, 2009 and 2008 is as follows: 2010 2009 2008 (millions of dollars) Income before income taxes
United States $ 7,711 $ 2,576 $10,152 Non-U.S. 45,248 32,201 73,245
Total $52,959 $34,777 $83,397
Theoretical tax $18,536 $12,172 $29,189 Effect of equity method of accounting (3,737) (2,500) (3,878) Non-U.S. taxes in excess of theoretical U.S. tax 7,293 5,948 10,188 U.S. tax on non-U.S. operations 46 32 230 State taxes, net of federal tax benefit 221 72 300 Other U.S. (798) (605) 501
Total income tax expense $21,561 $15,119 $36,530
Effective tax rate calculation Income taxes $21,561 $15,119 $36,530 ExxonMobil share of equity company income taxes 4,058 2,489 4,001
Total income taxes 25,619 17,608 40,531 Net income including noncontrolling interests 31,398 19,658 46,867
Total income before taxes $57,017 $37,266 $87,398
Effective income tax rate 45% 47% 46%
99
Table of Contents
Index to Financial Statements
NOTES TO CONSOLIDATED FINANCIAL STATEMENTS Deferred income taxes reflect the impact of temporary differences between the amount of assets and liabilities recognized for financial reporting purposes andsuch amounts recognized for tax purposes.
Deferred tax liabilities/(assets) are comprised of the following at December 31: Tax effects of temporary differences for: 2010 2009 (millions of dollars) Property, plant and equipment $ 42,657 $ 29,931 Other liabilities 4,278 4,102
Total deferred tax liabilities $ 46,935 $ 34,033
Pension and other postretirement benefits $ (5,634) $ (5,442) Asset retirement obligations (4,461) (3,978) Tax loss carryforwards (3,243) (3,693) Other assets (6,070) (4,700)
Total deferred tax assets $(19,408) $(17,813)
Asset valuation allowances 1,183 1,495
Net deferred tax liabilities $ 28,710 $ 17,715
Deferred income tax (assets) and liabilities are included in the balance sheet as shown below. Deferred income tax (assets) and liabilities are classified as currentor long term consistent with the classification of the related temporary difference – separately by tax jurisdiction. Balance sheet classification 2010 2009 (millions of dollars) Other current assets $ (3,359) $ (3,322) Other assets, including intangibles, net (3,527) (2,263) Accounts payable and accrued liabilities 446 152 Deferred income tax liabilities 35,150 23,148
Net deferred tax liabilities $28,710 $17,715
The Corporation had $35 billion of indefinitely reinvested, undistributed earnings from subsidiary companies outside the U.S. Unrecognized deferred taxes onremittance of these funds are not expected to be material.
Unrecognized Tax Benefits
The Corporation is subject to income taxation in many jurisdictions around the world. Unrecognized tax benefits reflect the difference between positions taken orexpected to be taken on income tax returns and the amounts recognized in the financial statements. Resolution of the related tax positions through negotiationswith the relevant tax authorities or through litigation will take many years to complete. It is difficult to predict the timing of resolution for tax positions since suchtiming is not entirely within the control of the Corporation. It is reasonably possible that the total amount of unrecognized tax benefits could increase by up to 20percent or decrease by up to 5 percent in the next 12 months. Given the long time periods involved in resolving tax positions, the Corporation does not expect thatthe recognition of unrecognized tax benefits will have a material impact on the Corporation’s effective income tax rate in any given year.
The following table summarizes the movement in unrecognized tax benefits. Gross unrecognized tax benefits 2010 2009 2008 (millions of dollars) Balance at January 1 $4,725 $4,976 $5,232 Additions based on current year’s tax positions 830 547 656 Additions for prior years’ tax positions 620 262 294 Reductions for prior years’ tax positions (505) (594) (328) Reductions due to lapse of the statute of limitations (534) — (27) Settlements with tax authorities (999) (592) (681) Foreign exchange effects/other 11 126 (170)
Balance at December 31 $4,148 $4,725 $4,976
The additions and reductions in unrecognized tax benefits shown above include effects related to net income and equity, and timing differences for which theultimate deductibility is highly certain but for which there is uncertainty about the timing of such deductibility. The 2010, 2009 and 2008 changes in unrecognizedtax benefits did not have a material effect on the Corporation’s net income or cash flow.
The following table summarizes the tax years that remain subject to examination by major tax jurisdiction: Country of Operation Open Tax YearsAbu Dhabi 2000 -2010Angola 2007 -2010Australia 2000 -2010Canada 1994 -2010Equatorial Guinea 2005 -2010Germany 1999 -2010Japan 2003 -2010Malaysia 2004 -2010
The Corporation classifies interest on income tax-related balances as interest expense or interest income and classifies tax-related penalties as operatingexpense.
In 2010, the Corporation’s resolution of certain tax positions with tax jurisdictions resulted in a decrease in the total amount of unrecognized tax benefitsand the related interest payable. For 2010, net interest expense was a credit of $39 million, reflecting the effect of credits from the net favorable resolution ofthese prior year tax positions. The Corporation incurred approximately $135 million and $137 million in interest expense on income tax reserves in 2009 and2008, respectively. The related interest payable balances were $636 million and $771 million at December 31, 2010, and 2009, respectively.
100
Table of Contents
Index to Financial Statements
19. Acquisition of XTO Energy Inc.
Description of the Transaction. On June 25, 2010, ExxonMobil acquired XTO Energy Inc. (XTO) by merging a wholly-owned subsidiary of ExxonMobil withand into XTO (the “merger”), with XTO continuing as the surviving corporation and wholly-owned subsidiary of ExxonMobil. XTO is involved in theexploration for, production of, and transportation and sale of crude oil and natural gas. XTO’s asset base, technical capabilities and operating expertise, togetherwith ExxonMobil’s extensive research and development expertise, project management and operational skills, global scale and financial capacity, should enableeffective development of additional supplies of unconventional oil and gas resources.
At the effective time of the merger, each share of XTO common stock was converted into the right to receive 0.7098 shares of common stock ofExxonMobil (the “Exchange Ratio”), with cash being paid in lieu of any fractional shares of ExxonMobil stock. Also at the effective time, each outstandingoption to purchase XTO common stock was converted into an option to purchase a number of shares of ExxonMobil stock based on the Exchange Ratio, and eachoutstanding restricted stock award and performance stock award of XTO was converted into a restricted stock award or performance stock award, as applicable,of ExxonMobil stock based on the Exchange Ratio.
The components of the consideration transferred follow: (millions of dollars)
Consideration attributable to stock issued $ 24,480 Consideration attributable to converted stock options 179
Total consideration transferred $ 24,659
(1) The fair value of the Corporation’s common stock on the acquisition date was $59.10 per share based on the closing value on the NYSE. The Corporation
issued 416 million shares of stock previously held in treasury. The treasury stock issued, based on the average cost, was valued at $21,139 million. Theexcess of the fair value of the consideration transferred over the cost of treasury stock issued was $3,520 million and was included in common stockwithout par value.
(2) The portion of the fair value of XTO converted stock-based awards attributable to pre-merger employee service was part of consideration. The remainingfair value of the awards will be recognized in future periods over the requisite service period.
Recording of Assets Acquired and Liabilities Assumed. The transaction was accounted for using the acquisition method of accounting, which requires, amongother things, that assets acquired and liabilities assumed be recognized at their fair values as of the acquisition date.
The following table summarizes the assets acquired and liabilities assumed: (millions of dollars) Cash and cash equivalents $ 47 Notes and accounts receivable 925 Inventories 170 Other current assets 911 Investments, advances and long-term receivables 52 Property, plant and equipment 47,300 Identifiable intangible assets 493 Goodwill 39 Other assets 75
Total assets acquired $ 50,012
Notes and loans payable $ 1,026 Accounts payable and accrued liabilities 1,788 Income taxes payable (199) Long-term debt 10,574 Postretirement benefits reserves 65 Deferred income tax liabilities 11,204 Other long-term obligations 895
Total liabilities assumed $ 25,353
Net assets acquired $ 24,659
(1) Derivatives were measured using Level 1 inputs for derivatives that are traded directly on the NYMEX and Level 2 inputs for derivatives that are
determined by either market prices on an active market for similar assets or by prices quoted by a broker or other market-corroborated prices.(2) Property, plant and equipment were measured primarily using an income approach. The fair value measurements of the oil and gas assets were based, in
part, on significant inputs not observable in the market and thus represent a Level 3 measurement. The significant inputs included XTO resources, assumedfuture production profiles, commodity prices (mainly based on observable market inputs), risk adjusted discount rate of 7.0 percent, inflation of 2.0 percentand assumptions on the timing and amount of future development and operating costs. The property, plant and equipment additions were segmented to theUpstream business, with substantially all of the assets in the United States.
101
(1) (2)
(2)
(1)
(2)
(3)
(4)
(1)
(5)
(1) (6)
(5)
(6)
Table of Contents
Index to Financial Statements
NOTES TO CONSOLIDATED FINANCIAL STATEMENTS (3) Identifiable intangible assets and other assets were measured using a combination of an income approach and a market approach (Level 3). Identifiable
intangible assets will be amortized over 20 years.(4) Goodwill was the excess of the consideration transferred over the net assets recognized and represents the future economic benefits arising from other
assets acquired that could not be individually identified and separately recognized. Goodwill was recognized in the Upstream reporting unit. Goodwill isnot amortized and is not deductible for tax purposes.
(5) Long-term debt was recognized mainly at market rates at closing (Level 1).(6) Deferred income taxes reflect the temporary differences between the amount of assets and liabilities recognized for financial reporting purposes and such
amounts recognized for tax purposes.
XTO Results and Pro Forma Impact of Merger. The following table presents revenues and earnings for XTO for the periods presented:
Acquisition DateThrough
December 31, 2010
(millions of dollars) Revenues $ 4,448
Upstream earnings $ 262
Transaction-related costs were expensed as incurred. The Corporation recognized $18 million in transaction costs related to the merger in 2010.
The following table presents unaudited pro forma information for the Corporation as if the merger of XTO had occurred at the beginning of each yearpresented: 2010 2009 (millions of dollars, except per share amounts)
Revenues $ 373,273 $ 307,456
Net income attributable to ExxonMobil $ 30,668 $ 19,672
Earnings per common share $ 6.03 $ 3.75
Earnings per common share – assuming dilution $ 6.01 $ 3.74
The historical financial information was adjusted to give effect to the pro forma events that were directly attributable to the merger and factually supportable. Theunaudited pro forma consolidated results are not necessarily indicative of what the consolidated results of operations actually would have been had the mergerbeen completed on January 1, 2010, or on January 1, 2009. In addition, the unaudited pro forma consolidated results do not purport to project the future results ofoperations of the combined company. The unaudited pro forma consolidated results reflect pro forma adjustments for the elimination of deferred gains and lossesrecognized in earnings for derivatives outstanding at the beginning of the year presented, depreciation expense related to the fair value adjustment to property,plant and equipment acquired, additional amortization expense related to the fair value of identifiable intangible assets acquired, capitalization of interest expenseand applicable income tax impacts.
102
Table of Contents
Index to Financial Statements
SUPPLEMENTAL INFORMATION ON OIL AND GAS EXPLORATION AND PRODUCTION ACTIVITIES (unaudited)
The results of operations for producing activities shown below do not include earnings from other activities that ExxonMobil includes in the Upstream function,such as oil and gas transportation operations, LNG liquefaction and transportation operations, coal and power operations, technical service agreements, othernonoperating activities and adjustments for noncontrolling interests. These excluded amounts for both consolidated and equity companies totaled $249 million in2010, $536 million in 2009, and $3,834 million in 2008. Oil sands mining operations were in the excluded amounts for 2008. However, beginning in 2009, oilsands mining operations are included in the results of operations in accordance with revised Securities and Exchange Commission and Financial AccountingStandards Board rules. The amounts included for oil sands mining operations in the results of operations for 2009 are shown in footnote 1 on page 104. Results of Operations – Consolidated Subsidiaries United States
Total results of operations $ 3,901 $ 2,158 $ 3,610 $ 4,330 $ 9,233 $ 616 $23,848
103
Table of Contents
Index to Financial Statements
SUPPLEMENTAL INFORMATION ON OIL AND GAS EXPLORATION AND PRODUCTION ACTIVITIES (unaudited) Results of Operations – Consolidated Subsidiaries United States
(1) The impact of including synthetic oil reserves and bitumen mining operations in the results of operations for 2009 was $1,447 million in revenue and $279
million in earnings. Cold Lake bitumen operations had no net impact as they had already been included in the results of operations in previous years as anoil and gas operation.
104
(1)
Table of Contents
Index to Financial Statements
Oil and Gas Exploration and Production Costs
The amounts shown for net capitalized costs of consolidated subsidiaries are $4,729 million less at year-end 2010 and $2,910 million less at year-end 2009 thanthe amounts reported as investments in property, plant and equipment for the Upstream in note 8. This is due to the exclusion from capitalized costs of certaintransportation and research assets and assets relating to LNG operations. Assets related to oil sands and oil shale mining operations have been included in thecapitalized costs for 2010 and 2009 in accordance with revised Financial Accounting Standards Board rules. Capitalized Costs – Consolidated Subsidiaries United States
Net capitalized costs for equity companies $ 2,089 $ — $ 1,425 $ — $ 5,706 $ — $ 9,220
105
Table of Contents
Index to Financial Statements
SUPPLEMENTAL INFORMATION ON OIL AND GAS EXPLORATION AND PRODUCTION ACTIVITIES (unaudited) Oil and Gas Exploration and Production Costs (continued) The amounts reported as costs incurred include both capitalized costs and costs charged to expense during the year. Costs incurred also include new assetretirement obligations established in the current year, as well as increases or decreases to the asset retirement obligation resulting from changes in cost estimatesor abandonment date. Total consolidated costs incurred in 2010 were $70,812 million, up $50,305 million from 2009, due primarily to the acquisition of XTOEnergy Inc. 2009 costs were $20,507 million, up $4,691 million from 2008, due primarily to higher exploration and development costs as well as the inclusion in2009 of costs incurred related to oil sands mining operations (see footnote 1 below). Total equity company costs incurred in 2010 were $914 million, down $105million from 2009, due primarily to lower development costs. Costs incurred in property acquisitions, exploration anddevelopment activities – Consolidated Subsidiaries United States
(1) Costs incurred on synthetic oil reserves and bitumen mining operations in 2009 were $1,872 million, primarily on unproved property acquisition and
development costs. Cold Lake bitumen operations had been included in costs incurred in previous years as an oil and gas operation.
106
(1)
Table of Contents
Index to Financial Statements
Oil and Gas Reserves
The following information describes changes during the years and balances of proved oil and gas reserves at year-end 2008, 2009 and 2010.
The definitions used are in accordance with the Securities and Exchange Commission’s Rule 4-10 (a) of Regulation S-X.
Proved oil and gas reserves are those quantities of oil and gas, which, by analysis of geoscience and engineering data, can be estimated with reasonablecertainty to be economically producible – from a given date forward, from known reservoirs, and under existing economic conditions, operating methods andgovernment regulations – prior to the time at which contracts providing the right to operate expire, unless evidence indicates that renewal is reasonably certain. Insome cases, substantial new investments in additional wells and related facilities will be required to recover these proved reserves.
In accordance with the Securities and Exchange Commission’s rules, the year-end reserves volumes for 2009 and 2010 as well as the reserves changecategories for 2009 and 2010 shown in the following tables were calculated using average prices during the 12-month period prior to the ending date of the periodcovered by the report, determined as an unweighted arithmetic average of the first-day-of-the-month price for each month within such period. The year-endreserves volumes for 2008 as well as the reserves change categories for 2008 shown in the following tables were calculated using December 31 prices and costs.These reserves quantities are also used in calculating unit-of-production depreciation rates and in calculating the standardized measure of discounted net cashflow.
Revisions can include upward or downward changes in previously estimated volumes of proved reserves for existing fields due to the evaluation or re-evaluation of (1) already available geologic, reservoir or production data, (2) new geologic, reservoir or production data or (3) changes in average prices and year-end costs that are used in the estimation of reserves. This category can also include significant changes in either development strategy or production equipment/facility capacity.
Proved reserves include 100 percent of each majority-owned affiliate’s participation in proved reserves and ExxonMobil’s ownership percentage of theproved reserves of equity companies, but exclude royalties and quantities due others. Gas reserves exclude the gaseous equivalent of liquids expected to beremoved from the gas on leases, at field facilities and at gas processing plants. These liquids are included in net proved reserves of crude oil and natural gasliquids.
In the proved reserves tables, consolidated reserves and equity company reserves are reported separately. However, the Corporation does not view equitycompany reserves any differently than those from consolidated companies.
Reserves reported under production sharing and other nonconcessionary agreements are based on the economic interest as defined by the specific fiscalterms in the agreement. The production and reserves that we report for these types of arrangements typically vary inversely with oil and gas price changes. As oiland gas prices increase, the cash flow and value received by the company increase; however, the production volumes and reserves required to achieve this valuewill typically be lower because of the higher prices. When prices decrease, the opposite effect generally occurs. The percentage of total liquids and natural gasproved reserves (consolidated subsidiaries plus equity companies) at year-end 2010 that were associated with production sharing contract arrangements was 16percent of liquids, 10 percent of natural gas and 13 percent on an oil-equivalent basis (gas converted to oil-equivalent at 6 billion cubic feet = 1 million barrels).
Net proved developed reserves are those volumes that are expected to be recovered through existing wells with existing equipment and operating methodsor in which the cost of the required equipment is relatively minor compared to the cost of a new well. Net proved undeveloped reserves are those volumes that areexpected to be recovered from new wells on undrilled acreage, or from existing wells where a relatively major expenditure is required for recompletion.
Crude oil and natural gas liquids and natural gas production quantities shown are the net volumes withdrawn from ExxonMobil’s oil and gas reserves. Thenatural gas quantities differ from the quantities of gas delivered for sale by the producing function as reported in the Operating Summary due to volumesconsumed or flared and inventory changes.
In accordance with the Securities and Exchange Commission’s rules, bitumen extracted through mining activities and hydrocarbons from other non-traditional resources are reported as oil and gas reserves beginning in 2009.
The rules in 2009 adopted a reliable technology definition that permits reserves to be added based on technologies that have been field tested and have beendemonstrated to provide reasonably certain results with consistency and repeatability in the formation being evaluated.
Major changes between 2009 year-end proved reserves and 2010 year-end proved reserves included the initial booking of the properties acquired in theXTO Energy Inc. transaction.
107
Table of Contents
Index to Financial Statements
SUPPLEMENTAL INFORMATION ON OIL AND GAS EXPLORATION AND PRODUCTION ACTIVITIES (unaudited) Crude Oil, Natural Gas Liquids, Synthetic Oil and Bitumen Proved Reserves Crude Oil and Natural Gas Liquids Bitumen Synthetic Oil
UnitedStates
Canada/S. Amer. Europe Africa Asia
Australia/Oceania Total
Canada/S. Amer
Canada/S. Amer. Total
(millions of barrels) Net proved developed and undeveloped reserves
of consolidated subsidiaries January 1, 2008 1,851 939 673 2,058 2,010 213 7,744
Total liquids proved reserves at December 31,2009 1,972 172 517 1,907 4,049 288 8,905 2,055 691 11,651
(1) Includes total proved reserves attributable to Imperial Oil Limited of 694 million barrels in 2008, 63 million barrels in 2009 and 57 million barrels in 2010,
as well as proved developed reserves of 488 million barrels in 2008, 62 million barrels in 2009 and 56 million barrels in 2010, and in addition, provedundeveloped reserves of 1 million barrels in 2009 and 1 million barrels in 2010, in which there is a 30.4 percent noncontrolling interest.
(2) Includes total proved reserves attributable to Imperial Oil Limited of 1,661 million barrels in 2009 and 1,715 million barrels in 2010, as well as proveddeveloped reserves of 468 million barrels in 2009 and 519 million barrels in 2010, and in addition, proved undeveloped reserves of 1,193 million barrels in2009 and 1,196 million barrels in 2010, in which there is a 30.4 percent noncontrolling interest.
(3) Includes total proved reserves attributable to Imperial Oil Limited of 691 million barrels in 2009 and 681 million barrels in 2010, as well as proveddeveloped reserves of 691 million barrels in 2009 and 681 million barrels in 2010, in which there is a 30.4 percent noncontrolling interest.
(4) Total proved reserves of 630 million barrels at December 31, 2008, associated with the Cold Lake field in Canada are reported as bitumen reserves underthe amended Securities and Exchange Commission’s Rule 4-10 of Regulation S-X.
108
(1) (2) (3)
(4) (4)
Table of Contents
Index to Financial Statements
Crude Oil, Natural Gas Liquids, Synthetic Oil and Bitumen Proved Reserves (continued) Crude Oil and Natural Gas Liquids Bitumen Synthetic Oil
UnitedStates
Canada/S. Amer. Europe Africa Asia
Australia/Oceania Total
Canada/S. Amer.
Canada/S. Amer. Total
(millions of barrels) Net proved developed and undeveloped reserves of
Total liquids proved reserves at December 31, 2010 2,303 163 454 1,799 3,896 275 8,890 2,102 681 11,673
(See footnotes on previous page)
109
(1) (2) (3)
Table of Contents
Index to Financial Statements
SUPPLEMENTAL INFORMATION ON OIL AND GAS EXPLORATION AND PRODUCTION ACTIVITIES (unaudited) Crude Oil, Natural Gas Liquids, Synthetic Oil and Bitumen Proved Reserves (continued) Crude Oil and Natural Gas Liquids Bitumen Synthetic Oil
UnitedStates
Canada/S. Amer. Europe Africa Asia
Australia/Oceania Total
Canada/S. Amer.
Canada/S. Amer. Total
(millions of barrels) Proved developed reserves, as of January 1, 2008
Total proved reserves at December 31, 2009 11,802 1,368 16,173 920 30,304 7,440 68,007 22,985
(1) Includes total proved reserves attributable to Imperial Oil Limited of 593 billion cubic feet in 2008, 590 billion cubic feet in 2009 and 576 billion cubic feet
in 2010, as well as proved developed reserves of 513 billion cubic feet in 2008, 526 billion cubic feet in 2009 and 507 billion cubic feet in 2010, and inaddition, proved undeveloped reserves of 64 billion cubic feet in 2009 and 69 billion cubic feet in 2010, in which there is a 30.4 percent noncontrollinginterest.
(2) Natural gas is converted to oil-equivalent basis at six million cubic feet per one thousand barrels.
111
(1) (2)
Table of Contents
Index to Financial Statements
SUPPLEMENTAL INFORMATION ON OIL AND GAS EXPLORATION AND PRODUCTION ACTIVITIES (unaudited) Natural Gas and Oil-Equivalent Proved Reserves (continued) Natural Gas Oil-Equivalent
UnitedStates
Canada/S. Amer. Europe Africa Asia
Australia/Oceania Total Total All Products
(billions of cubic feet) (millions of
oil-equivalent barrels) Net proved developed and undeveloped reserves of
Proved developed reserves, as of December 31, 2008 Consolidated subsidiaries 7,835 1,148 4,426 738 5,257 1,346 20,750 Equity companies 96 — 9,284 — 12,619 — 21,999
Proved developed reserves, as of December 31, 2009 Consolidated subsidiaries 7,492 1,200 3,920 739 7,407 1,262 22,020 9,111 Equity companies 90 — 8,862 — 17,799 — 26,751 6,356
Proved undeveloped reserves, as of December 31, 2009 Consolidated subsidiaries 4,196 168 803 181 896 6,178 12,422 5,844 Equity companies 24 — 2,588 — 4,202 — 6,814 1,674
Total proved reserves at December 31, 2009 11,802 1,368 16,173 920 30,304 7,440 68,007 22,985
Proved developed reserves, as of December 31, 2010 Consolidated subsidiaries 15,344 1,077 3,516 711 6,593 1,174 28,415 10,408 Equity companies 97 — 8,167 — 20,494 — 28,758 6,708
Proved undeveloped reserves, as of December 31, 2010 Consolidated subsidiaries 10,650 181 526 197 667 6,177 18,398 6,812 Equity companies 20 — 2,579 — 645 — 3,244 881
Total proved reserves at December 31, 2010 26,111 1,258 14,788 908 28,399 7,351 78,815 24,809
(See footnotes on page 111)
113
(1) (2)
Table of Contents
Index to Financial Statements
SUPPLEMENTAL INFORMATION ON OIL AND GAS EXPLORATION AND PRODUCTION ACTIVITIES (unaudited) Standardized Measure of Discounted Future Cash Flows
As required by the Financial Accounting Standards Board, the standardized measure of discounted future net cash flows was computed through 2008 by applyingyear-end prices, costs and legislated tax rates and a discount factor of 10 percent to net proved reserves. Beginning in 2009, the standardized measure ofdiscounted future net cash flows is computed by applying first-day-of-the-month average prices, year-end costs and legislated tax rates and a discount factor of 10percent to proved reserves. The standardized measure includes costs for future dismantlement, abandonment and rehabilitation obligations. The Corporationbelieves the standardized measure does not provide a reliable estimate of the Corporation’s expected future cash flows to be obtained from the development andproduction of its oil and gas properties or of the value of its proved oil and gas reserves. The standardized measure is prepared on the basis of certain prescribedassumptions including first-day-of-the-month average prices, which represent discrete points in time and therefore may cause significant variability in cash flowsfrom year to year as prices change. Standardized Measureof Discounted Future Cash Flows
UnitedStates
Canada/South America Europe Africa Asia
Australia/Oceania Total
(millions of dollars) Consolidated Subsidiaries
As of December 31, 2008 Future cash inflows from sales of oil and gas $104,441 $ 22,952 $71,879 $ 74,426 $ 80,314 $10,437 $364,449 Future production costs 44,230 13,113 19,485 24,403 22,826 5,334 129,391 Future development costs 19,828 6,156 8,765 16,064 11,496 2,134 64,443 Future income tax expenses 17,857 961 24,729 16,870 26,218 917 87,552
Future net cash flows $ 22,526 $ 2,722 $18,900 $ 17,089 $ 19,774 $ 2,052 $ 83,063 Effect of discounting net cash flows at 10% 13,107 (239) 7,602 8,052 13,031 941 42,494
Total consolidated and equity interests in standardizedmeasure of discounted future net cash flows $ 16,247 $ 13,066 $14,927 $ 19,665 $ 50,283 $ 968 $ 115,156
(1) Includes discounted future net cash flows attributable to Imperial Oil Limited of $1,033 million in 2008 and $10,088 million in 2009, in which there is a
Total consolidated and equity interests in standardizedmeasure of discounted future net cash flows $ 38,974 $ 25,371 $14,472 $ 26,926 $ 65,693 $ 4,086 $175,522
(1) Includes discounted future net cash flows attributable to Imperial Oil Limited of $19,834 million in 2010, in which there is a 30.4 percent noncontrollinginterest.
115
(1)
Table of Contents
Index to Financial Statements
SUPPLEMENTAL INFORMATION ON OIL AND GAS EXPLORATION AND PRODUCTION ACTIVITIES (unaudited)
Change in Standardized Measure of Discounted Future Net Cash Flows Relating to Proved Oil Gas Reserves Consolidated Subsidiaries 2008 (millions of dollars) Discounted future net cash flows as of December 31, 2007 $ 126,173
Value of reserves added during the year due to extensions, discoveries, improved recovery and net purchases less related costs (303) Changes in value of previous-year reserves due to:
Sales and transfers of oil and gas produced during the year, net of production (lifting) costs (62,685) Development costs incurred during the year 11,649 Net change in prices, lifting and development costs (178,960) Revisions of previous reserves estimates 7,652 Accretion of discount 21,463
Net change in income taxes 115,580
Total change in the standardized measure during the year for consolidated subsidiaries $ (85,604)
Discounted future net cash flows as of December 31, 2008 $ 40,569
Change in Standardized Measure of Discounted Future Net Cash Flows Relating to Proved Oil Gas Reserves Consolidated and Equity Interests 2009
ConsolidatedSubsidiaries
Share ofEquity Method
Investees
TotalConsolidatedand EquityInterests
(millions of dollars) Discounted future net cash flows as of December 31, 2008 $ 40,569 $ 45,449 $ 86,018
Value of reserves added during the year due to extensions, discoveries, improved recovery and netpurchases less related costs 2,138 280 2,418
Changes in value of previous-year reserves due to: Sales and transfers of oil and gas produced during the year, net of production (lifting) costs (35,384) (10,288) (45,672) Development costs incurred during the year 13,549 1,017 14,566 Net change in prices, lifting and development costs 51,627 9,245 60,872 Revisions of previous reserves estimates 8,805 858 9,663 Accretion of discount 6,943 5,214 12,157
Net change in income taxes (22,401) (2,465) (24,866)
Total change in the standardized measure during the year $ 25,277 $ 3,861 $ 29,138
Discounted future net cash flows as of December 31, 2009 $ 65,846 $ 49,310 $ 115,156
(1) Discounted future net cash flows associated with synthetic oil reserves and bitumen mining operations in 2009 were $5,268 million. Cold Lake bitumenoperations had been included in discounted future net cash flows in previous years as an oil and gas operation.
(2) The estimated impact of adopting the reliable technology definition and changing from year-end price to first-day-of-the-month average prices in theSecurities and Exchange Commission’s Rule 4-10 of Regulation S-X was de minimis on discounted future net cash flows for consolidated and equitysubsidiaries in 2009.
116
(1)(2)
Table of Contents
Index to Financial Statements
Change in Standardized Measure of Discounted Future Net Cash Flows Relating to Proved Oil and Gas Reserves Consolidated and Equity Interests (continued) 2010
ConsolidatedSubsidiaries
Share ofEquity Method
Investees
TotalConsolidatedand EquityInterests
(millions of dollars) Discounted future net cash flows as of December 31, 2009 $ 65,846 $ 49,310 $ 115,156
Value of reserves added during the year due to extensions, discoveries, improved recovery and net purchasesless related costs 20,093 210 20,303
Changes in value of previous-year reserves due to: Sales and transfers of oil and gas produced during the year, net of production (lifting) costs (46,078) (16,050) (62,128) Development costs incurred during the year 20,975 843 21,818 Net change in prices, lifting and development costs 61,612 23,135 84,747 Revisions of previous reserves estimates 14,770 3,605 18,375 Accretion of discount 10,399 5,775 16,174
Net change in income taxes (33,379) (5,544) (38,923)
Total change in the standardized measure during the year $ 48,392 $ 11,974 $ 60,366
Discounted future net cash flows as of December 31, 2010 $ 114,238 $ 61,284 $ 175,522
117
Table of Contents
Index to Financial Statements
OPERATING SUMMARY (unaudited) 2010 2009 2008 2007 2006 (thousands of barrels daily) Production of crude oil, natural gas liquids, synthetic oil and bitumen
Net production United States 408 384 367 392 414 Canada/South America 263 267 292 324 354 Europe 335 379 428 480 520 Africa 628 685 652 717 781 Asia 730 607 599 629 535 Australia/Oceania 58 65 67 74 77
Worldwide 2,422 2,387 2,405 2,616 2,681
(millions of cubic feet daily) Natural gas production available for sale
Net production United States 2,596 1,275 1,246 1,468 1,625 Canada/South America 569 643 640 808 935 Europe 3,836 3,689 3,949 3,810 4,086 Africa 14 19 32 26 – Asia 4,801 3,332 2,870 2,883 2,358 Australia/Oceania 332 315 358 389 330
Worldwide 12,148 9,273 9,095 9,384 9,334
(thousands of oil-equivalent barrels daily) Oil-equivalent production (1) 4,447 3,932 3,921 4,180 4,237
(thousands of barrels daily) Refinery throughput
United States 1,753 1,767 1,702 1,746 1,760 Canada 444 413 446 442 442 Europe 1,538 1,548 1,601 1,642 1,672 Asia Pacific 1,249 1,328 1,352 1,416 1,434 Other Non-U.S. 269 294 315 325 295
Worldwide 5,253 5,350 5,416 5,571 5,603
Petroleum product sales (2) United States 2,511 2,523 2,540 2,717 2,729 Canada 450 413 444 461 473 Europe 1,611 1,625 1,712 1,773 1,813 Asia Pacific and other Eastern Hemisphere 1,562 1,588 1,646 1,701 1,763 Latin America 280 279 419 447 469
(thousands of metric tons) Chemical prime product sales
United States 9,815 9,649 9,526 10,855 10,703 Non-U.S. 16,076 15,176 15,456 16,625 16,647
Worldwide 25,891 24,825 24,982 27,480 27,350
Operating statistics include 100 percent of operations of majority-owned subsidiaries; for other companies, crude production, gas, petroleum product andchemical prime product sales include ExxonMobil’s ownership percentage and refining throughput includes quantities processed for ExxonMobil. Net productionexcludes royalties and quantities due others when produced, whether payment is made in kind or cash.
(1) Gas converted to oil-equivalent at 6 million cubic feet = 1 thousand barrels.(2) Petroleum product sales data reported net of purchases/sales contracts with the same counterparty.
118
Table of Contents
Index to Financial Statements
SIGNATURES
Pursuant to the requirements of Section 13 or 15(d) of the Securities Exchange Act of 1934, the registrant has duly caused this report to be signedon its behalf by the undersigned, thereunto duly authorized.
EXXON MOBIL CORPORATION
By: /s/ REX W. TILLERSON
(Rex W. Tillerson,Chairman of the Board)
Dated February 25, 2011
POWER OF ATTORNEY
Each person whose signature appears below constitutes and appoints Beverley A. Babcock, Randall M. Ebner and Robert N. Schleckser and eachof them, his or her true and lawful attorneys-in-fact and agents, with full power of substitution and resubstitution, for him or her and in his or hername, place and stead, in any and all capacities, to sign any and all amendments to this Annual Report on Form 10-K, and to file the same, with allexhibits thereto, and other documents in connection therewith, with the Securities and Exchange Commission, granting unto said attorneys-in-fact andagents, and each of them, full power and authority to do and perform each and every act and thing requisite and necessary to be done, as fully to allintents and purposes as he or she might or could do in person, hereby ratifying and confirming all that said attorneys-in-fact and agents or any of them,or their or his or her substitute or substitutes, may lawfully do or cause to be done by virtue hereof.
Pursuant to the requirements of the Securities Exchange Act of 1934, this report has been signed below by the following persons on behalf of theregistrant and in the capacities and on the dates indicated.
/s/ REX W. TILLERSON (Rex W. Tillerson)
Chairman of the Board(Principal Executive Officer)
February 25, 2011
/s/ MICHAEL J. BOSKIN (Michael J. Boskin)
Director
February 25, 2011
/s/ PETER BRABECK-LETMATHE(Peter Brabeck-Letmathe)
Director
February 25, 2011
/s/ LARRY R. FAULKNER (Larry R. Faulkner)
Director
February 25, 2011
119
Table of Contents
Index to Financial Statements
/s/ JAY S. FISHMAN (Jay S. Fishman)
Director
February 25, 2011
/s/ KENNETH C. FRAZIER(Kenneth C. Frazier)
Director
February 25, 2011
/s/ WILLIAM W. GEORGE (William W. George)
Director
February 25, 2011
/s/ MARILYN CARLSON NELSON(Marilyn Carlson Nelson)
Director
February 25, 2011
/s/ SAMUEL J. PALMISANO (Samuel J. Palmisano)
Director
February 25, 2011
/s/ STEVEN S REINEMUND(Steven S Reinemund)
Director
February 25, 2011
/s/ EDWARD E. WHITACRE, JR.(Edward E. Whitacre, Jr.)
Director
February 25, 2011
/s/ DONALD D. HUMPHREYS (Donald D. Humphreys)
Treasurer(Principal Financial Officer)
February 25, 2011
/s/ PATRICK T. MULVA (Patrick T. Mulva)
Controller(Principal Accounting Officer)
February 25, 2011
120
Table of Contents
Index to Financial Statements
INDEX TO EXHIBITS
3(i)
Restated Certificate of Incorporation, as restated November 30, 1999, and as further amended effective June 20, 2001 (incorporated byreference to Exhibit 3(i) to the Registrant’s Quarterly Report on Form 10-Q for the quarter ended June 30, 2006).
3(ii)
By-Laws, as revised to July 31, 2002 (incorporated by reference to Exhibit 3(ii) to the Registrant’s Quarterly Report on Form 10-Q forthe quarter ended June 30, 2007).
10(iii)(a.1)
2003 Incentive Program (incorporated by reference to Exhibit 10(iii)(a.1) to the Registrant’s Quarterly Report on Form 10-Q for thequarter ended March 31, 2008).*
10(iii)(a.2)
Form of stock option granted to executive officers (incorporated by reference to Exhibit 10(iii)(a.2) to the Registrant’s Annual Reporton Form 10-K for 2009).*
10(iii)(a.3)
Form of restricted stock agreement with executive officers (incorporated by reference to Exhibit 99.2 to the Registrant’s Report onForm 8-K on November 30, 2010).*
10(iii)(b.1)
Short Term Incentive Program, as amended (incorporated by reference to Exhibit 99.3 to the Registrant’s Report on Form 8-K onDecember 1, 2009).*
10(iii)(b.2)
Form of Earnings Bonus Unit granted to executive officers (incorporated by reference to Exhibit 99.1 to the Registrant’s Report onForm 8-K on November 30, 2010).*
10(iii)(c.1)
ExxonMobil Supplemental Savings Plan (incorporated by reference to Exhibit 99.1 to the Registrant’s Report on Form 8-K onNovember 2, 2007).*
10(iii)(c.2)
ExxonMobil Supplemental Pension Plan (incorporated by reference to Exhibit 10(iii)(c.2) to the Registrant’s Report on Form 8-K onOctober 12, 2006).*
10(iii)(c.3)
ExxonMobil Additional Payments Plan (incorporated by reference to Exhibit 10(iii)(c.3) to the Registrant’s Report on Form 8-K onOctober 12, 2006).*
10(iii)(d)
ExxonMobil Executive Life Insurance and Death Benefit Plan (incorporated by reference to Exhibit 10(iii)(d) to the Registrant’sQuarterly Report on Form 10-Q for the quarter ended September 30, 2007).*
10(iii)(f.1)
2004 Non-Employee Director Restricted Stock Plan (incorporated by reference to Exhibit 10(iii)(f.1) to the Registrant’s QuarterlyReport on Form 10-Q for the quarter ended March 31, 2009).*
10(iii)(f.2)
Standing resolution for non-employee director restricted grants dated September 26, 2007 (incorporated by reference to Exhibit 99.2to the Registrant’s Report on Form 8-K on September 27, 2007).*
10(iii)(f.3)
Form of restricted stock grant letter for non-employee directors (incorporated by reference to Exhibit 10(iii)(f.3) to the Registrant’sAnnual Report on Form 10-K for 2009).*
10(iii)(f.4)
Standing resolution for non-employee director cash fees dated September 28, 2009 (incorporated by reference to Exhibit 99.1 to theRegistrant’s Report on Form 8-K on October 28, 2009).*
10(iii)(f.5) Extended Provisions for Restricted Stock Unit Agreements-Settlement in Shares.*
121
Table of Contents
Index to Financial Statements
INDEX TO EXHIBITS—(continued)
10(iii)(g.3)
1984 Mobil Compensation Management Retention Plan, as amended and restated on September 27, 2007 (incorporated by referenceto Exhibit 99.1 to the Registrant’s Report on Form 8-K on September 27, 2007).*
12 Computation of ratio of earnings to fixed charges.
14
Code of Ethics and Business Conduct (incorporated by reference to Exhibit 14 to the Registrant’s Annual Report on Form 10-K for2008).
21 Subsidiaries of the registrant.
23 Consent of PricewaterhouseCoopers LLP, Independent Registered Public Accounting Firm.
31.1 Certification (pursuant to Securities Exchange Act Rule 13a-14(a)) by Chief Executive Officer.
31.2 Certification (pursuant to Securities Exchange Act Rule 13a-14(a)) by Principal Financial Officer.
31.3 Certification (pursuant to Securities Exchange Act Rule 13a-14(a)) by Principal Accounting Officer.
32.1 Section 1350 Certification (pursuant to Sarbanes-Oxley Section 906) by Chief Executive Officer.
32.2 Section 1350 Certification (pursuant to Sarbanes-Oxley Section 906) by Principal Financial Officer.
32.3 Section 1350 Certification (pursuant to Sarbanes-Oxley Section 906) by Principal Accounting Officer.
101 Interactive data files. * Compensatory plan or arrangement required to be identified pursuant to Item 15(a)(3) of this Annual Report on Form 10-K.
The registrant has not filed with this report copies of the instruments defining the rights of holders of long-term debt of the registrant and its subsidiaries forwhich consolidated or unconsolidated financial statements are required to be filed. The registrant agrees to furnish a copy of any such instrument to the Securitiesand Exchange Commission upon request.
122
EXHIBIT 10(iii) (f.5)
November 23, 2010
Exxon Mobil CorporationExtended Provisions for Restricted Stock Unit Agreements - Settlement in Shares
1. Effective Date and Credit of Restricted Stock Units. If Grantee completes, signs, and returns the signature page of this Agreement to the Corporation in
Dallas County, Texas, U.S.A. on or before March 9, 2011, this Agreement will become effective the date the Corporation receives and accepts the signaturepage in Dallas County, Texas, U.S.A. After this agreement becomes effective, the Corporation will credit to Grantee the number of restricted stock unitsspecified on the signature page. Subject to the terms and conditions of this Agreement, each restricted stock unit (“unit”) will entitle Grantee to receive insettlement of the unit one share of the Corporation’s common stock.
2. Conditions. If credited, the units will be subject to the provisions of this Agreement, and to such regulations and requirements as the administrative
authority of the Program may establish from time to time. The units will be credited to Grantee only on the condition that Grantee accepts such provisions,regulations, and requirements.
3. Restrictions and Risk of Forfeiture. During the applicable restricted periods specified in section 4 of this Agreement,
(a) the units under restriction may not be sold, assigned, transferred, pledged, or otherwise disposed of or encumbered, and any attempt to do so will benull and void; and
(b) the units under restriction may be forfeited as provided in section 6. 4. Restricted Periods. The restricted periods will commence when the units are credited to Grantee and, unless the units have been forfeited earlier under
section 6, will expire as follows, whether or not Grantee is still an employee: (a) with respect to 50% of the units, on November 23, 2015; and (b) with respect to the remaining units, on the later to occur of (i) November 23, 2020, or (ii) the first day of the calendar year immediately following the year in which Grantee terminates; exceptthat (c) the restricted periods will automatically expire with respect to all shares on the death of Grantee. 5. No Obligation to Credit Units. The Corporation will have no obligation to credit any units and will have no other obligation to Grantee with respect to the
subject matter of this Agreement if Grantee fails to complete, sign, and return the signature page of this Agreement on or before March 9, 2011. In addition,whether or not Grantee has completed, signed, and returned the signature page, the Corporation will have no obligation to credit any units and will have noother obligation to Grantee with respect to the subject matter of this Agreement if, before the units are credited:
(a) Grantee terminates (other than by death) before standard retirement time within the meaning of the Program, except to the extent the administrativeauthority of the Program determines Grantee may receive units under this Agreement; or
(b) Grantee is determined to have engaged in detrimental activity within the meaning of the Program; or (c) Grantee fails to provide the Corporation with cash for any required taxes due upon crediting the units, if Grantee is required to do so under section 7. 6. Forfeiture of Units After Crediting. Until the applicable restricted period specified in section 4 has expired, the units under restriction will be forfeited or
subject to forfeiture in the following circumstances:
TerminationIf Grantee terminates (other than by death) before standard retirement time within the meaning of the Program, all units for which the applicable restrictedperiods have not expired will be automatically forfeited as of the date of termination, except to the extent the administrative authority determines Granteemay retain units issued under this Agreement.
Detrimental activityIf Grantee is determined to have engaged in detrimental activity within the meaning of the Program, either before or after termination, all units for whichthe applicable restricted periods have not expired will be automatically forfeited as of the date of such determination.
Attempted transferThe units are subject to forfeiture in the discretion of the administrative authority if Grantee attempts to sell, assign, transfer, pledge, or otherwise disposeof or encumber them during the applicable restricted periods.
- 1 -
Applicable lawThe units are subject to forfeiture in whole or in part as the administrative authority deems necessary in order to comply with applicable law.
7. Taxes. Notwithstanding the restrictions on transfer that otherwise apply, the Corporation in its sole discretion may withhold units or shares, either at the
time of issuance, at the time the applicable restricted periods expire, or at any other time in order to satisfy any required withholding, social security, andsimilar taxes or contributions (collectively, “required taxes”). Withheld units or shares may be retained by the Corporation or sold on behalf of Grantee. Ifthe Corporation does not withhold units or shares to satisfy required taxes, in the alternative the Corporation may require Grantee to deposit with theCorporation cash in an amount determined by the Corporation to be necessary to satisfy required taxes. Notwithstanding any other provision of thisAgreement, the Corporation will be under no obligation to credit units or to deliver shares to Grantee in settlement of any units if Grantee fails timely todeposit such amount with the Corporation. The Corporation in its sole discretion may also withhold any required taxes from dividends paid on the units.
8. Form of Units; No Shareholder Status. The units will be represented by book-entry credits in records maintained by or on behalf of the Corporation.
Units will be unfunded and unsecured promises by the Corporation to deliver shares in the future upon the terms and subject to the conditions of thisAgreement. Grantee will not be a shareholder of the Corporation with respect to units prior to the time shares are actually registered in Grantee’s name insettlement of such units in accordance with section 9.
9. Settlement of Units. If and when the applicable restricted period expires with respect to any units, subject to section 7, the Corporation will issue shares,
free of restriction and registered in the name of Grantee, in settlement of such units. Such shares will be delivered promptly after such expiration to or forthe account of Grantee either in certificated form or by book-entry transfer in accordance with the procedures of the administrative authority in effect at thetime.
10. Change in Capitalization. If during the applicable restricted periods a stock split, stock dividend, or other relevant change in capitalization of the
Corporation occurs, the administrative authority will make such adjustments in the number of units credited to Grantee, or in the number and type ofsecurities deliverable to Grantee in settlement of such units and used in determining dividend equivalent amounts, as the administrative authority maydetermine to be appropriate. Any resulting new units or securities credited with respect to previously credited units that are still restricted under thisAgreement will be delivered to and held by or on behalf of the Corporation and will be subject to the same provisions, restrictions, and requirements asthose previously credited units.
11. Limits on the Corporation’s Obligations. Notwithstanding anything else contained in this Agreement, under no circumstances will the Corporation be
required to credit any units or issue or deliver any shares in settlement of units if doing so would violate any law or listing requirement that theadministrative authority determines to be applicable, or if Grantee has failed to provide for required taxes pursuant to section 7.
12. Receipt or Access to Program. Grantee acknowledges receipt of or access to the full text of the Program. 13. Dividend Equivalents. The Corporation will pay to Grantee cash with respect to each credited unit corresponding in amount, currency, and timing to cash
dividends that would be payable with respect to a share of common stock outstanding on each record date that occurs during the applicable restrictedperiod. Alternatively, the administrative authority may determine to reinvest such dividend equivalents in additional units which will be held subject to allthe terms and conditions otherwise applicable to units under this Agreement.
14. Addresses for Communications. To facilitate communications regarding this Agreement, Grantee agrees to notify the Corporation promptly of changes in
current mailing and email addresses. Communications to the Corporation in connection with this Agreement should be directed to the Incentive ProcessingOffice at the address given on the signature page of this Agreement, or to such other address as the Corporation may designate by further notice to Grantee.
15. Transfer of Personal Data. The administration of the Program and this Agreement involves the transfer of personal data about Grantee between and
among the Corporation, selected affiliates of the Corporation, and third-party service providers such as Morgan Stanley Smith Barney and Computershare(the Corporation’s transfer agent). This data includes Grantee’s name, age, contact information, work location, employment status, tax status, and relatedinformation. By accepting this award, Grantee authorizes the transfer of this data.
- 2 -
16. No Employment Contract or Entitlement to Other or Future Awards. This Agreement, the Corporation’s incentive programs, and Grantee’s selectionfor incentive awards do not imply or form a part of any contract or assurance of employment, and they do not in any way limit or restrict the ability ofGrantee’s employer to terminate Grantee’s employment. Grantee acknowledges that the Corporation maintains and administers its incentive programsentirely in its discretion and that Grantee is not entitled to any other or future incentive awards of any kind in addition to those that have already beengranted.
17. Governing Law and Consent to Jurisdiction. This Agreement and the Program are governed by the laws of the State of New York without regard to any
conflict of law rules. Any dispute arising out of or relating to this Agreement or the Program may be resolved in any state or federal court located withinDallas County, Texas, U.S.A. Grantee accepts that venue and submits to the personal jurisdiction of any such court. Similarly, the Corporation accepts suchvenue and submits to such jurisdiction.
18. Entire Agreement. This Agreement constitutes the entire understanding between Grantee and the Corporation with respect to the subject matter of this
Agreement.
- 3 -
EXHIBIT 12
EXXON MOBIL CORPORATION
COMPUTATION OF RATIO OF EARNINGS TO FIXED CHARGES Years Ended December 31, 2010 2009 2008 2007 2006 (millions of dollars) Income from continuing operations attributable to ExxonMobil $30,460 $19,280 $45,220 $40,610 $39,500 Excess/(shortfall) of dividends over earnings of affiliates accounted for by the equity method (596) (483) 921 (714) (579) Provision for income taxes 21,561 15,119 36,530 29,864 27,902 Capitalized interest (126) (25) (118) (181) (160) Noncontrolling interests in earnings of consolidated subsidiaries 938 378 1,647 1,005 1,051
Total adjusted earnings available for payment of fixed charges $53,506 $35,651 $85,771 $71,980 $69,160
Number of times fixed charges are earned 42.2 25.8 54.6 51.6 47.8
EXHIBIT 21 Subsidiaries of the Registrant (1), (2) and (3) — at December 31, 2010
Percentage ofVoting
SecuritiesOwned Directlyor Indirectly by
Registrant State or
Country of OrganizationAbu Dhabi Petroleum Company Limited (5) 23.75 United KingdomAera Energy LLC (5) 48.2 CaliforniaAl-Jubail Petrochemical Company (4) (5) 50 Saudi ArabiaAmpolex (CEPU) Pte Ltd 100 SingaporeAncon Insurance Company, Inc. 100 VermontBarnett Gathering, LP 100 TexasBEB Erdgas und Erdoel GmbH (4) (5) 50 GermanyCameroon Oil Transportation Company S.A. (5) 41.07 CameroonCaspian Pipeline Consortium (5) 7.5 Russia/KazakhstanCastle Peak Power Company Limited (5) 60 Hong KongChalmette Refining, LLC (4) (5) 50 DelawareCross Timbers Energy Services, Inc. 100 TexasEllora Energy Inc. 100 DelawareEsso Australia Resources Pty Ltd 100 AustraliaEsso Deutschland GmbH 100 GermanyEsso Erdgas Beteiligungsgesellschaft mbH 100 GermanyEsso Exploration and Production Angola (Block 31) Limited 100 BahamasEsso Exploration and Production Angola (Overseas) Limited 100 BahamasEsso Exploration and Production Chad Inc. 100 DelawareEsso Exploration and Production Nigeria (Deepwater) Limited 100 NigeriaEsso Exploration and Production Nigeria (Offshore East) Limited 100 NigeriaEsso Exploration and Production Nigeria Limited 100 NigeriaEsso Exploration and Production UK Limited 100 United KingdomEsso Exploration Angola (Block 15) Limited 100 BahamasEsso Exploration Angola (Block 17) Limited 100 BahamasEsso Highlands Limited 100 Papua New GuineaEsso Holding Company Singapore Limited 100 BahamasEsso Ireland Limited 100 IrelandEsso Italiana S.r.l. 100 ItalyEsso Malaysia Berhad 65 MalaysiaEsso Nederland B.V. 100 NetherlandsEsso Norge AS 100 NorwayEsso Petrolera Argentina Sociedad de Responsabilidad Limitada 100 ArgentinaEsso Petroleum Company, Limited 100 United KingdomEsso Pipeline Investments Limited 100 BahamasEsso Raffinage S.A.F. 82.89 FranceEsso Societe Anonyme Francaise 82.89 FranceEsso (Thailand) Public Company Limited 65.99 ThailandEsso Trading Company of Abu Dhabi 100 DelawareExxon Azerbaijan Limited 100 BahamasExxon Chemical Arabia Inc. 100 DelawareExxon Luxembourg Holdings LLC 100 DelawareExxon Mobile Bay Limited Partnership 100 DelawareExxon Neftegas Limited 100 BahamasExxon Overseas Corporation 100 Delaware
- 1 -
Percentage ofVoting
SecuritiesOwnedDirectly
or Indirectlyby
Registrant State or
Country of OrganizationExxon Overseas Investment Corporation 100 DelawareExxonMobil Abu Dhabi Offshore Petroleum Company Limited 100 BahamasExxonMobil Alaska Production Inc. 100 DelawareExxonMobil Asia Pacific Pte. Ltd. 100 SingaporeExxonMobil Australia Pty Ltd 100 AustraliaExxonMobil Belgium Finance 100 BelgiumExxonMobil Canada Energy 100 CanadaExxonMobil Canada Finance Company 100 CanadaExxonMobil Canada Hibernia Company Ltd. 100 CanadaExxonMobil Canada Ltd. 100 CanadaExxonMobil Canada Properties 100 CanadaExxonMobil Canada Resources Company 100 CanadaExxonMobil Capital N.V. 100 NetherlandsExxonMobil Catalyst Technologies LLC 100 DelawareExxonMobil Central Europe Holding GmbH 100 GermanyExxonMobil Chemical France 99.77 FranceExxonMobil Chemical Holland B.V. 100 NetherlandsExxonMobil Chemical Limited 100 United KingdomExxonMobil China Petroleum & Petrochemical Company Limited 100 BahamasExxonMobil de Colombia S.A. 99.686 ColombiaExxonMobil Delaware Holdings Inc. 100 DelawareExxonMobil Development Company 100 DelawareExxonMobil Egypt (S.A.E.) 100 EgyptExxonMobil Energy Limited 100 Hong KongExxonMobil Exploration and Production Malaysia Inc. 100 DelawareExxonMobil Exploration and Production Norway AS 100 NorwayExxonMobil Finance Company Limited 100 United KingdomExxonMobil Financial Services B.V. 100 NetherlandsExxonMobil France Holding SAS 100 FranceExxonMobil Gas Marketing Deutschland GmbH 100 GermanyExxonMobil Gas Marketing Deutschland GmbH & Co. KG 50 GermanyExxonMobil Gas Marketing Europe Limited 100 United KingdomExxonMobil Global Services Company 100 DelawareExxonMobil Holding Company Holland LLC 100 DelawareExxonMobil Holding Norway AS 100 NorwayExxonMobil Hong Kong Limited 100 Hong KongExxonMobil Hungary Finance Kft. 100 HungaryExxonMobil International Holdings Inc. 100 DelawareExxonMobil International Services 100 LuxembourgExxonMobil Italiana Gas S.r.l. 100 ItalyExxonMobil Kazakhstan Inc. 100 BahamasExxonMobil Kazakhstan Ventures Inc. 100 DelawareExxonMobil Libya Limited 100 BahamasExxonMobil Luxembourg 100 LuxembourgExxonMobil Luxembourg UK 100 LuxembourgExxonMobil Malaysia Sdn Bhd 100 MalaysiaExxonMobil Marine Limited 100 United KingdomExxonMobil Middle East Gas Marketing Limited 100 BahamasExxonMobil Oil & Gas Investments Limited 100 BahamasExxonMobil Oil Corporation 100 New York
- 2 -
Percentage ofVoting
SecuritiesOwnedDirectly
or Indirectlyby
Registrant State or
Country of OrganizationExxonMobil Oil Indonesia Inc. 100 Cayman IslandsExxonMobil Permian Basin Inc. 100 DelawareExxonMobil Petroleum & Chemical 100 BelgiumExxonMobil Petroleum & Chemical Holdings Inc. 100 DelawareExxonMobil Pipeline Company 100 DelawareExxonMobil Production Deutschland GmbH 100 GermanyExxonMobil Production Norway Inc. 100 DelawareExxonMobil Qatargas Inc. 100 DelawareExxonMobil Qatargas (II) Limited 100 BahamasExxonMobil Qatargas (II) Terminal Company Limited 100 BahamasExxonMobil Ras Laffan (III) Limited 100 BahamasExxonMobil Rasgas Inc. 100 DelawareExxonMobil Research and Engineering Company 100 DelawareExxonMobil Sales and Supply LLC 100 DelawareExxonMobil Southwest Holdings Inc. 100 DelawareExxonMobil Ventures Funding Ltd. 100 BahamasExxonMobil Yugen Kaisha 100 JapanFina Antwerp Olefins N.V. (5) 35 BelgiumFujian Refining & Petrochemical Co. Ltd. (5) 25 ChinaGolden Pass LNG Terminal Investments LLC 100 DelawareGolden Pass LNG Terminal LLC (5) 17.6 DelawareImperial Oil Limited 69.6 CanadaImperial Oil (an Ontario General Partnership) 69.6 CanadaImperial Oil Resources (an Alberta limited partnership) 69.6 CanadaImperial Oil Resources Limited 69.6 CanadaImperial Oil Resources N.W.T. Limited 69.6 CanadaImperial Oil Resources Ventures Limited 69.6 CanadaInfineum Holdings B.V. (5) 49.96 NetherlandsKyokuto Petroleum Industries, Ltd. (4) (5) 50 JapanMetroplex Barnett Shale LLC 100 DelawareMineraloelraffinerie Oberrhein GmbH & Co. KG (5) 25 GermanyMobil Australia Resources Company Pty Limited 100 AustraliaMobil California Exploration & Producing Asset Company 100 DelawareMobil Caspian Pipeline Company 100 DelawareMobil Cepu Ltd. 100 BermudaMobil Cerro Negro, Ltd. 100 BahamasMobil Corporation 100 DelawareMobil Equatorial Guinea Inc. 100 DelawareMobil Erdgas-Erdoel GmbH 100 GermanyMobil Exploration Indonesia Inc. 100 Cayman IslandsMobil North Sea Investment Limited 100 United KingdomMobil North Sea L.L.C. 100 DelawareMobil North Sea Production Limited 100 United KingdomMobil Oil Australia Pty Ltd 100 AustraliaMobil Oil Exploration & Producing Southeast Inc. 100 DelawareMobil Oil New Zealand Limited 100 New ZealandMobil Producing Nigeria Unlimited 100 NigeriaMobil Producing Texas & New Mexico Inc. 100 DelawareMobil Refining Australia Pty Ltd 100 AustraliaMobil Services (Bahamas) Limited 100 Bahamas
- 3 -
Percentage ofVoting
SecuritiesOwnedDirectly
or Indirectlyby
Registrant State or
Country of OrganizationMobil Yanbu Petrochemical Company Inc. 100 DelawareMobil Yanbu Refining Company Inc. 100 DelawareNederlandse Aardolie Maatschappij B.V. (4) (5) 50 NetherlandsPapua New Guinea Liquefied Natural Gas Global Company LDC (5) 33.2 BahamasQatar Liquefied Gas Company Limited (5) 10 QatarQatar Liquefied Gas Company Limited (2) (5) 24.15 QatarRas Laffan Liquefied Natural Gas Company Limited (5) 24.999 QatarRas Laffan Liquefied Natural Gas Company Limited (II) (5) 31.006 QatarRas Laffan Liquefied Natural Gas Company Limited (3) (5) 30 QatarSaudi Aramco Mobil Refinery Company Ltd. (4) (5) 50 Saudi ArabiaSaudi Yanbu Petrochemical Co. (4) (5) 50 Saudi ArabiaSeaRiver Maritime Financial Holdings, Inc. 100 DelawareSeaRiver Maritime, Inc. 100 DelawareSocieta a responsabilita limitata Raffineria Padana Olii Minerali - S.A.R.P.O.M. S.r.l. 74.14 ItalySouth Hook LNG Terminal Company Limited (5) 24.15 United KingdomTengizchevroil, LLP (5) 25 KazakhstanTerminale GNL Adriatico S.r.l. (5) 45 ItalyTonen Chemical Corporation 50.076 JapanTonen Chemical Nasu Corporation 50.076 JapanTonenGeneral Sekiyu K.K. 50.076 JapanToray Tonen Specialty Separator Godo Kaisha (5) 25.04 JapanTrend Gathering & Treating, LP 100 TexasXH, LLC 100 DelawareXTO Energy Inc. 100 DelawareXTO Offshore Inc. 100 Delaware NOTES:(1) For the purposes of this list, if the registrant owns directly or indirectly approximately 50 percent of the voting securities of any person and approximately
50 percent of the voting securities of such person is owned directly or indirectly by another interest, or if the registrant includes its share of net income ofany other unconsolidated person in consolidated net income, such person is deemed to be a subsidiary.
(2) With respect to certain companies, shares in names of nominees and qualifying shares in names of directors are included in the above percentages.(3) The names of other subsidiaries have been omitted from the above list since considered in the aggregate, they would not constitute a significant subsidiary
under Securities and Exchange Commission Regulation S-X, Rule 1-02(w).(4) The registrant owns directly or indirectly approximately 50 percent of the securities of this person and approximately 50 percent of the voting securities of
this person is owned directly or indirectly by another single interest.(5) The investment in this unconsolidated person is represented by the registrant’s percentage interest in the underlying net assets of such person. The
accounting for these unconsolidated persons is referred to as the equity method of accounting.
- 4 -
EXHIBIT 23
CONSENT OF INDEPENDENT REGISTERED PUBLIC ACCOUNTING FIRM We hereby consent to the incorporation by reference in the following Exxon Mobil Corporation Registration Statements on: Form S-3 (No. 33-8922) — Guaranteed Debt Securities of SeaRiver Maritime Financial Holdings, Inc. (formerly Exxon Shipping Company);
Form S-3 (No. 333-167787) — XTO Energy Inc. 2004 Stock Incentive Plan;
Form S-8 (Nos. 333-101175, — 1993 Incentive Program of Exxon Mobil Corporation; 333-38917, 33-51107 and 333-75659)
Form S-8 (Nos. 333-145188 — 2003 Incentive Program of Exxon Mobil Corporation; and 333-110494)
Form S-8 (Nos. 333-72955 — ExxonMobil Savings Plan; and 333-166576)
Form S-8 (No. 333-117980) — 2004 Non-employee Director Restricted Stock Plan;
Form S-8
(No. 333-164620)
—
Post-effective amendment no. 1 on Form S-8 to Form S-4 relating to XTO Energy Inc. 1998 Stock Incentive Plan and2004 Incentive Plan
of our report dated February 25, 2011, relating to the financial statements and the effectiveness of internal control over financial reporting, which appears in thisForm 10-K/A. /S/ PRICEWATERHOUSECOOPERS LLP Dallas, TexasFebruary 28, 2011
EXHIBIT 31.1
Certification by Rex W. TillersonPursuant to Securities Exchange Act Rule 13a-14(a)
I, Rex W. Tillerson, certify that: 1. I have reviewed this annual report on Form 10-K of Exxon Mobil Corporation;
2. Based on my knowledge, this report does not contain any untrue statement of a material fact or omit to state a material fact necessary to make the
statements made, in light of the circumstances under which such statements were made, not misleading with respect to the period covered by thisreport;
3. Based on my knowledge, the financial statements, and other financial information included in this report, fairly present in all material respects thefinancial condition, results of operations and cash flows of the registrant as of, and for, the periods presented in this report;
4. The registrant’s other certifying officers and I are responsible for establishing and maintaining disclosure controls and procedures (as defined in
Exchange Act Rules 13a-15(e) and 15d-15(e)) and internal control over financial reporting (as defined in Exchange Act Rules 13a-15(f) and 15d-15(f)) for the registrant and have:
(a) Designed such disclosure controls and procedures, or caused such disclosure controls and procedures to be designed under our supervision,
to ensure that material information relating to the registrant, including its consolidated subsidiaries, is made known to us by others withinthose entities, particularly during the period in which this report is being prepared;
(b) Designed such internal control over financial reporting, or caused such internal control over financial reporting to be designed under our
supervision, to provide reasonable assurance regarding the reliability of financial reporting and the preparation of financial statements forexternal purposes in accordance with generally accepted accounting principles;
(c) Evaluated the effectiveness of the registrant’s disclosure controls and procedures and presented in this report our conclusions about theeffectiveness of the disclosure controls and procedures, as of the end of the period covered by this report based on such evaluation; and
(d) Disclosed in this report any change in the registrant’s internal control over financial reporting that occurred during the registrant’s most
recent fiscal quarter (the registrant’s fourth fiscal quarter in the case of an annual report) that has materially affected, or is reasonably likelyto materially affect, the registrant’s internal control over financial reporting; and
5. The registrant’s other certifying officers and I have disclosed, based on our most recent evaluation of internal control over financial reporting, to theregistrant’s auditors and the audit committee of the registrant’s board of directors (or persons performing the equivalent functions):
(a) All significant deficiencies and material weaknesses in the design or operation of internal control over financial reporting which arereasonably likely to adversely affect the registrant’s ability to record, process, summarize and report financial information; and
(b) Any fraud, whether or not material, that involves management or other employees who have a significant role in the registrant’s internalcontrol over financial reporting.
Date: February 28, 2011
/s/ REX W. TILLERSON Rex W. Tillerson
Chief Executive Officer
EXHIBIT 31.2
Certification by Donald D. HumphreysPursuant to Securities Exchange Act Rule 13a-14(a)
I, Donald D. Humphreys, certify that: 1. I have reviewed this annual report on Form 10-K of Exxon Mobil Corporation;
2. Based on my knowledge, this report does not contain any untrue statement of a material fact or omit to state a material fact necessary to make the
statements made, in light of the circumstances under which such statements were made, not misleading with respect to the period covered by thisreport;
3. Based on my knowledge, the financial statements, and other financial information included in this report, fairly present in all material respects thefinancial condition, results of operations and cash flows of the registrant as of, and for, the periods presented in this report;
4. The registrant’s other certifying officers and I are responsible for establishing and maintaining disclosure controls and procedures (as defined in
Exchange Act Rules 13a-15(e) and 15d-15(e)) and internal control over financial reporting (as defined in Exchange Act Rules 13a-15(f) and 15d-15(f)) for the registrant and have:
(a) Designed such disclosure controls and procedures, or caused such disclosure controls and procedures to be designed under our supervision,
to ensure that material information relating to the registrant, including its consolidated subsidiaries, is made known to us by others withinthose entities, particularly during the period in which this report is being prepared;
(b) Designed such internal control over financial reporting, or caused such internal control over financial reporting to be designed under our
supervision, to provide reasonable assurance regarding the reliability of financial reporting and the preparation of financial statements forexternal purposes in accordance with generally accepted accounting principles;
(c) Evaluated the effectiveness of the registrant’s disclosure controls and procedures and presented in this report our conclusions about theeffectiveness of the disclosure controls and procedures, as of the end of the period covered by this report based on such evaluation; and
(d) Disclosed in this report any change in the registrant’s internal control over financial reporting that occurred during the registrant’s most
recent fiscal quarter (the registrant’s fourth fiscal quarter in the case of an annual report) that has materially affected, or is reasonably likelyto materially affect, the registrant’s internal control over financial reporting; and
5. The registrant’s other certifying officers and I have disclosed, based on our most recent evaluation of internal control over financial reporting, to theregistrant’s auditors and the audit committee of the registrant’s board of directors (or persons performing the equivalent functions):
(a) All significant deficiencies and material weaknesses in the design or operation of internal control over financial reporting which arereasonably likely to adversely affect the registrant’s ability to record, process, summarize and report financial information; and
(b) Any fraud, whether or not material, that involves management or other employees who have a significant role in the registrant’s internalcontrol over financial reporting.
Date: February 28, 2011
/s/ DONALD D. HUMPHREYS Donald D. Humphreys
Senior Vice President and Treasurer(Principal Financial Officer)
EXHIBIT 31.3
Certification by Patrick T. MulvaPursuant to Securities Exchange Act Rule 13a-14(a)
I, Patrick T. Mulva, certify that: 1. I have reviewed this annual report on Form 10-K of Exxon Mobil Corporation;
2. Based on my knowledge, this report does not contain any untrue statement of a material fact or omit to state a material fact necessary to make the
statements made, in light of the circumstances under which such statements were made, not misleading with respect to the period covered by thisreport;
3. Based on my knowledge, the financial statements, and other financial information included in this report, fairly present in all material respects thefinancial condition, results of operations and cash flows of the registrant as of, and for, the periods presented in this report;
4. The registrant’s other certifying officers and I are responsible for establishing and maintaining disclosure controls and procedures (as defined in
Exchange Act Rules 13a-15(e) and 15d-15(e)) and internal control over financial reporting (as defined in Exchange Act Rules 13a-15(f) and 15d-15(f)) for the registrant and have:
(a) Designed such disclosure controls and procedures, or caused such disclosure controls and procedures to be designed under our supervision,
to ensure that material information relating to the registrant, including its consolidated subsidiaries, is made known to us by others withinthose entities, particularly during the period in which this report is being prepared;
(b) Designed such internal control over financial reporting, or caused such internal control over financial reporting to be designed under our
supervision, to provide reasonable assurance regarding the reliability of financial reporting and the preparation of financial statements forexternal purposes in accordance with generally accepted accounting principles;
(c) Evaluated the effectiveness of the registrant’s disclosure controls and procedures and presented in this report our conclusions about theeffectiveness of the disclosure controls and procedures, as of the end of the period covered by this report based on such evaluation; and
(d) Disclosed in this report any change in the registrant’s internal control over financial reporting that occurred during the registrant’s most
recent fiscal quarter (the registrant’s fourth fiscal quarter in the case of an annual report) that has materially affected, or is reasonably likelyto materially affect, the registrant’s internal control over financial reporting; and
5. The registrant’s other certifying officers and I have disclosed, based on our most recent evaluation of internal control over financial reporting, to theregistrant’s auditors and the audit committee of the registrant’s board of directors (or persons performing the equivalent functions):
(a) All significant deficiencies and material weaknesses in the design or operation of internal control over financial reporting which arereasonably likely to adversely affect the registrant’s ability to record, process, summarize and report financial information; and
(b) Any fraud, whether or not material, that involves management or other employees who have a significant role in the registrant’s internalcontrol over financial reporting.
Date: February 28, 2011
/s/ PATRICK T. MULVA Patrick T. Mulva
Vice President and Controller(Principal Accounting Officer)
EXHIBIT 32.1
Certification of Periodic Financial ReportPursuant to 18 U.S.C. Section 1350
For purposes of 18 U.S.C. Section 1350, as adopted pursuant to Section 906 of the Sarbanes-Oxley Act of 2002, the undersigned, Rex W. Tillerson, the
chief executive officer of Exxon Mobil Corporation (the “Company”), hereby certifies that, to his knowledge: (i) the Annual Report on Form 10-K of the Company for the year ended December 31, 2010, as filed with the Securities and Exchange Commission on the
date hereof (the “Report”) fully complies with the requirements of section 13(a) or 15(d) of the Securities Exchange Act of 1934; and (ii) the information contained in the Report fairly presents, in all material respects, the financial condition and results of operations of the Company. Date: February 28, 2011
/s/ REX W. TILLERSON Rex W. Tillerson
Chief Executive Officer A signed original of this written statement required by Section 906 has been provided to Exxon Mobil Corporation and will be retained by Exxon MobilCorporation and furnished to the Securities and Exchange Commission or its staff upon request.
EXHIBIT 32.2
Certification of Periodic Financial ReportPursuant to 18 U.S.C. Section 1350
For purposes of 18 U.S.C. Section 1350, as adopted pursuant to Section 906 of the Sarbanes-Oxley Act of 2002, the undersigned, Donald D. Humphreys,
the principal financial officer of Exxon Mobil Corporation (the “Company”), hereby certifies that, to his knowledge: (i) the Annual Report on Form 10-K of the Company for the year ended December 31, 2010, as filed with the Securities and Exchange Commission on the
date hereof (the “Report”) fully complies with the requirements of section 13(a) or 15(d) of the Securities Exchange Act of 1934; and (ii) the information contained in the Report fairly presents, in all material respects, the financial condition and results of operations of the Company. Date: February 28, 2011
/s/ DONALD D. HUMPHREYS Donald D. Humphreys
Senior Vice President and Treasurer(Principal Financial Officer)
A signed original of this written statement required by Section 906 has been provided to Exxon Mobil Corporation and will be retained by Exxon MobilCorporation and furnished to the Securities and Exchange Commission or its staff upon request.
EXHIBIT 32.3
Certification of Periodic Financial ReportPursuant to 18 U.S.C. Section 1350
For purposes of 18 U.S.C. Section 1350, as adopted pursuant to Section 906 of the Sarbanes-Oxley Act of 2002, the undersigned, Patrick T. Mulva, the
principal accounting officer of Exxon Mobil Corporation (the “Company”), hereby certifies that, to his knowledge: (i) the Annual Report on Form 10-K of the Company for the year ended December 31, 2010, as filed with the Securities and Exchange Commission on the
date hereof (the “Report”) fully complies with the requirements of section 13(a) or 15(d) of the Securities Exchange Act of 1934; and (ii) the information contained in the Report fairly presents, in all material respects, the financial condition and results of operations of the Company. Date: February 28, 2011
/s/ PATRICK T. MULVA Patrick T. Mulva
Vice President and Controller(Principal Accounting Officer)
A signed original of this written statement required by Section 906 has been provided to Exxon Mobil Corporation and will be retained by Exxon MobilCorporation and furnished to the Securities and Exchange Commission or its staff upon request.
Exxon Mobil Corporation5959 Las Colinas BoulevardIrving, Texas 75039-2298
February 28, 2011
Exxon Mobil Corporation
2010 Annual Report on Form 10-K/A(Amendment No. 1)
Securities and Exchange Commission100 F Street N.E.Washington, D.C. 20549 Attention: EDGAR Document Control Dear Sirs: Transmitted with this cover note is the Amendment No. 1 to the Annual Report on Form 10-K filed on February 25, 2011.
Sincerely,
/s/ BEVERLEY A. BABCOCKBeverley A. BabcockAssistant Controller