28
2017 US Investment Monitor Tracking mobile capital investments during 2016

2017 US Investment MonitorTracking mobile capital investments during 2016


12017 US Investment Monitor Tracking mobile capital investments during 2016
States along the Gulf Coast continue to attract the greatest amounts of mobile capital investment among project types tracked in the USIM — for the sixth year in a row, Texas and Louisiana received more than 30% of all announced investment. In fact, these states claimed 40% of all investment announced in 2016. As seen in prior years, the top job-creating projects were announced in a varied group of states, led by Ohio, Texas, Virginia, Georgia and Florida. The Southeast region of the United States continues its trend in attracting the top job-creating mobile projects across a wide range of industries, from financial and professional services to durable manufacturing, with the Midwest region also attracting additional top job-creating mobile projects.
The USIM focuses on companies’ mobile capital investments, which are not tied to specific markets or geographies. Mobile capital investments include headquarters facilities, data and call centers, manufacturing facilities, distribution centers, and research facilities, which have a wide range of location options. Companies investing in these types of facilities are therefore free to pursue locations with high supply chain potential, low input costs, strong business incentives, growing industry clusters, and advantageous state and local tax systems. Because companies significantly research and analyze the relative merits of different locations before deciding where to invest, these mobile capital investments serve as indicators of a region’s or state’s long-term economic growth potential and competitiveness. The companies’ investment decisions also help inform other investors of investment opportunities and shape the decisions of state policymakers when formulating their economic development strategies.
2017 US Investment Monitor
Capital investment drives economic growth, and business investment in new plants and equipment continues to shape the US economy. This report tracks corporate investment in such facilities that have a location choice. The nearly 5,400 business investment announcements in 2016 that are analyzed in this 12th edition of the US Investment Monitor (USIM) accounted for more than $142 billion of capital investment in business facilities and more than 358,000 new and retained jobs in the United States.

2
Stories from the 2017 US Investment Monitor
Data from the nearly 5,400 project announcements that are analyzed in the 2017 USIM point to longer-term trends shaping economic development both regionally and across industries. The USIM is a leading indicator showing where new investment spending and jobs can be expected to occur over the next several years. Three stories highlighting the resilience of the US economy rise to the top in this year’s USIM:
1. The growth of data centers across the United States. The proliferation of information and technology has changed not only the daily life of people around the world, but also has changed how businesses operate and has created space for new companies in the data industry. This growth is reflected in investment and employment data from 2011 to 2016, including 2016 project announcements that will lead to new job creation through the end of the decade. Mobile capital investment decisions have led to announcements of data center projects in 18 states in 2016, and 40 states between 2011 and 2016.
2. Expanding footprint of e-commerce. As companies continue to expand, nearly 70 companies made 3 or more investments, often in multiple states, in 2016. Five companies collectively announced 17,659 jobs in 2016 and invested $2 billion. Nearly two-thirds of these investments were the construction of new facilities while approximately one-third were related to the expansion of multiple facilities. Most of these projects were related to either the construction or expansion of distribution warehouses for online retailers or companies in the transportation and logistics sector.
3. A lull in foreign inbound investment. Foreign investment spending announcements as a percentage of all investment spending announcements included in this year’s USIM declined from last year’s 22% to 8%. This downward trend in foreign direct investment (FDI) is shared by countries worldwide. According to the 2017 World Investment Report by the United Nations, even though the United States remained the largest FDI recipient, global flows of foreign direct investment decreased by approximately 2%. Investment by foreign companies contributed $12 billion to this year’s USIM, which is the lowest level since the 2007–09 recession and is $24 billion lower than the $36 billion of new investment by foreign companies in 2015.

32017 US Investment Monitor Tracking mobile capital investments during 2016
Key findings and insights Understanding the USIM
Project analysis criteria The USIM departs from typical analyses of aggregate business investment trends by analyzing specific projects that meet industry and announcement criteria for mobile capital investment.
The following criteria are used to identify USIM projects:
Project types: investments in most production and service facilities are included in the USIM database. Companies are categorized using North American Industry Classification System (NAICS) industry classification, but the project type is determined by the primary business activity occurring within a facility. In many cases, the company industry and project type are the same (e.g., a manufacturing facility expansion by a manufacturer), but in some cases the project type and industry are different (e.g., a headquarters or call center investment by a manufacturer). The analysis specifically excludes retail, entertainment, hospital, retirement home, museum, education, restaurant, hotel, airport and public infrastructure projects because these facilities are not considered to be highly mobile. However, headquarters, general management, back-office, call center, research, manufacturing and distribution facilities for all industries are included because these facilities are generally mobile with a location choice.
Announcement or construction date: projects by large firms involving significant capital investment or job creation are often announced when a site is officially chosen. Other project types (including expansion projects, machinery and equipment upgrades, and smaller projects) may not be publicized until they occur and are captured in the USIM database during that year. This USIM report includes projects that were announced in 2016 or began construction in 2016 without an announcement. Announced projects may have been, or may be, delayed or canceled.
Data sourcesStatistics on new projects were obtained from Conway Data’s New Plant database, corporate press releases and independent research by Ernst & Young LLP.
The nearly 5,400 announced projects in 2016 accounted for more than $142 billion of mobile capital investment and more than 358,000 new and retained jobs in the United States. Compared with last year this is $23 billion lower in capital investments and 44,000 fewer jobs, but approximately the same number of project announcements.
• China was the top investing nation, with more than $2.4 billion (21% of total foreign investment), followed by Japan, the United Kingdom and Germany, with $1.3 billion, $1.2 billion and $1.2 billion in capital investment, respectively.
• While chemical manufacturing projects rank highly, yet again, on the list of top 2016 investments, new wholesale and retail trade, accommodation and food services, and information investments were significant drivers of new job announcements.
• The states that attracted the most investment were led for the fourth year in a row by Louisiana and Texas. Three other states from the Southeast were among the top 10 states by amount of investment announced.
• The 10 states that attracted the most new or retained jobs in 2016 project announcements accounted for 56% of all jobs monitored in this year’s USIM.

4
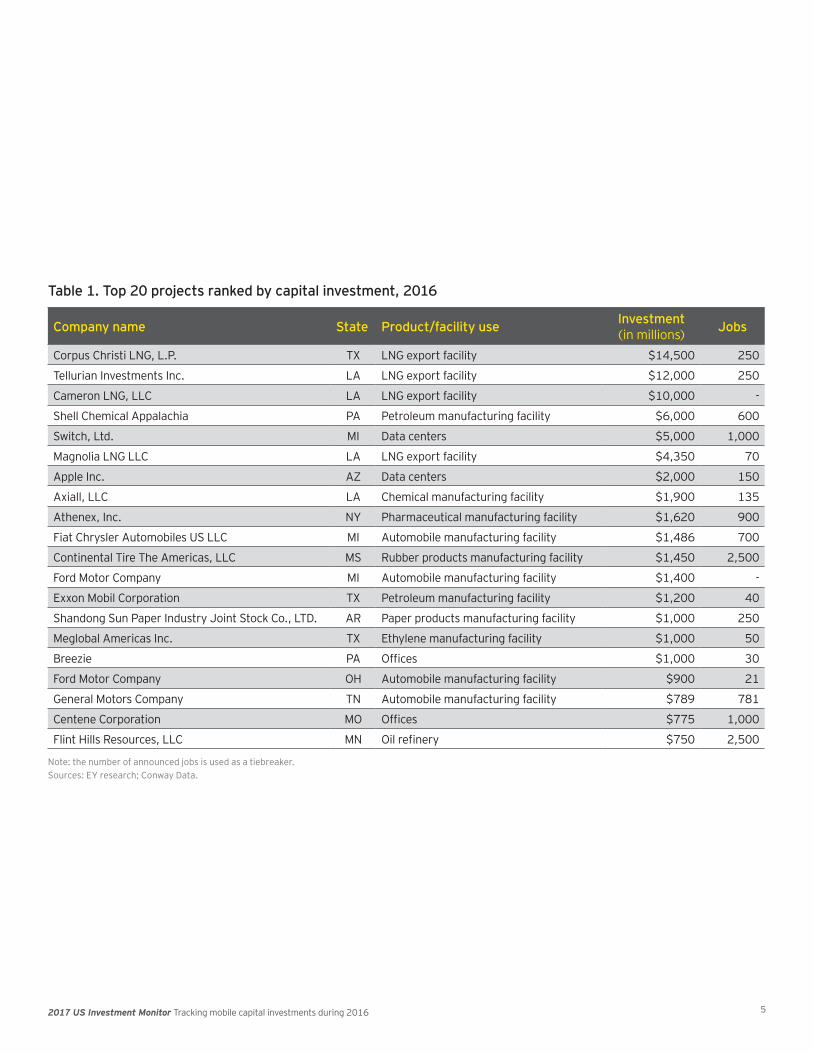
Every year, a large share of the total capital investment of monitored mobile projects is accounted for by the top 20 capital investment announcements. Table 1 summarizes these projects, which totaled more than $69 billion and accounted for 48% of capital investment announced in this year’s USIM.
Top 20 capital investment announcements
The largest capital investment announcement in 2016 was, for the sixth straight year, a natural gas liquefaction facility. Five of the remaining top six project announcements in 2016 also related to petroleum manufacturing and liquefied natural gas (LNG). Another prominent industry among the top 20 investment announcements in 2016 was automobile manufacturing. Large data centers, rubber, paper, chemicals, pharmaceutical and ethylene manufacturing investments were also announced in 2016.
The top 20 investment announcements in 2016 include only one project announced by a foreign-headquartered company. This is much lower than the average of 5.5 foreign investments seen in the top 20 each year from 2010 through 2015.
52017 US Investment Monitor Tracking mobile capital investments during 2016
Table 1. Top 20 projects ranked by capital investment, 2016
Company name State Product/facility use Investment (in millions) Jobs
Corpus Christi LNG, L.P. TX LNG export facility $14,500 250
Tellurian Investments Inc. LA LNG export facility $12,000 250
Cameron LNG, LLC LA LNG export facility $10,000 -
Shell Chemical Appalachia PA Petroleum manufacturing facility $6,000 600
Switch, Ltd. MI Data centers $5,000 1,000
Magnolia LNG LLC LA LNG export facility $4,350 70
Apple Inc. AZ Data centers $2,000 150
Axiall, LLC LA Chemical manufacturing facility $1,900 135
Athenex, Inc. NY Pharmaceutical manufacturing facility $1,620 900
Fiat Chrysler Automobiles US LLC MI Automobile manufacturing facility $1,486 700
Continental Tire The Americas, LLC MS Rubber products manufacturing facility $1,450 2,500
Ford Motor Company MI Automobile manufacturing facility $1,400 -
Exxon Mobil Corporation TX Petroleum manufacturing facility $1,200 40
Shandong Sun Paper Industry Joint Stock Co., LTD. AR Paper products manufacturing facility $1,000 250
Meglobal Americas Inc. TX Ethylene manufacturing facility $1,000 50
Breezie PA Offices $1,000 30
Ford Motor Company OH Automobile manufacturing facility $900 21
General Motors Company TN Automobile manufacturing facility $789 781
Centene Corporation MO Offices $775 1,000
Flint Hills Resources, LLC MN Oil refinery $750 2,500
Note: the number of announced jobs is used as a tiebreaker. Sources: EY research; Conway Data.

6
Investment in data centers across the United States continues to expand
Since 2011, capital investment in data centers has been growing, from a total investment of nearly $3 billion in 2011 to more than $10 billion in 2016 (as shown in Figure 1), and data centers is the industry with the third-highest level of investment in this year’s USIM. In total, 50 data center investments were announced in 2016, compared with an average of 38 from 2011 to 2016.
The $10 billion of investment comprises two main projects: Switch, Ltd.’s data center in Michigan, which represents $5 billion of investment, and Apple Inc.’s Arizona data center representing $2 billion of investment, both of which are described below:
• Switch, Ltd. announced a $5 billion investment in western Michigan where it plans to put two data centers on a campus designed for up to 1.8 million square feet of data center space. Switch provides secure housing for companies’ data equipment, and clients include eBay, Disney, Xerox, Zappos and Amazon.com. The site will create 1,000 jobs over 10 years, and so far almost 99% of the more than 700 construction and mission-critical workers are from Michigan. The entire campus is powered by 100% renewable energy, reflecting its company commitment to run all data centers on 100% renewable energy.
2,9992,232
6,364
1,372
7,793
10,446
3,446
884 9411,812
3,002 3,111
2011 2012 2013 2014 2015 2016
Capital investment ($mm) JobsCapital investment ($m)
Figure 1. Change in data center investment and job creation across the United States, 2011–16
Sources: Conway Data; EY analysis.

72017 US Investment Monitor Tracking mobile capital investments during 2016
Low investment in data centers
High investment in data centers
Alaska Hawaii
Figure 2. Announced investment in data center projects, total from 2011 to 2016Figure 2. Announced investment in data center projects, total from 2011 to 2016
Sources: EY research; Conway Data.
• Apple Inc. announced a $2 billion investment in a data center in Mesa, Arizona, that will serve as a “global command center” storing iCloud backups and iTunes files. The data center will create 500 temporary construction jobs and 150 permanent positions, including engineers, site services technicians and managers, operations shift managers and support analysis, and logistics strategy and oversight.
Investment in data centers has been spread throughout the United States in the period from 2011 to 2016, with 40 states receiving at least one data center investment in that time period, as shown in Figure 2. Moreover, no state received more than 17% of the total investment or 17% of the total jobs from 2011 to 2016, further demonstrating the spread of data centers. States that have received the highest amount of capital investment in data centers include Michigan, Texas, Virginia, Iowa and Arizona.

8
Natural gas-related investments lead the pack
The list of the top 20 mobile capital investment projects announced is again dominated by natural gas-related investments in 2016. Four of the top 10 announced facilities are LNG export facilities, along with 2 petroleum manufacturing facilities and an ethylene manufacturing facility in the top 20. These natural gas-related investments together represent capital investment spending of nearly $50 billion and will create 1,260 jobs. Two such facilities are described below:
• The largest single investment announced in 2016 was Corpus Christi LNG, L.P.’s announcement to build a $14.5 billion LNG export facility in San Patricio County, Texas. This investment is larger than any other included in the USIM since the 2007–09 recession. Further, the facility will be large enough to liquefy more than 690 billion cubic feet of US-produced natural gas per year. This would represent more than a fifth (22%) of the annual 3.17 trillion cubic feet of LNG exports that the US Energy Information Administration projects by 2022. After a construction period, the facility is expected to employ 250 workers annually. The facility is to be located 15 nautical miles from the coast of Corpus Christi Bay.
• The second-largest investment announced in 2016 is Tellurian Investments, Inc.’s planned $12 billion LNG facility, Driftwood LNG. The facility will be built in Calcasieu Parish, Louisiana, and will consist of five plants, each with four production units. The 800-acre site is expected to take about 7 years to complete, and is expected to bring about 3,500 construction jobs and 250 full-time jobs once the facility is fully operational.
In total, chemical manufacturing investments account for more than a third (34%) of all investment spending monitored in this study, and nearly 2% of the jobs created or retained by these projects, as shown in Figure 3. While the share of investment from chemical manufacturing has fallen from its share of 2015 investment spending, the share of investment from chemical manufacturing far exceeds any other industry (the second highest was motor vehicle and parts manufacturing, representing 9% of investment spending) and between 2010 and 2016, chemical manufacturing’s 2016 share of investment is second only to 2015’s share.
7%
13%
20%
33%
25%
40%
34%
2% 3% 3% 2% 3% 3% 2%
2010 2,011 2012 2013 2014 2015 2016
Chemical manufacturing as a percent of total investment
Chemical manufacturing as a percent of total jobs
Figure 3. Chemical manufacturing as a percent of total investment, 2010–16
Sources: Conway Data; EY analysis.

92017 US Investment Monitor Tracking mobile capital investments during 2016
Top 20 jobs announcements
The projects included in this year’s USIM are expected to create or retain more than 358,000 jobs across the United States. The 20 largest job-creating projects accounted for more than 34,000 jobs across a wide range of industries and facility types. These projects, summarized in Table 2, accounted for 10% of the total jobs announced in 2016.
Table 2. Top 20 projects ranked by new and retained jobs, 2016
Company name State Product/facility use Investment (in millions) Jobs
Continental Tire The Americas, LLC MS Rubber products manufacturing facility $1,450 2,500
Flint Hills Resources, LLC MN Oil refinery $750 2,500
Ochsner Health System LA Medical center $360 2,500
NRC Manufacturing, Inc. CA Electronic components manufacturer $0 2,500
Automatic Data Processing, Inc. FL Data centers $38 2,400
Lucid Motors AZ Automobile manufacturing facility $700 2,000
McDonald's Corporation IL Offices $0 2,000
Amazon.com, Inc. IL Distribution center $0 2,000
Amazon.com, Inc. IL Distribution center $0 2,000
NCR Corporation GA Offices $145 1,864
ALSAC/St.Jude Children's Hospital TN Medical center $1,000 1,800
Automatic Data Processing, Inc. VA Data centers $32 1,800
GlaxoSmithKline PA Pharmaceutical manufacturing facility $250 1,600
Automatic Data Processing, Inc. AZ Data centers $34 1,500
Amazon.com, Inc. OH Distribution center $0 1,500
Home Chef GA Distribution center $3 1,205
Aramark PA Offices $250 1,200
Wells Fargo AZ Offices $125 1,200
Charles Schwab & Co, Inc TX Offices $100 1,200
Snap Inc. CA Offices $0 1,194
Note: announced investment is used as a tiebreaker. Sources: EY research; Conway Data.

10
Changing consumer behavior growing the wholesale and retail trade industry
The wholesale and retail trade industry has shown continuing growth since the end of the recession in 2009, with employment having exceeded its pre-recession level in 2015. In 2015, total employment in the wholesale and retail trade industry was more than 21.5 million, a 1.7% increase from 2014. As Figure 4 shows, investments in the retail and wholesale trade industry in this year’s USIM suggest a continuation of this trend with more than 52,500 new or retained jobs announced, representing 15% of total jobs announced — the highest for the industry since 2011.
Of this year’s top 20 job announcements, four major job creating projects are in the wholesale and retail trade industry, as compared with two last year. Together, these projects account for nearly 20% of the top 20 jobs announcements.
• Amazon.com, one of the largest employers in the US, continued to expand its operations in the Midwest through three projects: two in Will County, Illinois, and one in Ohio.
• Amazon.com announced that it will open a new fulfillment center in Monee, Illinois. The 850,000-square-foot facility will hire 2,000 employees to pick, pack and ship small items like books, electronics and consumer goods. The company expects to start operations in Monee in October 2017. The state of Illinois has awarded the company nearly $28 million in tax credits for this project.1
• Amazon.com also announced the expansion of its operations in Joliet, Illinois, where it already employs 1,500 people. The expansion involves the addition of a new 700,000-square-foot distribution center across the street from the existing one. In creating 2,000 new jobs, the company will receive $42 million in tax credits from the state.2
• Etna, Ohio, was selected as the site of an 855,000-square-foot Amazon.com distribution center, set to create 1,500 jobs. The Ohio Tax Credit Authority awarded the company a 75% 15-year tax credit.3 This distribution center, along with another in Obetz, Ohio, are the first such Amazon.com facilities in the state.
• AmerisourceBergen, the wholesale drug company and market leader in pharmaceutical distribution, announced an investment of $113 million in Carrollton, Texas, in an effort to consolidate its North Texas workforce. The company plans to add more than 1,184 employees to its new regional headquarters. The state of Texas has awarded the company an estimated $15 million in tax credits.4
1 “EDGE Agreements,” Illinois Department of Commerce & Economic Opportunity website, https://www.illinois.gov/dceo/ExpandRelocate/Incentives/Pages/EdgeAgreements.aspx
2 Ibid.
3 “Amazon considering Etna and Obetz for pair of fulfillment centers,” Columbus Business First, http://www.bizjournals.com/columbus/blog/2015/07/amazon-considering-etna-and-obetz-for-pair-of.html, 27 July 2015.
4 “Drug firm to add more than 1,000 jobs with new $113M Carrollton campus,” Dallas Business Journal, http://www.bizjournals.com/dallas/news/2016/10/19/amerisourcebergen-to-add-more-than-1-000-jobs-with.html, 19 October 2016.
4% 4%
5% 5% 6% 6%
10% 10%
13%12%
14% 15%
2011 2012 2013 2014 2015 2016Industry share of investment Industry share of jobs
Figure 4. Wholesale and retail trade industry share of total investment and jobs, 2011 to 2016
Sources: Conway Data; EY analysis.

112017 US Investment Monitor Tracking mobile capital investments during 2016
One company, multiple investments
The trend of companies announcing multiple project announcements was seen in this year’s USIM. For example, both FedEx and United Parcel Service announced more than 10 project investments in various states this year. FedEx Corporation, headquartered in Memphis, Tennessee, announced a total of 21 projects. All except one project were distribution centers, and the remaining project was an office expansion. FedEx’s biggest project investment was in Pennsylvania, with announced investment totaling $335 million and adding 680 new jobs. United Parcel Service, headquartered in Georgia, is one of the largest global package delivery companies. The company announced a total of 13 projects this year, 4 of which will take place in Texas. Both FedEx and United Parcel Service’s total investments in 2016 exceeded $700 million and both have chosen Illinois, New Jersey, Ohio, Pennsylvania, Tennessee and Texas among other states to expand existing operations or add new facilities.
Not only are these companies investing in more locations, but their average investment size and number of jobs created per investment is greater than the overall average level in this year’s USIM. On average, the projects included in this year’s USIM announced a capital investment of $26.6 million and job creation of 67 jobs. In comparison, of companies that announced at least 5 projects in 2016, announcements averaged $71.3 million in investment and on average created 125 jobs.
Other companies announcing multiple investments include:
• General Motors Company announced seven investments in 2016. The investments are generally centered in the Midwest, with two investments announced in both Ohio and Tennessee and one announced in Michigan, Kentucky and Indiana. All 7 of their announced investments are facility expansion projects, in total creating or retaining 937 jobs and accounting for $2.4 billion in investment.
• Wal-Mart Stores, Inc. announced eight investments in 2016, including two new facilities and five expansions. The investments were located throughout the United States, including two projects each in Alabama and Louisiana, along with projects in Indiana, Texas, Virginia and California. The announcements total $180 million in investment and create or retain 1,146 jobs.
• Of the five investments Facebook, Inc. announced in 2016, four are new facilities and one is an expansion. The projects are spread out throughout the country, including in Washington, New Mexico, Texas, Pennsylvania and New York. These expansions include Facebook, Inc.’s new data center announced in New Mexico that will account for $250 million of investment and create high-paying tech jobs.

12
Industry summary
Investment in mobile capital projects and the resulting new and retained jobs created are summarized by industry in Table 3.
As noted above, projects capturing high amounts of investment include LNG export facilities chemical manufacturing facilities, and motor vehicle manufacturing facilities. Chemical manufacturing alone accounts for more than 34% of all investment, and nondurable manufacturing as an industry overall is more than half of 2016’s announced capital investment (56%). Additionally, durable manufacturing plays a strong role; industries including machinery, motor vehicle, and semiconductor manufacturing continue to be important investments in the US, accounting for more than $24 billion in investment announcements.
Over the 10 years of the USIM there has been a general shift away from labor-intensive projects as technology has made significant strides, especially in the manufacturing sectors. However, durable manufacturing and office facilities for business support and professional services were still key jobs creators, according to 2016 project announcements. Other industries poised to add significant employment include wholesale and retail trade, as well as professional services, finance, insurance, and real estate services, and food, beverage, and tobacco manufacturing. These industries are generally more labor-intensive than industries such as chemical manufacturing.

132017 US Investment Monitor Tracking mobile capital investments during 2016
Table 3. Announced capital investment and jobs in US facilities, 2016
Sector Industry Investment (in millions) Jobs
Agriculture, mining, construction
Agriculture, forestry, fishing and hunting $452 2,908 Construction $1,148 5,510 Mining including oil and gas extraction $943 2,049 Subtotal: agriculture, mining, construction $2,543 10,467
Durable manufacturing
Machinery and fabricated metal manufacturing $5,317 25,033 Motor vehicle and parts manufacturing $12,985 24,688 Other durable manufacturing $4,537 20,483 Semiconductor and electronic component manufacturing $1,655 13,190 Subtotal: durable manufacturing $24,495 83,394
Financial and professional services
Business support services $1,420 18,138 Finance, insurance and real estate services $4,556 28,550 Health care and social assistance $345 3,530 Management of companies and enterprises $689 4,869 Professional services $2,971 42,431 Subtotal: financial and professional services $9,981 97,518
Information Data centers $10,466 10,058 Information $2,674 15,320 Subtotal: information $13,140 25,378
Nondurable manufacturing
Chemical manufacturing $48,956 6,313 Food, beverage and tobacco product manufacturing $7,178 18,627 Other nondurable manufacturing $4,447 12,457 Petroleum and coal products manufacturing $8,986 1,378 Pharmaceutical manufacturing $4,555 9,260 Rubber and plastics manufacturing $4,467 12,943 Subtotal: nondurable manufacturing $78,590 60,978
Trade and transport
Transport, storage and logistics $3,644 15,860 Wholesale and retail trade $8,573 52,518 Subtotal: trade and transport $12,217 68,378
Other services Accommodation and food services $944 5,721 Arts, entertainment and recreation $10 290 Educational services $55 948 Waste management $476 1,263 Other services $291 3,691 Subtotal: other services $1,775 11,913
Total $142,741 358,026
Note: figures may not appear to sum due to rounding. Sources: EY research; Conway Data.

14
Project size
While attention is often focused on the megaprojects in any given year, projects under $250 million in capital investment accounted for 99% of project announcements and 94% of total jobs announced in 2016. The 1% of projects announced in 2016 involving $500 million in investment accounted for 5% of total announced employment (see Figure 5).
Figure 6 shows the distribution of projects by the number of new or retained jobs. Only 122 project announcements (approximately 2% of total projects) in 2016 involved 500 or more jobs, of which only 34 projects (less than 1% of total projects) supported 1,000 or more jobs. Sixty-eight percent of projects announced fewer than 50 jobs created or retained, up from 66% in 2015.
These small but numerous projects are important drivers of economic development in most states. The average project size was less than $30 million for 7 of the 10 states with the most project announcements. Of these states, only Michigan, Pennsylvania and Texas had an average project size of greater than $30 million — the average project size in those states was $54 million in Michigan, $47 million in Pennsylvania, and $40 million in Texas. Michigan’s $54 million average project size is more than twice its 2015 average project size of $23 million — increasing in part because of the Switch, Ltd. data center bringing in $5 billion of investment to Michigan. For the fifth straight year, Texas led the nation and Ohio placed second in the number of announcements of new capital investment projects, shown in Figure 7.
639
511429
274234 230 223 217 189 184
TX OH IL NC KY VA CA PA GA MI
Figure 7. Top 10 states by number of project announcements, 2016
75%
19%
5% 1% 1%
53%
28%
12%2% 5%
$0 to $9 $10 to $49 $50 to $249 $250 to $499 $500+
Share of project announcementsShare of new employment
Figure 5. Share of project announcements and total new employment by project capital investment size (in millions), 2016
Note: figures may not appear to sum due to rounding. Sources: EY research; Conway Data.
68%
20%
5% 4% 2% 1%
0-49 50-149 150-249 250-499 500-000 1,000+0–49 50–149 150–249 250–499 500–999 1,000+
Figure 6. Share of project announcements by total jobs created or retained, 2016
Note: chart includes only projects with disclosed employment information. Figures may not appear to sum due to rounding.
Sources: EY research; Conway Data.

152017 US Investment Monitor Tracking mobile capital investments during 2016
Capital intensity
As Figure 8 shows, capital expenditure per job for projects announced in 2016 varied widely across sectors. Chemical manufacturing projects were by far the most capital-intensive, averaging $7.8 million per job, approximately 19 times the average capital intensity of $0.4 million across all 2016 project announcements. Capital intensity for other nondurable manufacturing projects was lower, averaging $542,000 per job, slightly higher than the 2015 level of $380,000 per job.
Durable manufacturing projects were less capital-intensive, averaging only $290,000 per new or retained job. These projects tend to be accompanied by large workforces, particularly in the transportation, machinery and fabricated metal manufacturing sectors. Financial and professional services continued to be the least capital-intensive industry monitored in the USIM, with $102,000 of fixed investment per job, a 60% increase from $64,000 of fixed investment per job in 2015 but a 1% increase from $101,000 in 2014. The top 20 projects ranked by capital expenditure are among the most capital-intensive projects, with an average $6.2 million of capital investment per job, compared with an average of $4.4 million per job for all projects announced in 2015.
Figure 8. Capital intensity of projects by sector, 2016 (announced capital investment vs. announced jobs)
100K
90K
80K
70K
60K
50K
40K
30K
20K
10K
0K
Jobs
Financial and professional services
Durablemanufacturing
Other nondurablemanufacturing
Trade andtransport
Agriculture, miningand construction
Other services
Information
Investment
Chemicalmanufacturing
2016 average: $399,000per job announced
0B 5B 10B 15B 20B 25B 30B 35B 40B 45B 50B
Number of projects
50
500
1,000
1,384
Note: circles are sized according to the number of project announcements in that industry in 2016.Sources: EY research; Conway Data.

16
Investment by type of facility
Table 4 summarizes mobile capital investments in 2016 by facility type. Investments in new or expanded industrial facilities accounted for the majority of announced projects, representing 72% of announced investments ($103 million) and 40% of jobs (144,495). In 2015, industrial facilities accounted for 76% and 42% of investment and jobs, respectively. Investments in LNG production and export facilities (more than $40 million in investments) and petroleum refineries led industrial facility project announcements in 2016. Industrial facilities have consistently represented more than 60% of project announcements in the USIM.
Office and research facilities (including office headquarters) accounted for 13% of total announced investments and 37% of jobs, compared with 11% of investment and 34% of jobs last year. Large investments in office and research facilities include new headquarters for Breezie, a start-up that makes tablets user-friendly for senior citizens, in Pittsburgh, Pennsylvania, and expanded Centene Corporation headquarters in St. Louis, Missouri.
Announced distribution and warehousing facilities projects, led by 4,000 new and retained Amazon.com jobs in Wills County, Illinois, comprised 17% of announced jobs. Data center investment grew by 36% from 2015 to 2016, with the total investment for such facilities rising to more than $10 billion. Call centers accounted for 6% of new and retained jobs, which marks a decline from last year.
Table 4. Announced mobile capital investments by facility type, 2016
Facility type Investment (in millions) % of total Jobs % of total
Industrial facilities $103,380 72% 144,495 40%
Office and research facilities 18,297 13% 132,434 37%
Distribution and warehousing 11,816 8% 60,128 17%
Data center 10,200 7% 2,999 1%
Call center 409 0% 22,270 6%
Total $144,101 362,326
Note: figures may not appear to sum due to rounding.Sources: EY research; Conway Data.

172017 US Investment Monitor Tracking mobile capital investments during 2016
Foreign investment
In 2016, total capital investment in new and expanded US facilities announced by foreign companies accounted for 8% of the investment monitored, exceeding $11 billion. Table 5 summarizes the sources of foreign investment based on the global ultimate parent company of an announced project.
The manufacturing industry remained the top industry among foreign investment projects with 85% of all announced foreign investment. More than half of the total foreign investment (57%) was in nondurable goods manufacturing and 28% was in durable goods manufacturing. Durable goods manufacturing includes products such as semiconductor and electronic components, motor vehicles and automobile parts. A closer look at the foreign investment projects shows that chemical manufacturing led the way with 17% of total announced investment related to foreign investors.
The manufacturing sector also leads the ranking of new or retained foreign-parent-company jobs by industry with a 71% share. This is partially due to the sector’s large share of total foreign investment. The motor vehicle and parts manufacturing industry and the pharmaceutical manufacturing industry were the top job-creating industries, each with approximately 12% of announced jobs by related to foreign investors.
As shown in Table 5, China was the top investing nation in 2016, with more than $2.4 billion of mobile capital investment project spending in the United States — 21% of total foreign investment. Following China were Japan and the United Kingdom, each with more than $1 billion of mobile capital investment. The United Kingdom also created the most jobs among all investing nations with more than 5,400 jobs, largely driven by pharmaceutical manufacturing and motor vehicle manufacturing industries.
Table 5. Announced foreign investment and job announcements in US facilities by origin country, 2016
Investing country Investment (in millions) Jobs
China $2,413 3,131 Japan 1,288 1,143 United Kingdom 1,190 5,472 Germany 1,169 3,882 Switzerland 757 447 Netherlands 741 494 Canada 704 2,353 Austria 655 323 United Arab Emirates 500 300 France 411 1,895 Subtotal 9,826 19,440 Other countries 1,892 6,550 Total foreign investment 11,718 25,990 US investment $131,023 332,036 Total, all investment $142,741 358,026
Note: the overall distribution of investment and jobs by investing country is assumed to be consistent with the distribution among projects for which we know the investing country. Figures may not appear to sum due to rounding.Sources: EY research; Conway Data.

18
Although the majority of the top three foreign nations’ total investment announcements were in the manufacturing industry, each country’s investment had a different manufacturing subsector focus. The majority (80%) of China’s manufacturing investment was on nondurable products, with this year’s largest foreign investment project totaling $1 billion by Sun Paper Company. Japan’s manufacturing investment spread more evenly between nondurable and durable goods manufacturing that included automotive and machinery manufacturing, and the United Kingdom’s investment focused primarily on automotive and pharmaceutical manufacturing.
The rest of the top five investing nations in 2016 included Germany and Switzerland, with $1.2 billion and $757 million of capital investment spending announced, respectively.
• The largest capital investment made by a foreign company was by Sun Paper Industry Company, a paper product manufacturer headquartered in Shandong province, China. Sun Paper will invest $1 billion to build a bio product mill at Clark Country, Arkansas, creating 250 new direct jobs. This is the first facility that Sun Paper has invested in North America and is among the largest investments in Arkansas.
• UK-based GlaxoSmithKline (GSK) claimed this year’s top job-creating foreign investment with the announcement of a new R&D facility in Philadelphia, Pennsylvania. GSK will spend $250 million to build out the new smart labs with the aim to increase collaboration and expedite new medicines development. Scientists from other GSK locations in the US will relocate to this new facility and total headcount at the new facility will reach 1,600 jobs. When asked about the new facility’s location choice, the company’s Senior Vice President commented on the abundance of the area’s academic institutions and a growing scene of biotech excellence in the Philadelphia area.
• Foreign automobile manufacturers continued to invest and upgrade their US facilities. London-based Fiat Chrysler announced an investment of $700 million in the Toledo Assembly Complex in Ohio to produce the next iteration of the Jeep Wrangler. The company will add 700 new jobs as the production capacity expands. Japanese automotive manufacturer Toyota Motor planned to further grow its plant operation in West Virginia and announced a $400 million investment at the plant’s 20th anniversary celebration. This investment will largely help bring in new technology that allows for better Toyota vehicle fuel economy.

192017 US Investment Monitor Tracking mobile capital investments during 2016
Low foreigncapital investment to total ratio
High foreign capital investment
to total ratio
Alaska Hawaii
Figure 2. Announced investment in data center projects, total from 2011 to 2016Figure 9. Announced foreign investment as a share of total announced investment
The top five states ranked by total foreign investment spending in 2016 were Texas, South Carolina, Arkansas, Georgia and Alabama due to the announcements of large projects by foreign chemical manufacturing, rubber and plastics manufacturing, and durable goods manufacturing companies. As shown in Figure 9, the East Coast of the United States received a high percentage of total investment from foreign sources. Over the past several years, the coastal regions in general have received more foreign investment than the interior of the US, a trend that continues in this year’s USIM as well.
Sources: EY research; Conway Data.

20
Top states by capital investment
Capital investment is an essential ingredient in long-run economic development, and states continued to compete for capital investments in major new facilities in 2016. The 10 states that were the most successful in attracting this investment in 2016 are shown in Figure 10. Projects announced in these states accounted for 71% of total mobile capital investment announced during 2016.
Louisiana: attracted $31.3 billion in mobile capital investment, more than any other state this year. For the 6th straight year, Louisiana claimed at least 4 of the top 20 largest projects. These four projects alone account for more than $28 billion in investment announcements, and all four investments were made by companies in the chemical manufacturing sector. With ready access to both natural gas pipelines and shipping ports, Louisiana continued to benefit from the US shale gas boom — capturing nearly $28 billion in investment from the chemical manufacturing industry, or 58% of the industry’s total new investment.
One of the largest Louisiana investments ($12 billion) was by Tellurian investments. The US-based company is partnering with GE Oil & Gas for their Driftwood liquefied natural gas project, which aims to provide low-cost liquefaction. Additionally, Sempra Energy’s Cameron LNG will invest $10 billion to expand and add liquefaction units.
“Business climate is really driving a lot of the growth … A fair, understandable tax structure, transparent and straightforward regulatory structure combined with workforce and infrastructure make an attractive package for businesses across many different sectors. Texas has been good at attracting global companies, attracting Fortune 500 businesses and great in certain areas of the state at supporting start-ups.”
— Bryan Daniel, Executive Director of the Office of the Governor, Texas Economic Development and Tourism Division
Figure 10. Top 10 states for mobile capital investment (in millions)
$31.6
$25.4
$10.2 $9.9
$6.1 $5.7$3.9 $3.6 $3.3 $3.2
$25.1$27.7
$7.4$4.7 $5.9
$4.1$2.7 $2.9 $3.7 $3.6
LA TX PA MI OH TN VA AZ SC GA
2016 2011-20152011–2015
Sources: EY research; Conway Data.

212017 US Investment Monitor Tracking mobile capital investments during 2016
Texas: attracted $25.4 billion in mobile investment in 2016, second only to Louisiana. In each of the last 11 annual US Investment Monitors, Texas has ranked in the top 3 states for capital investment. Texas’ natural resources, central location and proximity to the Gulf of Mexico make it a highly desirable location for capital-intensive facilities in the chemical manufacturing and for LNG export. The top three sectors that invested in Texas were chemical manufacturing, petroleum and coal products manufacturing, and wholesale and retail trade.
Pennsylvania: for the fourth time in six years, Pennsylvania ranks in the top five states by capital investment. Total investment in 2016 was $10.2 billion, up from $2.3 billion in 2015. This was also 38% greater than the past five-year capital investment average (2011–15) of $7.4 billion. Pennsylvania attracted 2 of the top 20 largest projects this year. The biggest project that Pennsylvania attracted was a $6 billion investment by Shell Chemical to build a petrochemical complex near the Pittsburgh area. The second largest investment project in Pennsylvania was announced by Breezie, a technology company that makes tablets more user-friendly, especially to senior citizens. The company has announced that it will invest $1 billion in the Pittsburgh area.
Michigan: Michigan attracted $9.9 billion in mobile investment in 2016, nearly double the $5.01 billion it had attracted in 2015. For the fifth year in a row, Michigan ranks in the top 10 states by capital investment. Data centers attracted half of the announced investments, and the motor vehicle and parts manufacturing industry attracted an additional $3.4 billion in investment. Michigan has long been a hub for the motor vehicle and parts manufacturing industry in the United States.
A quarter of all investments announced by that industry in 2016 were made in Michigan. The main data center project in Michigan was Switch, Ltd., a $5 billion investment in West Michigan. Switch CEO Rob Roy was quoted as saying that without the tax incentives Michigan provided, “Switch couldn’t build in Michigan.”
Figure 11 shows capital investment per dollar of state GDP to show investment levels in relation to economy size for each state. Louisiana had the highest ratio of capital investment relative to state GDP by far, followed by Michigan, Mississippi, Arkansas and Texas.
Low capital investment to GDP ratio
High capitalinvestment to
GDP ratio
Alaska Hawaii
Figure 2. Announced investment in data center projects, total from 2011 to 2016Figure 11. Mobile capital investment as a percentage of state GDP, 2016
Sources: EY research; Conway Data; US Bureau of Economic Analysis.

22
“Ohio has a large workforce and that population continues to grow. There are more than 35,000 new graduates every year from Ohio universities. Additionally, you cannot replicate where Ohio sits on a map. A location within one day’s drive of more than 60 percent of North America’s manufacturing capacity … Ohio has turned a deficit into a balanced budget, including $2 billion in budget reserves. Taxes have been reduced by $5 billion, more than any other state. More than 459,000 new private sector jobs have been created since January 2011 — about twice the average for states in our region. … We’re diversifying Ohio’s economy by focusing on targeted sectors and growing cutting-edge jobs of the future.”
— Lee Crume, JobsOhio
Top states by announced jobs
5 The announcement was made in November 2015; we captured the project in this year’s study because it was not included i past USIM reports.
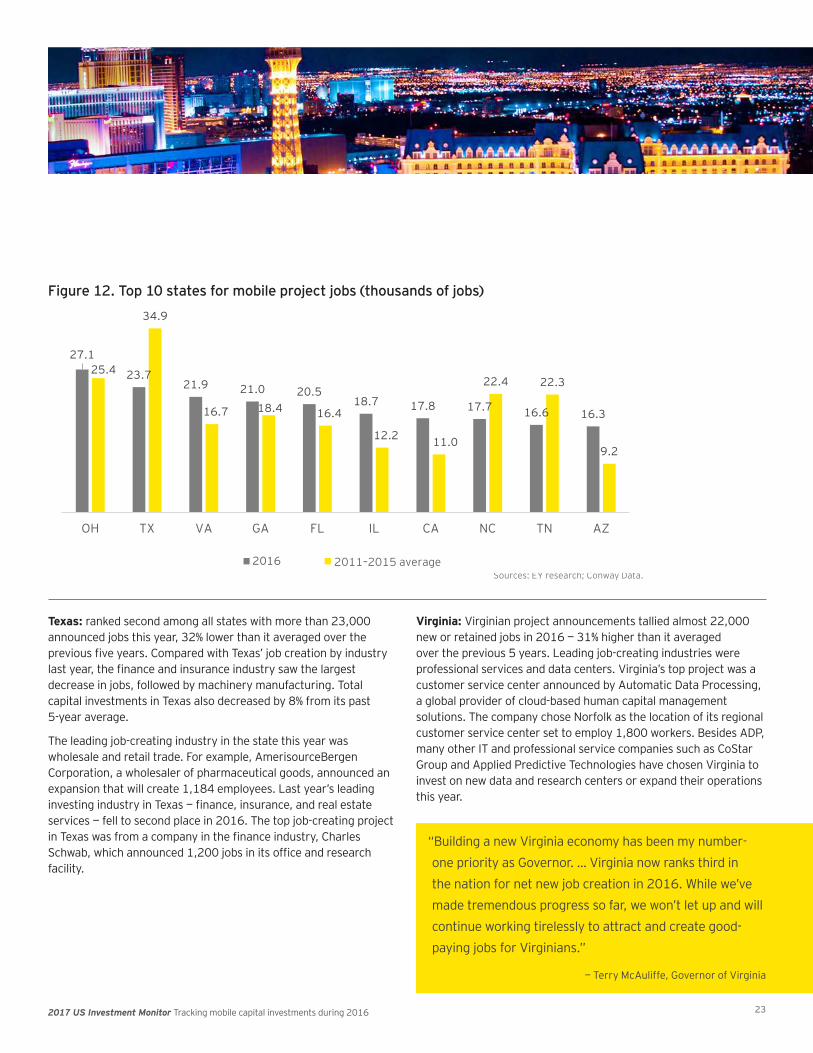
In 2016, projects monitored by the USIM announced more than 358,000 new and retained jobs, an 11% decrease from last year’s total jobs and an 8% decrease compared with the average of the past five years. Figure 12 shows the job creation announcements from the top 10 states, and 3 out of the top 10 states this year showed a decrease in jobs compared with their past 5-year average. Total job creation announcements from the top 10 states accounted for 56% of all job creation announcements this year.
Ohio: has consistently ranked among the top five states for job creation announcements since 2007 and rose to the top state this year in new and retained jobs. Approximately 27,000 new and retained jobs were created in Ohio in 2016, a 6% increase from the state’s 5-year average of announced new and retained jobs. The top two job-creating industries this year were professional services and wholesale and retail trade, each contributing to almost 20% of Ohio’s total jobs this year. The top job-creating project was announced by the retail giant Amazon.com.5 The company announced it would build its first Ohio fulfillment center that would generate 1,500 jobs. Many professional services companies such as Paycor Inc, Medpace, and Recker Consulting announced they would expand their operations in Ohio and qualified for Job Creation Tax Credits as a result of generating new jobs.
Durable goods manufacturing remained a strong sector for creating jobs in Ohio. Half of the total jobs generated by companies in durable manufacturing came from those that manufacture automobile and motor vehicle parts. For example, Tenneco Automotive Operating Company announced a $98.5 million investment in its engine facility expected to create 483 jobs in Ohio. Ford Motor continued to invest and bring in jobs to its Cleveland engine plant.
232017 US Investment Monitor Tracking mobile capital investments during 2016
Figure 12. Top 10 states for mobile project jobs (thousands of jobs)
Sources: EY research; Conway Data.
27.1
23.721.9 21.0 20.5
18.7 17.8 17.7 16.6 16.3
25.4
34.9
16.7 18.4 16.4
12.2 11.0
22.4 22.3
9.2
OH TX VA GA FL IL CA NC TN AZ
2016 2011- 2015 average2011–2015 average
Texas: ranked second among all states with more than 23,000 announced jobs this year, 32% lower than it averaged over the previous five years. Compared with Texas’ job creation by industry last year, the finance and insurance industry saw the largest decrease in jobs, followed by machinery manufacturing. Total capital investments in Texas also decreased by 8% from its past 5-year average.
The leading job-creating industry in the state this year was wholesale and retail trade. For example, AmerisourceBergen Corporation, a wholesaler of pharmaceutical goods, announced an expansion that will create 1,184 employees. Last year’s leading investing industry in Texas — finance, insurance, and real estate services — fell to second place in 2016. The top job-creating project in Texas was from a company in the finance industry, Charles Schwab, which announced 1,200 jobs in its office and research facility.
Virginia: Virginian project announcements tallied almost 22,000 new or retained jobs in 2016 — 31% higher than it averaged over the previous 5 years. Leading job-creating industries were professional services and data centers. Virginia’s top project was a customer service center announced by Automatic Data Processing, a global provider of cloud-based human capital management solutions. The company chose Norfolk as the location of its regional customer service center set to employ 1,800 workers. Besides ADP, many other IT and professional service companies such as CoStar Group and Applied Predictive Technologies have chosen Virginia to invest on new data and research centers or expand their operations this year.
“Building a new Virginia economy has been my number-one priority as Governor. … Virginia now ranks third in the nation for net new job creation in 2016. While we’ve made tremendous progress so far, we won’t let up and will continue working tirelessly to attract and create good-paying jobs for Virginians.”
— Terry McAuliffe, Governor of Virginia

“Illinois’ top two assets are its talented workforce [and] our state’s ability to move goods, services and people in and out of the state of Illinois and throughout the US and across the globe. Illinois’ access to institutions of higher education … logistical support, and the ability to tap into a ready-made labor pool are huge aspects of the decision making process. There is an emerging story to tell in the Foreign Direct Investment space in Illinois. As an example, Illinois has more Japanese companies than any other State in the U.S., by far. Being able to grow that asset and grow those businesses and their supply networks is a key part of our future story going forward.”
— Mark Peterson, CEO of Intersect Illinois
24
Georgia: Capital investments creating approximately 21,000 jobs were announced for Georgia in 2016. The top two industries represented in Georgia job announcements were wholesale and retail trade and information services. NCR Corporation, a global tech company, announced the largest job-creating project in the state this year, investing $145 million and creating 1,864 new tech jobs with its facility expansion. The largest job-creating project from the wholesale and retail trade sector was announced by Dollar General Corporation. The company has announced it will build a new distribution center in central Georgia that would create more than 500 jobs.
Illinois: projects announced 18,700 jobs in 2016, more than 50% higher than the average annual jobs created in Illinois between 2011 and 2016. Wholesale and retail trade contributed both the highest number of jobs and largest amount of investment by industry in Illinois. Leading the job creation was online retailer Amazon.com creating more than 4,000 jobs with their new and expanded facilities throughout Illinois. Accommodation and food services was also a strong industry for job creation in Illinois, driven primarily by a McDonald’s Corporation expansion creating 2,000 jobs. Other industries driving job creation and investment included professional services and food, beverage, and tobacco product manufacturing.
“We are very lucky in Georgia to have a plethora of great economic development assets. Being able to offer a highly skilled workforce is essential to companies looking to locate or expand. Our global accessibility through our airports, ports and highway systems provides a first-class transportation infrastructure that offers businesses an easy access to their customers and consumers. Companies often cite the culture of collaboration between the state and local economic development entities. We take a very integrated approach to economic development, and foster strong relationships with our communities, utility partners, ports, airport and beyond. Georgia has become magnet for technology-driven companies, so I anticipate that we will see the types of projects increase this year. In FY17 we saw phenomenal growth in the financial technology sector (250 percent increase) and food processing industry (119 percent increase). Additionally, rural Georgia has become a hub for advanced manufacturing, food processing, automotive and aerospace companies.”
— Pat Wilson, Commissioner, Georgia Department of Economic Development

252017 US Investment Monitor Tracking mobile capital investments during 2016
Announcements by companies in financial and professional services or wholesale and retail trade continued to be the top job-creating industry in the top six states. Figure 13 shows announced jobs as a percentage of existing employment in each state. Employment growth from announced mobile capital investment was strong in the Southeast, particularly in Georgia and Florida, as well as in Tennessee.
Low job growth High job growth
Alaska Hawaii
Figure 2. Announced investment in data center projects, total from 2011 to 2016Figure 13. Announced mobile project jobs as a percentage of existing employment by state, 2016
Sources: EY analysis of Conway Data and US Bureau of Labor Statstics data.
EY | Assurance | Tax | Transactions | AdvisoryAbout EYEY is a global leader in assurance, tax, transaction and advisory services. The insights and quality services we deliver help build trust and confidence in the capital markets and in economies the world over. We develop outstanding leaders who team to deliver on our promises to all of our stakeholders. In so doing, we play a critical role in building a better working world for our people, for our clients and for our communities.
EY refers to the global organization, and may refer to one or more, of the member firms of Ernst & Young Global Limited, each of which is a separate legal entity. Ernst & Young Global Limited, a UK company limited by guarantee, does not provide services to clients. For more information about our organization, please visit ey.com.
Ernst & Young LLP is a client-serving member firm of Ernst & Young Global Limited operating in the US.
© 2017 Ernst & Young LLP. All Rights Reserved.
US SCORE no. 06817-171US 1710-2470340
ED None
This material has been prepared for general informational purposes only and is not intended to be relied upon as accounting, tax or other professional advice. Please refer to your advisors for specific advice.
ey.com


