Eye Tracking Beyond the Heat Map How to get the most out of eye tracking shopper research. “The eyes are the window into the soul” William Shakespeare Introduction The eyes respond to visual stimulation physiologically unobstructed by our mind. This means the ‘eyes don’t lie’. For research this means that eye tracking shows what shoppers really see and do and not just what they tell us they see and do. Manufacturers and retailers spend millions of dollars every year on in-store activation and communications like shelf layout, displays, signage, and packaging. The effectiveness of these dollars depends on whether shoppers notice, pay attention to, engage with and act upon these in-store activation tactics. We will discuss how best to use mobile eye-tracking research for effective signage, shelf configuration, display and package design evaluation. Some background on eye tracking We move our eyes abruptly, not continuously, when we perceive a scene in store. We can only take in information from the scene during fixations which last about 100-400ms. Further, we can only perceive the details of a scene in a small area spanning about 2 degrees visual angle around a fixation location. We cannot reliably identify or remember objects in our peripheral vision. Something in the periphery has to catch our attention in order for our eyes to move and fixate on it, otherwise it goes unnoticed. The basic meaning of a scene is its gist. When we look at a scene, we extract its gist early in the first fixation. Research suggests that scenes are initially processed globally and coarsely, and then our schematic knowledge of various objects in our memory is activated, leading us to pay attention to individual objects in the scene that may be of potential interest to us. Attention or noticing happens when a fixation lasts for more than 300 ms and engagement or interaction occurs when a consumer touches or holds a product. Eye tracking glasses have 2 cameras tracking shoppers’ eye movements (where they look) and their behavior (what they do). This results in deeper insights into the shopping process and behavior to inform your retail, category, shopper and brand strategy that needs to achieve objectives, drives category sales and builds brand value. To design, execute and interpret mobile eye tracking for in-store shopper research requires unique skills and expertise. Eye Faster has combined those by having fielding experts who understand eye tracking in the context of general research, analysts who are able to convert many hours of video
efficiently into data that can be analyzed using standard Excel files and shopper marketing pioneers who can interpret those unique data and translate them into executable insights for shopper marketing. The data eye tracking delivers Eye tracking can show your shopper marketing and category management departments the following:
• How shoppers really shop any store, any category through their own eyes • What catches shoppers attention and what converts into action • What path shoppers take through the store to shop (path-to-purchase) and where they stop,
look and interact (hot spots) • What decision process shoppers go through in their own mind when shopping (‘the eyes are
the window to the mind’) • What information on a package, sign or display shoppers use to make purchase decisions • Which and how many brands and products shoppers consider when shopping • What shoppers buy on impulse and what is planned
Eye tracking delivers the following data about pre-identified AOIs (Areas of Interest). This clearly identifies how many shoppers do what for how long (look, read, touch, purchase – signs, shelf, displays, products, etc). Eye Faster projects typically can include hundreds or even thousands of AOIs. The shopping process eye tracking data describe Those data enable us to gain an understanding of the shopping process shoppers go through when shopping a certain channel or category. Typically shoppers go through 4 phases from browsing and evaluating, which is about catching their attention, to selection and purchase, which is about action.
Shopper Attention
First fixation
Noticing
Evaluating
Reading
Shopper Behavior
Touching
Holding
Purchasing
Data
% shoppers
Duration/time
AOIs(Area of Interest)
Signs
Shelf layout
Displays
Packages
Products
Staff
This will help optimize
Store layout
Shelf planogram
Sign placement
Display placement
In-‐store communication
Product adjacencies
Impulse purchase
Consideration set
Browse Evaluate Select Buy
ActivityA quick glance,subliminal recognition of colors and shapes
Look closer at sections, packs and brands
Pick up packages, read labels and information
Put the product into the basket or back on the shelf
Driver
AwarenessOrientation in the store at eye level using products and signage
RelevanceChecking products against purchase criteria and needs
ConsiderationComparing products in detail and focused attention
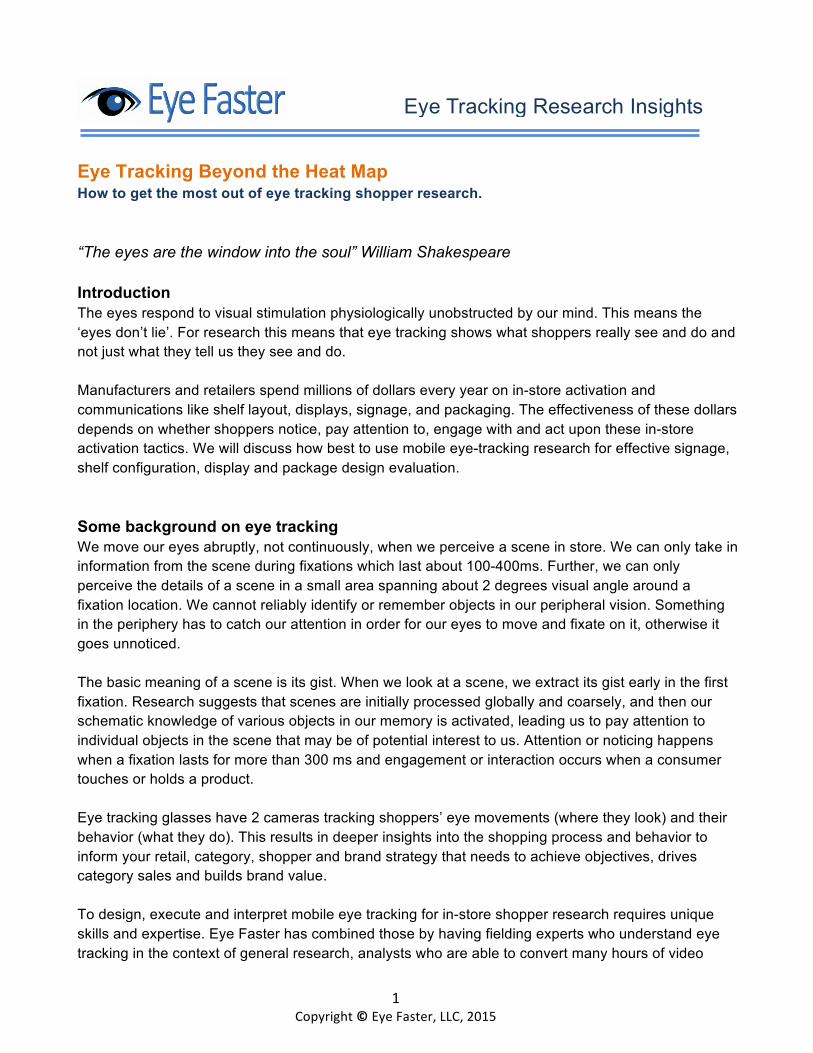
1. Browse Data in this phase of shopping can only be picked up by an eye tracking device. The eye tracker records what the shopper sees first when approaching a category. It shows the shoppers’ quick glance. It is important to break out ‘noting first’, which tells us where a shopper starts her shopping in a category. Research shows that typically left and right ends of shelves are visual anchors and then shoppers work from the outside in and typically stay at eye level unless something catches their attention above or below or they know that a brand or package they are looking for is on top or bottom shelf. Data is typically visualized in visual color maps where the intensity of color shows how much attention a package or section gets in each shopping phase. As shown in this example below where we analyzed over 200 Areas of Interest and show the most viewed by the intensity of the purple.
2. Evaluate The difference between Noticing and Evaluating is the intensity and duration of the shoppers’ glances. An evaluation is defined as the eye tracker picking up a longer than usual glance at a product or area. Therefore Evaluation is typically taking place when the shopper starts to hone in on certain areas or products after she has found her bearings in the category after first general glances. In this phase the package components like branding, color and shape are of importance. This is when the shopper looks closer at different shelf areas and several packages in each area. Products that are evaluated are typically in the consideration set for purchase. It is important for a package to be easily identified - the main benefits should be easily perceived with a few glances. 3. Select This is when the shopper finally starts picking up specific packages and reviews them in more detail. After deciding that it fits her purpose and style, she makes a decision.
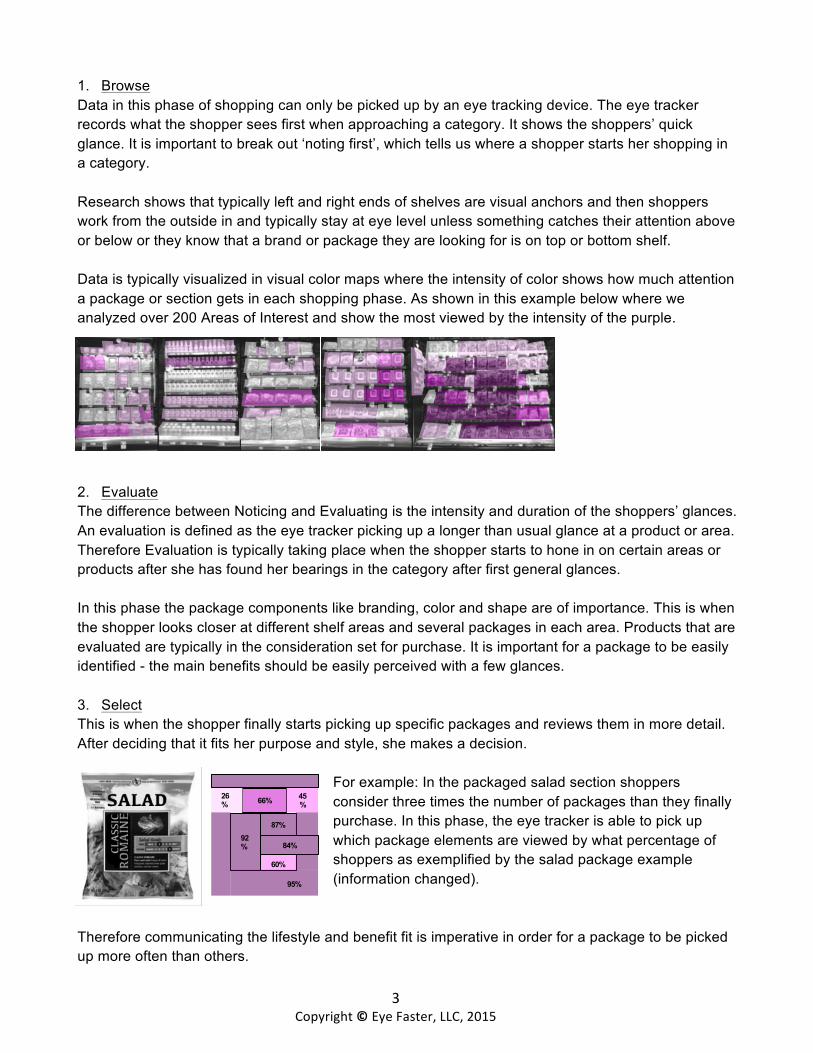
For example: In the packaged salad section shoppers consider three times the number of packages than they finally purchase. In this phase, the eye tracker is able to pick up which package elements are viewed by what percentage of shoppers as exemplified by the salad package example (information changed).
Therefore communicating the lifestyle and benefit fit is imperative in order for a package to be picked up more often than others.
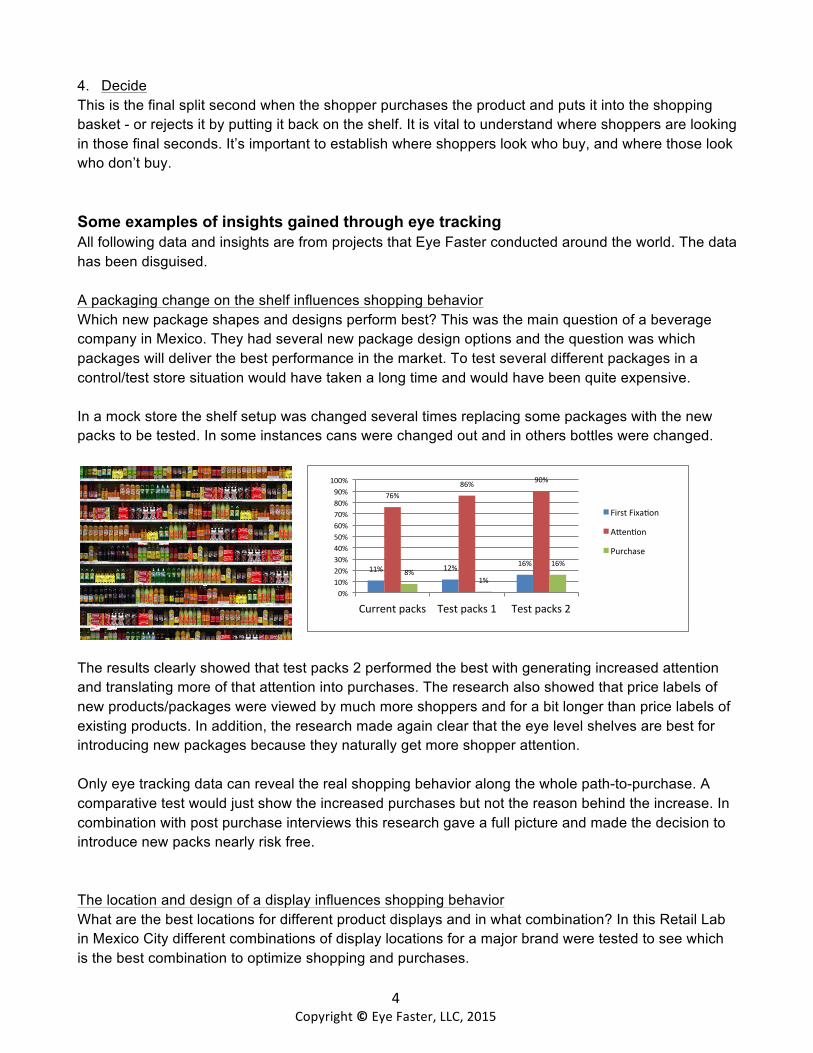
4. Decide This is the final split second when the shopper purchases the product and puts it into the shopping basket - or rejects it by putting it back on the shelf. It is vital to understand where shoppers are looking in those final seconds. It’s important to establish where shoppers look who buy, and where those look who don’t buy. Some examples of insights gained through eye tracking All following data and insights are from projects that Eye Faster conducted around the world. The data has been disguised. A packaging change on the shelf influences shopping behavior Which new package shapes and designs perform best? This was the main question of a beverage company in Mexico. They had several new package design options and the question was which packages will deliver the best performance in the market. To test several different packages in a control/test store situation would have taken a long time and would have been quite expensive. In a mock store the shelf setup was changed several times replacing some packages with the new packs to be tested. In some instances cans were changed out and in others bottles were changed.
The results clearly showed that test packs 2 performed the best with generating increased attention and translating more of that attention into purchases. The research also showed that price labels of new products/packages were viewed by much more shoppers and for a bit longer than price labels of existing products. In addition, the research made again clear that the eye level shelves are best for introducing new packages because they naturally get more shopper attention. Only eye tracking data can reveal the real shopping behavior along the whole path-to-purchase. A comparative test would just show the increased purchases but not the reason behind the increase. In combination with post purchase interviews this research gave a full picture and made the decision to introduce new packs nearly risk free. The location and design of a display influences shopping behavior What are the best locations for different product displays and in what combination? In this Retail Lab in Mexico City different combinations of display locations for a major brand were tested to see which is the best combination to optimize shopping and purchases.
The results pointed very clearly to a test set up where the front display was replaced with a new display which was placed in the center of the store (test store 1) versus the control setup and test store 2 where the new display was along a wall.
What this research also showed, was that the snack purchase for single packs is a very tactile, very fast purchase with 98% of products being picked up translating into a purchase with each purchase decision only lasting 4 seconds on average. The brand logo of a well known brand should be the focal point on a package Different package designs were tested to understand how the different packages draw consumer attention and which package elements were the most important ones.
The eye tracking data clearly showed that the branding in the middle of the packs attracts the first attention and also holds attention and interest the longest. After the branding in the middle the upper and lower parts of the packs are explored in more detail. This means that the most important package elements that need to be communicated should be located as closely to the brand as possible. The less important the further away they can be. The most important elements should be in concentric circles around the brand because that is how the shopper attention shifts on the packages.
Product location on the shelf influences purchasing in unexpected ways A home care company wanted to see how the different brands in the category perform. This is a crowded category with a leading brand but many smaller me-to brands as well as niche brands.
In this planogram we are just showing the brand leader and several other brands which showed interesting results. The heat map shows that the center of the category where brands 1 and 2 are located gets the most shopper attention. The left and right aisle entrance also gets a bit higher attention but around the leading brand the attention is relatively low. Analyzing the eye
tracking data in more detailed revealed a much deeper understanding of the situation.
The leading brand has the highest purchase rate but also the highest number of facings. But the shopping performance is relatively weak with hold-to-purchase and evaluate-to-purchase dropping off and fixate-first-to-purchase increasing the smallest percentage points. Brand 1 has the strongest performance with only 10 facings. All hold translates into purchase, evaluate-to-purchase drips the lowest and fixate-first-to-purchase increases the most.
This shows that the smaller brands 1 and 2 were able to benefit from the best shelf location right in the center and next to the leading brand. For the brand leader it was clear to shift their shelf section 1-2 feet to the right to be in the center of attention. Planograming the shelf and product layout are key for shopper navigation A department store wanted to know how shoppers navigate the store, how different categories are shopped and what attracts attention and interest and what converts into purchase.
The general view is that shoppers use mainly signage for store navigation. This research showed that signage is still important but in this case viewing product located on the shelf is the primary mechanism that shoppers use to navigate the store. Three quarters of shoppers also viewed the header signs. In addition it became clear that ceiling navigational signs have the most impact and importance at the beginning of a consumers shopping trip.
Change in percent Leading brand Brand 1 Brand 2 Brand 3
Hold to Purchase -‐3% 0% -‐2% -‐2%
Evaluate to Purchase -‐42% -‐34% -‐59% -‐72%
Fixate first to Purchase 26% 36% 9% -‐12%
Number of facings 45 10 10 30
24%
3% 5%
22%
92%
73% 73%82%
53%
39%
16% 12%
50%39%
14% 10%
0%
20%
40%
60%
80%
100%
Leading brand
Brand 1 Brand 2 Brand 3
Fixating first
Evaluating
Holding
Purchasing
35%
10% 12%
15%
12%
8%
4%
Entrance
8%
Percent shoppers viewing ceiling signs by location
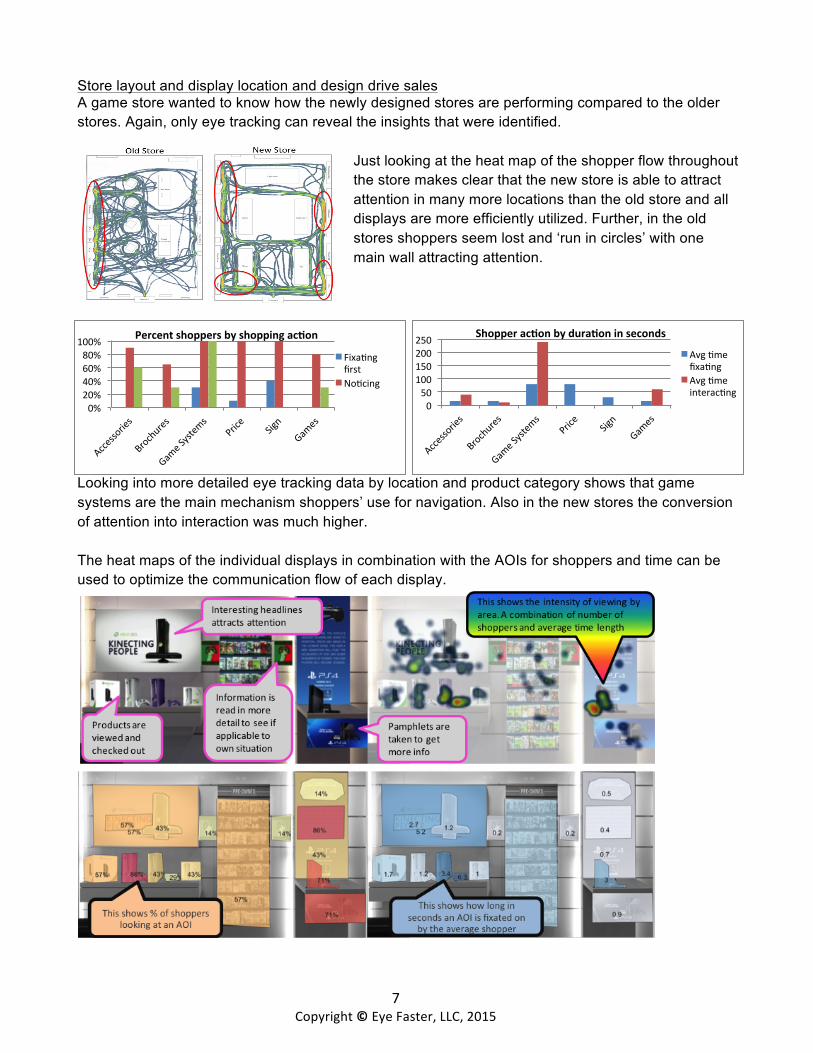
Store layout and display location and design drive sales A game store wanted to know how the newly designed stores are performing compared to the older stores. Again, only eye tracking can reveal the insights that were identified.
Just looking at the heat map of the shopper flow throughout the store makes clear that the new store is able to attract attention in many more locations than the old store and all displays are more efficiently utilized. Further, in the old stores shoppers seem lost and ‘run in circles’ with one main wall attracting attention.
Looking into more detailed eye tracking data by location and product category shows that game systems are the main mechanism shoppers’ use for navigation. Also in the new stores the conversion of attention into interaction was much higher. The heat maps of the individual displays in combination with the AOIs for shoppers and time can be used to optimize the communication flow of each display.
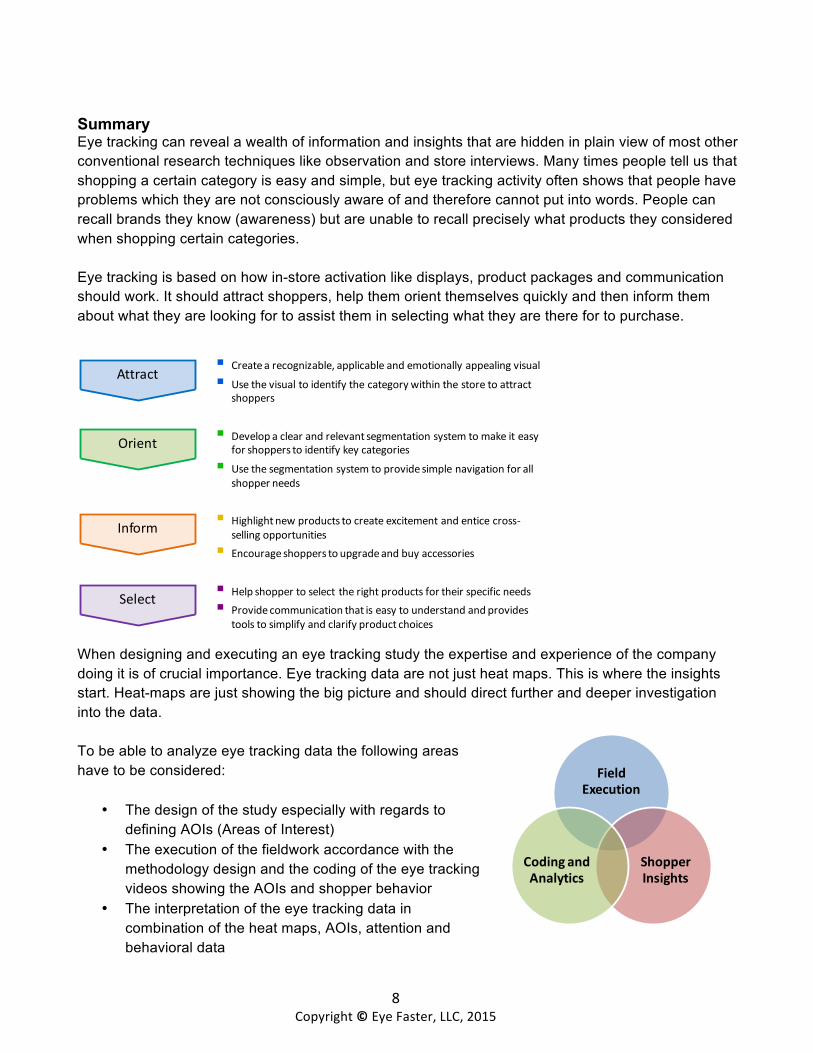
Summary Eye tracking can reveal a wealth of information and insights that are hidden in plain view of most other conventional research techniques like observation and store interviews. Many times people tell us that shopping a certain category is easy and simple, but eye tracking activity often shows that people have problems which they are not consciously aware of and therefore cannot put into words. People can recall brands they know (awareness) but are unable to recall precisely what products they considered when shopping certain categories. Eye tracking is based on how in-store activation like displays, product packages and communication should work. It should attract shoppers, help them orient themselves quickly and then inform them about what they are looking for to assist them in selecting what they are there for to purchase.
When designing and executing an eye tracking study the expertise and experience of the company doing it is of crucial importance. Eye tracking data are not just heat maps. This is where the insights start. Heat-maps are just showing the big picture and should direct further and deeper investigation into the data. To be able to analyze eye tracking data the following areas have to be considered:
• The design of the study especially with regards to defining AOIs (Areas of Interest)
• The execution of the fieldwork accordance with the methodology design and the coding of the eye tracking videos showing the AOIs and shopper behavior
• The interpretation of the eye tracking data in combination of the heat maps, AOIs, attention and behavioral data
§ Create a recognizable, applicable and emotionally appealing visual
§ Use the visual to identify the category within the store to attract shoppers
§ Develop a clear and relevant segmentation system to make it easy for shoppers to identify key categories
§ Use the segmentation system to provide simple navigation for all shopper needs
§ Highlight new products to create excitement and entice cross-‐selling opportunities
§ Encourage shoppers to upgrade and buy accessories
§ Help shopper to select the right products for their specific needs§ Provide communication that is easy to understand and provides
Eye Faster has specialist in all 3 key areas which are necessary and essential to execute an eye tracking study in field, code and analyze the data correctly and convert the data into relevant and usable insights for shopper marketing and category management departments.
• Eye Faster will help clients design the study in the most efficient way for achieving objectives. • Eye Faster is able to execute research projects including one to multiple stores, one to
multiple countries, five to hundreds of respondents, one to many categories and hundreds or even thousands of AOIs
• Eye Faster has proprietary software to efficiently and fast code videos and analyze the data • Eye Faster provides heat maps, as well as detailed attention and behavioral data analyzing
the whole shopping process and customized for the project • Eye Faster will interpret eye tracking data in combination with traditional observational and
response research and deliver new and unique insights that can lead to a competitive advantage
For more information please contact: Kirk Hendrickson, Co-Founder & CEO Eye Faster, LLC 1990 North California Blvd, 8th Floor Walnut Creek, CA 94596 [email protected] (925) 452-4976 www.eyefaster.com