Mapping the Control of Lebanese Politicians over the Banking Sector خريطةلحاكمة الطبقة ا سيطرة فيلمصارف على اان لبنJad Chaaban Associate Professor of Economics, AUB Seminar at AUB IFI Auditorium 15 September 2015
Transcript
Mapping the Control of Lebanese Politicians over the Banking Sector
سيطرة الطبقة الحاكمة خريطة
لبنانعلى المصارف في
Jad Chaaban Associate Professor
of Economics, AUB
Seminar at AUB IFI Auditorium
15 September 2015
Outline
1. Background and objectives
2. Research Methodology
3. Data Sources
4. Main Findings
Note: Work in progress. The project is part of a wider regional initiative entitled “The Political
Economy Determinants of Private Sector Dynamism in the Middle East”, coordinated by the
Economic Research Forum (ERF). The contents and recommendations do not necessarily reflect
the views of the ERF, or any other institution the author is affiliated with.
I would like to thank Antoine Dib for excellent research assistance.
Background and objectives
• Lebanese banking sector one of the biggest in MENA: Assets US$ 199
billion in 2013, 440% of Lebanon’s GDP
• Extraordinary influence on monetary, fiscal, and other government policies
• Lebanese banks have been quite close to the country’s ruling apparatus,
often sustaining clientelistic networks (Moore, 1987) and heavily
intervening in monetary and exchange rate policy (Hakim & Andary, 1997,
Dibeh, 2002)
• Yet empirical evidence on the extent to which Lebanon’s banks are
dominated by a crony form of capital is non-existent
• Two objectives:
– Map the ultimate shareholders of Lebanese commercial banks and identify
their linkages with the ruling class
– Analyze the impact of elite capture on the efficiency of the banking sector
Lower bound estimates of true size of influence!
0.00 20.00 40.00 60.00 80.00 100.00120.00
FINLAND
CANADA
LUXEMBOURG
GERMANY
CYPRUS
BAHRAIN
GREECE
TRINIDAD AND TOBAGO
THAILAND
CAPE VERDE
LEBANON
IRAQ
CENTRAL AFRICAN REPUBLIC
Electricity 19%
Interest on public debt
36%
Wages 34%
Other 11%
1. “Public services are very bad
2. Because government budget swallowed by wages and EDL
3. Because politicians are corrupt & inefficient
4. Therefore banks step in to help the economy”
Public expenditures, 2013, MoF
World Bank Government Effectiveness Index, 2013
Position held by banks’ representatives
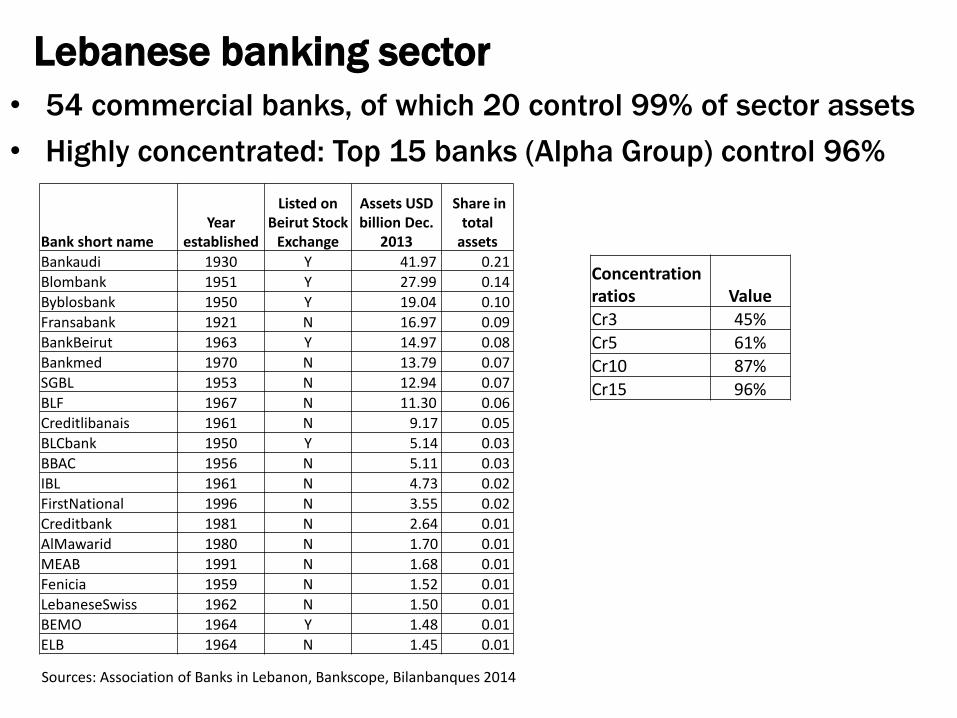
Lebanese banking sector
• 54 commercial banks, of which 20 control 99% of sector assets
• Highly concentrated: Top 15 banks (Alpha Group) control 96%
Bank short name Year
established
Listed on Beirut Stock
Exchange
Assets USD billion Dec.
2013
Share in total
assets
Bankaudi 1930 Y 41.97 0.21
Blombank 1951 Y 27.99 0.14
Byblosbank 1950 Y 19.04 0.10
Fransabank 1921 N 16.97 0.09
BankBeirut 1963 Y 14.97 0.08
Bankmed 1970 N 13.79 0.07
SGBL 1953 N 12.94 0.07
BLF 1967 N 11.30 0.06
Creditlibanais 1961 N 9.17 0.05
BLCbank 1950 Y 5.14 0.03
BBAC 1956 N 5.11 0.03
IBL 1961 N 4.73 0.02
FirstNational 1996 N 3.55 0.02
Creditbank 1981 N 2.64 0.01
AlMawarid 1980 N 1.70 0.01
MEAB 1991 N 1.68 0.01
Fenicia 1959 N 1.52 0.01
LebaneseSwiss 1962 N 1.50 0.01
BEMO 1964 Y 1.48 0.01
ELB 1964 N 1.45 0.01
Concentration ratios Value Cr3 45%
Cr5 61% Cr10 87% Cr15 96%
Sources: Association of Banks in Lebanon, Bankscope, Bilanbanques 2014
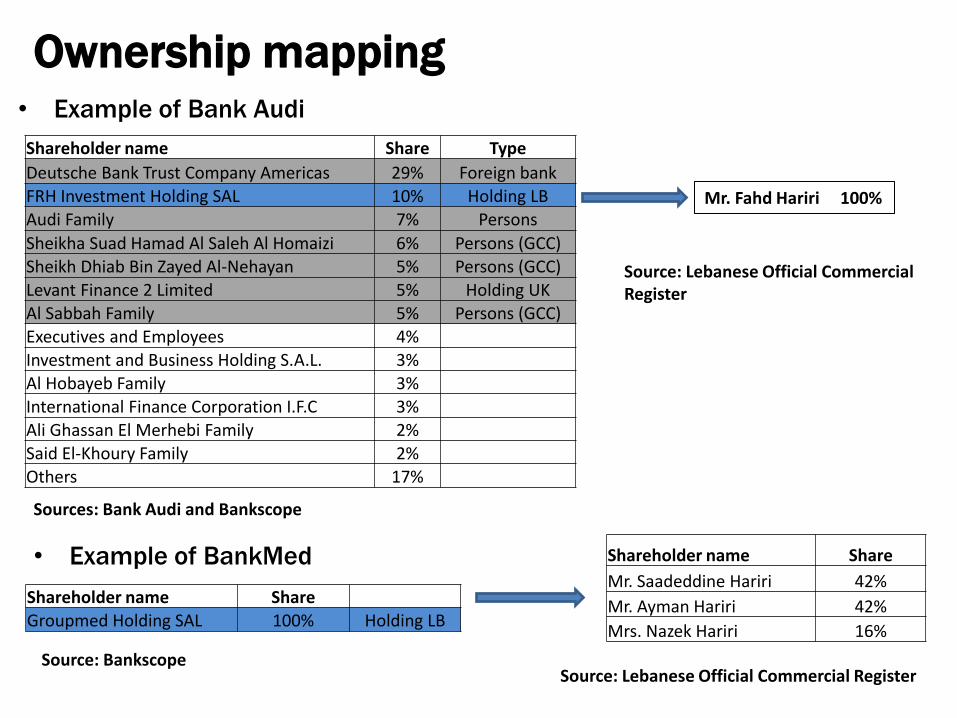
Research Methodology
• Ownership mapping
– Drawing up a comprehensive list of each bank’s ultimate owners (Morck et al., 2011, Caprio et al. 2007)
– Ultimate owners are state organs or biological persons, and a threshold of 5% is used to identify controlling shareholders (as per Lebanese Law)
• Once ultimate owners are identified by backward iteration (examining each corporation’s owners), a linkage between these owners and political powers is established
– Five levels of linkages with political elites (scale from highest to lowest): • 5. Direct: Person is currently a member of Parliament or the Government
• 4. Indirect1: Person was MP/minister/public official
• 3. Indirect2: Person’s family member is a current or former politician
• 2. Indirect3: Person has close ties to local or foreign political elites
• 1. Nolink: no linkages with politicians
• The composition of the banks’ Board of Directors is also explored to construct an additional variable for political influence via the bank’s management
Research Methodology
• Bank-level financial efficiency and performance indicators
– Ultimately impacted by the ownership structure
– Non-performing loans (a measure of favoritism towards unqualified borrowers)
and share of treasury bills held (a measure of exposure to sovereign risk)
– Other profitability and operational indicators:
• Neti: Net interest Margin.
• ROOA: Returns on assets.
• ROAE: Returns on equity.
• Cost_br: Cost per average branch in Bil LBP (Total Non-Interest Expenses/ Number of Branches).
• Staff_av: Staff expenses per average staff in US$. (Personnel Expenses/Number of employees).
• Staff_exp: Staff expenses to general operating expenses ratio (Personnel Expenses/ Total Non-Interest Expenses).
• Cost: Cost to income ratio (Total Non-Interest Expenses/ (Other Operating Income + Net Interest Revenue)).
• Cost_a: Cost to average assets ratio (Total Non-Interest Expense/ Average assets).
• Dividends: Total amount paid as dividends in Bil LBP.
• Equity: Total equity in Bil LBP.
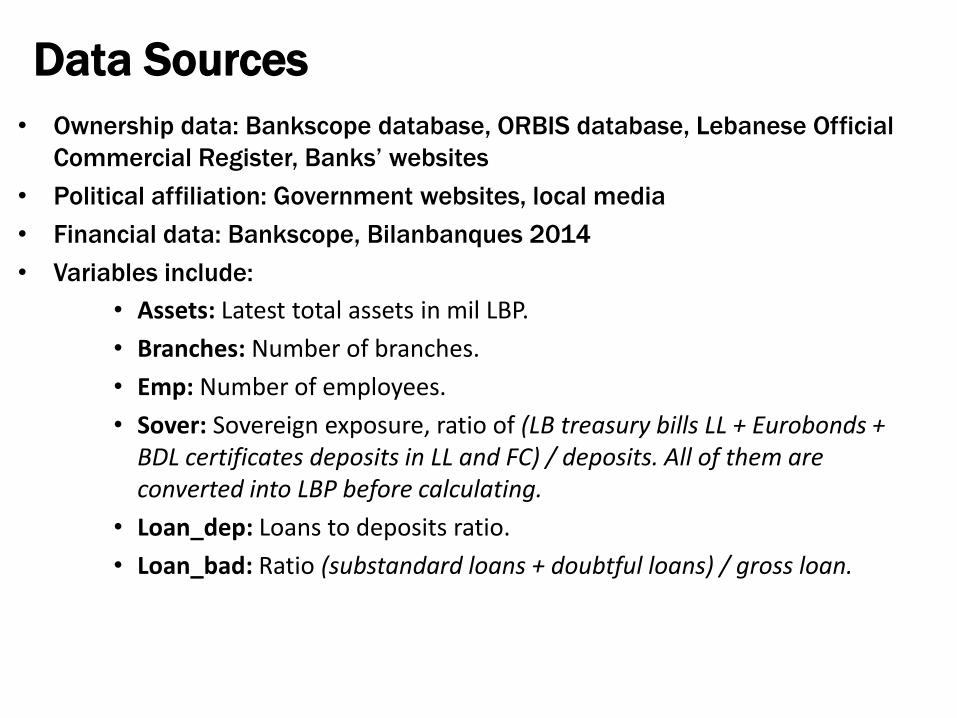
Data Sources
• Ownership data: Bankscope database, ORBIS database, Lebanese Official
Commercial Register, Banks’ websites
• Political affiliation: Government websites, local media
• Financial data: Bankscope, Bilanbanques 2014
• Variables include:
• Assets: Latest total assets in mil LBP.
• Branches: Number of branches.
• Emp: Number of employees.
• Sover: Sovereign exposure, ratio of (LB treasury bills LL + Eurobonds + BDL certificates deposits in LL and FC) / deposits. All of them are converted into LBP before calculating.
Source: Author estimates based on BankData and ultimate shareholders identification. Equity refers to consolidated equity in the controlled banks as of Dec. 2013.
• Saad Hariri, Former PM, current MP, head of Future Movement Parliament block : 800 million US$ equity, direct shareholder of BankMed
• Adnan Kassar, Former Minister of Economy, Former head of Chamber of Commerce
1.2 billion US$ equity, direct shareholder Fransabank
• Maurice Sehnaoui, Former Minister of Economy and Trade, father of Nicolas Sehnaoui (FPM member, former Telecom Minister)
1.4 billion US$ equity (family), direct control in
Societe Generale de Banque au Liban (SGBL)
• Farid Raphael, Former Minister of Finance, Telecommunications, Justice, Former head of Association of Banks
Deceased 2014, family equity 700 million US$, direct control
Banque Libano-Francaise BLF
Some examples
• Control by politically affiliated shareholders
5. Direct: Person is currently a member of Parliament or the Government
4. Indirect1: Person was MP/minister/public official
3. Indirect2: Person’s family member is a current or former politician
2. Indirect3: Person has close ties to local or foreign political elites
1. Nolink: no linkages with politicians
0% 10% 20% 30% 40% 50% 60% 70% 80% 90% 100%
ELB
BEMO
LebaneseSwiss
Fenicia
MEAB
AlMawarid
Creditbank
FirstNational
IBL
BBAC
BLCbank
Creditlibanais
BLF
SGBL
Bankmed
BankBeirut
Fransabank
Byblosbank
Blombank
Bankaudi
• ‘Crony’ control within the Board of Directors
5. Direct: Person is currently a member of Parliament or the Government
4. Indirect1: Person was MP/minister/public official
3. Indirect2: Person’s family member is a current or former politician
2. Indirect3: Person has close ties to local or foreign political elites
1. Nolink: no linkages with politicians
0% 10% 20% 30% 40% 50% 60% 70% 80% 90% 100%
ELB
BEMO
LebaneseSwiss
Fenicia
MEAB
AlMawarid
Creditbank
FirstNational
IBL
BBAC
BLCbank
Creditlibanais
BLF
SGBL
Bankmed
BankBeirut
Fransabank
Byblosbank
Blombank
Bankaudi
• Affiliation of the Chairman of the Board of Directors (by bank
assets million US$)
5. Direct: Person is currently a member of Parliament or the Government
4. Indirect1: Person was MP/minister/public official
3. Indirect2: Person’s family member is a current or former politician
2. Indirect3: Person has close ties to local or foreign political elites