32
1 Fb 4 2011 February 4, 2011

1
F b 4 2011February 4, 2011
2Forward-looking Statement
This presentation contains certain forward-looking statements. The Company has tried, whenever possible, to identify these forward-looking statements using words such as “anticipated”, “believes”, “estimates”, “forecasts”, “expects”, “plans”, “intends”, “targets” and similar expressions. Similarly, statements herein that describe the Company’s business strategy, outlook, objectives, plans,intentions or goals are also forward looking statements Such forward looking statements involve known and unknown risksintentions or goals are also forward-looking statements. Such forward-looking statements involve known and unknown risks, uncertainties and other factors which could cause the Company’s actual results, performance or achievements to differ from thoseexpressed in, or implied by, such statements. These risks and uncertainties may include, but are not limited to: the Company’s ability to successfully implement its strategies to restructure the steel business and reinforce its financial structure; the effects of and changes in Japanese and worldwide general economic conditions and in the steel industry in particular, including the severity of any economic slowdown, technological and other changes affecting the manufacture of and demand for the Sumitomo Metals Group’s products changes in Japan’s and other countries’ laws and regulations including with regard to taxation and other risks andproducts, changes in Japan s and other countries laws and regulations, including with regard to taxation, and other risks and uncertainties set forth in subsequent press releases and in the Sumitomo Metals Group’s public filings. These statements reflect the Company’s current beliefs and are based upon information currently available to it. Be advised that developments subsequent to this presentation are likely to cause these statements to become outdated with the passage of time. The Company disclaims any intent or obligation to update these forward-looking statements.
This presentation includes “forward-looking statements” that reflect the plans and expectations of Nippon Steel Corporation and Sumitomo Metal Industries, Ltd. in relation to, and the benefits resulting from, their possible business combination (or integration) .To the extent that statements in this presentation do not relate to historical or current facts, they constitute forward-lookingstatements. These forward-looking statements are based on the current assumptions and beliefs of the two companies in light of the information currently available to them, and involve known and unknown risks, uncertainties and other factors. Such risks, uncertainties and other factors may cause the actual results, performance, achievements or financial position of one or both of the two companies (or the post-transaction group) to be materially different from any future results, performance, achievements or financial position expressed or implied by these forward-looking statements. The two companies undertake no obligation to publicly update any forward-looking statements after the date of this document. Investors are advised to consult any further disclosures by the two companies (or the post-transaction group) in their subsequent domestic filings in Japan and filings with the U.S. Securities and Exchange Commission.
The risks uncertainties and other factors referred to above include but are not limited to:The risks, uncertainties and other factors referred to above include, but are not limited to:(1)economic and business conditions in and outside Japan;(2)changes in steel supply, raw material costs and exchange rates;(3)changes in interest rates on loans, bonds and other indebtedness of the two companies, as well as changes in financial markets;(4)changes in the value of assets (including pension assets), such as marketable securities;(5)changes in laws and regulations (including environmental regulations) relating to the two companies’ business activities;(6)rise in tariffs imposition of import controls and other developments in the two companies’ main overseas markets;(6)rise in tariffs, imposition of import controls and other developments in the two companies main overseas markets;(7)interruptions in or restrictions on business activities due to natural disasters, accidents and other causes;(8)the two companies’ being unable to reach a mutually satisfactory agreement on the detailed terms of the possible business combination (or integration) or otherwise unable to complete it; and(9)difficulties in realizing the synergies and benefits of the post-transaction group.
All output figures in this presentation are metric tons.All output figures of “crude steel”, “steel sales volume” and “average price of steel product” are including Sumitomo Metals (Kokura), Sumitomo Metals (Naoetsu) and Sumikin Iron & Steel Corporation.EBITDA= Operating income + Depreciation of property, plant and equipment

3FY10/3Q Consolidated Results Highlights
-We decreased steel sales volume from ourlast guidance due to BF instability at Kashimasteelworks and weak sales climate. (The BF was stabilized by the end of Dec.)
JPY billion 1Q-3Q <YoY>Sales 1,045.7 <120.9>Operating income 39 7 <70 9> (The BF was stabilized by the end of Dec.)
-We posted an ordinary loss of 2 JPY billion in FY10/3Q due to decrease in earning from equity-method affiliates i ddi i BF i bili
Operating income 39.7 <70.9>Ordinary income 26.8 <85.5>Net income 34.9 <92.4>EBITDA 132.7 <75.8>
in addition to BF instability.
EBITDA and EBITDA marginSales volume and
l i l l
. .
2 530
3,120 3,2603,040 2,910 2,900 17%
15%
EBITDA and EBITDA marginseamless pipe sales volume
1,980
2,53012%
9%
13%15%
10%JPYbillion
Thousand tons
200170
200230 230 230 230
(8.6)36.7 28.6
63.0 44.2 51.6
36.8
billion
09/1Q 2Q 3Q 4Q 10/1Q 2Q 3Q
-3%09/1Q 2Q 3Q 4Q 10/1Q 2Q 3QFY FY
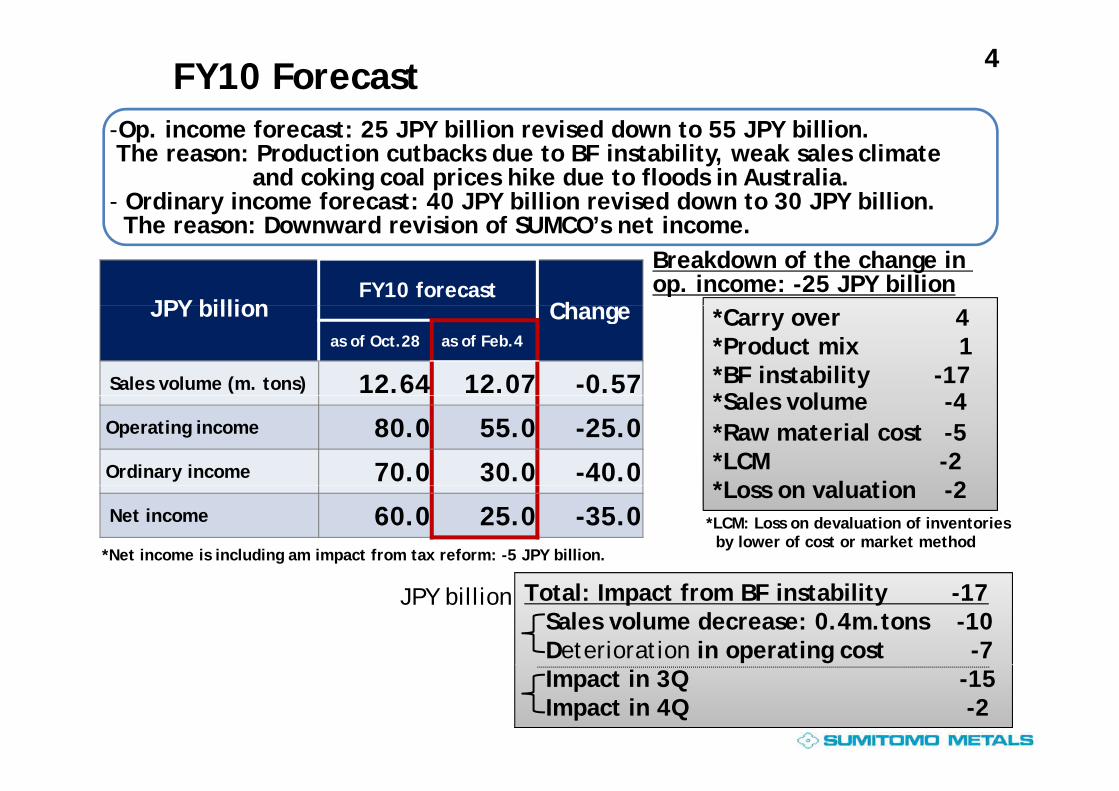
4FY10 ForecastOp income forecast: 25 JPY billion revised down to 55 JPY billion-Op. income forecast: 25 JPY billion revised down to 55 JPY billion.The reason: Production cutbacks due to BF instability, weak sales climate
and coking coal prices hike due to floods in Australia.- Ordinary income forecast: 40 JPY billion revised down to 30 JPY billion.
h D d i i f S CO’ i
JPY billionFY10 forecast
Ch g
Breakdown of the change in op. income: -25 JPY billion
The reason: Downward revision of SUMCO’s net income.
JPY billion Changeas of Oct.28 as of Feb.4
Sales volume (m. tons) 12.64 12.07 -0.57
*Carry over 4*Product mix 1*BF instability -17*S l l 4
Operating income 80.0 55.0 -25.0 Ordinary income 70.0 30.0 -40.0
*Sales volume -4*Raw material cost -5*LCM -2*Loss on al ation 2
Net income 60.0 25.0 -35.0 *Loss on valuation -2
*Net income is including am impact from tax reform: -5 JPY billion.
*LCM: Loss on devaluation of inventories by lower of cost or market method
Total: Impact from BF instability -17Sales volume decrease: 0.4m.tons -10Deterioration in operating cost -7
JPY billion
Impact in 3Q -15Impact in 4Q -2

5Study of Business Integration with Nippon SteelCombines resources of two companies, creates synergies through p , y g gconsolidating strengths.Accelerates global strategies, realizes outstanding competitiveness
in areas such as technology, quality, cost etc.Aims to become a truly world leading steel maker.
Accelerate global strategies Maintain World’s Most AdvancedAccelerate global strategies Maintain World s Most Advanced Technology
Maximize C t V l
Secure Cost CompetitivenessReinforce Business Infrastructure of
Non-Steel Segments
Corporate Values
g
1.Form of integrationMerger
4. Integration ratioTo be determined based on an assessment
by external institutionsg
2.Schedule・Feb. 3, 2011: Execution of the memorandum・Oct. 1, 2012: Effective date of merger
by external institutions
5. Working group“Integration Study Committee” chaired by the presidents of both companies
g
3.Company name, headquarters, directors and officersTo be determined
the presidents of both companies

6
FY2010/3Q ResultsFY2010/3Q ResultsFY2010/3Q ResultsFY2010/3Q Results

7Overview of Consolidated Results for FY10/3QChange
JPY billion FY09/1-3Q
FY10/1-3Q
Change
3Q 1Q 2Q 3Q vs. FY09/3Q
vs.FY09/1-3Q
Sales 326 0 924 7 341 6 352 1 351 9 1 045 7 25 9 120 9Sales 326.0 924.7 341.6 352.1 351.9 1,045.7 25.9 120.9
Op. income(loss) (3.1) (31.1) 14.2 20.4 4.9 39.7 8.1 70.9
Ordinary income(loss) (11.0) (58.6) 9.4 19.4 (2.0) 26.8 8.9 85.5
Extraordinary i (l ) - (3.1) - - - - - 3.1income (loss) (3.1) 3.1
Income taxes and minority
interest0.2 4.3 (5.0) 10.9 2.1 8.0 1.8 3.7
interest
Net income(loss) (10.7) (57.4) 4.4 30.4 0.0 34.9 10.8 92.4
S ( ) 2 33 12 40 0 97 6 56 0 01 7 53 2 34 19 93EPS (JPY) -2.33 -12.40 0.97 6.56 0.01 7.53 2.34 19.93
EBITDA 28.6 56.8 44.2 51.6 36.8 132.7 8.2 75.8
FOREX rate (JPY/USD) 90 94 92 86 83 87 -7 -7
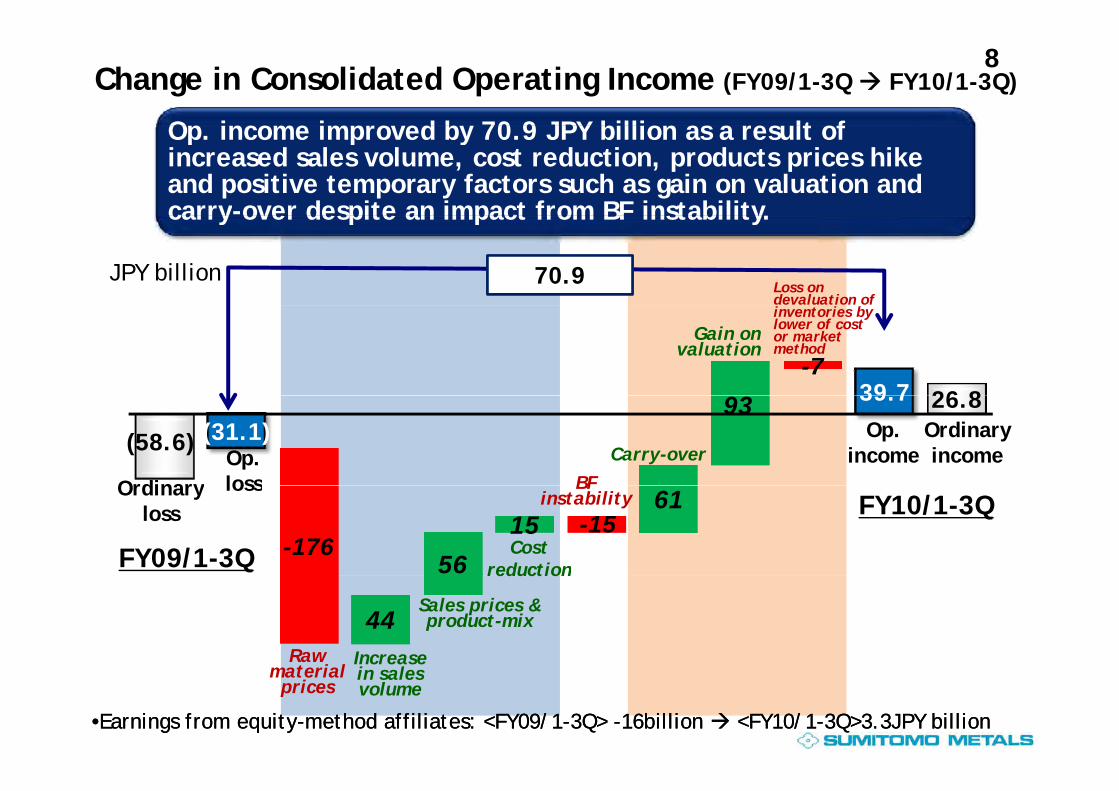
8Change in Consolidated Operating Income (FY09/1-3Q FY10/1-3Q)
Op income improved by 70 9 JPY billion as a result ofOp. income improved by 70.9 JPY billion as a result of increased sales volume, cost reduction, products prices hike and positive temporary factors such as gain on valuation and carry-over despite an impact from BF instability.
70.9
carry over despite an impact from BF instability.
JPY billionLoss on devaluation of i i
26 839 7-7
Gain on valuation
finventories by lower of cost or market method
(58.6)
26.8(31.1)
39.793Ordinaryincome
Op.income
OrdinaryOp.loss
Carry-overBF
56
1561
-176-15
FY09/1-3Q
FY10/1-3QOrdinary
lossloss
Costreduction
BF instability
44Raw t i l
reduction
Increase
Sales prices & product-mix
•Earnings from equity-method affiliates: <FY09/1-3Q> -16billion <FY10/1-3Q>3.3JPY billion •Earnings from equity-method affiliates: <FY09/1-3Q> -16billion <FY10/1-3Q>3.3JPY billion
material prices
in sales volume
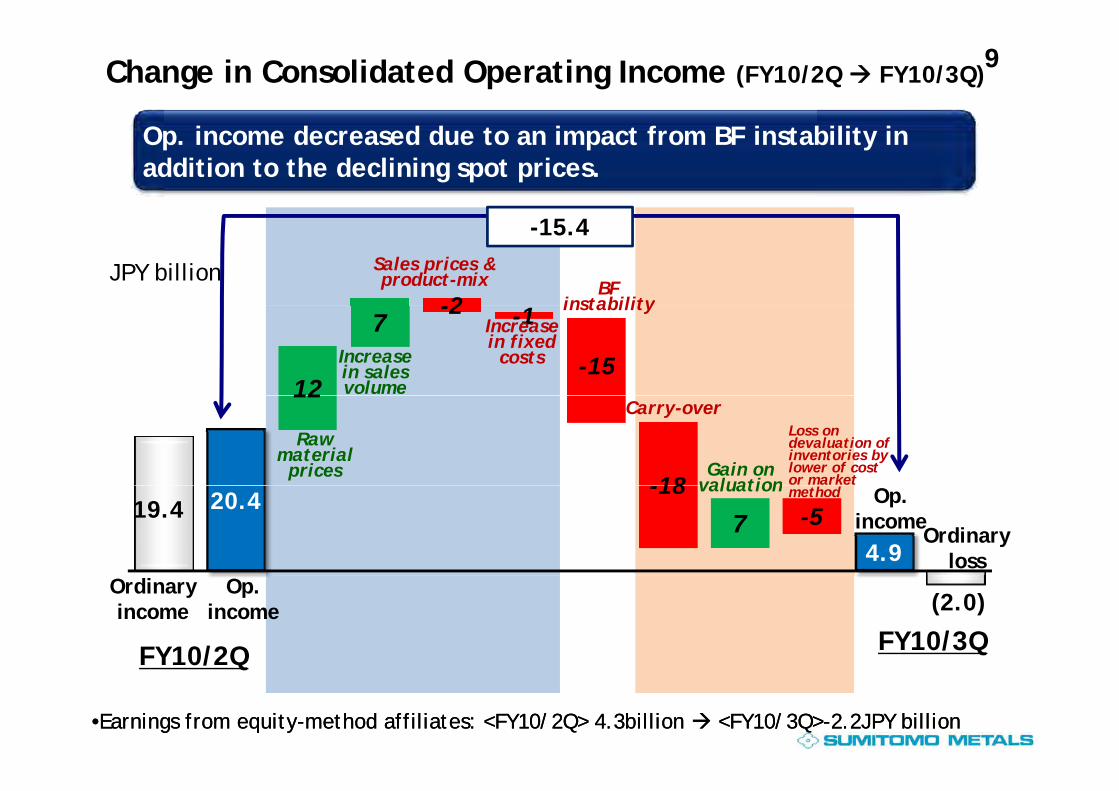
9Change in Consolidated Operating Income (FY10/2Q FY10/3Q)
O i d d d i f BF i bili iOp. income decreased due to an impact from BF instability in addition to the declining spot prices.
-2
-15.4
JPY billion Sales prices & product-mix BF
instability
12
7-2 -1
-15Increase in sales volume
instabilityIncrease in fixed
costs
12
-18
Raw material
prices
Loss on devaluation of inventories by lower of cost or market
Carry-over
Gain on valuation
19.4 20.4
4.97
-18-5
Ordinaryloss
Op.income
method valuation
(2.0)
FY10/3QFY10/2Q
Ordinaryincome
Op.income
•Earnings from equity-method affiliates: <FY10/2Q> 4.3billion <FY10/3Q>-2.2JPY billion •Earnings from equity-method affiliates: <FY10/2Q> 4.3billion <FY10/3Q>-2.2JPY billion
FY10/2Q

10Consolidated Balance Sheets- Debt decreased because of the improved operating cash flows.- D/E ratio remained the same as 3E/2010.- The decrease of the debt was offset by the decrease in valuationdifference on available-for-sale securities.
09 10 Change vsJPY billion09 10
% Change vs.3E/1012E 3E 6E 9E 12E
[Assets]
Current assets 652.9 606.4 607.9 622.6 618.9 2.1 12.4
Fixed assets 1,795.4 1,797.2 1,775.4 1,775.2 1,793.6 -0.2 -3.5
Total assets 2,448.3 2,403.6 2,383.4 2,397.8 2,412.6 0.4 8.9
[Liabilities and Shareholders’ Equity]
Current liabilities 678 4 639 3 666 1 661 5 699 5 9 4 60 2Current liabilities 678.4 639.3 666.1 661.5 699.5 9.4 60.2
Long-term liabilities 911.9 885.1 871.6 867.9 849.2 -4.0 -35.8
Net assets 857.9 879.2 845.6 868.2 863.7 -1.8 -15.4
Debt 1,177.4 1,138.3 1,128.0 1,117.0 1,111.1 -2.4 -27.2
D/E ratio 1.46 1.37 1.42 1.37 1.37 -
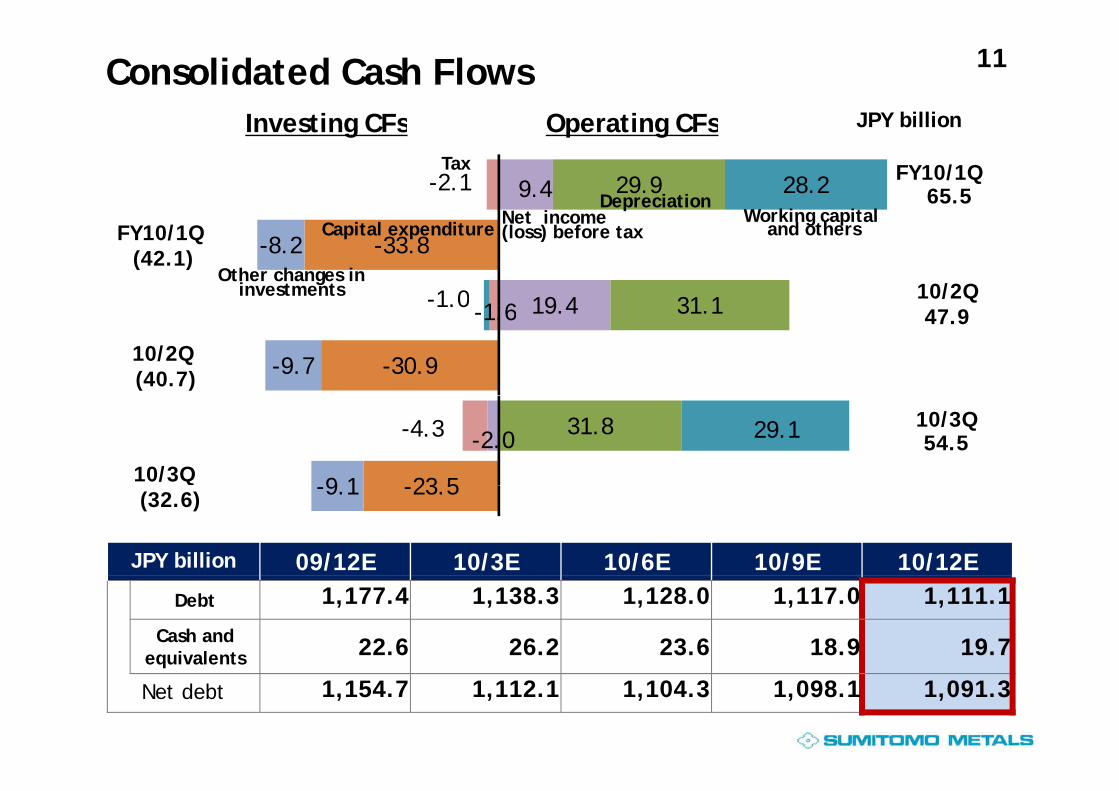
11Consolidated Cash FlowsJPY billionOperating CFsInvesting CFs
9.4 29.9-2.1 28.2 FY10/1Q65.5
JPY billionOperating CFsInvesting CFs
Net incomeDepreciation
Working capital
Tax
19 4 31 11 6-1.0
-33.8-8.2FY10/1Q(42.1)
10/2Q
Net income (loss) before taxCapital expenditure
Other changes in investments
Working capitaland others
19.4 31.1-1.61.0
-30.9-9.710/2Q (40.7)
47.9
-2.0 31.8-4.3 29.1
23 59 1
10/3Q54.5
10/3Q
JPY billion 09/12E 10/3E 10/6E 10/9E 10/12E
-23.5-9.1(32.6)
Debt 1,177.4 1,138.3 1,128.0 1,117.0 1,111.1
Cash and equivalents 22.6 26.2 23.6 18.9 19.7q
Net debt 1,154.7 1,112.1 1,104.3 1,098.1 1,091.3

12
FY2010 ForecastFY2010 ForecastFY2010 ForecastFY2010 Forecast

13Overview of Consolidated Forecast for FY10-Op. income: 25 JPY billion revised down to 55 JPY billionO di i 40 JPY billi i d d t 30 JPY billi-Ordinary income: 40 JPY billion revised down to 30 JPY billion.
-The reasons: Weak sales climate and negative temporary factors such as BF instability at Kashima steelworks, loss from SUMCO (equity method affiliate) and coking coal prices hike due to floods in Australia.
JPY billion FY09 FY10 forecast YoY
Changevs.
Oct.281H 1H forecast Oct. 283Q 4Q
forecast
) g p
3Q forecast
Sales 1,285.8 693.7 351.9 394.2 746.2 [1,500] 1,440 154.1 -60
Op. income(loss) (0.9) 34.7 4.9 15.2 20.2 [80] 55 55.9 -25(loss) ( ) [ ]
Ordinary income(loss) (36.6) 28.9 (2.0) 3.1 1.0 [70] 30 66.6 -40
Extraordinary income (loss) (3.1) - - - - [-] - 3.1 -income (loss) ( )
Net income (loss) (49.7) 34.8 0.0 (9.9) (9.8) [60] 25 74.7 -35
EPS (JPY) -10.74 7.53 0.01 -2.41 -2.11 [12.94] 5.39 16.13 -7.55
EBITDA 119.9 95.8 36.8 52.2 89.2 [210] 185 65.0 -25
Debt 1,138.3 1,117.0 1,111.1 1,110 1,110 [1,100] 1,110 -28.3 10
D/E ratio 1.37 1.37 1.37 1.39 1.39 [1.33] 1.39 0.02 0.06
*Oct. 28: Forecast as of Oct. 28, 2010
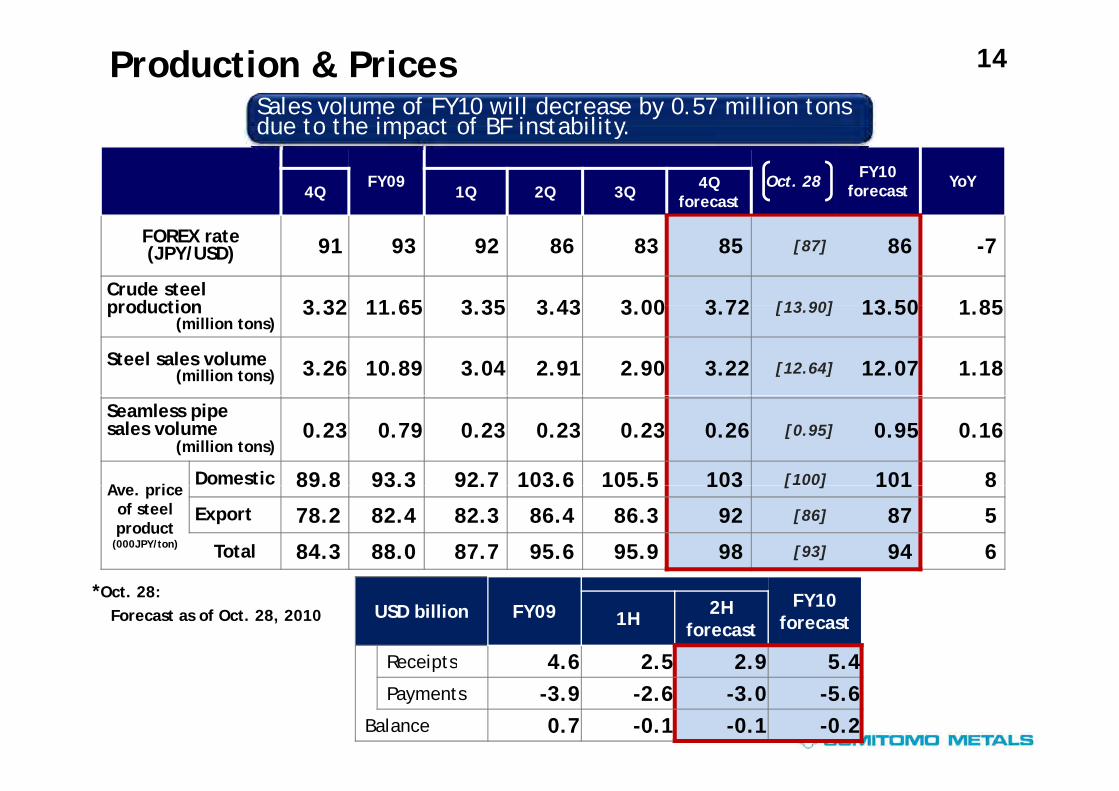
14Production & PricesSales volume of FY10 will decrease by 0.57 million tons due to the impact of BF instability
FY09 Oct. 28 FY10 forecast YoY
4Q 1Q 2Q 3Q 4Q forecast
due to the impact of BF instability.
FOREX rate (JPY/USD) 91 93 92 86 83 85 [87] 86 -7
Crude steel production 3 32 11 65 3 35 3 43 3 00 3 72 [13 90] 13 50 1 85production
(million tons)3.32 11.65 3.35 3.43 3.00 3.72 [13.90] 13.50 1.85
Steel sales volume (million tons) 3.26 10.89 3.04 2.91 2.90 3.22 [12.64] 12.07 1.18
Seamless pipe sales volume
(million tons)0.23 0.79 0.23 0.23 0.23 0.26 [0.95] 0.95 0.16
A iDomestic 89.8 93.3 92.7 103.6 105.5 103 [100] 101 8Ave. price
of steel product
(000JPY/ton)
89.8 93.3 92.7 103.6 105.5 103 [ ] 101 8
Export 78.2 82.4 82.3 86.4 86.3 92 [86] 87 5
Total 84.3 88.0 87.7 95.6 95.9 98 [93] 94 6
USD billion FY09 FY10 forecast1H 2H
forecast
Receipts 4 6 2 5 2 9 5 4
*Oct. 28: Forecast as of Oct. 28, 2010
Receipts 4.6 2.5 2.9 5.4 Payments -3.9 -2.6 -3.0 -5.6
Balance 0.7 -0.1 -0.1 -0.2
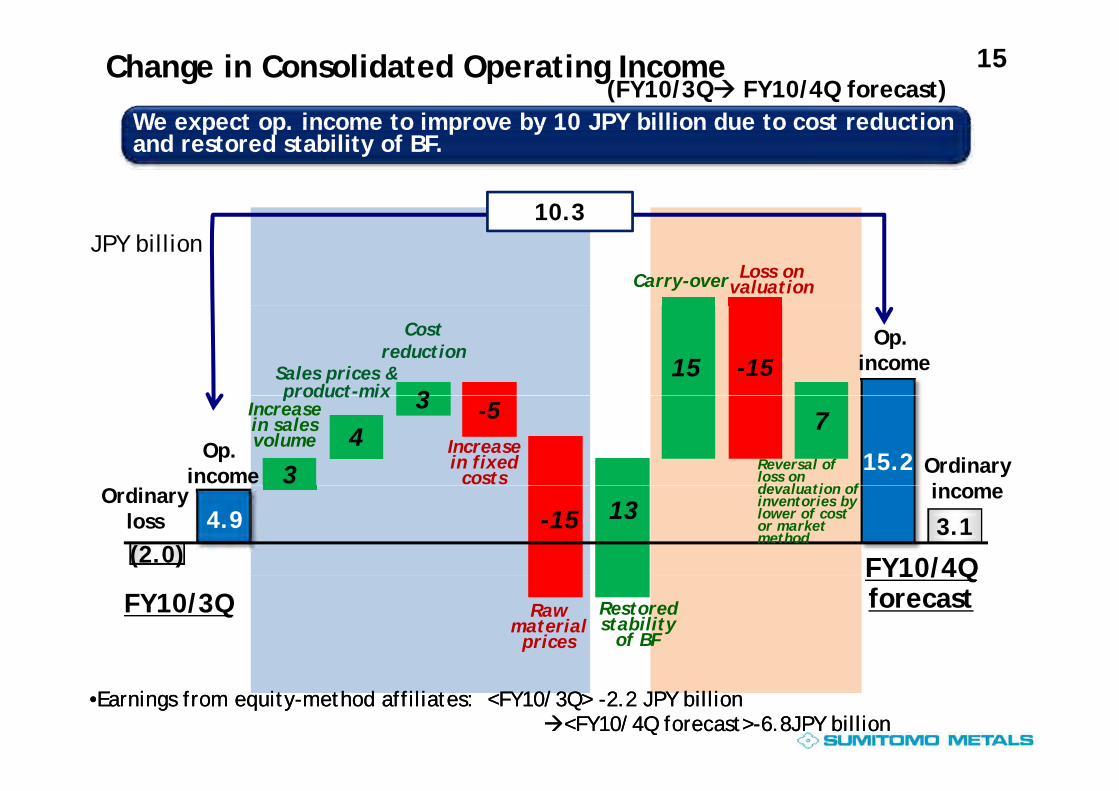
15Change in Consolidated Operating Income (FY10/3Q FY10/4Q forecast)
We expect op. income to improve by 10 JPY billion due to cost reduction
10 3
We expect op. income to improve by 10 JPY billion due to cost reduction and restored stability of BF.
10.3JPY billion
Carry-over Loss on valuation
315 -15
Op.income
Costreduction
Sales prices &product-mix
15.234
37-5
Ordinaryi
Op.income
product mixIncrease in sales volume Increase
in fixed costs
Reversal of loss on d l ti f
(2.0)3.14.9 -15 13incomeOrdinary
loss
FY10/4Q
devaluation of inventories by lower of cost or market method
FY10/3QFY10/4QforecastRaw
material prices
Restored stability
of BF
•Earnings from equity-method affiliates: <FY10/3Q> -2.2 JPY billion<FY10/4Q forecast>-6.8JPY billion
•Earnings from equity-method affiliates: <FY10/3Q> -2.2 JPY billion<FY10/4Q forecast>-6.8JPY billion
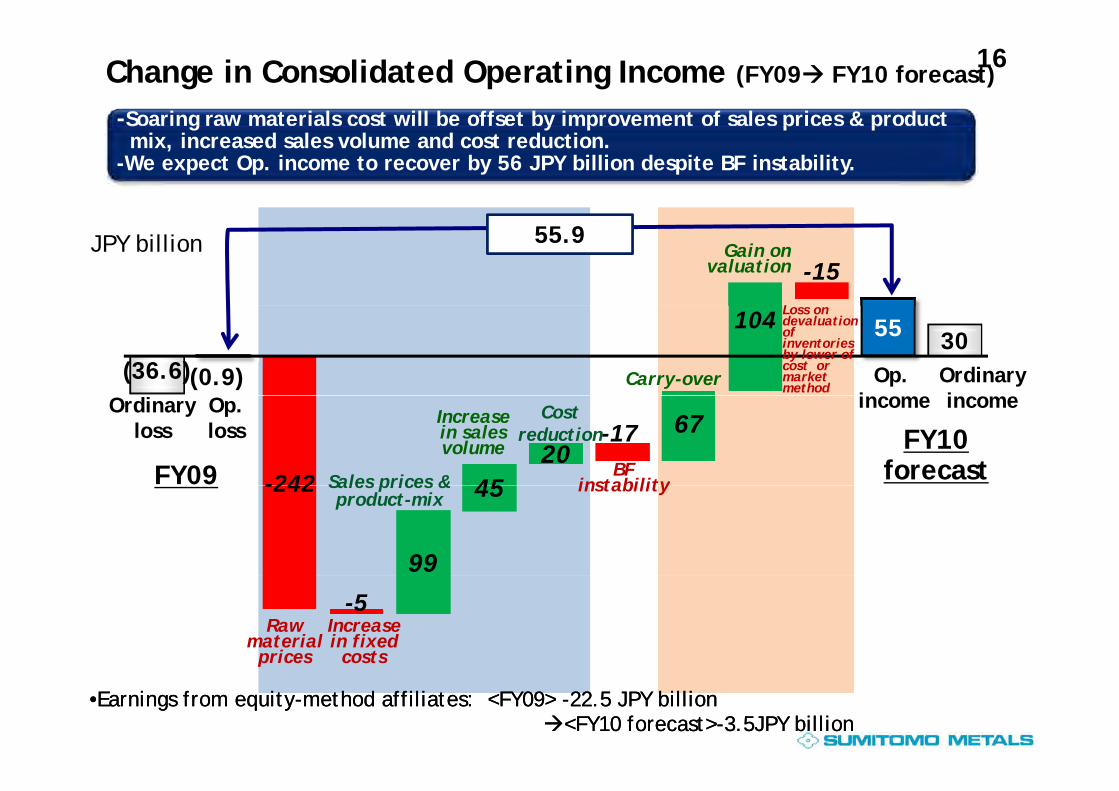
16Change in Consolidated Operating Income (FY09 FY10 forecast)
-Soaring raw materials cost will be offset by improvement of sales prices & product S g y p p pmix, increased sales volume and cost reduction.
-We expect Op. income to recover by 56 JPY billion despite BF instability.
-1555.9
L
Gain on valuation
JPY billion
(36.6)30
(0.9)
55104
Ordinaryi
Op.i
Carry-over
Loss on devaluation of inventories by lower of cost or market method
4520
67
-242
-17
FY09FY10
forecast
incomeincomeOrdinaryloss
Op.loss
Costreduction
Sales prices &
Increase in sales volume
BF instability
99
45-242 Sales prices &product-mix
instability
-5Increase in fixed
costs
Raw material
prices
•Earnings from equity-method affiliates: <FY09> -22.5 JPY billion<FY10 forecast>-3.5JPY billion
•Earnings from equity-method affiliates: <FY09> -22.5 JPY billion<FY10 forecast>-3.5JPY billion
p
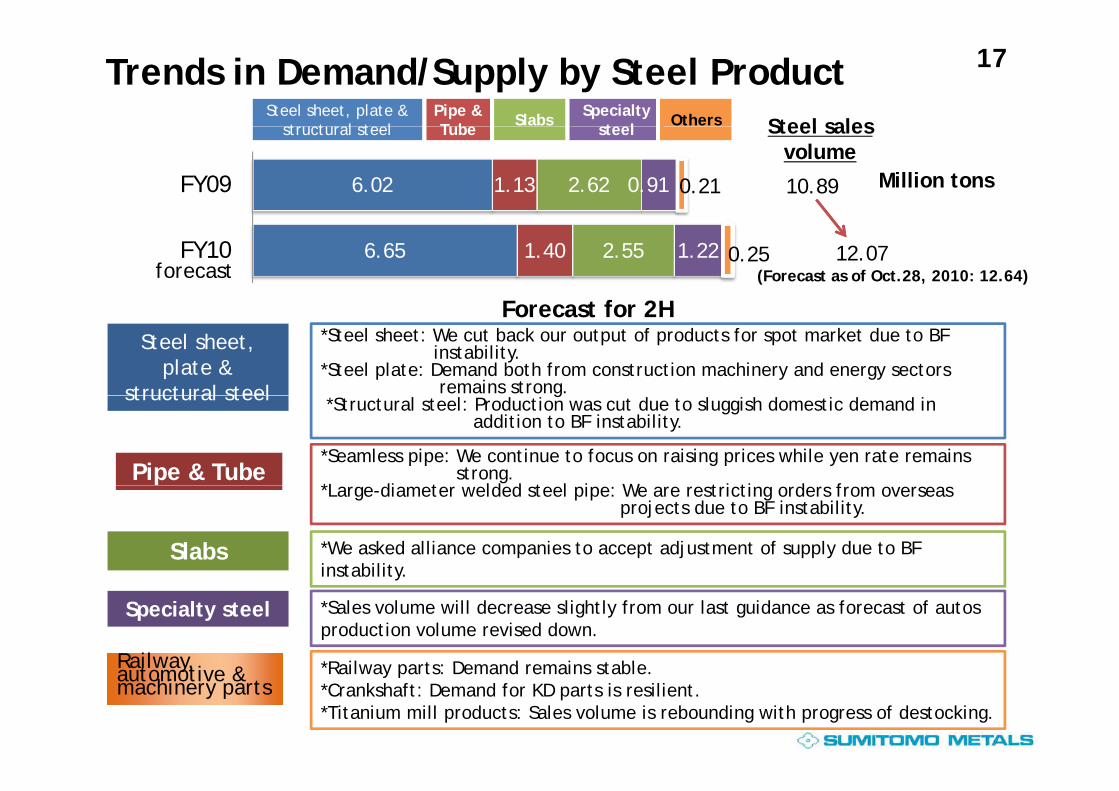
17Trends in Demand/Supply by Steel ProductPipe & T b Steel sales
Steel sheet, plate &t t l t l Slabs Specialty
t l Others
6.02 1.13 2.62 0.91 0.21 10.89FY09
Tube Steel sales volume
Million tons
structural steel steel
6.65 1.40 2.55 1.22 0.25 12.07FY10
Forecast for 2H
forecast (Forecast as of Oct.28, 2010: 12.64)
Steel sheet, plate &
structural steel
*Steel sheet: We cut back our output of products for spot market due to BF instability.
*Steel plate: Demand both from construction machinery and energy sectors remains strong.
Forecast for 2H
structural steel
Pipe & Tube
g*Structural steel: Production was cut due to sluggish domestic demand in
addition to BF instability.
*Seamless pipe: We continue to focus on raising prices while yen rate remains strong.
*L di t ld d t l i W t i ti d f
*We asked alliance companies to accept adjustment of supply due to BF instability.
Slabs
*Large-diameter welded steel pipe: We are restricting orders from overseasprojects due to BF instability.
instability.
Specialty steel
Railway
*Sales volume will decrease slightly from our last guidance as forecast of autos production volume revised down.
*Railway parts: Demand remains stableRailway, automotive & machinery parts
*Railway parts: Demand remains stable.*Crankshaft: Demand for KD parts is resilient.*Titanium mill products: Sales volume is rebounding with progress of destocking.
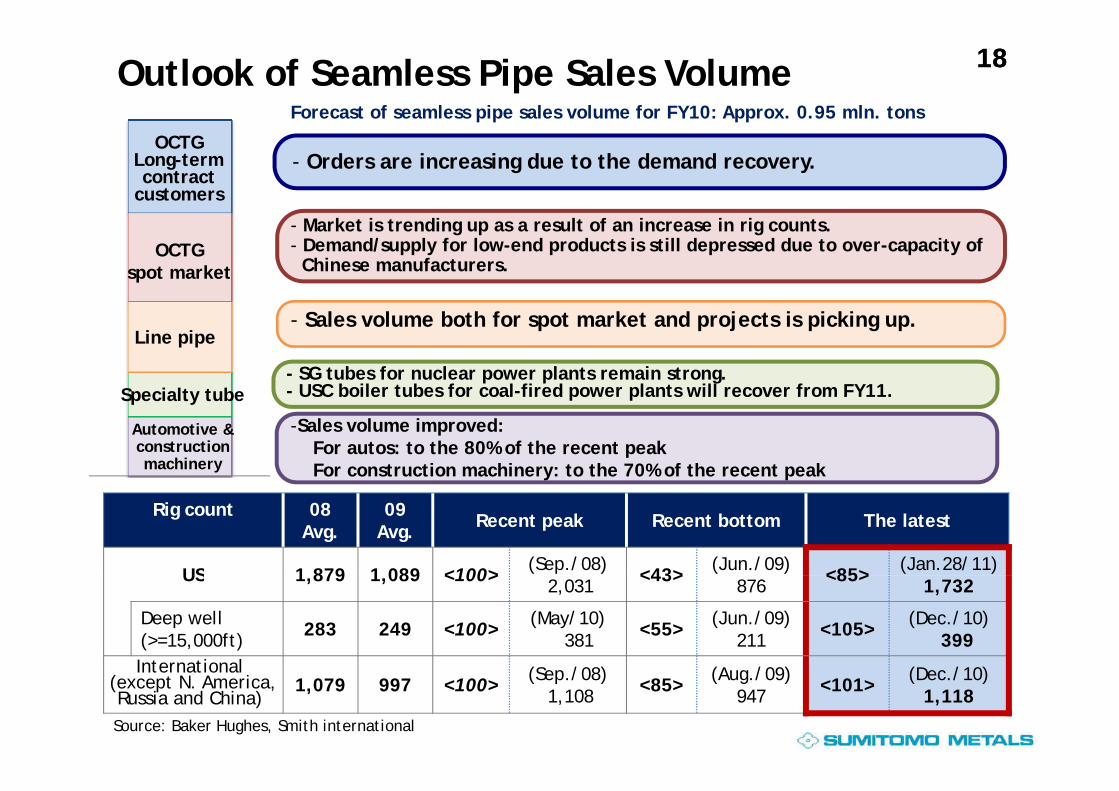
1818Outlook of Seamless Pipe Sales VolumeForecast of seamless pipe sales volume for FY10: Approx. 0.95 mln. tons
- Orders are increasing due to the demand recovery.OCTG
Long-term contract
customers
- Market is trending up as a result of an increase in rig counts.- Demand/supply for low-end products is still depressed due to over-capacity of
Chinese manufacturers.OCTG
spot market
- SG tubes for nuclear power plants remain strong.- USC boiler tubes for coal-fired power plants will recover from FY11.
- Sales volume both for spot market and projects is picking up.Line pipe
Specialty tube
-Sales volume improved:For autos: to the 80% of the recent peak For construction machinery: to the 70% of the recent peak
USC boiler tubes for coal fired power plants will recover from FY11.Specialty tube
Automotive & construction machinery
Rig count 08Avg.
09Avg. Recent peak Recent bottom The latest
US 1 879 1 089 <100> (Sep./08) <43> (Jun./09) <85> (Jan.28/11)US 1,879 1,089 <100> 2,031 <43> 876 <85> 1,732
Deep well(>=15,000ft) 283 249 <100> (May/10)
381 <55> (Jun./09)211 <105> (Dec./10)
399InternationalInternational
(except N. America, Russia and China)
1,079 997 <100> (Sep./08)1,108 <85> (Aug./09)
947 <101> (Dec./10)1,118
Source: Baker Hughes, Smith international

19Consolidated Sales & Op. Income by Internal Company
FY10JPY billion FY09 Oct. 28FY10
forecast YoY1Q 2Q 3Q 4Q
forecast
Steel sheet, plate and structural steel 498.5 135.6 143.7 141.2 160 [605] 580 81.5and structural steel 498.5 135.6 143.7 141.2 160 [ ] 580 81.5
Pipe & tube 472.9 122.0 121.4 127.3 140 [540] 510 37.1Railway &
automotive 86.6 23.4 25.0 23.2 27 [100] 100 13.4
Kokura 101.6 30.4 36.7 37.4 40 [145] 145 43.4Naoetsu and others 46.0 13.0 12.9 12.2 16 [55] 55 9.0
Total steel segment 1,205.8 324.6 339.8 341.5 383 [1,445] 1,390 184.2Others 79.9 16.9 12.2 10.4 10 [55] 50 -29.9
Total sales 1,285.8 341.6 352.1 351.9 393 [1,500] 1,440 154.2Op. Income (loss) by Internal Company (Approx.)
Steel sheet, plate and structural steel (4) 6 11 (6) 6 [39] 17 21
Pipe & tube
Pipe &tube 16 0 4 4 7 [13] 15 -1 Slabs (20) 2 (3) 1 (6) [(4)] (6) 14Slabs (20) 2 (3) 1 (6) [(4)] (6) 14
Kokura (7) 0 2 2 2 [7] 6 13
Total steel segment (7.6) 12.6 18.4 3.4 13.5 [73] 48.0 55.6 Others 6.6 1.6 2.1 1.5 1.5 [7] 7.0 0.4
Total Op. income (0.9) 14.2 20.4 4.9 15.2 [80] 55.0 55.9 * Oct. 28: Forecast as of Oct. 28, 2010

20Capital and Dividend Policy
Capital policy
Sumitomo Metals intends to maximize corporate value bydelivering sustained growth that balances quality and scale.Cash generated from operations will be used for investments that raise corporate value.Criteria for investments include whether they may accelerate distinctiveness of our group, and whether their returns could exceed the cost of capital, and thereby help raise our value.
l
We will return profits to shareholders through stable payment of dividends.
Financial target
Our medium-term target for financial leverage is a D/E ratio of below one.
Dividend forecast in FY105.0 JPY/share (Interim 2.5 JPY/share, Year-end 2.5 JPY/share)
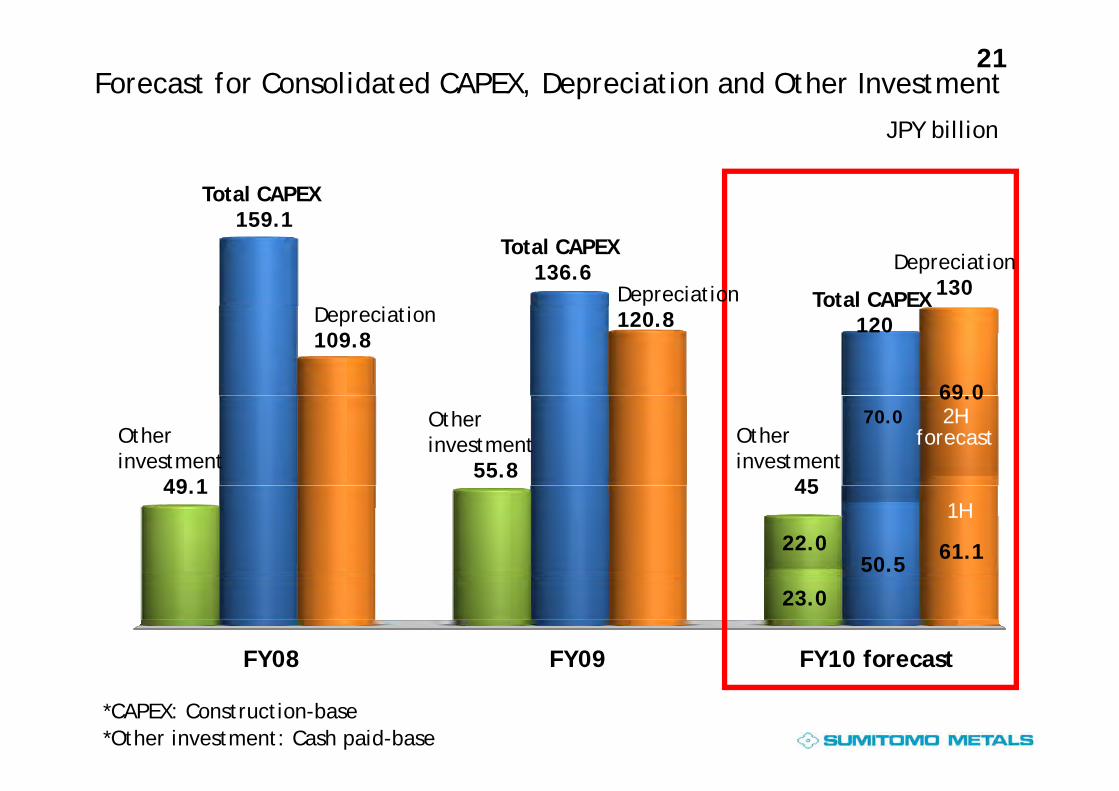
21Forecast for Consolidated CAPEX, Depreciation and Other Investment
JPY billion
Total CAPEX159 1
JPY billion
Depreciation
Depreciation 130
Total CAPEX136.6
Total CAPEX
159.1
69 0
Depreciation109.8
120.8Total CAPEX
120
70.069.0
Other investment
49 1
Other investment
55.8
Other investment
45
2Hforecast
50.5 61.122.0
49.1 451H
23.0
FY09FY08 FY10 forecastFY09FY08 FY10 forecast
*CAPEX: Construction-base*Other investment: Cash paid-base

22
Schedule for starting operation Invest. amount JPY billion FY09 FY10 FY11 FY12 FY13 FY14
CAPEX Plan and Overseas Business Investment Update
CAPEX
Renewal of upstream processes (Wakayama)-New No.1 BF + environmental protection 160 Jul. 09
Pipe & Tube
-New No.2 BF + reinforcement of CC 115
Increasing capacity for ultra high strength line pipes 10
Increasing capacity for SG tubes for nuclear 14
2H 12
Mar. 11
Apr 13g p ypower plants 14
Others
Steelmaking process innovations (Kokura) 27
Renewal of Corporate Research & Development 10
Oct. 10
Apr. 13
May 12Laboratory (Amagasaki) 10
Other investment (J/V: Joint Venture total investment amount, [ ]: Sumitomo Metals’ investment amount)
Steel sheet J/V in Vietnam (CSVC) 115 12
May. 12
Sheet & Plate
Bhushan Steel in India Orissa PJ
West Bengal PJ
-Technicalassistance-Feasibility
study
Canadoil Group’s steel plate mill[50mln $] 13In Thailand[50mln.$]
Pipe & Tube Integrated steel works with Seamless pipe
mill J/V in Brazil (VSB) 200
13
Dec. 10 First piercing
1H 11St l ki l t
Railway & Auto.
Forged crankshaft business J/V in India (SMAC) 1 Apr. 10
Steel making plant

23
SupplementSupplementpppp
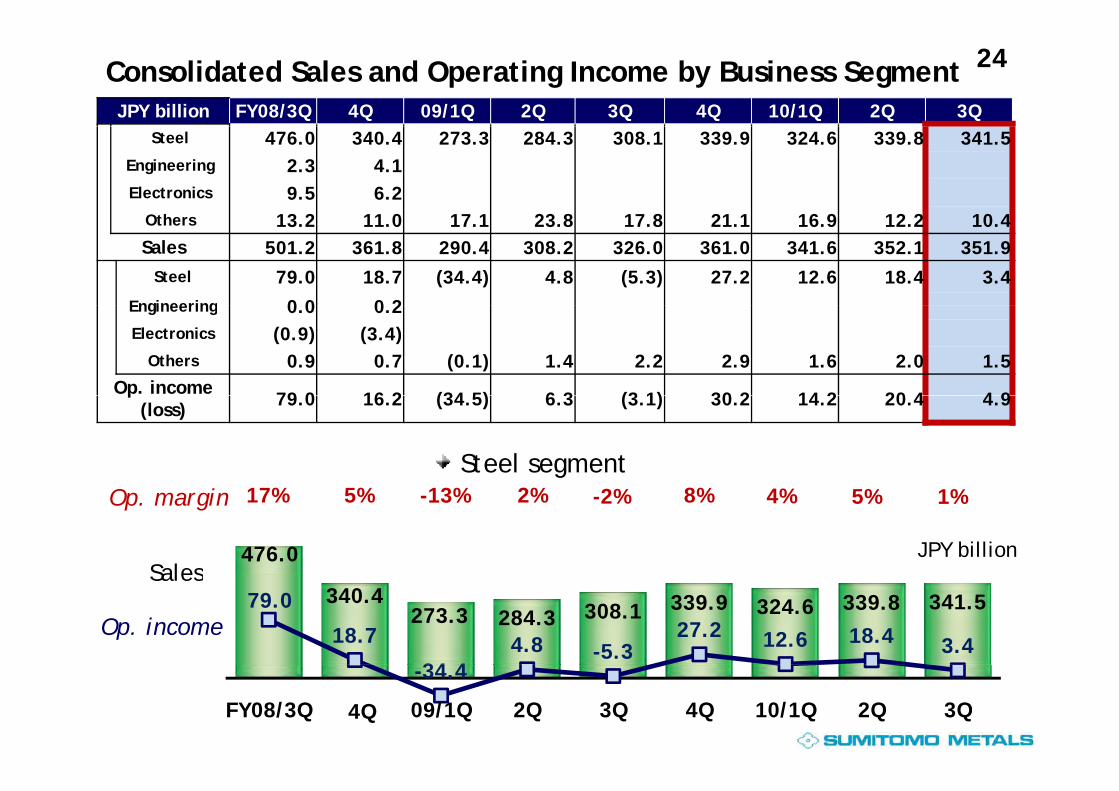
24Consolidated Sales and Operating Income by Business SegmentJPY billion FY08/3Q 4Q 09/1Q 2Q 3Q 4Q 10/1Q 2Q 3Q
Steel 476.0 340.4 273.3 284.3 308.1 339.9 324.6 339.8 341.5 Engineering 2.3 4.1 Electronics 9.5 6.2
Oth 13 2 11 0 17 1 23 8 17 8 21 1 16 9 12 2 10 4Others 13.2 11.0 17.1 23.8 17.8 21.1 16.9 12.2 10.4 Sales 501.2 361.8 290.4 308.2 326.0 361.0 341.6 352.1 351.9
Steel 79.0 18.7 (34.4) 4.8 (5.3) 27.2 12.6 18.4 3.4 Engineering 0 0 0 2Engineering 0.0 0.2 Electronics (0.9) (3.4)
Others 0.9 0.7 (0.1) 1.4 2.2 2.9 1.6 2.0 1.5 Op. income
79 0 16 2 (34 5) 6 3 (3 1) 30 2 14 2 20 4 4 9p
(loss) 79.0 16.2 (34.5) 6.3 (3.1) 30.2 14.2 20.4 4.9
Steel segment
476.0
17% 5% -13% 2% -2% 8% 4% 5% 1%
Sales
Op. margin
JPY billion
340.4273.3 284.3 308.1 339.9 324.6 339.8 341.579.0
18.7
34 44.8 -5.3
27.2 12.6 18.4 3.4
Sales
Op. income
-34.4
FY08/3Q 4Q 09/1Q 2Q 3Q 4Q 10/1Q 2Q 3Q
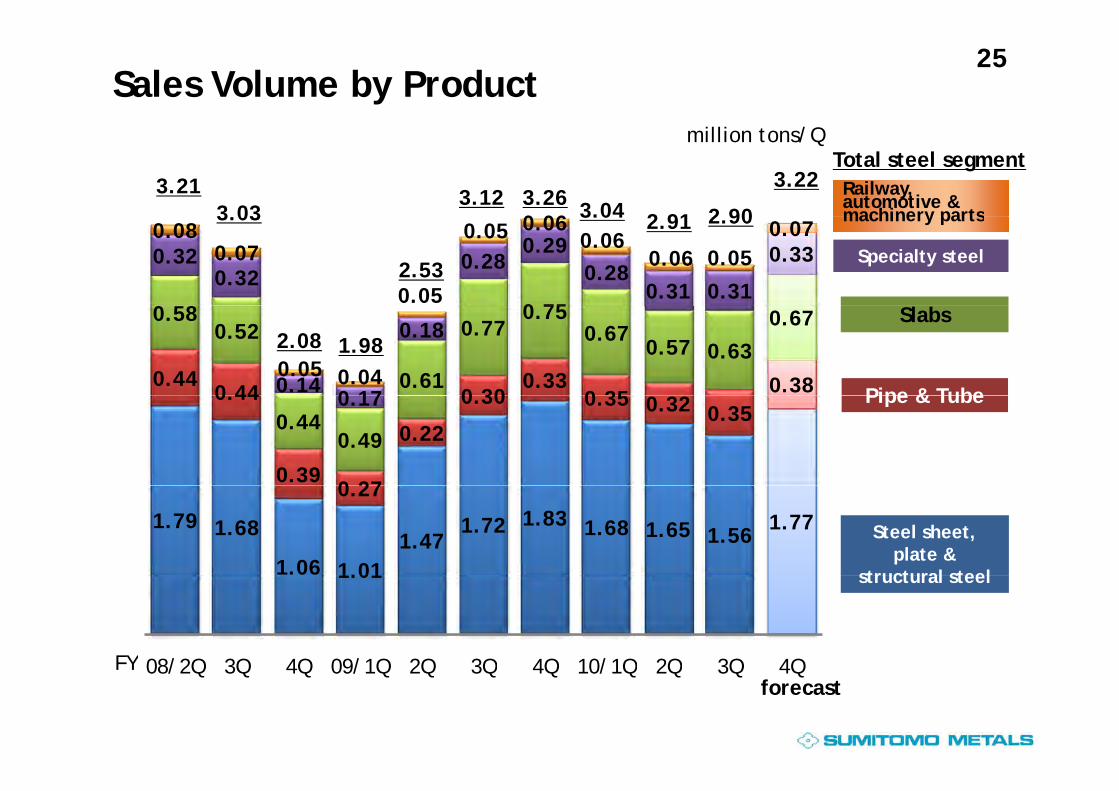
25Sales Volume by Product
0 06
3.21 3 03
3.12 3.26 3.04 2 91 2 90
3.22 Railway, automotive & machinery parts
million tons/QTotal steel segment
0 58 0 75
0.320.32
0.280.29
0.280.31 0.31
0.330.08
0.07
0.05
0.05 0.060.06
0.06 0.050.07
3.03
2.53
3.04 2.91 2.90
Specialty steel
machinery parts
0.440 44 0 30
0.330 35
0.38
0.580.52
0.61
0.770.75
0.670.57 0.63
0.67
0.140 17
0.18
0.05 0.04
2.08 1.98
Pipe & Tube
Slabs
0.44
0.390 27
0.22
0.30 0.35 0.32 0.350.440.49
0.17 Pipe & Tube
1.79 1.68
1.06 1.011.47
1.72 1.83 1.68 1.65 1.561.77
0.27
Steel sheet, plate &
structural steel1.01
08/2Q 3Q 4Q 09/1Q 2Q 3Q 4Q 10/1Q 2Q 3Q 4Q
structural steel
FY 08/2Q 3Q 4Q 09/1Q 2Q 3Q 4Q 10/1Q 2Q 3Q 4Qforecast
FY
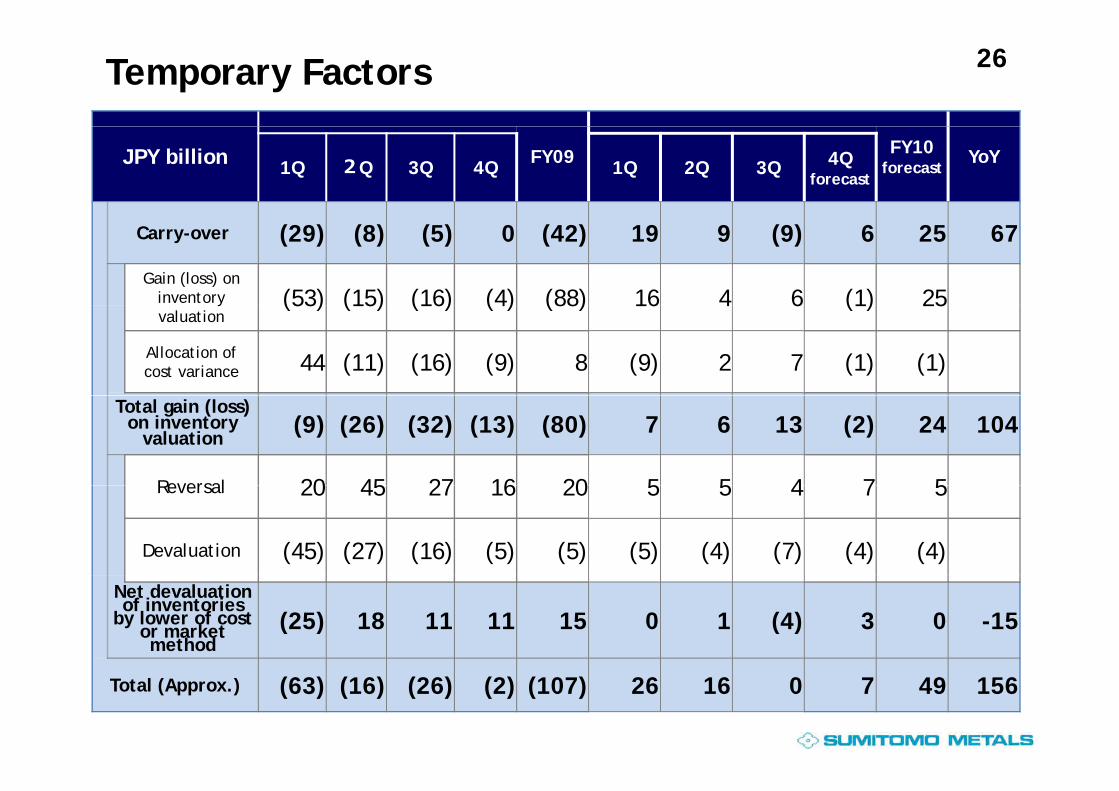
26Temporary Factors
JPY billion FY09 FY10 forecast
YoY1Q 2Q 3Q 4Q 1Q 2Q 3Q 4Q forecast
Carry-over (29) (8) (5) 0 (42) 19 9 (9) 6 25 67
Gain (loss) on inventory (53) (15) (16) (4) (88) 16 4 6 (1) 25yvaluation
(53) (15) (16) (4) (88) 16 4 6 (1) 25
Allocation of cost variance 44 (11) (16) (9) 8 (9) 2 7 (1) (1)
Total gain (loss) on inventory
valuation(9) (26) (32) (13) (80) 7 6 13 (2) 24 104
Reversal 20 45 27 16 20 5 5 4 7 5Reversal 20 45 27 16 20 5 5 4 7 5
Devaluation (45) (27) (16) (5) (5) (5) (4) (7) (4) (4)
Net devaluation of inventories
by lower of cost or market method
(25) 18 11 11 15 0 1 (4) 3 0 -15
Total (Approx.) (63) (16) (26) (2) (107) 26 16 0 7 49 156

27
OthOth
Domestic and Export Steel Sales for FY10/3QExport Steel Sales by Region (Value basis)
8%8%
EuropeEurope11%11%
OthersOthers3%3%
Volume1 44
Volume1 46
Value124 6
Value153 8 ddlddlst
ic
ort N. America
AsiaAsia70%70%
8%1.4450%
1.4650%
124.645%
153.855%
Middle Middle EastEast
Dom
es
Expo
Unit: JPY billion, million tons
Export Steel Sales by Region (Value basis)
16%16% 15%15% 16%16% 11%11% 9%9% 12%12% 6%6% 13%13% 10%10% 8%8% 8%8%8%8% 5%5% 6%6% 7%7% 11%11%
8%8% 9%9%7%7% 8%8% 7%7% 8%8% 9%9% 8%8%
7%7% 10%10% 10%10% 9%9% 7%7%10%10% 13%13%
11%11% 9%9% 7%7% 9%9% 12%12% 11%11%5% 6% 3% 4% 5% 9% 8% 4% 5% 6% 4% 2% 3%
Others
Europe
( )
16%16% 15%15% 9%9%13%13% 13%13%
12%12% 8%8%
46% 46% 46% 47% 48% 52% 52%46% 44% 41% 45% 42% 45%
N. America
Middle East
Asia
64%64% 64%64% 65%65% 69%69% 68%68% 60%60% 57%57% 66%66% 71%71% 68%68% 69%69% 69%69% 70%70%
Export ratio
07/3Q4Q
08/1Q2Q 3Q 4Q
09/1Q2Q 3Q 4Q
10/1Q2Q 3Q FY

28Reference (1)(million tons/Q)Crude Steel Production
1 08 1 06 1 06 1 08 1 05 1 11 1 06 1 08 1.210.39 0.38 0.36 0.36 0.33 0.32
0 230.26 0.25 0.30 0.30
0.34
0.40 3.40 3.52 3.49 3.50 3.54 3.36
2.48 2 282.79
3.26 3.32 3.35 3.433.00
3.72(million tons/Q)
k
Kokura & others
1 96 2.05 2.07 2.08 2.13 1.99 1 73 1 87 1 96 1.99 2.04 2.12
1.05 1.08 1.06 1.06 1.08 1.05
0.83 0.80 0.83
1.13 1.11 1.06 1.08
1.25
1.21 0.22 0.22
0.23 2.28
K hi
Wakayama
1.96 2.05 2.07 2.08 1.99 1.42 1.26
1.73 1.87 1.96 1.99 2.04 1.41
FY07/2Q 3Q 4Q 08/1Q 2Q 3Q 4Q 09/1Q 2Q 3Q 4Q 10/1Q 2Q 3Q 4Q
Kashima
forecast
(million tons/Q)Steel Products Sales Volume
3 06 3 10 3 31 3 12 3 21 3 12 3 26 3 223.06 3.10 3.31 3.12 3.21 3.032.08 1.98
2.533.12 3.26 3.04 2.91 2.90 3.22
FY07/2Q 3Q 4Q 08/1Q 2Q 3Q 4Q 09/1Q 2Q 3Q 4Q 10/1Q 2Q 3Q 4Qforecast

29Reference (2)1 05 1.13 1.16 1 11 1.15Seamless Pipe Sales Volume
(million tons)
0.29 0.28 0.310 23
0.29 0.28 0.28
0.230.26
0.910.80
0.620.80
1.010.87 0.91
1.05 1.13 1.11
0.790.95
4Q
(million tons)
0.28 0.26 0.26 0.20 0.23
0.30 0.29 0.300.17 0.23
0.28
0.200.23
0.23 Q
3Q
2Q
1Q.
FY97 98 99 00 01 02 03 04 05 06 07 08 09 10
Q
forecast
Super high-alloy for OCTG Alloy steel for sour service 13CR
Seamless Pipe Super High-end Sales Volume (thousand tons)
394 813
16 16 1713
17105 97 106 129
143 134 129 105
139 Supe g alloy o OC G lloy steel o sou se v ce 3C
54 57 63 73 8861 54 51 62
47 32 35 43
39 57 58 41
60 4 8 8 13
FY02 03 04 05 06 07 08 09 10forecast

30Reference (3)Ave. price of steel product (000JPY/ton)
107 104 110
127 130 133
122 124 130 111
93 93104 106 103
Ave. Domestic price of steel product (000JPY/ton)
Ave. price of steel product (000JPY/ton)
109
8779 84 88
96 96 98100 98106
12293 87 90 93
FY07/3Q 4Q 08/1Q 2Q 3Q 4Q 09/1Q 2Q 3Q 4Q 10/1Q 2Q 3Q 4Qforecast
133 137 135Ave. Export price of steel product (000JPY/ton)
114105 105 108
96 97
94 90 91 9286
118 114 116109
8692
96 94 9783 8580
7178 82 86FOREX rate (JPY/USD)
FY07/3Q 4Q 08/1Q 2Q 3Q 4Q 09/1Q 2Q 3Q 4Q 10/1Q 2Q 3Q 4Qforecast

31Reference (4)CAPEX and Depreciation
(JPY billion)
106.6
135.8
178.8159.1
136.6120
146.8132.2
121.1
91 7 102.5 109.8 120.8130
CAPEX Depreciation(JPY billion)
77.0 74.650.9
67.1 60.382.691.7
78.3 79.2 75.2 72.2
FY99 00 01 02 03 04 05 06 07 08 09 10
F C h Flforecast
220 8277.3 311.9
230 0
219.4 193.4 265.3 248.0 62.8 (44.2) (24.3) (105.9) (13.2) 54.2 23.3 7.2 21.8
Free Cash Flows (JPY billion)
161.1 220.8
171.8 230.0
190.5
67.0 27.1
90.7 65.5 47.9 54.5 58.3
(27.4) (12.0)(63.8)
(108.9)(172.9)
(40.4) (36.5) (42.1) (40.7) (32.6)
(274.3)(214.9)
FY02 03 04 05 06 07 08 09 FY09/3Q 4Q FY10/1Q 2Q 3Q
Op. CFs Invest. CFs FCF

32
Deliver sustained growth inDeliver sustained growth inDeliver sustained growth inDeliver sustained growth incorporate value by emphasizing qualitycorporate value by emphasizing quality
Become a company Become a company trusted by all stakeholderstrusted by all stakeholderstrusted by all stakeholderstrusted by all stakeholders


