Iranian Int. J. Sci. 3(2), 2002, p.135-154 Microcosm Experiment: The Relationship Between Salinity and Light on the Production of Extracellular Material by Synechococcus sp. F. Ghassemzadeh Biology Department, Faculty of Science, Ferdowsi University of Mashhad, Mashhad, 91775-1436, IRAN, email: [email protected](received: 3/11/2002 ; accepted: 7/11/2002) Abstract Synechococcus sp., the hypersaline Cyanobacterium form, produces extracellular products under high salinity and high intensity of light. The excretion of large amounts of extracellular material caused an additional increase in brine viscosity. An experiment was undertaken using twelve aquaria filled with brine. Measurements were made of salinity , viscosity and the amount of organic materials at the high and low light intensity . Relative viscosity and the amount of organic materials were higher in conditions of high salinity and high light intensity, because under these conditions Synechococcus produced more extracellular products. Therefore these can decrease the quality and quantity of salt produced in solar salt field which is economically important to understand the effect of these extracellular materials in these environments. Keywords: Synechococcus, salinity, Extracellular products, viscosity. Introduction Synechococcus is a non-heterocystous unicellular Cyanobacterium that can fix free nitrogen under anoxic conditions or in low oxygen concentrations (Stal, 1991). It has a very variable size (2-10 μm) and shape (ellipsoidal, ovoid or cylindrical) and produces extracellular mucus in which its cells are found embedded (Borowitzka, 1981). Synechococcus colonies usually take the form of a slimy or gelatinous mat in the shallow littoral zone of salt lakes (Bauld, 1981), but may also appear as single cells suspended in the water column. Golubic
Transcript
Iranian Int. J. Sci. 3(2), 2002, p.135-154
Microcosm Experiment: The Relationship Between Salinity and Light onthe Production of Extracellular Material by Synechococcus sp.
F. GhassemzadehBiology Department, Faculty of Science, Ferdowsi University of Mashhad,Mashhad, 91775-1436, IRAN,email: [email protected]
(received: 3/11/2002 ; accepted: 7/11/2002)
AbstractSynechococcus sp., the hypersaline Cyanobacterium form, producesextracellular products under high salinity and high intensity of light.The excretion of large amounts of extracellular material caused anadditional increase in brine viscosity. An experiment was undertakenusing twelve aquaria filled with brine. Measurements were made ofsalinity , viscosity and the amount of organic materials at the high andlow light intensity . Relative viscosity and the amount of organicmaterials were higher in conditions of high salinity and high lightintensity, because under these conditions Synechococcus producedmore extracellular products. Therefore these can decrease the qualityand quantity of salt produced in solar salt field which is economicallyimportant to understand the effect of these extracellular materials inthese environments.
IntroductionSynechococcus is a non-heterocystous unicellular Cyanobacterium thatcan fix free nitrogen under anoxic conditions or in low oxygenconcentrations (Stal, 1991). It has a very variable size (2-10 µm) andshape (ellipsoidal, ovoid or cylindrical) and produces extracellularmucus in which its cells are found embedded (Borowitzka, 1981).Synechococcus colonies usually take the form of a slimy or gelatinousmat in the shallow littoral zone of salt lakes (Bauld, 1981), but mayalso appear as single cells suspended in the water column. Golubic
Ghassemzadeh, F. IIJS, 3 (Biol.),2002___________________________________________________________________
ÎÐÓ
(1980) noted that it is the commonest genus in mucilaginous coatingsin the benthos of many salt ponds.
Like many other bacteria and algae, Synechococcus produces extra-cellular products (ECPs). For taxa other than Synechococcus, a widevariety of ECPs are now known (e.g. O' Colla, 1962; Fogg, 1962,1966 and 1971; Hellebust, 1974; Arad et al., 1985; De Philippis et al.,1993). ECPs are also known to play important roles in algal growthand physiology as well as more generally in food chains andecosystems (Hellebust, 1974). Their rate of production depends onboth internal physiological factors and external environmental ones(Hellebust, 1974). Some of this extracellular polysaccharide issecreted and liberated to the medium and can increase viscosity of themedium (Guillard and Hellebust, 1971 and Vincenzini et al. 1990a andb). The ECP produced by Synechococcus is in the form of a mucilage.Some forty years ago, Seshadri and Buch (1958) noted that themucilageous ECP of Synechococcus decreased the quality and quantityof salt in solar salt ponds by adhering to salt crystals, coloringharvested salt, imparting a foul smell to it, and by increasing brineviscosity.
Despite the obvious economic significance of these effects, rigorousevaluation of them is lacking. To address this matter, experimentalinvestigations were undertaken using material from the Dry Creek solarsalt field located north of Adelaide, Australia.
In the first experiment, twelve aquaria were set up outside of thelaboratories. This experiment was designed to determine therelationship between salinity and light on the amount of ECP producedby Synechococcus. An additional experiment examined the chemicalcomposition of ECP from Synechococcus.
MethodsExperimental designTwelve aquaria, each 40 x 30 x 50 cm (length, width, depth), werelocated outside of the Zoology building, University of Adelaide. Waterfrom two ponds at Dry Creek solar salt field with average saltiness of190.5 g/L and 285 g/L, respectively, was filtered through a net (meshsize ∼ 50 µm) to remove large organisms and debris. Ten liters of
Microcosm experiment: The relationship between …___________________________________________________________________
ÎÐÔ
water, salinity 190.5 g/L, were added to six aquaria; they weredesignated low salinity (aquaria LS). Ten liters of water, of salinity285 g/L, was added to other six aquaria; these aquaria were designatedhigh salinity (aquaria HS). Synechococcus was collected from pondwith average salinity of 190.5 g/L, drained of excess water andtransferred to the laboratory. Approximately 700 g of thisSynechococcus material was transferred to each aquarium thatsimulated conditions in solar salt fields. After 24 hrs, six aquaria, threeLS and three HS, were covered by fine-meshed shade cloth to decreaselight intensity (70% reduction); these aquaria were designated as low-salinity-covered (LSC), and high-salinity-covered (HSC) aquaria. Theother aquaria were designated as low-salinity-uncovered (LSU), andhigh-salinity-uncovered (HSU) aquaria. HSU, HSC, LSU and LSCaquaria were randomly arranged and the position of each aquarium waschanged every two days.
To avoid nutrient depletion, phosphorus (as K2HPO4) and nitrogen(as NaNO3) were added daily to the aquaria. The amounts chosen(0.019 mg/L phosphate and 0.016 mg/L nitrate) approximated to thenatural concentrations in the study area. To compensate forevaporation, distilled water was added daily. Additionally, aquariawalls were scrubbed daily to prevent the build-up of salts above water-level. The volume of evaporated water was also calculated daily.
Solar irradiance was measured with Lunasx3 (Gossen) daily at 2:00pm. Maximum and minimum air temperature were recorded daily, aswas water temperature in aquaria at 2:00 pm.Sample collectionWater samples (30 ml) were collected weekly from each aquarium aftermixing the aquarium slowly with glass rod to homogenize it.Synechococcus material (approximately 5 gm) was collected from eachaquarium at the end of the first, and last week of the experiment tomeasure chlorophyll a and estimate the amount of ECP. TheSynechococcus was collected on paper filter (Whatman #1), drained bygentle suction for 2-3 minutes, and then placed on absorbent paper in apetri-dish to remove further brine. The filter paper was stored in aplastic bag and frozen until further analysis.
Ghassemzadeh, F. IIJS, 3 (Biol.),2002___________________________________________________________________
ÎÐÕ
Laboratory measurementsThe pH, conductivity and viscosity of water samples were measured.Conductivity measurements were converted to salinity using theregression equation of Williams (1986). Viscosity was measured witha capillary viscometer (PSL, Model C-3889, Type BS/U). Relativeviscosity was obtained by comparing the viscosity of samples and theviscosity of seawater evaporated to the same salinity (for more detailsee Ghassemzadeh, 1997).
Because it is difficult to determine the amount of ECP per cell ofSynechococcus, estimates were made from Synechococcus cellsembedded in mucilage by measuring chlorophyll a and ash-free dryweight (AFDW). AFDW gave an estimate of both organic material(cells + mucilage); chlorophyll a and also gave an estimate of cellbiomass. Thus, AFDW yielded an estimate of mucilage. Derivingestimates, a 5g of frozen Synechococcus material was dried at 105 °Cfor 24 hours to give dry weight (APHA, 1992), then ashed at 550 °Cfor 4 hours in a muffle furnance (Aloi, 1990). AFDW was calculated asthe difference between dry weight and the weight of the ash afterashing.
To drive estimates of cell biomass, chlorophyll a was first extractedfrom 1g stored Synechococcus material using the methods of Krishman(1991) who noted that the most effective extraction of chlorophyll afrom Synechococcus is with 90% methanol. Pigments were extracted in90% methanol by placing each sample with 5 ml of solvent at 4°C inthe dark for 12-18 hours, and then transferring it to a 70°C water bathwhere it was boiled in methanol for 2 minutes. Short periods of boilingaid pigment extraction without converting significant amounts ofchlorophyll a into phaeophytin (Tett et al., 1975). The solvent reactedwith the mucilage and white flakes appeared but stirrers improvedextraction. The solvent and extract were then put into a centrifugetube. After the first extraction, 5 ml methanol was added to thesample, boiled for 2 minutes and added to the first extraction in acentrifuge tube. It was then centrifuged at 2000 RPM. Immediatecentrifugation provided rapid cooling of the extracts and aidedprevention of pigment breakdown. Optical densities were measuredagainst a methanol blank at 750 (before acidification) 665, and 750
Microcosm experiment: The relationship between …___________________________________________________________________
ÎÐÖ
(after acidification) nm using a Varian UV/visible spectrophotometer.After the initial reading, extracts were acidified with two drops of 8%(2N) HCl and optical densities measured at the same wavelengths.Chlorophyll a was estimated using the equation of Talling and Driver(1963) as post-acidification readings may increase with time, twobackground readings were used (Tett et al., 1975).
To confirm the identity of organisms in the aquaria and estimate theirdensities, samples were collected for microscopic examination. Visualobservation of colour changes in the aquaria were noted.
Solid state high resolution 13C Nuclear Magnetic Resonance (NMR)with Cross Polarization and Magic Angle Spinning (CP/MAS)techniques were used to determine the chemical composition of ECPproduced by Synechococcus. A portion of Synechococcus standingcrop that had been stored frozen was freeze dried by Dynavac FreezeDrier, Model FD.5 for determination of ECP chemical composition.
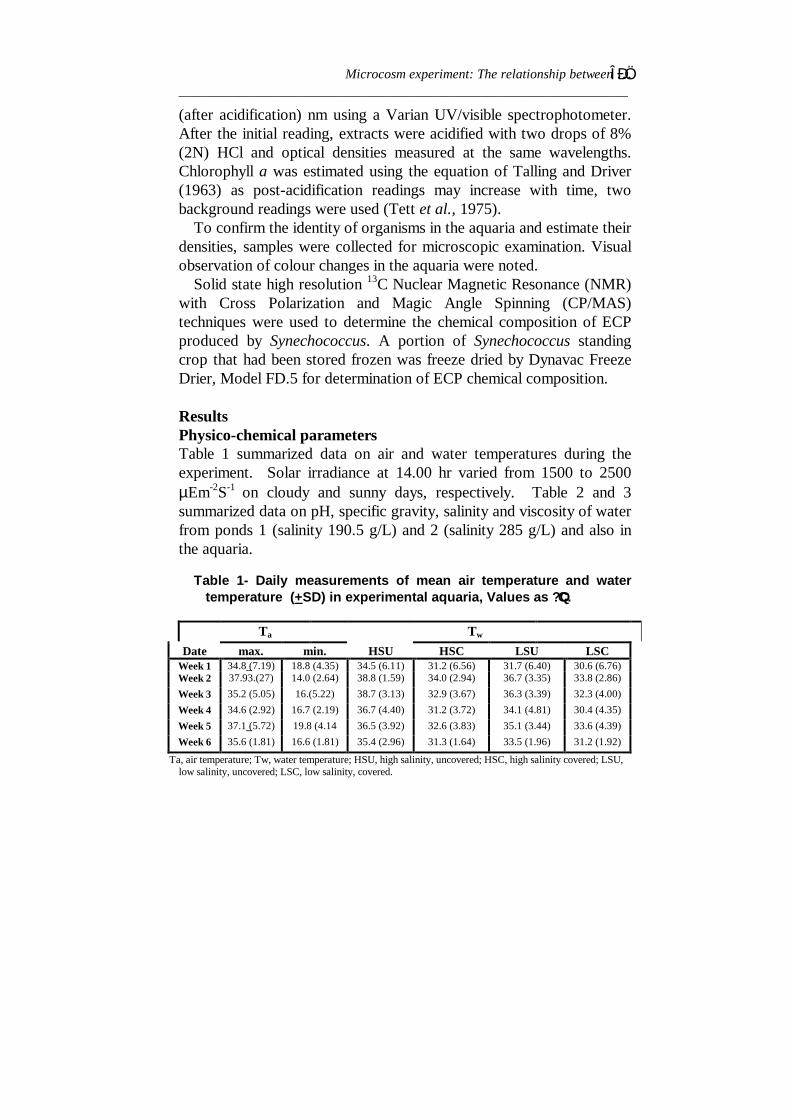
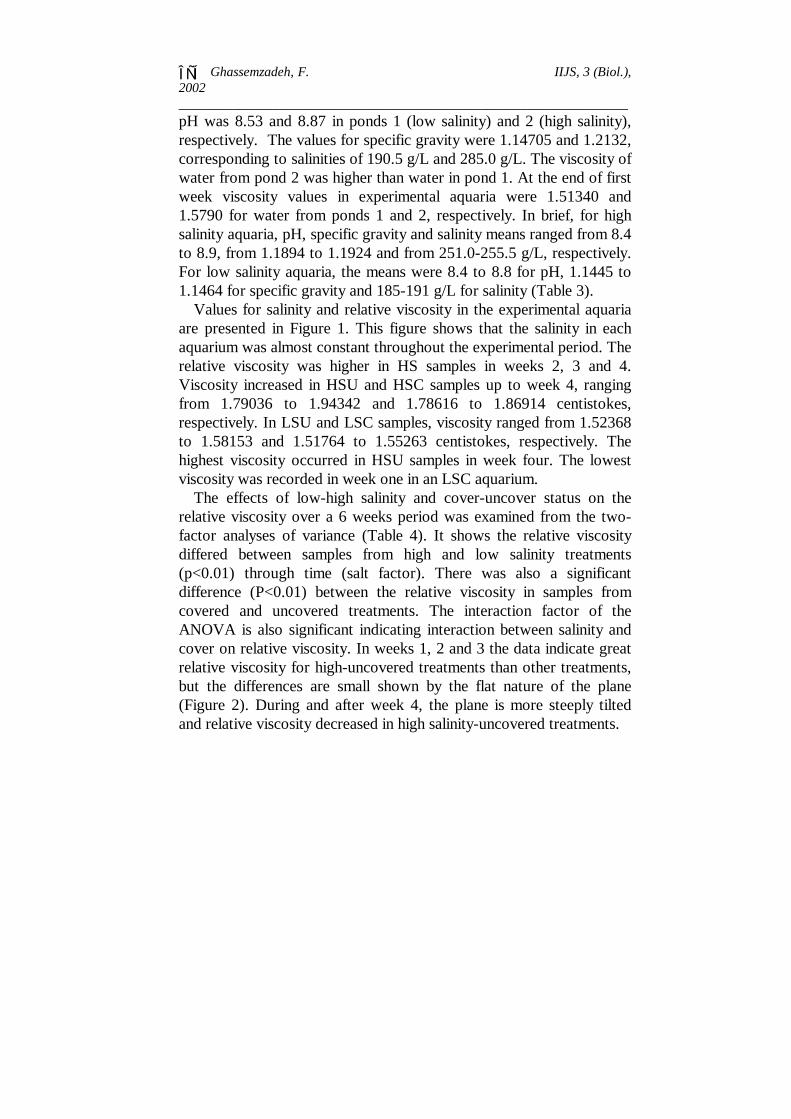
ResultsPhysico-chemical parametersTable 1 summarized data on air and water temperatures during theexperiment. Solar irradiance at 14.00 hr varied from 1500 to 2500µEm-2S-1 on cloudy and sunny days, respectively. Table 2 and 3summarized data on pH, specific gravity, salinity and viscosity of waterfrom ponds 1 (salinity 190.5 g/L) and 2 (salinity 285 g/L) and also inthe aquaria.
Table 1- Daily measurements of mean air temperature and watertemperature (+SD) in experimental aquaria, Values as ?QC.
Ta, air temperature; Tw, water temperature; HSU, high salinity, uncovered; HSC, high salinity covered; LSU,low salinity, uncovered; LSC, low salinity, covered.
Ghassemzadeh, F. IIJS, 3 (Biol.),2002___________________________________________________________________
ÎÑÍ
pH was 8.53 and 8.87 in ponds 1 (low salinity) and 2 (high salinity),respectively. The values for specific gravity were 1.14705 and 1.2132,corresponding to salinities of 190.5 g/L and 285.0 g/L. The viscosity ofwater from pond 2 was higher than water in pond 1. At the end of firstweek viscosity values in experimental aquaria were 1.51340 and1.5790 for water from ponds 1 and 2, respectively. In brief, for highsalinity aquaria, pH, specific gravity and salinity means ranged from 8.4to 8.9, from 1.1894 to 1.1924 and from 251.0-255.5 g/L, respectively.For low salinity aquaria, the means were 8.4 to 8.8 for pH, 1.1445 to1.1464 for specific gravity and 185-191 g/L for salinity (Table 3).
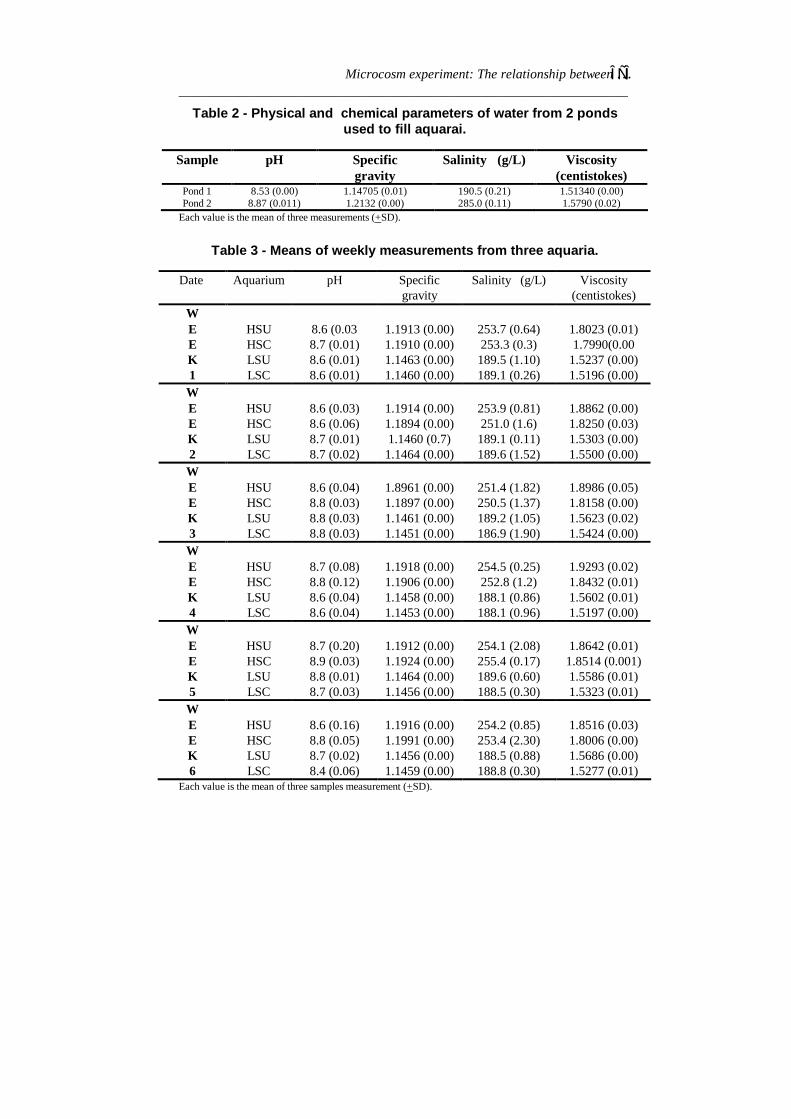
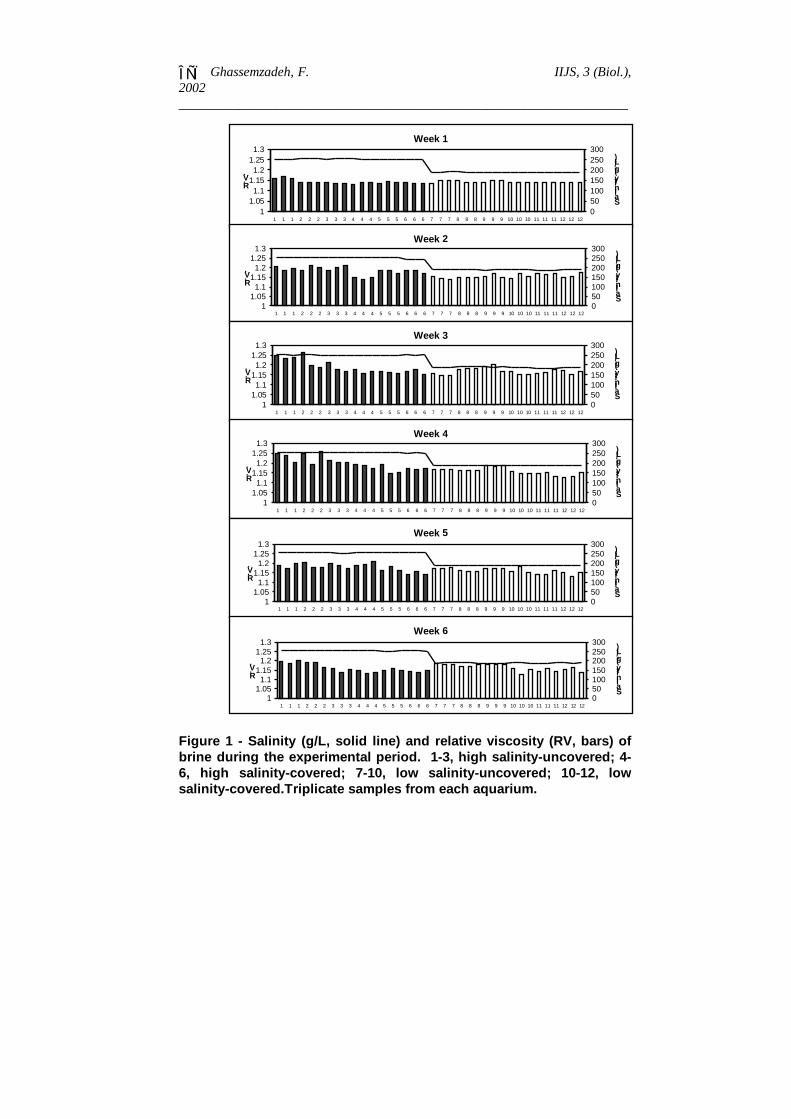
Values for salinity and relative viscosity in the experimental aquariaare presented in Figure 1. This figure shows that the salinity in eachaquarium was almost constant throughout the experimental period. Therelative viscosity was higher in HS samples in weeks 2, 3 and 4.Viscosity increased in HSU and HSC samples up to week 4, rangingfrom 1.79036 to 1.94342 and 1.78616 to 1.86914 centistokes,respectively. In LSU and LSC samples, viscosity ranged from 1.52368to 1.58153 and 1.51764 to 1.55263 centistokes, respectively. Thehighest viscosity occurred in HSU samples in week four. The lowestviscosity was recorded in week one in an LSC aquarium.
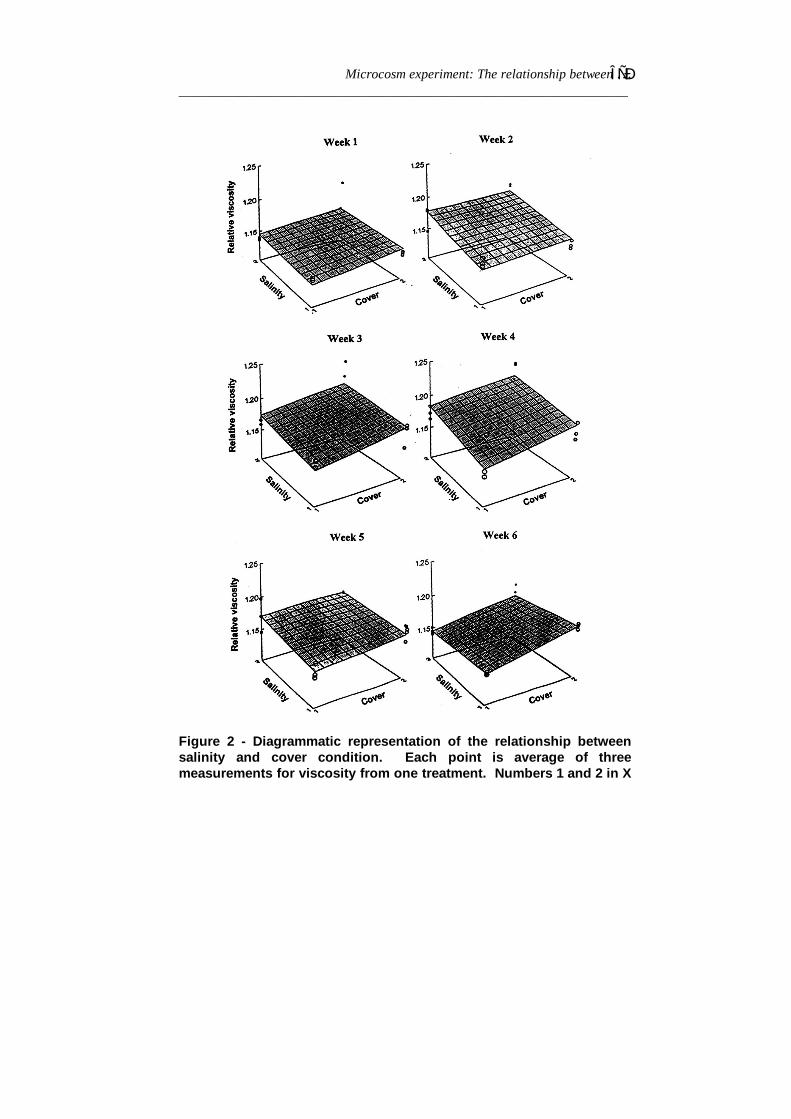
The effects of low-high salinity and cover-uncover status on therelative viscosity over a 6 weeks period was examined from the two-factor analyses of variance (Table 4). It shows the relative viscositydiffered between samples from high and low salinity treatments(p<0.01) through time (salt factor). There was also a significantdifference (P<0.01) between the relative viscosity in samples fromcovered and uncovered treatments. The interaction factor of theANOVA is also significant indicating interaction between salinity andcover on relative viscosity. In weeks 1, 2 and 3 the data indicate greatrelative viscosity for high-uncovered treatments than other treatments,but the differences are small shown by the flat nature of the plane(Figure 2). During and after week 4, the plane is more steeply tiltedand relative viscosity decreased in high salinity-uncovered treatments.
Microcosm experiment: The relationship between …___________________________________________________________________
ÎÑÎ
Table 2 - Physical and chemical parameters of water from 2 pondsused to fill aquarai.
Figure 1 - Salinity (g/L, solid line) and relative viscosity (RV, bars) ofbrine during the experimental period. 1-3, high salinity-uncovered; 4-6, high salinity-covered; 7-10, low salinity-uncovered; 10-12, lowsalinity-covered.Triplicate samples from each aquarium.
Microcosm experiment: The relationship between …___________________________________________________________________
ÎÑÐ
Figure 2 - Diagrammatic representation of the relationship betweensalinity and cover condition. Each point is average of threemeasurements for viscosity from one treatment. Numbers 1 and 2 in X
Ghassemzadeh, F. IIJS, 3 (Biol.),2002___________________________________________________________________
ÎÑÑ
and Z axes are low and high salinity and covered and uncoveredstatus respectively.Table 4 - ANOVA Multivariate Repeated Measures Analysis on relative
viscosity under salinity (high and low salinity) and cover anduncovered treatments over 6 weeks period.
Source SS DF MS F P
Salt 0.0056 1 0.0056 14.7853 0.0049
Cover 0.0085 1 0.0085 22.3396 0.0015
Salt*cover 0.0028 1 0.0028 7.4115 0.0262
Error 0.0030 8 0.0004
Microscopic observationsIn all samples, microscopic examination revealed the presence of aunicellular green-colored Cyanobacterium, 1-10 (length) and 1-2 µm(width) respectively. Microscopic observations indicatedmorphological differences between organisms in uncovered andcovered aquaria, but both were referable to the genus Synechococcus.
Microscopic observations provided estimates of the number of cellsper 1 ml of Synechococcus standing crop in the sample. The densitiesof Synechococcus in LSU and LSC samples from weeks 1, 2, 3, 4, 5,and 6 were approximately 1.2x10³, 1.5x10³, 1.8x10³, 1.4x10³, 2.1x10³,and 2.4x10³ individuals per ml, respectively. For HSC and HSUaquaria, estimation of densities was difficult due to the high amount ofECP present and the high viscosity of the medium.
Microscopic examination of the samples indicated the presence ofdiatoms and Dunaliella viridis and D. salina as well as Synechococcuscells. Microscopic observation showed the high density of cocci androds shaped bacteria in HSU aquaria after week 4. These cocci androds were probably colonies of Halobacteriaceae and imparted a redcolor to the water. This was accompanied by increased in the viscosityof the HSU treatment after week 4. Dunaliella salina andStephanoptera sp. were abundant in high salinity aquaria in week 4, 5and 6.
Microcosm experiment: The relationship between …___________________________________________________________________
ÎÑÒ
Microscopic observations also revealed that unicellularCyanobacteria were more abundant in high salinity than low salinityaquaria up to week 4. Filamentous and unicellular Cyanobacteria anddiatoms were present in low salinity aquaria, and that diatoms weremore abundant in those aquaria.
Synechococcus cells in LSC aquaria aggregated in short cylinders oflarge diameter (5-7 x 7-9 µm), while those dominant in HSU aquariawere narrow cylinders of varying length (2-4 x 3-8 µm).Approximately 10 or 25% (in high and low salinity, respectively) of theSynechococcus comprised paired cells, showing cell division. Inundisturbed samples collected from HSU, some cells were in the formof chains and embedded in the ECP produced by the cells.
Laboratory examinationsChlorophyll a mean ranged from 0.15mg/100g to 0.36mg/100g of wetsample in HSU aquaria and dry weight mean ranged from 24.06 % to36.13 % of wet sample in HSC (Table 5). Chlorophyll a mean rangedfrom 0.16 to 0.33 mg/100g of wet sample in LSU aquaria and dryweight mean ranged from 23.4 % to 29.86 % of wet sample in HSC.There was no significant difference between the percentages of waterin the samples; it ranged from only 70.13% to 76.11% in HSU andLSU Percentages of organic material were higher in samples from highsalinity than low salinity aquaria at the end of week one. Organicmatter was the lowest in samples from HSU in the last week of theexperiment
Table 5 - Means of chlorophyll a, percentages of dry weight, water andorganic material from standing crop of Synechococcus (AFDW) at
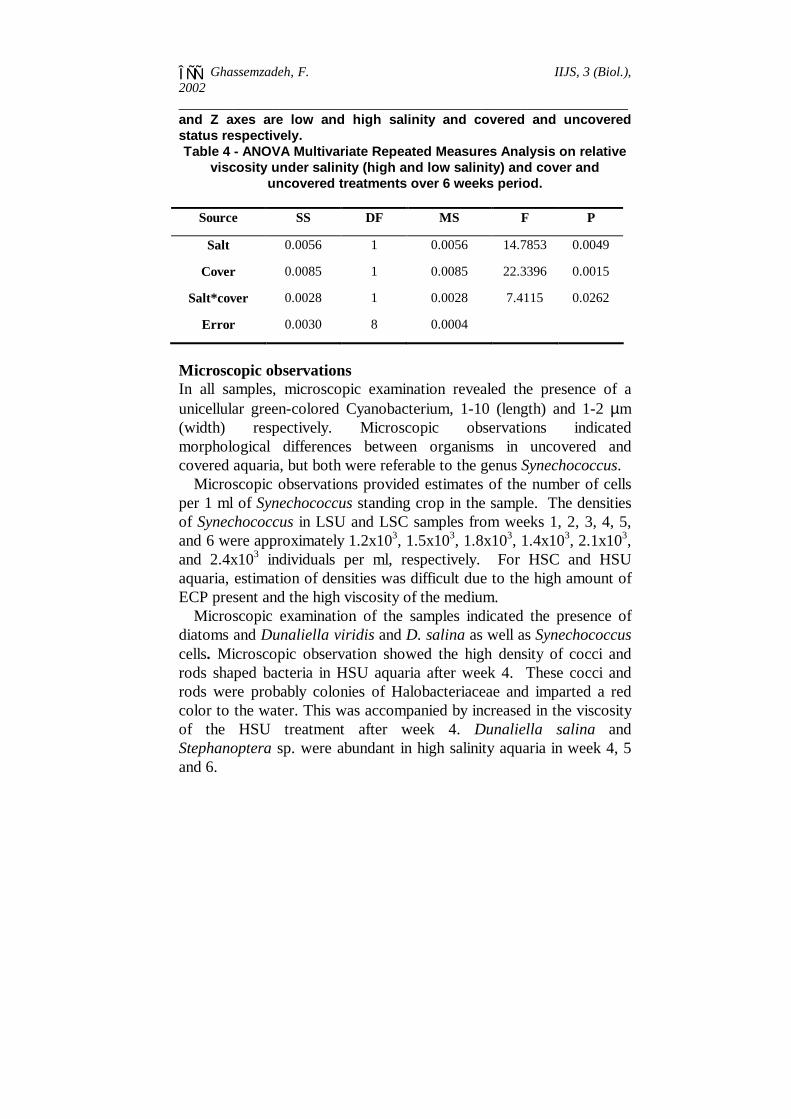
The comparison between chlorophyll a concentration and thepercentages of organic material from Synechococcus standing cropsamples collected directly from field, and in the samples from the firstand the last samplings are presented in Figures 3 and 4. Data for thefirst and the last samplings in these figures are the mean of triplicatetreatments and three readings for each sample. The amount ofchlorophyll a in samples at the end of the experiment was higher incovered than uncovered aquaria, especially in LSC. Water in aquariaunder low light intensity (HSC, LSC) developed a green color,whereas aquaria under high light intensity (HSU, LSU) becameyellowish or red.
0 0.05 0.1 0.15 0.2 0.25 0.3 0.35 0.4
HSU
HSC
LSU
LSC
mg/100g wet wt.
SL
SF
F
Figure 3 - Comparison between the amount of chlorophyll a fromSynechococcus standing crop: samples collected directly from field(F), the first (SF), and the last (SL) samplings from each aquaria.(Values are the mean of three replicates).
Microcosm experiment: The relationship between …___________________________________________________________________
ÎÑÔ
0 5 10 15 20 25 30
HSU
HSC
LSU
LSC
% dry weight
SL
SF
F
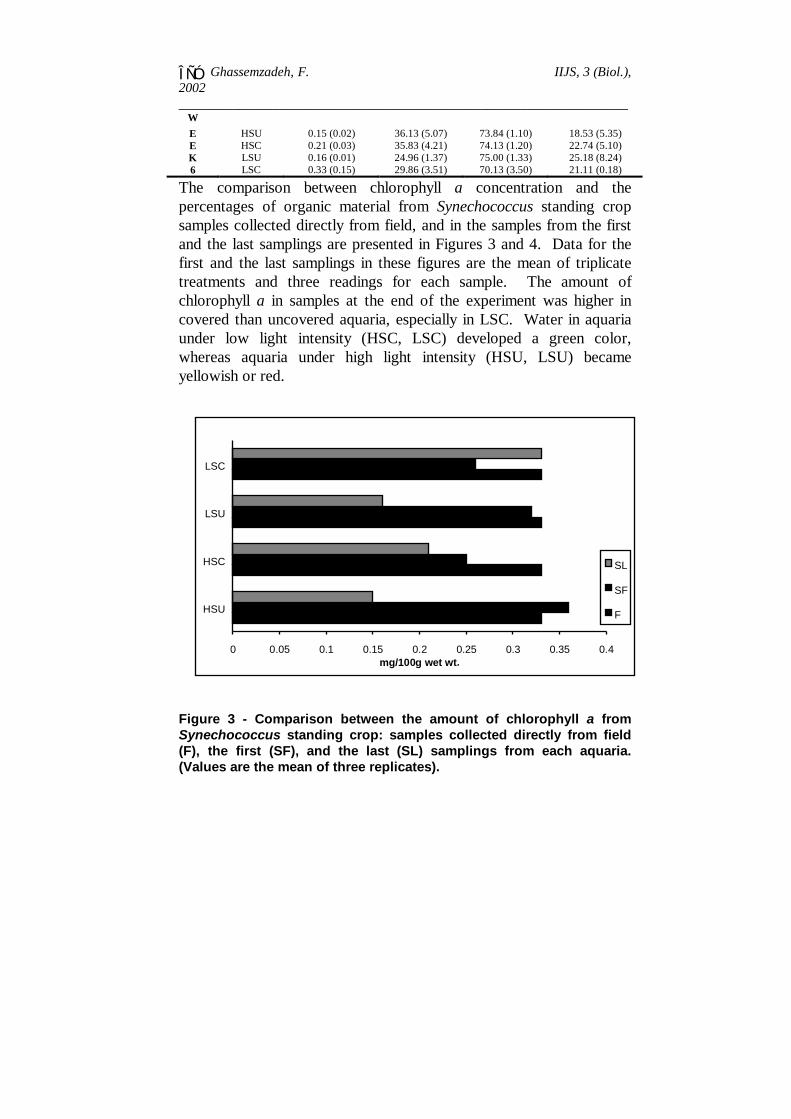
Figure 4 - Comparison between the percentages of organic materialfrom Synechococcus standing crop: samples collected directly fromfield (F), the first (SF), and the last (SL) samplings from each aquaria.(Values are the mean of three triplicates).
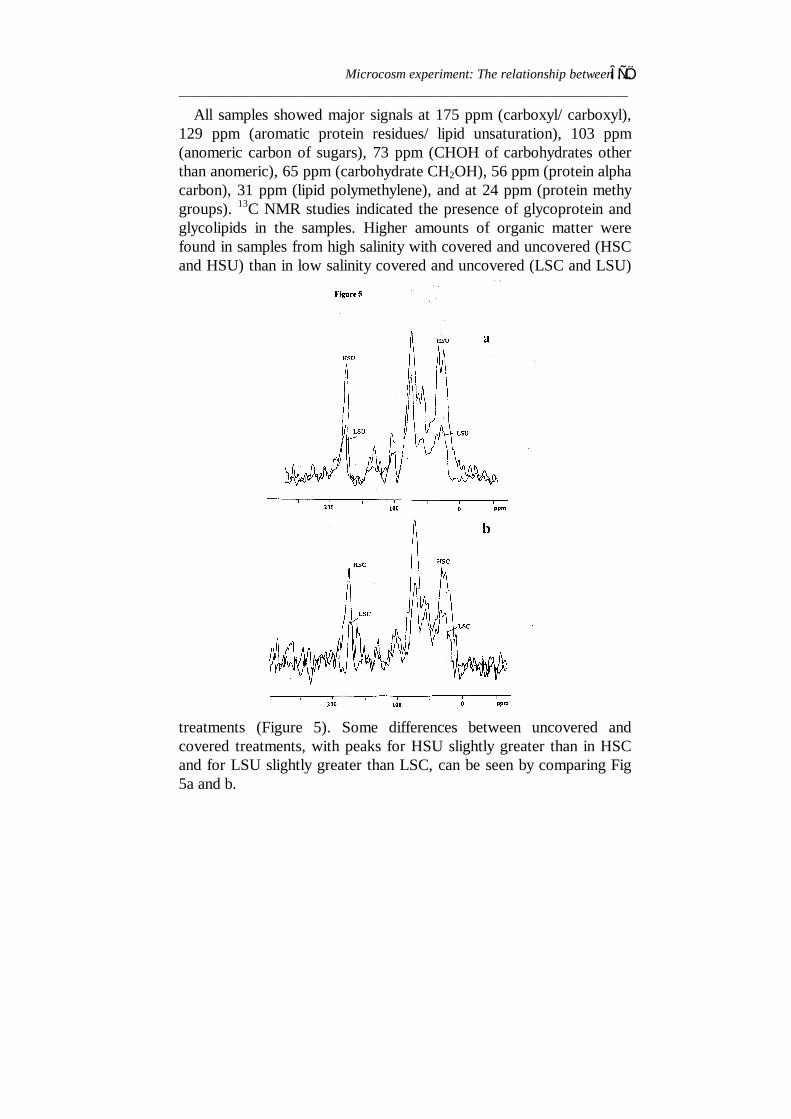
Identification of the chemical structure of ECP by 13C NMRspectroscopyFigure 5 shows natural-abundance 13C NMR spectra of ECP inSynechococcus from the four experimental treatments. The spectrawere run under conditions which ensured that the peak heightsaccurately reflected the concentrations of various solutes in theextracts and peaks in these spectra show higher concentrations in highsalinity than low salinity. The relative heights (or intensities) of theirresonance reflect their relative concentrations in the samples.Therefore each sample displayed two or more well-resolved 13Cresonances which provided a useful check on relative comparisonsbetween two samples and also provided a simple identification of themajor organic composition of ECP.
Ghassemzadeh, F. IIJS, 3 (Biol.),2002___________________________________________________________________
ÎÑÕ
Microcosm experiment: The relationship between …___________________________________________________________________
ÎÑÖ
All samples showed major signals at 175 ppm (carboxyl/ carboxyl),129 ppm (aromatic protein residues/ lipid unsaturation), 103 ppm(anomeric carbon of sugars), 73 ppm (CHOH of carbohydrates otherthan anomeric), 65 ppm (carbohydrate CH2OH), 56 ppm (protein alphacarbon), 31 ppm (lipid polymethylene), and at 24 ppm (protein methygroups). 13C NMR studies indicated the presence of glycoprotein andglycolipids in the samples. Higher amounts of organic matter werefound in samples from high salinity with covered and uncovered (HSCand HSU) than in low salinity covered and uncovered (LSC and LSU)
treatments (Figure 5). Some differences between uncovered andcovered treatments, with peaks for HSU slightly greater than in HSCand for LSU slightly greater than LSC, can be seen by comparing Fig5a and b.
Ghassemzadeh, F. IIJS, 3 (Biol.),2002___________________________________________________________________
ÎÒÍ
Figure 5 - 13C NMR spectra of relative amounts of ECP compositionproduced by Synechococcus standing crop. (a) samples from HSU(high salinity and uncovered) and LSU (low salinity and uncovered)aquaria; (b) samples from HSC (high salinity and covered) and LSC(low salinity and covered) aquaria.DiscussionMost studies on coccoid Cyanobacteria inhabiting hypersaline watersare based on the examination of field material (e.g. studies reviewed byBauld, 1981) or on laboratory studies of cultures in artificial media(e.g. Yopp et al., 1978a and b). The present study was an attempt tosimulate a natural field situation in easily controlled outdoormicrocosms. Brine from ponds 1 and 2 supplied the low and highsalinity water for experimental aquaria, respectively. The results forsalinity show that this was almost constant for aquaria filled with lowand those filled with high salinity waters. Thus, there were nophysiological shocks resulting from rapid salinity fluctuation in anyaquarium. Also, pH was always > 7, which is important in the survivalof Synechococcus (Madigan, 1988).
Synechococcus responded to the environmental stress of highsalinity, light and temperature by the production of ECP. Increasedproduction of ECP under stress is also reported by other studies on thistaxon and other Cyanobacteria under laboratories conditions not innatural environment as stated before (Painter, 1983; Panoff et al.,1988; Philips et al., 1989; Vincenzini et al., 1990a and b; De Philippiset al., 1991 and 1993, Witton et al. 2000). Synechococcus is anitrogen-fixing bacterium, with photosynthesis occurring in the daywhen sunlight is available, and nitrogen-fixation occurring at nightwhen oxygen levels within cells are lower (Stal, 1991). Thus,Synechococcus has advantages over other Cyanobacteria and algae inhighly saline water with low oxygen concentration and low nitrateconcentration (Mague et al., 1980; Mitsui et al., 1986; Grobbelaar etal., 1986; Arad, et. al., 1988; Schneegurt et al., 1994; Liu et al., 1996;Michard et al., 1996; Ghassemzadeh, 1997; Seckbach, 1999).
The production of ECP is an osmotic response of Synechococcus inhighly saline water; the ECP protect the cells from the stressfulenvironment (Painter, 1983; Philips et al., 1989; Vincenzini et al.,
Microcosm experiment: The relationship between …___________________________________________________________________
ÎÒÎ
1990a and b; De Philippis et al., 1993). These molecules would havemoderated the adjustment of the unicellular cyanobacterial cell to thehypersaline water: Synechococcus surrounds itself with this materialthat can act as a barrier and may be important in (1) limitingdesiccation of the cells under high salinity, (2) balancing ions, and (3)aiding the uptake of nutrients in highly saline water. The results from13C NMR spectroscopy indicate that the extracellular product wasorganic material, probably, glycoprotein and glycolipid. Some of theseECP were liberated to the medium. The results demonstrate increasingrelative viscosity due to the production of ECP by Synechococcus inhypersaline water as well as high light intensity. Economically,increasing brine viscosity is important in determining salt quality andquantity in solar saltfields (Ghassemzadeh et al., 1996a and b). Theyaccord with published results for Synechococcus that show ECPincreases at higher temperature, and in turn increases turbidity andviscosity (Yopp et al., 1978a and b; Dor and Hornoff, 1985).
ConclusionThe results from 13C NMR spectroscopy showed that the compositionof the ECP produced by Synechococcus under experimental conditionsprobably comprised glycolipid and glycoprotein. The amount of ECPproduced by Synechococcus affected brine viscosity which is importantin the quality and quantity of the salt in solar saltfields. Relativeviscosity and the amount of organic materials was higher in conditionsof high salinity and high light intensity, because under these conditionsSynechococcus produced more ECP.
AcknowledgmentI would like to thanks the Ministry of Culture and Higher Education ofthe Islamic Republic of Iran as well as Department of Zoology at theUniversity of Adelaide for funding and providing the facilities for thisresearch. I also thanks the Penrice Soda Company, South Australia forallowing access to the Solar SaltFields at Dry Creek.
References
Ghassemzadeh, F. IIJS, 3 (Biol.),2002___________________________________________________________________
ÎÒÏ
Aloi, J.E., (1990) A critical review of recent freshwater periphytonfield methods. Canadian Journal of Fisheries and Aquatic Science,47, 656-670.
American Public Health Association (1992) Standard Methods forthe Examination of Water and Wastewater. American WaterWorks Association and Water Pollution Control Federation,Washington, 18th edition, 1268p.
Arad, S., (Malis), Adda, M. and Cohen, E., (1985) The potential ofproduction of sulfated polysaccharides from Poriphoridium. Plantand Soil, 89,117-127.
Arad, S. (Malis), Friedman, O.D. and Rotem, A., (1988) Effect ofnitrogen on polysaccharide production in a Porphyridium sp.Applied Environmental Microbiology, 54(10), 2411-2414.
Bauld, J., (1981) Occurance of benthic microbial mats in salinelakes. Hydrobiologia, 81, 87-111.
Borowitzka, L.J., (1981) Adaptation to life in extremely salinelakes, the microflora. Hydrobiologia, 81, 33-46.
De Philippis, R., Sili C., Tassinato, G., Vincenzini, M. and MaterassiR., (1991) Effects of growth conditions on exopolysaccharideproduction by Cyanospira capsulata. Bioresearch andbiotechnology, 38, 101-104.
De Philippis, R., Margheri, M.C., Pelosi, E. and Ventura, S., (1993)Exopoly-saccharide production by a unicellular Cyanobacteriumisolated from a hypersaline habitat. Journal of AppliedPhycology, 5: 387-394.
Dor, I. and Hornoff, M., (1985) Studies on Aphanothecehalophytica Fremy from a Solar ponds: comparison of twoisolates on the basis of cell polymorphism and growth response tosalinity, temperature and light conditions. Botanica Marina, 28,389-398.
Fogg, G.E., (1962) Extracellular products. In: R.A. Lewin (ed.),Physiology and Biochemistry of Algae. Academic Press, NewYork, 475-489.
Fogg, G.E., (1966) The extracellular products of algae in brines.Oceanography and Marine Biology Annual Review, 4, 195-212.
Microcosm experiment: The relationship between …___________________________________________________________________
ÎÒÐ
Fogg, G.E., (1971), Extracellular products of algae in freshwater.Archiv fuer Hydrobiologie, 5, 1-25.
Ghassemzadeh, F., (1997) Biological and chemical featuresassociated with salt production in solar saltfields at Dry Creek,South Australia. Ph.D Thesis, Zoology Department, University ofAdelaide, Australia.
Ghassemzadeh, F., Williams, W.D., and Geddes, M.C., (1996a) Theeffects of Synechococcus on salt quality and quantity (abstract),INTECOL V Internationl Wetlands Conference 22-28 September1996, Perth, Western Australia, Programme and Abstracts, 72.
Ghassemzadeh, F., Williams, W.D., and Geddes, M.C., (1996b)Biology of solar saltfields in relation to salt quality and quantity(abstract), 35th Congress of the Australian Society for Limnology,Berri South Australia, Programme and Abstracts, 62.
Golubic, S., (1980) Halophily and halotolerance in Cyanophytes.Origins of life, 10, 169-183.
Grobbelaar, N., Haung, T.H., Lin, H.Y. and Chow, T.J., (1986)Dinitrogen-fixing endogenous rthythm in Synechococcus RF-1.FEMS Microbial Letter, 37, 173-177.
Guillard, R.R.L.and Hellebust, J.A., (1971) Growth and theproduction of extracellular substances by two strains ofPhaeocystis poucheti. Journal of Phycology, 7, 330-338.
Hellebust, J.A., (1974) Extracellular products. In: W.D.P. Stewart(ed.), Algal Physiology and Biochemistry. University of CaliforniaPress, Berkeley, 838-863.
Krishman, P.C.M., (1991) Factors affecting grow and mucilageproduction by laboratory cultures of Aphanothece halophyticaFremy. M.Sc. Thesis, Department of Botany, James CookUniversity of North Queensland,.
Liu, Y., Nicholas, F.T., Susan, S.G., Kondo, T. and Johson, C.H.,(1996) Circadian expression of genes involved in the purinebiosynthetic pathway of the cyanobacterium Synechococcus sp.strain PCC 7942. Molecular Microbiology, 20(5), 1071-1081.
Ghassemzadeh, F. IIJS, 3 (Biol.),2002___________________________________________________________________
ÎÒÑ
Madigan, M.T., (1988), Mcrobiology, physiology and ecology ofphototrophic bacteria. In: A.J.B. Zehnder (ed.), Biology ofAnaerobic Microorganisms. John Wiley and Sons, 39-111.
Mague, T.H., Friberg, E., Hughes, D.J. and Morris, I., (1980)Extracellular release of carbon by marine phytoplankton; aphysiological approach. Limnology and Oceanography, 25(2),262-279.
Michard, M., Aleya, L. and Verneaux, J., (1996) Mass occurrenceof the Cyanobacteria Microcystis aeruginosa in thehypereutrophic Villerest Reservoir (Roanne, France): usefulnessof the biyearly examination of N/P (nitrogen phosphorus) andP/C (protein/ carbohydrate) couplings. Archiv fuerHydrobiologie, 135, 337-359.
Mitsui, A., Kumazawa, S., Takahashi, A., Ikemoto, H., Cao, S. andArai, T., (1986) Strategy by which unicellular cyanobacteriagrow phototrophically. Nature, 323, 720-722.
O’Colla, P.S., (1962) Mucilages. In: R.A. Lewin (ed.), Physiologyand Biochemistry of Algae. Academic press, New York, 337-353.
Painter, T.J., (1983) Algal polysaccharides. In: G.O. Aspinall (ed.),The Polysaccharides, Volume 2. Academic Press, New York, 195-285.
Panoff, J.M., Priem B, Morvan, H. and Joset, F., (1988) Sulphatedexopolysaccharide produced by two unicellular strains ofCyanobacteria, Synechocystis PCC 6803 and 6714. Archives ofMicrobiology, 150, 558-563.
Phlips, W.J., Zemman, C. and Hansen, P., (1989) Growth,photosynthesis, nitrogen fixation and carbohydrate production ofa unicellular cyanobacterium, Synechococcus sp. (Cyanophyta).Journal of Applied Phycology, 1, 137-145.
Schneegurt, M.A., Sherman, D.M., Nayar, S. and Sherman, L.A.,(1994) Oscillating behaviour of carbohydrate granule formationand dinitrogen fixation in the cyanobacterium Cyanothece sp.strain ATCC 51142. Journal of Bacteriology, 176, 1586-1597.
Seckbach, J., (1999) Enigmatic Microorganisms and Life in extremeEnvironments. Kluwer Academic of Science Publishers. 687p.
Microcosm experiment: The relationship between …___________________________________________________________________
ÎÒÒ
Seshadri, K. and Buch, S.D., (1958) Estimation of algae inSambhar Lake brine by chlorination. Journal of Science IndustrialResearch, 17(11)A, 455-457.
Stal, L.J., (1991) The sulfur metabolism of mat-buildingcyanobacteria in anoxic marine sediments. KielerMeeresforschungen, 8, 152-157.
Talling, J.F. and Driver, D., (1963) Some problems in the estimationof chlorophyll a in phytoplankton. Proceedings, Conference ofPrimary Productivity Measurement. Marine and Freshwater,Hawaii, 1961, U.S. Atomic Energy Commission TID.7633, 142-146.
Tett, P., Kelly, M.G. and Hornberger, G.M., (1975) A method forthe spectrophotometric measurement of chlorophyll a andpheophytin in benthic microalgae. Limnology and Oceanography,20, 887-896.
Vincenzini, M., De Philippis R., Sili, C. and Materassi, R., (1990a)The novel expolysaccharide from a filamentous cyanobacterium:production, chemical characterization and rheologicalproperties. In: E.A. Dawes. (ed.), Novel Biodegradable MicrobialPolymers. Kluwer Academic Publishers, Dordrechi, 295-310.
Vincenzini, M., De Philippis R., Sili, C. and Materassi, R., (1990b)Studies on exopolysaccharide release by diazotrophic batchcultures of Cyanospira capsulata. Applied Microbiology andBiotechnology, 34, 392-396.
Williams, W.D., (1986) Conductivity and salinity of Australian saltlakes. Australian Journal of Marine and Freshwater Research, 37,177-182.
Witton, B.A., (2000) The Ecology of Cyanobacteria. Their diversityin time and space. Kluwer Academic Publishers. 668p.
Yopp, J.H., Miller, D.M. and Tindall, D.M., (1978a) Regulation ofintracellular water potential in the halophylic blu-green algaAphanothece halophytica (Chroococcales). In: S.R. Capland andM. Ginzburg (eds.), Energetics and Structure of HalophilicMicroorganisms. Elsevier, Amsterdam, 619-624.
Yopp, J.H., Tindall, D.M., Miller, D.M., and Schmid, W.E., (1978b)Isolation, purification and evidence for the halophylic nature of the
Ghassemzadeh, F. IIJS, 3 (Biol.),2002___________________________________________________________________