Chapter F - Human Resources 2007/08 Hospital Pharmacy in Canada Report www.lillyhospitalsurvey.ca Page 42 F - HUMAN RESOURCES MICHELE BABICH Human resource shortages are perhaps the most serious challenge facing Canada’s healthcare system. In fact, the Health Council of Canada has stated “…without an appropriate heal th human resources strategy, all other healthcare renewal efforts will fail.” 1 A shortage of pharmacists in Canada first began to manifest itself in the late 1990s and persists to the present time, to varying degrees, in all provinces. The pharmacist shortage led to a national study of pharmacists and technicians that was funded by the Government of Canada through Human Resources and Social Development Canada (HRSDC). The final report and recommendations of that study (“Moving Forward: Pharmacy Human Resources for the Future”), have recently been released and can be accessed at www.pharmacyhr.ca . 2 The recommendations are intended to insure that the profession of Pharmacy has the right individual, with the right training, in the right place, at the right time, to deliver the pharmacy services that are needed to meet the healthcare needs of Canadians. Achieving this goal will require changes in the roles and responsibilities of pharmacists and pharmacy technicians, with pharmacists focusing on their direct patient care role while appropriately trained pharmacy technicians assume greater responsibility for the technical aspects of the drug distribution system. This chapter reports data that can be very useful to pharmacy managers and hospital administrators who are interested in comparing their hospital’s pharmacy human resource indicators to those reported by other hospitals that participated in this survey. These indicators include staffing ratios (i.e. budgeted hours per patient day), pharmacist to technician ratios, vacancy rates and anticipated retirement rates. As noted in the introduction to the 2007/08 Report, the qualifying criteria for participation in the Hospital Pharmacy in Canada Survey were changed for the 2007/08 survey. For this year’s survey, hospitals were qualified to participate in the survey if they had at least 50 acute care beds. The requirement to have at least 100 beds in total was dropped, allowing a number of smaller hospitals to participate in the survey for the first time in 2007/08. Readers should be aware of this change as they review the results reported in this chapter. HUMAN RESOURCE SHORTAGES - PHARMACISTS The data from the 2007/08 survey indicate that many hospitals continue to have difficulty recruiting and retaining pharmacists. Human resource shortages have changed little from the last report. Vacancies for pharmacists still appear to be problematic, but have not worsened since the last report. Sixty percent (98/163) of respondents reported having pharmacist position vacancies on March 31, 2008. This was somewhat less than in 2005/06, when 73% (103/142) of respondents reported that they had pharmacist vacancies, but about the same as in 2003/04 (63%, 89/142). The average reported vacancy rate for pharmacists in 2007/08 (10.4%) (Table F-1) was lower than the vacancy rate reported in the 2005/06 report (13.3%). Quebec had the highest vacancy rate at 17.2% with NB/PE following at 14.3%. Overall, respondents reported a total of 292 pharmacist position vacancies across Canada (Table F-2), which is slightly higher than the reported total of 270 from the 2005/06 report. However, as noted above, the number of hospitals included in the 2007/08 survey is greater than in the 2005/06, due to changes in the qualifying criteria that allowed a number of smaller hospitals to participate for the first time. It should also be noted that this number understates the actual number of vacancies in Canada, as not all hospitals participated in the survey. It is of note that Quebec, with the highest vacancy rate (Table F-1), reported the lowest salaries for pharmacists (Table F-10). The lowest vacancy rates were reported in Manitoba (1.0%) and Saskatchewan (2.8%). Both provinces had the highest starting salaries for staff pharmacists. British Columbia, which had one of the highest vacancy rates in the 2005/06 report, negotiated a temporary salary market adjustment
Transcript
Chapter F - Human Resources
2007/08 Hospital Pharmacy in Canada Report www.lillyhospitalsurvey.ca Page 42
F - HUMAN RESOURCES
MICHELE BABICH
Human resource shortages are perhaps the most serious challenge facing Canada’s healthcare system. In fact, the Health Council of Canada has stated “…without an appropriate health human resources strategy, all other healthcare renewal efforts will fail.”
1 A shortage of pharmacists in Canada first began to manifest itself in
the late 1990s and persists to the present time, to varying degrees, in all provinces. The pharmacist shortage led to a national study of pharmacists and technicians that was funded by the Government of Canada through Human Resources and Social Development Canada (HRSDC). The final report and recommendations of that study (“Moving Forward: Pharmacy Human Resources for the Future”), have recently been released and can be accessed at www.pharmacyhr.ca.
2 The recommendations are intended to insure that the profession of Pharmacy has the
right individual, with the right training, in the right place, at the right time, to deliver the pharmacy services that are needed to meet the healthcare needs of Canadians. Achieving this goal will require changes in the roles and responsibilities of pharmacists and pharmacy technicians, with pharmacists focusing on their direct patient care role while appropriately trained pharmacy technicians assume greater responsibility for the technical aspects of the drug distribution system.
This chapter reports data that can be very useful to pharmacy managers and hospital administrators who are interested in comparing their hospital’s pharmacy human resource indicators to those reported by other hospitals that participated in this survey. These indicators include staffing ratios (i.e. budgeted hours per patient day), pharmacist to technician ratios, vacancy rates and anticipated retirement rates.
As noted in the introduction to the 2007/08 Report, the qualifying criteria for participation in the Hospital Pharmacy in Canada Survey were changed for the 2007/08 survey. For this year’s survey, hospitals were qualified to participate in the survey if they had at least 50 acute care beds. The requirement to have at least 100 beds in total was dropped, allowing a number of smaller hospitals to participate in the survey for the first time in 2007/08. Readers should be aware of this change as they review the results reported in this chapter.
HUMAN RESOURCE SHORTAGES - PHARMACISTS
The data from the 2007/08 survey indicate that many hospitals continue to have difficulty recruiting and retaining pharmacists. Human resource shortages have changed little from the last report. Vacancies for pharmacists still appear to be problematic, but have not worsened since the last report.
Sixty percent (98/163) of respondents reported having pharmacist position vacancies on March 31, 2008. This was somewhat less than in 2005/06, when 73% (103/142) of respondents reported that they had pharmacist vacancies, but about the same as in 2003/04 (63%, 89/142).
The average reported vacancy rate for pharmacists in 2007/08 (10.4%) (Table F-1) was lower than the vacancy rate reported in the 2005/06 report (13.3%). Quebec had the highest vacancy rate at 17.2% with NB/PE following at 14.3%.
Overall, respondents reported a total of 292 pharmacist position vacancies across Canada (Table F-2), which is slightly higher than the reported total of 270 from the 2005/06 report. However, as noted above, the number of hospitals included in the 2007/08 survey is greater than in the 2005/06, due to changes in the qualifying criteria that allowed a number of smaller hospitals to participate for the first time. It should also be noted that this number understates the actual number of vacancies in Canada, as not all hospitals participated in the survey.
It is of note that Quebec, with the highest vacancy rate (Table F-1), reported the lowest salaries for pharmacists (Table F-10). The lowest vacancy rates were reported in Manitoba (1.0%) and Saskatchewan (2.8%). Both provinces had the highest starting salaries for staff pharmacists. British Columbia, which had one of the highest vacancy rates in the 2005/06 report, negotiated a temporary salary market adjustment
2007/08 Hospital Pharmacy in Canada Report www.lillyhospitalsurvey.ca Page 43
in July 2006, which may have assisted in lowering the vacancy rate in that province from 21.7% in 2005/06 to 6.6% in 2007/08.
The overall average duration of pharmacist vacancies was very similar to that reported in the last report; 178 days in 2007/08 compared to 182 days in 2005/06. The reported duration of vacancies was lower in 2007/08, compared to 2005/06, in British Columbia (147 versus 179 days), Alberta (102 versus 197 days), New Brunswick/Prince Edward Island (313 versus 520 days) and Saskatchewan (65 versus 221 days). Meanwhile, an increased duration of pharmacist vacancies was reported by Manitoba (94 versus 82 days), Ontario (243 versus 200 days), Quebec (152 versus 123 days) and Nova Scotia/Newfoundland (190 versus 72 days).
HUMAN RESOURCE SHORTAGES - TECHNICIANS
The data from the 2007/08 survey indicate that pharmacy technician shortages were much less of an issue than pharmacist shortages were. However, there are a number of reasons why this is likely to change in the years ahead. There is a widespread move underway across Canada to have appropriately trained technicians assume greater responsibility for the drug distribution system. This change will almost certainly increase the demand for pharmacy technicians, and has also prompted a number of provincial governments and regulatory authorities to take steps towards the regulation of pharmacy technicians. This would require the establishment of accreditation processes for technician training programs and a certification system for individual technicians. An accreditation system for pharmacy technician training programs is already being implemented across the country and a national certification exam, similar to the Pharmacy Examining Board of Canada certification system for pharmacists, is also being introduced.
These initiatives may, at least temporarily, reduce the number of pharmacy technicians entering the workforce. It is expected that a number of the existing training programs will have difficulty meeting the new accreditation standards and may cease to operate or require time to upgrade their programs. In addition, it is unlikely that all pharmacy technician graduates will pass the new certification exam, which would further reduce the number of pharmacy technicians entering the workforce. These changes speak to the need for careful monitoring of pharmacy technician vacancy rates.
The reported vacancy rate for technicians was 1.4% in 2007/08 (Table F-1), compared to 2.1% in 2005/06. This vacancy rate is low compared to the pharmacist vacancy rate. There were only slight differences in vacancy rates across provinces. As noted above, the demand for technicians will likely increase and vacancy trends should be monitored over time.
The average duration of vacancies for technicians has increased from 31.7 days in 2005/06 to 52.9 days in 2007/08. Quebec experienced the highest duration of technician vacancies, increasing from 55 days in 2005/06 to 97 days in 2007/08.
HUMAN RESOURCE SHORTAGES - MANAGEMENT
The total number of vacant pharmacy management positions reported in 2007/08 was 20, (Table F-2), similar to the number reported in 2005/06 (19). The management vacancy rate was reported as 5.3% of total management positions (Table F-1), somewhat less than the 7.0% vacancy rate reported in 2005/06. The highest reported management vacancy rate was in British Columbia (12.8%) and the lowest was in Alberta (2.0%).
The average duration of management vacancies has risen from 37.3 days in 2005/06 to 46.8 days in 2007/08, with the highest average vacancy duration in British Columbia (181 days) and the lowest in Saskatchewan (0 days).
Chapter F - Human Resources
2007/08 Hospital Pharmacy in Canada Report www.lillyhospitalsurvey.ca Page 44
Table F-1. Percent of Positions Vacant as of March 31, 2008
Demographics of the workforce suggest that a significant percentage of pharmacists will reach retirement age in the next 10-15 years. Data for 2006, from the Canadian Institute for Health Information (CIHI), indicate that pharmacists who were 55 years of age or older represented between 11-19% of total pharmacists in Canada, depending on the province.
3 Those aged 45-54 ranged from 18-28% of total pharmacists and those aged 35-44
ranged from 28-37% of total pharmacists.
It may take three to four more survey cycles to see what trends emerge as pharmacists in the 45-54 year age group reach retirement age. Efforts are underway in many jurisdictions to retain older workers in the healthcare workforce and the state of the economy may also affect the age at which pharmacists and other healthcare providers decide to retire. On the supply side, the number of graduates from pharmacy schools has increased from 650 in 1997 to 1014 in 2006. Quebec leads with an increase of 168 graduates. The other provinces showed variable increases.
3
Projection of staff retirements was a new reporting parameter in the 2005/06 survey. In the 2007/08 survey, 160 respondents indicated that 257 pharmacists (9.1% of all pharmacists) are expected to retire in the next 5 years (Tables F-3 and F-4). These projected staff retirement results are very similar to the last report (11.8%, 252). The highest expected pharmacist retirement rate was reported by the Saskatchewan respondents (18.5%), with the lowest expected retirement rate reported by respondents in Manitoba (5.4%).
A total of 60 pharmacy managers (15.8%) are expected to retire in the next 5 years, which is comparable to the 16.2 % who were expected to retire within 5 years in the 2005/06 report. The higher rate of expected pharmacy manager retirements, compared to expected staff pharmacist retirements, is not surprising, given that more senior individuals usually occupy management positions.
Chapter F - Human Resources
2007/08 Hospital Pharmacy in Canada Report www.lillyhospitalsurvey.ca Page 45
A particularly high percentage of expected pharmacy manager retirements, over the next 5 years, was reported by respondents in Saskatchewan (43.8% of pharmacy managers) and Manitoba (50.0% of pharmacy managers).
The group of pharmacy managers who are expected to retire across Canada in the next 5 years may be challenging to replace, as it is becoming more difficult to attract pharmacists into leadership positions. More attention needs to be focused on mentoring, coaching and encouraging pharmacists to take on these roles. This particular trend needs to be carefully monitored and acted upon to insure that there are adequate numbers of future pharmacy managers.
The pharmacy technician workforce is considerably younger than the pharmacist workforce. The total number of pharmacy technicians expected to retire in the next five years was reported to be 265 (7.6%), which is similar to the 8.4% reported in 2005/06. Saskatchewan reported the highest percentage of expected technician retirements (11.4%) and Alberta reported the lowest percentage (2.8%).
Table F-3. Expected Retirement Rates in the Next 5 Years (Weighted), as of March 31, 2008
Readers are asked to note that prior to the 2005/06 Report, the Hospital Pharmacy in Canada Reports used the term “paid hours per acute patient day” for the ratio used to compare staffing levels. The ratio “paid hours per acute patient day” would be calculated using total paid (worked) hours as the numerator, and using annual acute patient days as the denominator. The ratio that was reported in our reports was actually “budgeted hours per acute patient day”, which is calculated using total BUDGETED annual pharmacy staffing hours as the numerator and annual acute patient days as the denominator. Although “paid hours per acute patient day” and “budgeted hours per acute patient day” are virtually identical when a hospital pharmacy is fully staffed, that would not be true if a pharmacy department had a significant number of unfilled positions, in which case the number of paid hours would be less than the number of budgeted hours. For clarity, in the Human Resources chapter, the term “budgeted hours per patient day” was adopted for the 2005/06 and subsequent reports, in order to accurately describe the ratio that we calculate.
Chapter F - Human Resources
2007/08 Hospital Pharmacy in Canada Report www.lillyhospitalsurvey.ca Page 46
As noted above, the Hospital Pharmacy in Canada Report has traditionally reported a budgeted hours per ACUTE patient day ratio, which hospitals could use to compare their own pharmacy staffing to the staffing reported by other hospitals of a similar size and teaching status. Non-acute patient days were not included in the denominator and were essentially ignored in the calculation of the staffing ratio that appeared in all of the previous reports.
The original editorial decision to calculate the ratio in this way, made many years ago, was apparently based on a number of considerations. To begin with, most hospitals operate a single central pharmacy, serving both acute and non-acute patients. Few respondents are able to provide a breakdown of their acute versus non-acute staffing, as evidenced by the relatively small number of hospitals that were able to provide data for the benchmarking section of this survey. (See Benchmarking chapters in this report). The survey’s editorial board members also believed that the resources used to service acute care beds were generally much higher than the resources used for non-acute beds, and the number of acute care beds in most hospitals was a much larger proportion of total beds than were the non-acute beds. As a result, it was concluded that a ratio that used only the acute patient days in the denominator would provide the most reliable staffing indicator. These assumptions may remain valid for many of the hospitals that participate in our survey. However, during the planning for the 2007/08 survey, the editors were informed that during the 2005/06 data analysis there were a number of hospitals that had an unexpectedly high “budgeted hours per acute patient day” ratio. As the data for these hospitals was analyzed in more detail, it became clear that ignoring the non-acute patient days was problematic if a large proportion of a hospital’s patient days were non-acute patient days. In extreme cases the calculated budgeted hours per acute patient day ratio is artificially elevated to a substantial degree, because of the exclusion of the non-acute patient days. For example in one large hospital with about 10% acute beds and 90% non-acute beds, the staffing ratio was 3.29 budgeted hours per acute patient day, which decreased dramatically to 0.25 budgeted hours per total patient day, when both acute and non-acute days were included in the denominator. Overall, for the 166 hospitals that participated in this year’s survey, 74% of the reported patient days were acute patient days and 26% were non-acute patient days. For the 2007/08 report, in order to better understand the impact of non-acute beds, a decision was made to conduct additional staffing analyses that would take the non-acute patient days into consideration.
In the first staffing analysis, the calculation of staffing ratios was carried out in the same way as had been done in previous years, using only the acute patient days in denominator. These results are therefore comparable to the results from previous surveys.
Overall, the average of reported budgeted hours per acute care patient day (excluding residents) has changed only slightly, from 0.81 in 2005/06 to 0.85 in 2007/08 (Table F-5).
At the provincial level, the highest reported level of staffing was in Ontario at 0.99 budgeted hours per acute patient day and the lowest was in BC at 0.71 budgeted hours per acute patient day. (Table F-5).
Teaching hospitals continue to report higher budgeted hours per acute patient day (average of 1.12) than non-teaching hospitals (average of 0.75), as shown in Table F-5. Hospitals with more than 500 beds also reported higher budgeted hours per acute patient day (average of 0.91) than hospitals with 50 to 200 beds (average of 0.83) and hospitals with 201 to 500 beds (average of 0.82).
In a new, second analysis, a new ratio was calculated using total patient days (acute plus non-acute patient days) in the denominator. As would be expected, for hospitals with non-acute patient days, adding those days to the denominator resulted in a staffing ratio that is lower than when the non-acute patient days were excluded from the denominator. In addition, the analysis looked at five hospital subgroups, to determine if the ratio of acute to non-acute beds was related to hospital staffing patterns. The five subgroups were hospitals with 10 -39% acute beds, 40-59% acute beds, 60-79% acute beds, 80-99% acute beds, and 100% acute beds.
When total patient days (acute and non-acute) were used in the denominator, the average budgeted hours per total patient day for all hospitals was 0.63, compared to 0.85 when only acute patient days were used in the denominator (Table F-5)
Chapter F - Human Resources
2007/08 Hospital Pharmacy in Canada Report www.lillyhospitalsurvey.ca Page 47
Table F-5. Staffing Ratios – budgeted hours /patient day 2007/08 (By hospital size, teaching status, and percentage of acute beds)
___ Bed Size Teaching Status Percent of acute beds
Budgeted hours / total patient day (acute and non-acute) * (n=103)
.52 .41 .52 .61 .51 .66 .40 .72 .67
* Note that budgeted hours exclude pharmacy residents
For the 5 subgroups of hospitals, based on the percentage of acute beds vs. non-acute beds, the staffing ratios, using total patient days as the denominator, increase in each subgroup as the percentage of acute beds increases. For hospitals with 10-39% acute beds the staffing ratio was 0.3 budgeted hours per total patient day, which rose to 0.36 for hospitals with 40-59% acute beds, 0.58 for hospitals with 60-79% acute beds, 0.8 for hospitals with 80-99% acute beds, and 0.81 for hospitals with 100% acute beds. (Table F-5). This analysis, based on the percentage of acute beds vs. non-acute beds, was also performed for the ratio that used only acute beds in the denominator. As can be seen, the highest staffing ratio in this analysis occurs in the hospitals with the lowest percentage of acute beds; 0.94 budgeted hours per acute patient day for the hospitals with 10-39% acute beds vs. 0.81 budgeted hours per acute patient day for hospitals with 100% acute beds. This counter-intuitive result probably arises from the exclusion of non-acute beds from the denominator, while total staffing for both acute and non-acute beds is included in the
Chapter F - Human Resources
2007/08 Hospital Pharmacy in Canada Report www.lillyhospitalsurvey.ca Page 48
numerator. This highlights the problem with the way the staffing ratios have been calculated in previous reports; a problem that the board identified prior to this year’s survey.
There were 38 hospitals in this year’s survey that reported having 100% acute beds. Of these 16 were teaching hospitals and 22 were non-teaching hospitals. These 38 hospitals reported a 0.81 budgeted hour per acute patient day ratio; 1.04 budgeted hours per acute patient day for teaching hospitals and 0.65 budgeted hours per patient day for non-teaching hospitals. These ratios are true “budgeted hours per acute patient day”, since the staffing in the numerator is only for acute patient days and the patient days in the denominator are all acute patient days.
When the hospitals were further broken down into teaching and non-teaching hospitals, the staffing ratios were, on average, about 50% higher for teaching hospitals than non-teaching hospitals in each grouping based on their percentage of acute beds. For example teaching hospitals with 40-59% acute beds reported a staffing ratio of 0.50 budgeted hours per total patient day, compared to 0.35 for non-teaching hospitals with 40-59% acute beds. (Table F-5) Although the number of respondents in several of the groupings is quite small, the differences between teaching and non-teaching hospitals were quite consistent.
This analysis indicates, not surprisingly, that the mix of acute to non-acute beds has a significant impact on the staffing ratios, as measured by the ratio of budgeted hours per total patient day. When carrying out a comparison of staffing ratios between your hospital and the Canadian averages contained in the 2007/08 report, it is recommended that readers use not only the data that was calculated using the same methodology used in past surveys (using only acute patient days in the denominator), but also calculate their budgeted hours per total patient day and benchmark themselves against the group in Table F-5 that has the same percentage of acute beds and the same teaching status.
The above staffing data, presented as “budgeted hour per patient day”, allows for a department’s overall human resource allocation to be compared to other organizations, using a proxy workload denominator (patient days). However, it does not provide information that allows the staff composition of a pharmacy department to be compared to other departments. In order to provide data for this purpose, the Hospital Pharmacy in Canada report has also collected and reported data on the number of different types of staff that each respondent employs (i.e. managers, staff pharmacists, pharmacy technicians, support staff and pharmacy residents). This information is useful for examining issues like pharmacist to technician ratios, and differences in staff composition between different provinces, teaching versus non-teaching respondents, and hospitals of different sizes. This year the numbers have remained very similar to the 2005/06 report.
The average number of pharmacist positions reported represent 40% of total pharmacy staffing (Table F-7). Pharmacists represent the largest proportion of staff in Manitoba (51%) and the lowest in Alberta (37%).
Management positions have not changed from the previous report, representing 5.3% of total pharmacy staffing. BC is highest at 7.6% with Quebec and Manitoba lowest at 3.6% and 4.5% respectively.
Technician/Assistant positions represent 49% of total pharmacy staffing with Alberta highest at 52.0%.
Support personnel represented 3.8% of total pharmacy staffing in 2007/08, compared to 6% in 2005/06. This change is most likely due to the fact that pharmacy assistants have now been clearly defined in the survey and would in most cases be included in the pharmacy technician category, whereas they were sometimes included as support personnel in past surveys.
Overall staff composition of pharmacy departments has changed very little from the previous three surveys. The proportions of technicians, pharmacists, management staff, support staff and residents were almost identical to 2005/06 (Figure F-1). There is a slight upward trend in the percentage of technicians, which could possibly be attributed to expansion of the role of technicians in supporting pharmacy operations and the clarification of the definition of “technicians” and “support personnel”. With the regulation of technicians expected to occur in the near future, it will be interesting to see if the ratio of technicians to pharmacists changes in any significant way.
Chapter F - Human Resources
2007/08 Hospital Pharmacy in Canada Report www.lillyhospitalsurvey.ca Page 49
Table F-7. Average Budgeted Pharmacy Staffing (FTEs) and Average Beds 2007/08
Figure F-1. Staff Composition of Average Hospital Pharmacy Department 2007/08 Pharmacists
40%
Management
5%
TechniciansAssistants
49%
Support Staff
4%
Residents2%
Base: All respondents providing relevant data (163)
Overall, the proportion of time that pharmacists spend performing different functions has remained fairly consistent.
Respondents reported that pharmacists spent approximately 45% of their time performing clinical activities in 2007/08 (Figure F-2, Table F-9), compared to 41% in 2005/06. This was offset by less time spent in drug distribution, 42% in 2007/08 compared to 43% in 2005/06. There has been a slow but steady increase in time spent on clinical activities, which was only 33% in 1997/98.
The highest proportion of pharmacist time spent performing drug distribution activities was reported by respondents from New Brunswick/Prince Edward Island (51%) and British Columbia (48%), with the lowest proportion reported by respondents from Alberta (38%) and Ontario (36%). Conversely, the time spent
Chapter F - Human Resources
2007/08 Hospital Pharmacy in Canada Report www.lillyhospitalsurvey.ca Page 50
performing clinical activities was lowest in British Columbia (40%), NS/NL (38%) and New Brunswick/Prince Edward Island (37%). With the increasing scope of practice for pharmacists that is being embedded in the pharmacy legislation in many provinces, it will be interesting to see if the trend toward increased clinical activities continues.
Table F-9. Proportion of Pharmacist Time Spent Performing Different Activities 2007/08
Figure F-2. Proportion of Pharmacist Time Spent Performing Different Activities 2007/08
Drug Distribution
42%
Clinical Activ ities
45%
Teaching
6%
Other Non-Patient Care
6%
Pharmacy Research
1%
Base: All respondents providing relevant data (165)
SALARIES:
In the 2007/08 survey questionnaire dealing with pharmacy salaries, two new staff classifications were added – Pharmacy Manager (non-pharmacist) and Pharmacy Assistant. Previous comparisons for these two categories are not available. In addition, more precise definitions of each category of staff were provided to assist respondents in appropriately categorizing their staff. Salaries for technicians are reported separately for those respondents who reported having Level 1 and Level 2 technicians vs. those respondents who reported having only one level of technician salaries. Throughout this section, the salary increases that occurred over the two year period between the 2005/06 and 2007/08 have been annualized. When a percentage increase is referred to in the points below, and is marked with an asterisk (*), the percentage reported applies to each of the years between the 2005/06 and the 2007/08 survey.
The salaries reported in the 2007/08 report (Table F-10) reflect those that were paid as of March 31, 2008. The average salary per FTE was reported as $62,852 compared to $57,315 in 2005/06, representing a 4.1% * increase since the last report. This is substantially more than the 2.1%* increase reported in the 2005/06 report.
Average salary increases at the top level for all staff ranged from 4.3% * for Advanced Practice Pharmacists to 7.8%* for Practice Leaders/Coordinators and Pharmacy Supervisors/Coordinators.
* annualized increase
Chapter F - Human Resources
2007/08 Hospital Pharmacy in Canada Report www.lillyhospitalsurvey.ca Page 51
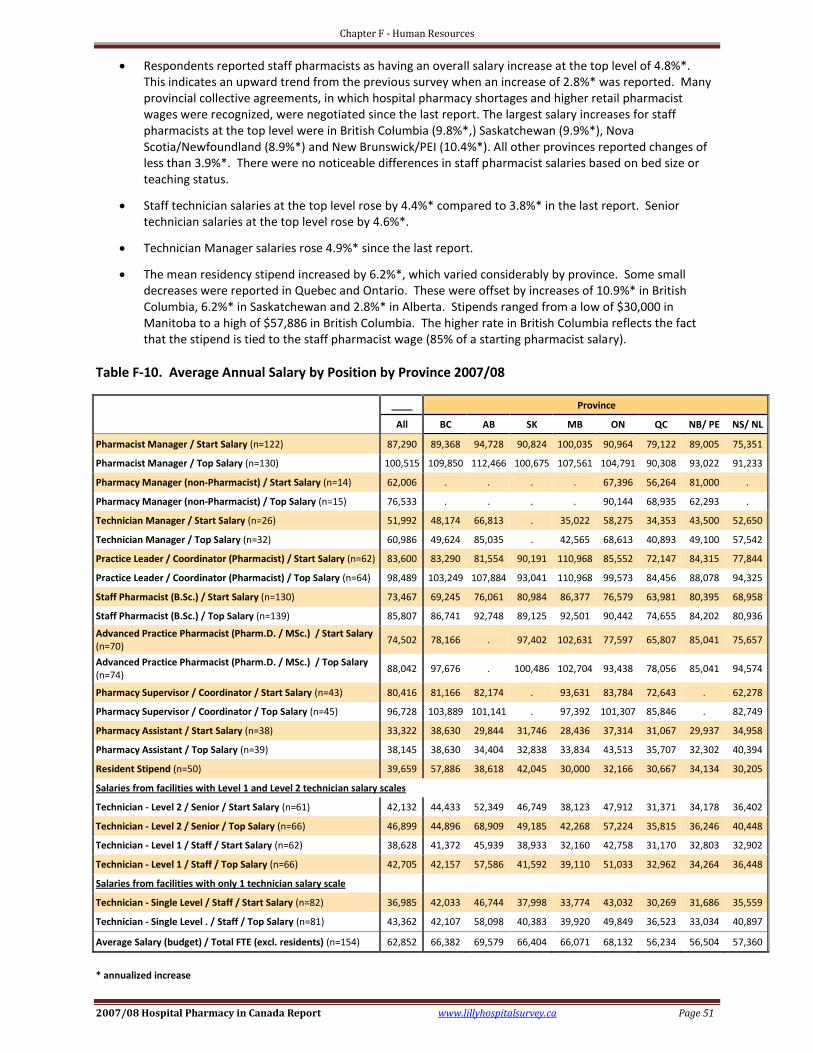
Respondents reported staff pharmacists as having an overall salary increase at the top level of 4.8%*. This indicates an upward trend from the previous survey when an increase of 2.8%* was reported. Many provincial collective agreements, in which hospital pharmacy shortages and higher retail pharmacist wages were recognized, were negotiated since the last report. The largest salary increases for staff pharmacists at the top level were in British Columbia (9.8%*,) Saskatchewan (9.9%*), Nova Scotia/Newfoundland (8.9%*) and New Brunswick/PEI (10.4%*). All other provinces reported changes of less than 3.9%*. There were no noticeable differences in staff pharmacist salaries based on bed size or teaching status.
Staff technician salaries at the top level rose by 4.4%* compared to 3.8%* in the last report. Senior technician salaries at the top level rose by 4.6%*.
Technician Manager salaries rose 4.9%* since the last report.
The mean residency stipend increased by 6.2%*, which varied considerably by province. Some small decreases were reported in Quebec and Ontario. These were offset by increases of 10.9%* in British Columbia, 6.2%* in Saskatchewan and 2.8%* in Alberta. Stipends ranged from a low of $30,000 in Manitoba to a high of $57,886 in British Columbia. The higher rate in British Columbia reflects the fact that the stipend is tied to the staff pharmacist wage (85% of a starting pharmacist salary).
Table F-10. Average Annual Salary by Position by Province 2007/08
Technician - Single Level . / Staff / Top Salary (n=81) 43,362 42,107 58,098 40,383 39,920 49,849 36,523 33,034 40,897
Average Salary (budget) / Total FTE (excl. residents) (n=154) 62,852 66,382 69,579 66,404 66,071 68,132 56,234 56,504 57,360
* annualized increase
Chapter F - Human Resources
2007/08 Hospital Pharmacy in Canada Report www.lillyhospitalsurvey.ca Page 52
Respondents indicated that 97% of pharmacy directors earned over $80,000 in 2007/08 compared to 89% who earned over that amount in 2005/06 (Table F-11). Sixty-five percent of Directors reported earning over $100,000 in 2007/08, compared to 42% in the previous report. The trend of increasing salaries for Directors of Pharmacy in teaching hospitals and larger facilities continues with this report. Overall, as with the last report, Alberta and Ontario provided the highest directors’ salaries.
Table F-11. Distribution of Director Salary Ranges 2007/08
____ Bed Size Province
All 50-200 201-500 >500 BC AB SK MB ON QC NB/ PE NS/ NL
This year’s report illustrates that human resource shortages still exist in pharmacy. The pharmacist shortage has remained very similar to the last report. With the increasing role of technicians and their pending regulation we may see an increase in the ratio of technicians to pharmacists, helping to alleviate the pharmacist shortage. Expected retirements appear to be similar for pharmacists, and slightly higher for management staff, as compared to the 2005/06 report. Hospital pharmacy continues to struggle to provide appropriate, patient oriented professional practice with limited resources. With anticipated retirements, especially in pharmacy leadership positions, the profession could be faced with a different but equally difficult human resource problem. It will be important to continue to monitor these trends over the next few reports and prepare pharmacists to assume future leadership roles.
* annualized increase
References:
1 “Health Care Renewal in Canada: Clearing the Road to Quality”, Health Council of Canada 2006 Annual Report to Canadians. p.
25, Accessed on Jan 9, 2009 at http://www.healthcouncilcanada.ca/en/index.php?option=com_content&task=view&id=70&Itemid=72 2 Moving Forward:Pharmacy Human Resources for the Future, Final Report and Recommendations. Accessed Jan9, 2009 at
http://www.pharmacyhr.ca 3 CIHI Data – Canada’s Health Care Providers, 1997 to 2006, A Reference Guide. Accessed on January 9, 2009 at