I I' I 1 I 1 • 1 J I I I 1 I , J I .I I I I - , .) FAMILIES IN THE 19905 a challenge for future policy approaches , Background paper prepared by Or Don Edgar (Director) and staff of the Australian Institute of Family Studies, for . The Social Policy Directorate \ AIFS 306.85' 0994 EDG February 1993 (f'..} . ,\rJ. G:\o"en",\ E::/\+..J
Transcript
I I' I 1 I 1 • 1
J I I I 1 I , J I .I I I I
-
,~ ~', ,
.)
FAMILIES IN THE 19905
a challenge for future policy approaches ,
Background paper prepared by Or Don Edgar (Director) and staff of the Australian Institute of Family Studies, for
. The Social Policy Directorate \
AIFS 306.85' 0994 EDG
February 1993
(f'..} . ~ ,\rJ. G:\o"en",\ E::/\+..J
I I I I 1 I • I J I I I I I , I • I I I I I
CONTENTS
Page
Introduction
1. The 'Traditional' Image - Reality to Myth ...................... 6
2 .
3.
4.
5.
Concerns About Family Life ................................. 9
The Seeds of Change .................................... 10
Main family system tasks Marriage Australia, 1971 and 1986 Items rated as 'very important' Divorces per 1000 population, 1950-1990 Age dependency ratios in OEeD countries Advice on Living Arrangements Ideal Family Size Marriage and fertility trends Ethnic composition of Australian people Ethnicity and family values Languages other than English, 1986 Year 12 Retention Rates, 1971-2001 School retention rates, 1982-89 Employment status of parents Preferred employment status, mothers Should women be employed? Social correlates of religious commitment Sex role attitudes 1971-1991 Structural changes influencing families, 1960-1990s The meaning of marriage Rrst marriage rates, 1981-1989 Number ever Married Divorce and Remarriage, 1971-1986 0/0 Change in Family Type, 1982-6 Perceived Effect of Divorce on Children Types of Families: Australia, 1986 Kin phone contact Proximity of kin Frequency and type of contact with kin Age and sex trends in Australia's population Parent and teenage life satisfaction ratings Real disposable income of DSS recipients Unemployment and families, 1993 Effects of women's employment on the family Work and family stress The New Links Workplace Young adults living with parents % Children reporting parental punishment Safety going to primary schools Percentages identifying safety problems for teenagers
N.B. The source of many of these graphs and tables is the AIFS magazine Family Matters, available on subscription from AIFS, 300 Queen Street, Melbourne 3000.
Another major source is the book, Edgar, 0, L. Earle and R. Fopp (1993), Introduction to AustralianSociety, Second Edition, Prentice Hall.
I I I I I I • I J I I I I I , I • I I I I I
" I·
'Family' is something we all think we know about.
'Family' means to each of us different things, so to try to generalise and say what is 'normal', 'typical', 'traditional' can mislead our thinking and ignore the diversity of realities facing families in the 1990s.
'Family' is not so much a matter of form, or type, or who is in it, as it is a matter of sharing, caring, emotional closeness, mutual support, creating and passing on values and traditions to the next generations.
'Family' involves individuals who share common resources but who also have individual needs and rights.
'Family' means both cooperation and conflict, both rights and responsibilities, both privacy and public obligations.
• self-sufficiency & self-respect • spouse/partner • dependents - children
- disabled - aged
(both market and domestic labour are involved)
• distributed benefits/rewards
(may be inequity ~md competition
and conflict) but joint action for
economies of scale
Living Standards
(Edgar. AIFS, 1991)
This diagram summarises a view of the family that forms the basis of a conceptual paper prepared for the United Nations Secretariat for International Year of the Family, 1994. It argues that, despite conflicts and inequalities, families are based on cooperation and sharing of the two central life tasks -earning a living, and caring for oneself and others. Quality of life depends upon the way both are handled and on the way societies structure public and private life.
I'
11
5
!
I
!
I I I
,I
I I I
I I I I 1 I • I J I I I t I , I • I J I t I
1. THE 'TRADITIONAL' IMAGE - REALITY TO MYTH
It is easy to forget history and the variety and change that have always typified 'family life'.
• The word 'family' itself derives from a large 'household' of kin, servants, unrelated people who shared work, housing and leisure time.
• The 'nuclear' family of two parents plus dependent children is not, however, a new creation of modern times - it has always been the basic group unit of most Western societies.
• During the 1950s and 1960s, post-War reconstruction and prosperity meant that most people did marry and have children, but this had never been true before (because not all could afford marriage, or because the male/female ratio was out of kilter in Australia) and is no longer true now.
• The 1950s and 1960s saw first a 'marriage madness', then the 'Baby Boom'. Women who had worked in wartime industries left paid jobs to become full-time housewives and mothers. One wage was sufficient for most families to survive, be housed, clothed and fed reasonably well, though expectations were lower and neither the 'en-suite' nor 'two cars' were then the norm ..
• Thus it was true to say that the 'typical' family comprised 'Mum, Dad and the kids - the 'breadwinner-housewife' model. It was less true, however, to say such a family was 'traditional' because many did not marry (the 'spinster' aunts and 'bachelor' uncles), many families had only one parent, others had' extended' kinfolk living with them, and Australia's Aboriginal population and rising migrant population had very different traditions.
• Because most of today's decision-makers were either the creators of the Baby Boom or grew up in those 'typical nuclear families', they tend to assume that is what everyone understands by 'family'.
The reality Is that family life across Australia (and New South Wales is closer to the national averages than any other State) has changed, Is changing, and will continue to change In the 1990s.
• The 'reality' of the post-War years has become a 'myth', sustained by nostalgia, rosy eyeglasses, forgetfulness, a yearning for 'the good old days', an assump'tion (not backed by good evidence) that the 'breadwinnerhousewife' family model was better than the 'mess' we seem.to have today.
• It is wise to remember that a family with children was as likely to be a one-parent family in 1891 as it is now (though the reasons were different).
6
I I I I 1 I • I J I I I I I , I • I .I I t I I
• Many post-War marriages broke down, couples separated, though often without getting divorced.
• In 1963, some 26% of new brides were pregnant - well before the rise of 'liberated', 'permissive' social values.
Family violence, wife-battering, child abuse were high, though less well recorded.
These were the years of the 'bored housewife syndrome', suburban isolation for many women because of poor transport, relatively poor community services to support family life, a divorce system based on 'fault' that led to phoney ways of 'getting our .
• In 1976, when divorce figures soared from the prE3vious year to a record number of 76,000, some 10% of these 1976 divorces were of couples who had separated pre-1969. Some 58% of divorces between 1976 and 1980 involved marriages that had broken up before the Family Law Act (1975), which finally recognised the public's understanding that it is the breakdown of marital relationships that is the 'cause' of divorce - it takes two to tango (Edgar, 1980).
.. '. " "- "
: .. -' . -- Table 1: Marriage Australia, 1971 and ~986:
. .' . .'"
-Indicator 1971
:' , ., ....
, ·1986 . --..
Per cent never married % % Men aged 20-24 63.9 (.: : 83.4
Per cent of women turning 20 in the given year who had been married 31.3
". 8.5
Total first marriage rate I per 100 persons I:~:. Men 99 63"
Women 100 65' . ;:.;. ~;: . ":!.:.'
% .. %" .- ". ~. ~ S'~r~::
Per cent of marriages in which one or .. ,\' :' . ~
both partners was remarrying 13.9 33~3 {', :;; ... \ ....
Annual remarriage rate for divorced '~ . <:.,.,i.
persons aged 25-39 I per 1000 divorced persons I Men 246 160
Women 215 124
Source: AIFS Family Indicators Database. 1988.
7
I I I I 1 I • I J I « I I I , I •• I I I I I I
'Facts' about families often reflect myths rather than realities. As we shall show, even some of the new family 'facts' can give rise to new myths and distortions.
Policies affecting families have to be based on an accurate and careful reading of social trends. It's not just votes that are affected, but the wellbeing of our families' lives.
. .
Items rated as 'very important' by more than 50 per cent of females or males ...
percentage rating item as 'very important'
females males 'Family' scale family connections 70 46 mother 73 64 father 63 47 siblings 64 52
'Jobs and future security' scale planning for a secure future 66 57 having an interesting job 53 61 having a challenging job 42 51 developing a career 41 54
'Friendship, sociability and enjoyment of life' scale enjoying myself 53 53 experiencing life to the full 55 45 being true to myself 74 56 my friends 55 41
'Involvement in society' scale leisure activities 47 53 Item not related to above scales a close intimate relationship 71 46
Source: R. Hartley, 'Enduring Values: What Young Adults Rate as Important', Family Matters, No.29. August 1991, p.31
8
I I I I I I • I J I I I I I ,
2. CONCERNS ABOUT FAMILY LIFE
The basic concern expressed Is that the family is 'breaking down', that the family 'lIas we know it" is rapidly disappearing' (McDonald, 1984, p.1).
What this usually refers to is the' knowledge' that:
• fewer Australians are marrying;
• couples are having fewer children and some are electing to remain childless (Le. fertility rates are decreasing);
• divorce is increasing;
• an increasing number of children are affected by the trauma of marriage breakdown;
• the number of single parents is increasing; and
• the number of blended families (Le. couples with children from previous marriages) is increasing.
Added to this are concerns that:
• welfare costs are rising;
• families do not 'look after their own';
• parents no longer discipline or set good examples for their children;
• women are 'taking jobs' from men and young people;
I · individual rights are overwhelming notions of responsibility and • cooperation.
I I What does the evidence show about the basis for such concerns?
I I I I
9
I I I I I I • I J I I I I I , I • I I I I I I
3. THE SEEDS OF CHANGE
First, Australia (and New South Wales) is not unique in its experience of rapid family change and the concerns that such change generates:
the post-War marriage and baby 'booms' were typical of all Western nations;
the improved education of girls and worldorce participation of women are typical of all developed (and developing) nations;
better education of women is the universal contraceptive, reducing fertility rates, not just the Pill, abortion or an aversion to marriage itself;
Australia's divorce rate followed the pattern of other industrial nations, but is lower than many countries;
6-..-------
1950 1960 \970 19110 1990
Year
Annual divorces per 1000 population
Source: McNicholl, G. (1990), Are Australian Families Like Others? Working Papers in Demography No.17, Research School of Social Sciences, ANU, p.27.
the one-parent, mother-headed family is a worldwide phenomenon, related to the 'feminisation of poverty', or, as others put it, 'the pauperisation of motherhood'. There are multiple causes, not just divorce; -
family policy is at centre stage in the social policy arena in countries as diverse as the USA and Italy, with the task of juggling work and family responsibilities a universal dilemma.
10
I 1 I 1 1 1 • I J I I
McNicholl (1990) states: "On none of the dimensions considered is Australia an outsider - in contrast to the US (a very high divorce rate), Italy (Iow divorce, low unmarried cohabitation, low extramarital births), and Sweden (high cohabitation, high extramarital births, high proportion of one-person households). The economic, cultural and public policy forces that make for broad cross-national similarities in family patterns are discussed. Past family trends appear to give little basis for predictions of the medium-term future. Most observers expect there to be a 'convergence to diversity', with perhaps a rise in the present variety of acceptable family structures but with stabilized low fertility".
Projected aged dependency ratios" in OECO countries
50 2025
40
30
0/0
20
10
0 Australia France Germany Italy Japan New Sweden United United
Zealand Kingdom States
• The aged dependency ratio represents the percentages of the population over 6S expressed as a percentage of the population aged 1 S to 64.
Source: United Nations, World Population Prospects: Estimates and Projections as Assessed in 1984 (ST/ESNSER.A/98) Sales No. E.86.XIII3.
Advice on Living Arrangements Ideal Family Size '}:if yOU w&e ad~hl~ a younQw()~n, Which of the follo~ing '. . ways of life would you recommend?
I I I· ,
All in all, What do you think is the ideal number of children for a family to have?
, .~ CrAUS~lia ·>::r· . 0 Australia
'E '.CD
I '.~ • I I I t I I
70
60
50
10
0
P'(+Britai~, .. .:unitedS~~~~'> ~:.,
Uve alone Uve with Live with without a partner partner.
steady but not then partner marry marry
Marry without
living together first
[@ Britain
•.•..• U~ited States
-::" ..... 'co 'o'
n
30
20' c' ..
10
0 0-1 2 3 . 40rmore
Source: A.VandenHeuvel. 'An International Comparison of Family Values'. Family Matters. No.29. August 1991. p.20.
11
I· I I I I I • I J I I I , I , I • I I I I I I
SEVERAL FACTORS GO TO MAKE UP THE 'SEEDS OF CHANGE' IN FAMIL V LIFE:
(i) Marriage and Fertility
• The experience of Australian women over the last century shows a sequence of change:
Generation Average live Ufetime Ufetime (Birth years births per % %
of women) married woman never marrying childless
1861-1866 5.1 14 21 1898-1903 2.8 13 22
1908-1913 2.6 9 19 1938-1943 2.9 4 8
1943-1948 2.6 5 10 1951-1956 2.4 11 20
(Source: McDonald, 1984, p.S, adapted)
• Of women born before the period 1908-13 over 10% never married. Those born between 1908 and 1943 were more likely to marry - they grew up in the Depression, World War 11 and include the mothers of the Baby Boom generation. Since then the proportion never marrying has reverted to tum of the century levels.
• The same is true for childlessness
• But the average number of live births for married women has halved.
• So is this a 'decrease' in marriage, or were the post-War years of high marriage and fertility rates an exception, not 'typical' but an historical 'blip', the Baby Boom caused by a greater proportion of women marrying though having smaller numbers of children per family?
12
I I I I 1 I • I J I I I , I , I • I .I I I I I
(ii) Multicultural Diversity
• The post-War years also saw large numbers of immigrants entering Australia's British-dominated society.
• Though most have continued to be of Anglo-Celtic background, the influx of both urban and rural non-English Europeans and, more recently, of Asian immigrants, has brought a diversity of family types and values.
•
ETHNIC COMPOSITION OF AUSTRALIAN PEOPLE
Aboriginal Angle-Celtic Other European Asian Other
Total numbers rOODs)
1846
41.5% 57.2
1.1 0.2
484
1861
13.3 78.1
5.4 3.1 0.1
1,328
1891 1947
3.4 0.8 86.8 89.7
7.2 R6 2.3 0.8 0.3 0.1
3,275 7,640
1988
1.0 74.6 19.3 4.5 0.6
16,300
Ethnicity and its differing cultural values also makes for different 'family values'.
Respondents agreeing with statements about divorce
Birthplace
Other Western Southern South-English- and Europe, East
speaking Eastern Middle Asia, Statement Australia couniries Europe East China Elsewhere
Males 'Couple should be able to
get divorce if want to' 91% 91% 84% 81% 78% 95% 'Feel devastated if spouse
wanted divorce' 65 55 56 75 56 60 'Frightened to be single
at 40' 53 42 50 53 17 60 'Divorce is too easy
to get' 45 37 59 75 67 70
Females 'Couple should be able to
get divorce if want to' 93 94 79 85 69 88 'Feel devastated if spouse
wanted divorce' . 68 64 62 60 58 68 'Frightened to be single at40' 52 47 45 62 48 32
'Divorce is too easy (0 get' 52 43 69 67 52 68
N umber of males 857 127 32 64 18 io Number of females 1 122 152 29 60 29 34
Source: Khoo, S.E. (1985), Family Formation and Ethnicity, AIFS Working Paper No.9, June 1985, p.47
13
I I I I 1 I • I J I I I I I , I • I I I I I I
Respondents' agreement with statements about sex roles
Birthplace
Other Wlestem Southem South-English- alld Europe East
speakillg Eastem Middle Asia, Statemellt Australia coulltries Europe East China Else/(l{,ere
Males 'Husband should make
important decisions' 21% 22% 31% 55% 44% 35% 'A woman is only fulfilled
as a mother' 21 \J 22 47 44 20 '\Vhatever a woman's career,
her most important role in life is still that of mother' 45 33 44 73 73 • 55
'Wives who don't have to shouldn't work' 57 56 69 69 61 7S
'Husband provides protection for wife' 91 89 88 95 lOO 95
'Husbands should help regularly with housework' 85 89 91 71 89 90
Females 'Husband should make
important decisions' 13 9 21 25 45 24 'A woman is only fulfilled
'Husbands should help regularly with housework' 82 82 76 62 76 82
Number of males 857 127 32 64 18 20 Number of females 1 122 152 29 60 29 34
Source: Khoo, S_E. (1985), Family Formation and Ethnicity, AIFS Working Paper No_9, June 1985, p_60
• However, we know that these groups move closer to the dominant 'core values' of Australian society the longer they live here. Divorce rates, for example, start to converge and conflict can arise between parents holding to 'old' values and their children who live in 'two worlds'.
• As well, older generations of migrants may be clinging to traditions already gone in their country of origin. The Greek family laW, as an example, is modelled on the Australian Family Law Act.
14
I I I I , I • I J I I I , I , I • I .I I t I ,
Languages other than English spoken at home 1986
Language '000 0/0
Italian 405.0 20.6 Greek 267.1 13.6 Chinese 130.8 6.7 German 109.4 5.6 Arabic/Lebanese 106.0 5.4 Spanish 70.1 3.6 Yugoslav (nei) 68.0 3.5 Serbian, Croatian 66.2 3.4 Polish 66.2 3.4 Dutch 61.4 3.1 Vietnamese 59.4 3.0 Maltese 57.8 2.9 French 51.4 2.6 Macedonian 43.1 2.2 Aboriginal languages 36.9 1.9 Turkish 31.2 1.6 Hungarian 30.9 1.6 Russian 21.7 1.1 Other 282.7 14.1
Total ('000) 2,002.8
Source: Australian Bureau of Statistics, Australia in Profile - Census 86, Cat.no.2502.0,1988
• It is important to stress that not all NES-background families are 'intact' or 'extended', despite policies of family reunion. Early waves of migrants, many refugees, came alone and often lived lives without their kin and without strong 'ethnic group' support. Later waves (e.g. Italians, Greeks) were more able to sponsor relatives and friends from their own origins. More recent Asian and South American refugees have little family support in Australia and have had to find substitutes for the absence of extended family support .
15
I I t I , I • I J I I I , I
-I • I .I I t I ,
(iii) Education Trends
• We know t~at the family is the main educator of children. It is .in the early childhood years that they learn language, the basIs for mathematics, physical and practical skills, self-understanding and interpersonal relationships.
• Yet few' education policies' regard early childhood education as a priority (the NSW Carrick Report, 1991, was an exception), and even fewer recognise the importance of 'parent education' to the learning capacity of their children. The school is an important partner of family education and can run in conflict with parental values particularly in NESS families (Hartley, 1987).
• Nonetheless, schooling long ago replaced paid employment as the main 'work' of children and Australia invests heavily in public education .
• The parents of today's children are better educated than those of any previous generation. They represent a huge' resource' that can be drawn on in the education of children.
• Retention rates to the end of 12 years' schooling have increased rapidly over the past two decades.
Year 12 students retention rate, Australia 1971-2001
Source: Department of Employment, Education and Training. Australia's Workforce in the Year 2007, AGPS, Canberra, 1991, p. SS; Australian Bureau of Statistics, National Schools Statistics Collection, Cat. no. 4221.0. Copyright Commonwealth or Australia. Reproduced by permission .
.• Completion of secondary school by girls increased from 44% in 1983 to 69.9% in 1990. .
• Numbers of females in higher education have also risen dramatically, not only of the young but also of women over age 30.
16
I I I I I I • I J I I I -I I , I • I I I I I ,
Year
1985 1986 1987 1988 1989 1990
1991
Note:
_ female students in higher education: Australia 1985-90
Total % of female % of female % of female % of female· . Age female total participation participation participation not participation participation < 20 years 20-29 ]0+ stated
Table calculated trom raw data, issued by Australian Bureau of Statistics in Year Book Australia 1992 and Women's Budget Statement, Budget Related Paper No. 5, 1992-93, AGPS, Canberra, p. 88. (Table excludes those not stating age in 1983-88.)
Source: T. & l. Earle, Education Participation in Australia: Gender Issues and Needs, Department of Social and Community Studies, University of South Australia, Adelaide, 1992.
School retention rates to Year 12 by school categories 1982-89
Source: Australian Bureau of Statistics, Year Book Australia 1991, AGPS, Canberra, p. 278. Copyright Commonwealth of Australia. Reproduced by permission.
• A key result of these trends is that more families are involved with and concerned about education, its relevance for the future and its quality.
• Inevitably, too, more women are entering the labour force with a 'career' orientation, not just looking for a temporary 'job' until they get married and have children.
• Such women's values are different. They want to be employed because of the satisfaction, the financial independence, the options and the social contacts employment provides (Le. the same reasons as men), and this has marked effects on family life.
• Moreover, with a below-replacement birthrate and a resultant ageing population, Australia will have to retain and encourage these wellqualified women to stay in the productive labour force. They cannot be • driven back to the kitchen'_
17
I I I I I I • I J I I I t I , I • I I I I I 1
(iv) Women in the Labour Force
• When men as husbands and fathers had a wife who did the housework and cared for children, there was little talk of the 'work/family balance'. Indeed, family matters were 'private' and of no concern to employers. Family problems (conflict, divorce, illness, disability) were not supposed to affect job performance.
• Of course they did, via absenteeism, depression, poor morale, distraction, accidents, use of alcohol and other drugs. A review of 'absenteeism' research, (Edgar, 1987) found no mention of 'family' as such, but concluded that close to 50% oj all days absent were likely to be caused by family-related problems. Studies of employers in large and small businesses acknowledge that family concerns affect workers' productivity (Wolcott, 1991, 1993).
• Women have entered the labour force not just because of education, or 'womens lib.', or changed values, but because the Australian economy needs them and because many families can no longer survive on a man's wage alone.
EMPLOYMENT STATUS OF PARENTS IN TWO PARENT FAMILIES WITH DEPENDENT CHILDREN - NEW SOUTH WALES, 1989AN.D 1992
1989
Married couples with dependent children present:
both employed 52.8 husband employed, wife unemployed 1.9 husband employed, wife not in labour force 34.8 husband unemployed, wife employed * * . husband and wife both unemployed 0.9 husband unemployed, wife not in labour force 2.7 husband not in labour force, wife employed 1.7 husband not in labour force, wife unemployed * * neither in labour force 4.3
Source: Australian Bureau of Statistics, Labour Force Status and Other Characteristics of Families, Australia, June 1989 and June 1992. Cat.No.6224.0 .
1992
53.4 2.9
30.3 1.3 1.1 5.1 1.5 * * 4.3
• After taking maternity leave, many women return to paid work. One in four returns for reasons associated 'with a career, but even 640/0 of managerial, professional and para-professional women gave financial reasons for returning to work, compared with 83% of manual and unskilled married female workers (Glezer, 1988, p.34).
• Generalisation is difficult about women and the labour force and caution must be exercised or the wrong conclusions may be drawn.
18
I I I I I I • I J I I I I I , I • I J I I I I
• For example, despite the return-to-work figures increasing even for mothers with very young children, 80% of women with an 18 month old child who were working full-time in 1986 said they would prefer part-time positions (Glezer, 1988).
• For women not in the workforce, 470/0 would prefer to stay out of it, while 49% want a full-time job.
• Preferences reflect not just 'values' about paid work, but also constraints and opportunities. While men are more likely to be employed full-time their share in housework and child care will be limited, and women are likely to assess the 'double-burden' as too much to handle without other forms of support. If that balance were to change, 'preferences' would change also. .
Preferred employment arrangements
100%
200/0
Not in the Working Working workforce part-time fUll-time
Employment status
Prefer
Fulltime
Part- Not time working
Source: H. Glezer, 'Mothers in the workforce', Family Matters, No.21, Australian Institute of Family Studies, Melbourne, 1988, p.34 .
• Moreover, if employers took more notice of the fact that 420/0 of male employees are fathers and that most men have (or will have) ageing parents to look after, perhaps a better balance between work and family would be seen as a male issue as well as a 'women's' one, as a matter of best practice in employee relations.
19
I I I I I I • I J I I I I I , I • I I I I I I
• Increasingly, Australian employers are implementing alternative working arrangements such as job sharing and 'telecommuting', providing family leave and days to care for sick dependents and child care options (Adie and Carmody, 1992).
A job is all right, agree 36% females I but what most 42% males I women really want is a home
I and children disagree 39% females
28% males I Being a agree 52% females 1 housewife is just
43% males I as fulfilling as working for pay
disagree 30% females ] 27% males T
A husband's job agree 26% females I is to earn money;
32% males I a wife's job is to look after the home and family disagree I 55% females I
46% males I A woman should agree 29% females I devote almost all
30% males ] her time to a family
disagree 51% females I 46% males I
A married woman agree 18% females should not attach
21% males 1 much importance I to a career
disagree 55% females I 52% males I
Note: The percentage who 'neither agree nor disagree' makes up the difference between 100 per cent and those who agreed and disagreed.
Source: A. VandenHeuvel, 'A look at Contemporary Family Values', Family Matters, No.29, August 1991, p.11
20
I I I I I I • I J I I I I I I I • I
I I I I I
(v) Secularism and New Values
Religion has remained an important factor in preserving 'traditional' family values, particularly male patriarchy. But Australian society has become more secular, more consumer-oriented, more questioning of institutional rules.
• Statistics on religious affiliation may not seem to support that view, e.g. the 1986 Census showed that:
- 11.4 million (73%) stated they were Christian
- the Catholic Church grew from 3.48 million to 4.06 million, 1976 to 1986
- other Christian denominations increased
- there was a 145% increase in non-Christian religions (from 129,000 to 316,000)
• Yet the 'No religion' response for 1986 increased by 75% to nearly 2 million, or 12.70/0 of all Australians.
• Migration of Catholics, Muslims and Buddhists explains some increases in religious attachment, but the overall movement towards a secular society seems to be based on greater validity being given to 'objective' scientific knowledge than the teachings of any religion. .,-
• Attendance figures have changed even more than 'affiliation'
- 31 % Catholics attend church once a week
- 70/0 Anglicans attend church once a week
- 130/0 Uniting Church attend church once a week
• Even for church members, beliefs vary
- only 51% of Catholics believe 'without doubts' in God
- 18% of Christians believe in God as the Creator, 160/0 see God as a 'Personal Spiritual Power'
• So appeals to religious values as a basis for' proper' family life fall on ears with very varied filters indeed.
21
I I I I I I • I J I I I I I , I • I J I I I 1
Social correlates of religious commitment 1984-1985
Church attendance ImportifnCe of Religious (% attending) religion (%) belief
Nearly Never Greilt No Mean score every import,lnee importilnce importance week or (0-10) more
Demographic attributes Gender:
Women 25 26 31 IS 5.8 Merl 17 33 20 26 4.7 Age: 30 years 13 35 16 27 5.2 65+ years 29 31 :ill 15 5.3 Birlhplace: Auslralia 21 30 25 19 5.3 Norlhern Europe 9 37 22 28 4.8 Southern Europe 18 10 :n 15 5.8
Source: B. Graetz & I. McAllister, Dimensions of /lustrillian Soci"ty, Macmillan, Melbourne, 1988, p.131.
• Just to illustrate, in relation to 'family values~, dramatic shifts in the way motherhood, the man~s role in decisIon-making are apparent.
Figure 2: Sex Role Attitudes 1971 - 1991 - Married Women
%
80
60
40 .... -.
20
O~--~-----------J----------J-__ ~ 1971 1981
A: Motherhood most important role B: Woman fulfilled as mother C: Decisions made by husband
1991
22
I I I I I I • I J I I I I I 1 I • I J I I I 1
(vi) Liberation, Equity and legislative Change
The past two decades have seen major changes in legislation and social policy that have both recognised changes in the way Australian families live and which in themselves have altered the way people view family life, especially the respective rights and responsibilities of men and women.
• In one sense, Australia has done fairly well in offering structural supports for family change (Figure 1). We passed equal opportunity laws in the 1960s and 70s, with the 1974 Equal Pay Provision representing at least a symbolic move away from the concept of the male breadwinner. Maternity leave provisions, though largely unpaid, were extended to the private sector in 1979 and to parental leave opportunities in 1991. The supporting mother's benefit became a Supporting Parents' Pension in 1972. Government subsidies for child care have been extended.
• But these have not gone far enough to reduce the pressures on families and they have, as yet, affected the realities of women more than of men. It is women who are forcing the pace of change inside the family because their options outside the home have expanded so rapidly. Until we achieve real workplace reform, affecting men as well as women, many men will continue to define the situation as a nuisance to be accommodated in the home rather than as a new structural reality requiring an entirely different world view.
Mid 60's:expansion tertiary education Married women work with C/wlth
Public Service 20 yrs
Decriminalisation of abortion Vic '67;NSW '71
Women's Electoral Lobby founded
Supporting Parents Benefit/Maternity leave First Federal women's advisor public sector
Equal Pay cases (shift from Breadwinner Model) Family Law Act
10 yr
10yrs 20 yrs
Maternity leave - private sector
Sex Discrimination & EEO legislation
Affirmative Action
Child Support Scheme
ILO Convention 156 ratified/Parental Leave
20 Yrs
24
I I I I I I • I J I I I t I 1 I • I J I t I 1
(vii)Suburban, Urban and Rural Life
• Where people live affects the quality of family life, in terms of:
- social contact vs isolation - the quality of neighbourliness - the sense of 'community' - the access to services such as child care, health and education - transport and communication - safety, security, crime rates - age ranQe - ethnic mix - access to work and time to reach it - open space vs crowding - leisure activities - environmental' cleanliness'
• Australia is a highly urbanised nation, with over 85% of people living in urban areas. This has grown from 62<>/0 in 1921.
• Most Australians choose to live in separate houses, rather than flats or high-density accommodation.
• The number of persons per household has decreased from 4.5 in 1911 to 2.9 in 1986.
• But the number of new households has grown. One-person and twoperson households doubled from 24.1 % in 1911 to 49.50/0 in 1986. Now one in every five households contains only one person.
• Australian families are very mobile, with about 160/0 of a/l people changing their residence in a 12 month period. This can weaken community and family ties.
• But Australian cities are very localised, with work often located near housing and family activities focused on the garden and local leisure pursuits. -
• The Australian Living Standards Study (AIFS) has found people in rapidly growing outer-fringe suburbs are not necessarily less well off, prefer the open spaces to inner suburbs, do not have far to travel to work or child care, and are not always disadvantaged in terms of access to services. However, the variety is enormous and planners are concerned about the urban sprawl.
• Rural families have decreased but still have different needs to be catered for.
25
I I I I 1 I • I
J I I I t I 1 I • I J I t I 1
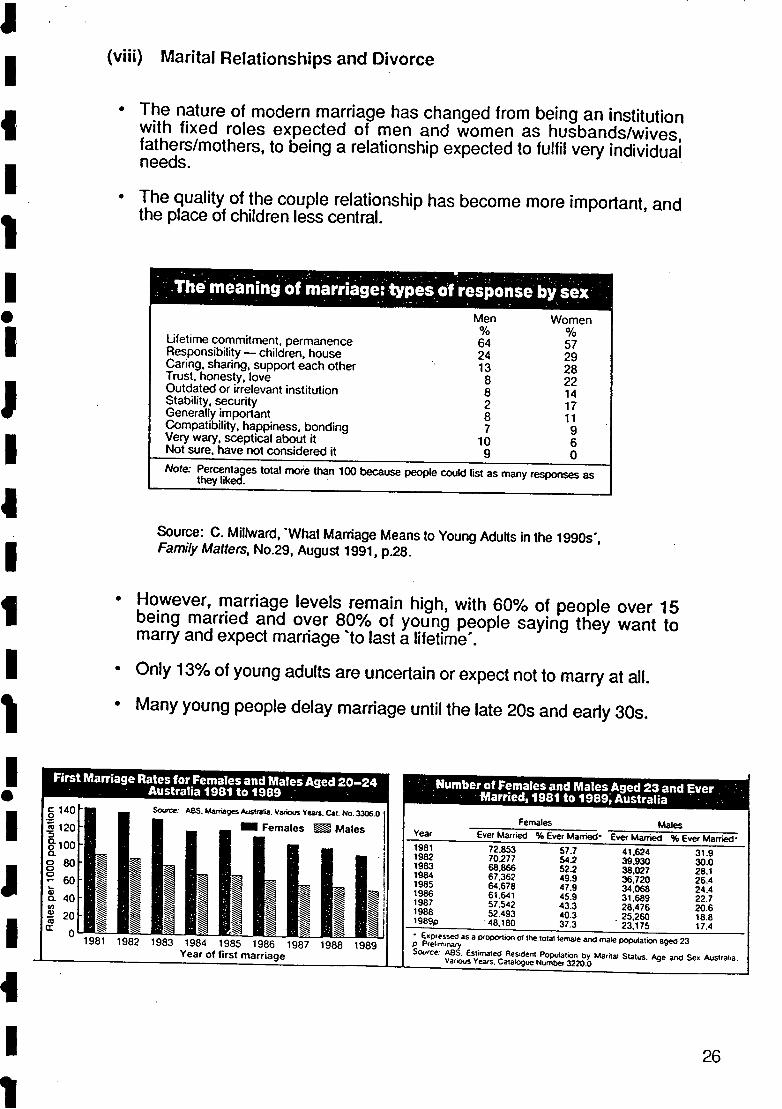
(viii) Marital Relationships and Divorce
• The nature of modern marriage has changed from being an institution with fixed roles expected of men and women as husbands/wives, fathers/mothers, to being a relationship expected to fulfil very individual needs.
• The quality of the couple relationship has become more important, and the place of children less central.
Lifetime commitment, permanence Responsibility - children, house Caring, sharing. support each other Trust, honesty, love Outdated or irrelevant institution Stability, security Generally important Compatibility, happiness, bonding Very wary, sceptical about it Not sure, have not considered it
Men % 64 24 13 8 8 2 8 7
10 9
Women % 57 29 28 22 14 17 11 9 6 o
Note: Percentages total more than 100 because people could list as many responses as they liked.
Source: C. Millward, 'What Marriage Means to Young Adults in the 1990s', Family Matters, No.29, August 1991, p.28.
• However, marriage levels remain high, with 600/0 of people over 15 being married and over 800/0 of young people saying they want to marry and expect marriage 'to last a lifetime'.
• Only 130/0 of young adults are uncertain or expect not to marry at all.
• Many young people delay marriage until the late 20s and early 30s.
First Marriage Rates for Females and Males Aged 20-24 Australia 1981 to 1989 .' .
. Number of Females and Males Aged 23 and Ever . Married, 1981 to 1989~ Australia .
Soutt:e: ASS. Marriages Australia. Various YeatS. Cat No. 3306.0 I _ Females ~ Males I
I
'j
1981 1982 1983 1984 1985 1986 1987 1988 1989 Year of first marriage
• bp.esse<:! as a p<opot1ion 01 the lolat female and mate population aged 23 p PrelImInary Source: ASS. Estimated Res.dent Population by Marilat Status. Age and Se. Austraha.
Various Years. CatalOgue Number 3220.0
26
I I I ,I
I I • I J I I I I I , I • I J I t I 1
• Many young people also 'live together' before marriage. For some this is a 'trial marriage', part of the courtship process. Others have a series of partners without any real intention to marry. Some States have defined 'de facto' marriage in terms of 2-3 years of 'living together' to ensure le~al protection for such partners and their children. Children of 'de facto couples who separate come under provisions of the Family Law Act. Others object that this makes marriage no different from just living together.
• Mote young married couples have been in a de facto arrangement than the older married generation.
• Divorce rates have increased over the past half century. The peak of 1976 levelled off in the 1980s but has risen slightly again in recent years. The duration-specific rate across 30 years stood at 36.1 in 1988 .
• The annual rate of divorce in 1986 was 11 per 1000 married couples, compared with 4.2 per 1000 in 1971.
• Projected figures suggest that about 35% of all marriages will end in divorce over the life course.
• But this means that 65°10 of all Australian marriages will last a lifetime.
• For children, about one per cent experience the divorce of their parents each year, so that by age 18 about 18°10 of children will have seen their parents divorce.
• The proportion of children who experienced parental divorce before their 16th birthday was 15.9°10 in 1986, compared with only 6.~/o in 1971.
• But 8~/o of children live in intact, two-parent families.
1971 1986 per 1000 married couples
0/0 0/0
Annual rate of divorce 4.2 11.0 0/0 ending in divorce 14.3 34.7 Cumulative % after 5 years 1.1 7.5
10 4.5 18.4 15 6.2 20.9 20 7.6 21.3
0/0 of children who experience divorce of parents by 16th birthday 62 15.9 0/0 marriaQes ending In divorce, for.
- men In 1 st marriage 14.1 34.4 - Men in remarriages 20.7 ·40.3
Women in 1 st marriage 13.9 34.1 - Women in remarriages 20.4 38.1
Source: McDonald, P., 'Families in the future: The pursuit of personal autonomy', Family Matters, No.22. AIFS, 1988, p.42.
27
I I I I 1 I • I J I I I I I 1 I • I J I I I 1
• These changes in family (re)formation patterns (later age at marriage, at first birth, living together, divorce and repartnering) have had a significant impact on the face of Australian family life.
Percentage changes in family type: Australia 1982-1986
Family Iype % change since 1982
Married couple, no offspring at home De facto couple, no offspring at home Married parents and dependants De facto parents and dependants Single parent and dependants Couple and adult family members Related adults (no couple or parent-child present)
down up down up up up up
6 8 5
20 13 21 IS
Source: C. Kilmartin. MFamilies-Strong But DiverseM. Family Matters, no. 20, Australian Institute of Family Studies. Melbourne. 1988, p. 37 .
• But the picture reflects' changing options and choices rather than a wholesale rejection of marriage itself.
• For example, whereas Australia was once seen to be 'the land of the deserting husband', now the initiative to end an unsatisfactory marriage is taken by women in about 600/0 of cases.
• Women have greater financial independence, are less willing to tolerate an unequal, unsatisfying or violent relationship and there is less stigma to living alone or as a solo parent.
• Research on the effect of divorce on children suggests that:
emotional damage is done by the degree of conflict involved, not by divorce per se;
conflict damages children in 'intact' marriages;
where parents divorce sensibly and explain the situation to their children such damage is low;
the. major impact of divorce comes from the poverty often experienced by custodial women and their children;
disruption to housing, schooling, contact with friends and relatives, security and adult relationships often follows and causes damage;
good access to the other parent is needed by and good for children;
children in one-parent families where divorce has been handled sensibly are more independent, with higher self-esteem than children in two-pare.nt families (Amato, 1987).
• The Family Law Act asserts the prinCiples of equality in marriage, joint responsibility for children after divorce and' no fault'. Such principles are not easy to apply and not accepted across the whole community.
28
J I I I I I • I J I I I I I , I • I I I I I 1
80~-----------------------------------------."
Better off Much the same Worse off Don't know
Source: R. Weston, 'Divorced Parents and Child-Related Orders', Family Matters, No.25, December 1989, p.20.
Custodial mothers with orders
CJ Non-custodial fathers
with orders
~ Custodial mothers without orders -Non-custodial fathers without orders
• Uttle attention is yet given to human relationships education in schools, education for marriage or programs of support for marriages in trouble. Preventive and supportive approaches might well reduce the human and financial costs of divorce (e.g. Based on 1989 dollars, the AIFS estimated that marriage counselling saved $47.5 million annually on costs associated with divorce, i.e. Family Court, Legal Aid and Supporting Parents Benefits [Wolcott and Glezer, 1989]).
• Divorce figures give a restricted view of the degree of conflict and family breakdown because they do not include those not formally married.
Typ€s of families: Australia 1986
Related adults (no couple or parent-dependent child present) 6.2% _______ ~....--
Couple + adult family members 10.8% ____ ~
One parent and dependents 7.8%----w
De facto parents + dependents 1.8"10 -----+l~--======~::'O""':::::::::-_
Married parents + dependents 42.8% ____ ~
Married couple, no offspring (at home) 27.8%
---- De facto couple, no offspring (at home) 2.8%
Source: Austral ian Bureau of Statistics, 1986 Census of Population and Housing, Table VFO 19.
29
I I I I I I • I J I I I I I , I • I J I I I ,
4. NEW REALITIES, NEW MYTHS?
The figures and trends presented above show dramatic change in family life in Australia. But there is danger in over-reaction, overgeneralisation and disapproval that may lead to new' myths' just as misleading as the view that everyone still lives in a 'male breadwinnerdependent housewife' family.
Comparisons? . • As already indicated, Australian trends are in line with other similar
countries, so the 'causes' are not peculiar to us. The optionality of modern life has brought choice in place of coercion and individual satisfaction in place of rigid role expectations .
The 'death' of marriage? • As shown above, marriage is not 'dead' and family life still has high
priority. Indeed 'family' outranks all other factors including jobs, income and leisure, in people s life satisfaction. .
Women 'take' jobs from men and the young? . • The return to and retention of women in the paid labour force does not
mean they are 'taking men's jobs', though they have every right as equals to do so. The figures show that while 680/0 of women aged 20-55 are in the workforce (and make up 4~1o of that workforce) many are in part-time work. 720/0 of 20-24 year olds work full-time, and 570/0 of 25--54 year olds work full-time.
• However, for women with dependent children, the percentage employed full-time is lower (41.7% for women in couple families and 53.9% in oneparent families) (ASS, 1992).
• In 1992, women accounted for 76% of the part-time labour force. Such part-time work equates with lower pay and lower status employment.
• Moreover, the labour market is still sex-segregated, with most women in service industries or the manufacturing areas under threat (e.g. textiles and footwear) and women's pay is still less than that of men in equivalent positions .
• So the 'two-income' family is something of a misnomer. Rather, most families have one and a bit incomes.
• Married women are also not holding jobs are readily open to young people. With downsizing, increasing skill levels required, the virtual destruction of the former positions taken by youth leaving school, the jobs done by women could not be done by inexperienced youth.
• Nor can the economy afford to lose the skills and experience of employed women. New ways must be found to help them stay there and also to assist young people to find meaningful roles in society.
30
I I I I I I • I J I I I I I , I • I J I I I ,
• Labour market trends indicate that new jobs created are predominantly in the information and service industries, thus suggesting that both men and women will be working in new ways requiring a variety of skills.
Voluntarism dedining? • While it is true that the new family patterns ~ive less time for activities
. outside paid work hours and home-making, It is not true that' voluntary work' has disappeared.
• ASS surveys have shown that over 28% of the civilian population aged 15 years and over gave an average of 2.4 hours per week to voluntary work. Other survey estimates range up to 6 hours per week.
• It has been suggested that • One and a half millio[); volunteers averaging 4 hours per week translates into the equivalent of 160,000 full-time jobs which would carry an annual remuneration bill of approximately $2,000 million {Hardwick and Graycar, 1982}.
• Though the ~ of volunteering is still sex-segregated (family support work like meals on wheels cf. sporting or school committees) volunteering is nQ1 an exclusively female activity. A 1982 survey found male volunteers spent on average 136 hours per year, compared with 112 hours for females.
• There is potential for employers in companies keen to develop 'best practice' to encourage their employees to become more involved in community activities, the more balanced life having spinoffs in company productivity as well as corporate image. .
• The vast bulk of child care is not formal or paid for, but is done 'voluntarily' by relatives, friends and neighbours.
Families smaller? • Though average family size has decreased, it is not true that the one- or
two-child family dominates. When looked at from the viewpoint of children, most are growing up with two or more siblings.-
• McDonald (1990) estimates that current fertility rates imply: - 3~/0 of women would have 3+ children . - 240/0 of women would have only 2 children - 24% of women would have only 1 child - 200/0 of women would have no children
Moreover - 61 % of children would come from families in which the mother had
three or more children - only 13% of children would be from one-child families.
Families no longer care? • Nor is it true that families no longer 'look after their own'.
31
I I I I I I • I J I I I I I 1 I • I J I t I 1
• Rather, the family is the major 'welfare system' of society and without its caring (for children, the sick, the disabled, the aged) Australian society could not function.
• Care means both' caring for' (based on love and affiliation) and' care of (the practical taking care of those who are dependent). Families do both, as part of their preference and their duty.
• Families, themselves, attest to the importance of 'sharing the caring' with community supports. They are more likely to take on care where they do not have the total burden (d'Abbs, 1992).
• Women predominate in the carer role, apart from their usual caring for children, but men are also involved .
In 1988, for 337,800 severely handicapped people, 64% of their 'Iivein' helpers were female, mostly women in the 30-44 years age group. 92% of those below 30 were the mother; from age 30 upwards it was the spouse; sons and daughters provided 380/0 of the care to those over 75 years. . Some 205,300 carers were females, compared with 117,300 male carers.
• Stress levels as a result of prolonged care make respite care and other forms of help as per the HACC (Home and Community Care) Program a basic support need.
'Extended families'? • There is strong evidence of inter-generational support, both from the
young to the old and from the old to the young. Contact is high between family members.
Figu,..~ 2: Phol1~ Conl4ct by Proximity
.r To ~ 0:-~60 t-, 50 f .. -~40
30
20
10 o Daily!
weekly 2-12 weeks
Yearlylless Never Daily! weekly
2-12 Yearly~ess weeks
Fr~qu~ncy of COil/act Fr~q"rncy 0/ COtltilct
Never
SiblinK'
Daily! weekly
2-12 Yearlyness weeks
I same town III 2 hr drive [] other Australia D overseas
Source: C. Millward, 'Keeping in Touch: Extended Family Networks', Family Matters, No.32, August 1992, p.18.
Never
32
I I I I I I • I J I I I t I , I • I , I t I I
". .... '" .,..... . .,.. ., '. .',
('"",il, Af,w,i.<r,
Your Your Brotherl Adult Other Father Mother Sister Child Relative
% % % % %
Same house, street, or sUburb/town 9 11 17 24 13
Within a 2-hoUf drive away 61 58 63 58 61
Elsewhere in Australia 14 14 9 11 14
Overseas 16 17 11 7 12
-~~ Note: Percentages are based upon those respondents with kin 01 this type and ~ mote than one person of this kind exists. the nearest one. (See the relevant raw numbers at the bottom of cOlumns.)
CDntAct ill ~"Jq"
Daily to weekly
Fortnightly to about 3 monthly
Yearly or less often
Never
Your Father
0/0
38
39
13
10
Your Mother
%
45
32 14
8
F"'lIily Mn""',, Partner Partner Brotherl Father Mother Sister
Co"t"ct by ktl<r % % % % % % % Between daily and weekly 1 0 1 0
Fortnightly to about 3 monthly 16 21 14 19 17 20 22
Yearly or less often 12 12 6 9 13 4 17
Never 71 66 79 71 70 75 61
;~fr~~i~·~#~·.~~~_~~AWB:·
Source: C. Millward, 'Keeping in Touch: Extended Family Networks", Family Matters, No.32, August 1992, p.16
• These are not extended families living under the same roof, but kinship is strong despite several households and geographical distance .
• Caring for our elders and other dependents is a burden on families, but government support provides only $1,095 p.a. for home care compared with $35,000 per person for institutionalised care via nursing home subsidies.
'Ageing is a problem'? • Australia's population is ageing, but lags behind Europe because of a
less rapid fall in our birthrate and because of the influx of young migrants.
33
I, I I I 1 I • I J I I I I I , I • I J I t I 1
• By the year 2031, our population is projected to be 26 million, with an average age of 42 (now 31), and one in five will be older than 60 (15.50/0 now).
• The population of working age (15 to 64) will decline from 66.90/0 in 1990 to between 60.7 - 64.7% in 2031.
• The number of people aged BO-plus will double from 0.4 million to 1-1.5 million.
• The 75-plus age group (only 4% of the population) already accounts for 2BO/o of health outlays.
• However, alarm over the 'dependency ratio' is called into question by decreasing numbers of dependent children and the healthier old age of elderly people. , "
• As well, retention of' women in paid work and the phasing in of retirement rather than compulsory retirement ages will also alter the 'dependency' picture.
• The rise in numbers over age 60 will level off in the middle of the next century to stabilise at around 25% of our population (NPC, 1991).
• Nonetheless, Australian families will be older, more mature, with different needs and demands from those with young children.
Sou~ce: H. ~endig & J. McCall.um, Greying Australia, Australian Covernme'nt Publishing Service, Canoerra, 1988. Copyright Commonwealth of Australia. Reproduced by permission.
'Youth are uncommitted'? • Serious concerns are expressed about youth of today. Drugs, sex,
vandalism, rebellion against parents and homelessness are blamed on the' alienation' of youth from family life and other social institutions.
34
I ':
I I I I I I • I I I I I I I , I • I J I I I I
• Yet, as we have seen, most young people live at home with their parents, are in school or other forms of tertiary education or training and are basically very 'conforming'.
• Despite the popular media image of teenage-parent conflict, most adolescents place a high value on 'family' and get on well with their parents.
- 1989 Saulwick Age Poll showed teens respect parents, look to them for advice on work, career and personal matters, turn to parents for help and emotional support.
- A 1991 study of 2000 14-16 year olds found that 'to care for and provide for a family' was rated as the most important value to hold onto throughout their adult life. . .
- 1992 AIFS Living Standards Study shows conflicts between parents and teenagers are relatively minor~
life satisfaction ratings (on a scale of 0-9)
Fathers Mothers Boys Girls Partner's relationship with children 8.08 7.90 Your relationship with children 7.95 8.23 Wellbeing of your children 7.57 7.73 How well the children get on 7.45 7.54 Relationship with parents 7.52 7.53 Overall living standard 6.44 6.67 7.04 7.00 Respect/recognition 7.00 7.15 6.78 7.39 Leisure opportunities 5.68 5.94 6.26 6.61 Time to do things you want 4.99 5.28 5.89 6.28 Money available 4.34 4.11 4.48 4.89 What Federal Government is doing 3.15 3.27 3.13 3.67
Source: Weston, R., 'Health Status and Personal Wellbeing', Ch.12, The Australian Living Standards Study, Berwick Report, Vo1.1, 1992.
• Nonetheless, family circumstances vary widely and not all parents are caring, supportive or able to offer good advice:
- periodic surveys of youth attitudes show that 500/0 of 15-24 year olds were worried about family relationships.
- the one per cent of our 15-24 year old population that is homeless come from unsafe and/or unsupportive family environments.
- The Burdekin Report on youth homelessness pointed to the key years of 12-14 as a source of conflict over autonomy, control and thus of leaving home prematurely.
35
I I I I 1 I • I J I I I I I , I • I J I I I 1
Over-reliance on the State? • There has been concern at the over-reliance of people on the State, the
costs of 'welfare', the 'hand-out mentality', etc.
• First, governments are set up to do those things which separate individuals and separate families cannot do, to plan and coordinate for the good of the whole community. Taxes are collected for social redistribution purposes.
• There are, of course, many ways to do this, ranging from the extreme State control of Communism to the extreme laissez-faire of free-market Capitalism. Australia has always sat somewhere in the middle, as a 'social democracy' of sorts.
• The' social wage' outlaid by Australian governments makes up a large part of our standard of living - health, education, housing and community facilities, social security and welfare. It is targeted at the most disadvantaged, those on low incomes, but some elements of the social wage are 'universal' benefits.
• Numbers of people receiving their basic income from Social Security benefits have risen dramatically. The total number of DSS pensioners and beneficiaries in 1982 was 2,843,864; by 1991 it totalled 3,168,351. The number on unemployment benefits increased from 720,500 in May 1983 to 920,000 in May 1992.
• The real disposable incomes of such beneficiaries in recent years, and without such a 'welfare safety net', Australia might be experiencing more of the social unrest, poverty and inequality of the USA and Great Britain.
Increases in real disposable incomes for selected social security pensioners and beneficiaries between March 1983 and December 1987
Category
Single pensioner, no children
Sole parent, 2 children (under 13) -renting privately -not renting privately
Married pensioner, 2 children (under 13) -renting privately -not renting privately
long-term unemployed single adult -renting privately -not renting privately
Percentage change
+8
+13 +13
+12 +12
+18 +12
+33 +21
Source: R. Hawi<e, Towards a Fairer Australia: Social Justice Under tabor, AGPS, Canberra, 1988, p. 19. Copyright Commonwealth or Australia. Reproduced by permission.
• The current Recession has meant unemployment affects hundreds of thousands of families. Such people cannot survive without State support and the costs of unemployment extend well beyond the impact on them during the actual time of unemployment.
36
I I I I I I • I J I. I I I I , I • I J I I I I
Unemployment and Families, February 1993 (The Age)
• one in 6 of the 1 million unemployed has been out of work for at least 2 years
• half have been looking for work at least 6 months
• long-term unemployment is concentrated among male 'breadwinners' seeking full-time work
• 718,000 (one in five) children under 14 have no working parent at home
• for 291 ,000 children (two in every school class of 30), the only breadwinner(s) at home were unemployed. That is 3 times as many as there were In December 1989
• welfare agencies report increasing requests for emerging and crisis relief
• homeless (intact) families are emerging, not just homeless youth or the traditional homeless male
37
,. I I I I I • I J I I I I I , I • I J I I I 1
5. KEY FAMILY ISSUES IN THE 1990s
(i) Juggling work and family responsibilities
• Growing numbers of families rely on the income of both parents, yet work structures still reflect the view that every worker has a 'wife at home.
• One-parent families are missing one pair of hands for all the tasks of keeping a home together, so to earn a living makes work arrangements and supports such as child care even more critical to their sUNival.
• Even families where only one partner is in employment have 'work/family' problems, because time and stress in one impacts on the other.
Table 1: The effects of women's employment on the family: men's and women's views
A pre-school agree 47% females . I child is likely to
56% males I suffer if his or her mother works
disagree 36% females I 27% males I
A working mother agree I 64% females I can establish just 51% males I as warm and secure a relationship with disagree 28% females I her children 39% males I Family life suffers agree 46% females I when the woman
51% males I has a full-time job
disagree 38% females I 31% males I
I It is more difficult agree 62% females - I to raise children I successfully 69% males when both
23% females I parents work full disagree time 18% males
Note: The percentage who 'neither agree nor disagree' makes up the difference between 100 per cent and those who agreed and disagreed.
Source: A. VandenHeuvel, 'A Look at Contemporary Family Values', Family Matters No.29, August 1991, p.10.
38
, I I I I I • I J I I I I I 1 I • I J I I I I
Work and family stress among married men and women
per cent agree Men Women
leisure Time I spend woOting interle<es with free time 67 58
Often tired so don't see friends as much as would like to 54 57
4' 35 Home Spend so much time at work. am unable to do much at home
When get home from work. no ene<gy to do work around house 39 47
Relationship Worry about job interle<ing with relationship with partner '8 9
After Work, often too tired to do things with partner 29 3'
Parenting Working hours ,nterlere with time spent with children 57 41
After work. often don't have energy to be a good parent 29 30
Source: D. Edgar & H. Glezer, • A Man's Place ... ? Reconstructing Family Values', Family Matters NO.31 , April 1992, p.38.
.... ~ .
• 'Work and family' is DQ1 a gender issue, it is a family issue, though more of the 'double burden' at present rests on women.
• Australia has ratified ILO 156 on Workers with Family Resf?,0nsibilities so sill employers are obliged to develop measures that WIll help men and women meet their dual tasks more effectively. 'Best practice' requires it.
• Leading-edge employers have already seen the cost-benefits of 'family-friendly' work practices. These range from child care places to flexible working hours, to information on elder care, to simple things like the 'warm line' (allowing workers to use the phone to check on children after school).
• Benefits include better morale, greater productivity and commitment to the company, reduced absenteeism, better retention and less turnover/retraining costs, fewer accidents, a generally healthier, more productive workplace .
• The need is for rethinking the debate, challenging old orthodoxies (e.g. Work-based child care is not what is needed by parents of teenagers or those with elder care responsibilities) and helping employers to respond sensibly. The 'New Links Workplace' being piloted by the Australian Institute of Family Studies and the Business Council of Australia is a model for new partnerships between work, family and community.
39
I I I I I I .' I J I I I I I 1 I • I J I I I I
The New Links Workplace
Work Place
Consumer/public Image Caring community Economic wellbeing Schools/training
Community
Family
40
J I I I I I • I J I I I I I 1 I • I
J I I I 1
(ii) Economic inequality and unemployment
• Poverty and the despair of joblessness rank higher than ever as a 'family' issue. Such figures are not just economic statistics. Every person unemployed comes from a family, has a family, will affect a family.
• Unemployment and poverty have disastrous effects on children. The despair of parents, their inability to provide, the social stigma of disadvantage, loss of secure housing, schooling, worsening nutrition and health all have long-term costs for every child and society as a whole .
• High levels of unemployment are the newest threat to family stability. Conflict over money, guilt and anger lead to alcohol misuse, violence and child abuse. Welfare agencies report these increases now and marriage counselling services are being asked to help those who have traditionally avoided such personal services.
• As was stated at the National Family Summit recently:
'family values did not create the deficit, or the Recession, or unemployment, or the violence on TV that is mirrored in community life. Families and the individual never have done it all on their own and we must look at the supports for and obstacles to private life that are put in place by our public programs, policies and institutions. When we seek the causes of moral decline, of divorce, of youth homelessness, we might do well to remember President Clinton's campaign slogan: "It's the economy, stupidl" and work outwards from there.' .
• Governments cannot turn aside from these issues if they wish to preserve the stability of marital and family life. New thinking is required about how to provide and use existing resources more effectively.
41
J I I I 1 I • I J I I I I I , I • I
J I I I
(iii) The difficulty of being a parent
• Both the demands of work and the inability to provide adequately for family needs make being a parent very difficult indeed.
• With fewer children, parents 'invest' more (both money and emotional involvement) in their children. It is easier to feel a 'failure' as a parent if your only child goes off the rails than when several children naturally varied in ability, personality and 'success'.
• Uttle attention is given to educating, training, or even informing young couples about what it means to become a parent, about early child development, about how to handle the shift from child to adolescent to independent adult. Yet we require a licence to drive a car, own a gun, qualify for a profession. Children can be lethal weapons too, unleashed upon an unsuspecting public, and parenting needs a lot of attention.
• This does not mean necessarily 'courses' in parenting, or one standard set of ways to 'be' a parent. We need more imaginative use of workplace videos, school-based activities, community fairs to help us 'Grow Together'.
• Brian Jackson (1984) called the father 'a double engine behind the child's potentiality'. We have neglected half the potential for positive child development because we downplay the role of men.
• The Australian Institute of Family Studies was able to test that proposition in its study of children and their views of family life (Amato, 1987; Edgar. 1985; Ochiltree. 1990). Children are very honest in their comments about parents. saying that most of the time fathers 'sleep'. 'watch television'. 'sit around'. 'fix things', 'garden', as well as doing a lot of 'yelling and drinking'. But they are very affectionate about their fathers as welt as their mothers. Fathers are seen in terms of their work. but also as sources of fun and play, a lUxury busy housewives cannot always offer.
• But when we correlate self-esteem scores with measures of how much each parent talks with them and offers help. there is a stronger correlation with fathers' interaction than with mothers'. The same pattern holds for children's reading comprehension scores. Add to this the findin~ that family conflict damages child competence and family cohesion Improves these outcome measures. and the potential of the father's role becomes very clear. .
• The 'absent' father, devoting time to work but neglecting communication with and interest in his children damages both competence and the child's sense of self worth. His message. as a powerful significant other for the child, can be either you are worthwhile or unimportant. Such a finding needs to be conveyed to all fathers so their potential for child development is better tapped and built upon.
42
J I I I I I • I J I I I t I 1 I • I J I t I
• We also need to reassert the view that children are the whole community's responsibility, not just their parents.
• We need to ask how 'family-friendly', how' child-friendly' is the local community, the shopping centre, the school, public transport, the local church, the playgrounds and other gathering places of families?
43
J I t I I I • I
J I I I t I 1 I • I J I t I 1
(iv) A 'place' in society for youth
• Today's youth live very different lives from those who are now adult. We cannot assume an easy progress from school to work, or from parental home to independent living as an adult. There are no normal' pathways to adulthood.
• Since 'work' is still important in making young people 'feel like an adult', unemployment (and even prolonged education before work) denies many of them a 'place' in society, a 'stake' in the community itself.
• ACOSS estimated the number of young people 'at risk' (Le. not in either education or a job) at 17% (225,900 15-19 year olds) .
• Disappearance of full-time jobs for teenagers in the labour market has driven the trend for more boys and, especially, girls to stay on at school, as well as retention policies aimed at increasing skills for a productive learning culture that will be internationally competitive. .
• By 2001, the Commonwealth's goal is to have 95% of 15-19 year olds complete Year 12 or an initial .Rost -school qualification or to be in some form of education or training (Australian Education Council).
• But the end of schooling no longer marks a positive, optimistic step; rather, uncertainty and pessimism for many ..
• Family life and parental support are thus increasingly important for young people.
• The first data from the 1991 Census show that (for Tasmania only as yet) some 20.1% of families contain 'non-dependent' children only (the ASS definition of 'non-dependent' does not match family reality very well). .
• For 'young adults' living at home with parents, the picture of change is even more dramatic.
YOUNG ADULTS LIVING WITH PARENT(S) 1982-1992
Of all those aged 20-24 % living with parent(s)
Of all those aged 25-34, % living with parent(s)
Males 1982 1992
47.9 54.9
9.7 16.8
Females 1982 1992
28.1 39.7
3.6 6.9
Source: Australian Bureau of Statistics, Labour Force Status and Other Characteristics of Families, 1982, 1992. Cat.No.6224.0.
44
J I I I I I • I J I I I t 1I , I • I J I I I I
• We need to ask whether schools have caught up with social change and the complex family lives of students, or are they stuck (like many workplaces) in outmoded rigidities about time, performance, motivation?
• We need to challenge the separation of youth into 'education', isolated from community service and neighbourhood life. Might they not become better citizens through school or college credits for help in child care centres, for the elderly, other human contact 'work' that gives them a sense of being needed, of being valuable to others rather than in a state of suspended animation?
• Youth need to feel 'useful' rather than 'useless', to have a stake in the society itself, not to sit apart from it as many now do.
45
J I I I I I • I J I I I I I , I • I J I I I 1
(v) A healthier approach to ageing
• An ageing society is not a sign of failure.
It is easy to forget that the' oldest' countries usually have the highest standards of living, the best medical care, the greatest industrial development and technology. An older population is a consequence of societal success and affluence. Fertility control reflects control over agriculture to ensure a food surplus; it reflects control over technology enabling industrial development; it reflects control over disease and premature death. Birthrates have declined almost regardless of the presence or absence of these conditions, so the key issue is how to handle an ageing population in a more positive way .
The ageing of our society is cause for celebration if it is recognised as an extension of opportunities. It means maintaining tremendous skills and resources with the wisdom of experience. It promises a spreading pool of competence and human help to be drawn upon with enthusiasm.
• The NSW program 'Age Adds Value' epitomises this approach, as does the Victorian program 'Active at any age'. A healthy and active old age is good for the community and we should not define our elders intQ dependency.
• The goal must be to recreate those inter-generational links which allow for cultural transmission, continuity and mutual respect, despite rapid social change.
• Programs at the local level could be organised by schools, child care centres, councils, youth groups to foster inter-generational contact.
• Every effort needs to be made to maintain health and the independent living style preferred by most of our elders.
46
I I I I I I • I J I I I I I I I • I J I I I 1
(vi) Men' catching up'
• Changes in legislation, access to education, employment and nonfamily-focused activities have been greater for Women than for men.
• Male attitudes are changing as they try to understand the new independence of women, but the constraints on change continue from full-time work demands and the way males are brought up.
• As ILO Convention 156 states, 'any change in the traditional role of women must be accompanied by a change in the traditional role of men, involving their more active participation in family and domestic life' .
• 'Different but equal' is the message for every citizen in'.a civil society, applying to race, ethnicity, religion and sex, all 'statuses' one is born into.
• Every institution needs to be looked at closely in terms of the extent to which it expects/provides less control, less status, less power and lesser rewards for females.
• The family is the real crucible of change in Australian society because it is there that women's new lives test the assumptions of men about 'appropriate' behaviour.
• Until men play a greater part in caring roles (especially of their children) the transmission of a stunted male ability to express emotions, to show they care will continue.
• Change may well involve women 'giving up' some of their control of caring and changing the attitudes about sex roles they display to their sons and daughters.
• Education in the broadest sense must prepare boys as .well as girls for the dual roles of caring and earning an income. Both the formal and 'hidden' curriculum in schools and the overt- and covert messages of the public media must address gender attitudes and behaviour to encourage shared family and community roles.
47
J I I I I I • I J I I I I I , I • I J I I I I
(vii) The violence issue
• The Prime Minister has flagged family violence as a key issue for Australia in 1994, the International Year of the Family.
• Violence has many causes, but reflects an inability or unwillingness to use rational discussion to resolve disagreements, and a lack of respect for the rights of other people.
• In a civilised society, any form of violence is violence and should be treated as such.
• At the most basic level, using violence as a means of 'disciplining' children has to be stopped and better methods learned of teaching self-control.
Form of Punishment
Yell at you
Hit you
Send you CO your room
StOP you from watching television
Stop you from seeing friends
Make fun of you
Tell you they don't love you
Mother Father
Mother Father
Mother Father
Mother Father
Mother Father
Mother Father
Mother Father
94 78
81 76 81 66
60 54
53 39
12 12
6 4
96 82
74 63
71 51
63 45
39 20
8 6
2 o
From: Amato, P. (1987), Child ... n in Allltraliall Familil1: TIN G~1h oIC_pt/trltl, Pr~ntic~·Hall, Sydnqo.
• 'Domestic violence' is a term which softens, obscures, excuses the use of violence in one place (the home) which would be condemned in public .
• Terms such as 'wife-bashing', 'verbal abuse', 'rape in marriage' tell it more directly and accurately. Bashing is bashing. Rape is rape.
• While alcohol and violence seem to 'go together' there is no causal link. The USA is a low-alcohol use society, yet violence is extremely high. Drug use is higher but there is no necessary causal link.
• Men who bash their wives 'because they were drunk and didn't know what they were doing', are startled when asked 'Why didn't you kill her, then?' They usually stop short, so they QQ. know what they are doing.
48
J I I I 1 I • I J I I I I I I I • I J I I I 1
• Programs against violence need to address men in general, not just perpetrators or female victims.
• Violent behaviour is learned in the home ('giving the belf) and children who witness or experience violence and sexual abuse are more likely to repeat the pattern as adults.
• Research shows that poverty and disadvantage are associated with higher violence, but again there is no causal link. Some areas and neighbourhoods with high numbers of poor, unemployed, and Black/Hispanic people in the USA have lQW. rates of violence, abuse, vandalism, crime, yet neighbouring areas have high rates. The difference seems to be the sensa of 'community', access to family support services, child care, good schools and playgrounds .
• This means that public programs aimed at violence .. should not address just the individuals involved, but characteristics,.of the local neighbourhood itself - the need is to 're-surround' families with supportive services and a sense of security.
• Fear of violence is often higher in our suburbs than the actual level of violence.
% % Has to cross busy roads 65 59 VIOlence on public transport 11 7 Fear of attack by someone in the street 77 70 Fear of kidnap. being picked up in the street 88 80 Other problems e.g. no footpaths 17 19
Boys 12-14 years 62 71 Boys 15-17 years 27 69 Girls 12-14 years 68 75 Girls 15-17 years 60 81 S./ery problem .t .;,bt Boys 12-14 years 82 80 Boys 15-17 years 50 82 Girls 12-14 years 76 79 Girls 15-17 years 90 81
Source: H. Brownlee & P. McDonald, 'A Safe Place for Children', Family Matters No.33, December 1992, p.25.
• But public action to improve street lighting, design safe parks and railway stations, ensure 'safe houses' for children, a sense of 'presence' and 'friendly acceptance' of local police, can alter both the perceived and the actual threat.
• The more 'empty' are our streets and public places, the more we confine .people to the 'safety' of their own homes, the more unsafe will our suburbs become.
• Institutional violence is as big a problem as personal violence, and requires different solutions.
49
J I I I I I • I J I I I I I 1 I • I J I I I 1
(viii) Economic 2ruI social support
• While jobs, incomes, the state of the national economy are vital to family life, social supports are equally necessary.
• It is the isolation of families, the laying of blame and total responsibility on them that makes for despair and social disruption.
• State and local government have the main responsibility for support programs but need adequate funds to provide them. However, more Imaginative ways of using existing funds could be found to ensure more family-supportive communities.
• While standards and guidelines may be set for programs and services, it is far more cost-effective to rely on the clients, the users to monitor them than an army of public 'inspectors'. Local people will watch every dollar spent, be more accountable when they are given control of how those dollars will be used.
• We might do well to talk of 'economic humanism' rather than 'economic rationalism', since economic policies are there to serve human social goals, not the niceties of economic models that must change as social needs, technology and international relationships change.
50
I ' ! /'
I I I I I • I J I I I I I 1 I • I
J I I I 1
(ix) New partnerships - building stronger communities
• Families live in a local area. Their contacts with relatives and friends may spread wide but most focus their lives on a neighbourhood, a suburb, a particular locality.
• The quality of that locality then has to be the key to a healthy, positive family life, but we cannot assume every neighbourhood IS neighbourly', every locality is a 'community'.
• Families and individuals today do not want 'communal' activities or 'neighbourliness' thrust upon them; they want choice, privacy, autonomy, but also an environment that is safe, 'friendly' in the sense of supporting their chosen way of life.
• So building stronger communities will not mean a return to an idealised 'village' where everyone supposedly worked and played together, where everyone knew everyone else's business (and interfered with it).
• Rather, it will mean asking questions such as the following:
What facilities, services do families need/wanVcurrently have access to?
What sorts of families live here and how do their needs differ? Young couples, families with children, teenagers, older couples, singles, different ethnic groups, etc, will not all need or want the same things.
What resources exist in the area that are under-utilised? (Le. both people-resources and physical/material resources).
How could those resources be pooled, drawn on, combined with those of neighbouring areas in more effective ways?
Could limited funds be provided by government to help this pooling and better use of resources?
Are companies that provide employment putting people in touch with information about and access to those resources?
• In turn, new partnerships could be developed:
- between school and home
- between school and the workplace
- between the workplace and community services accessible to their employees
- between schools and T AFE colleges
51
I, I I I 1 I • I J I I I I I I I • I J I I I I
- between support se'rvices themselves
- between levels of government
- between local doctors, dentists, medical centres and family service agencies
- between groups aimed at children, youth, the aged as a vehicle for inter-generational exchange, mentoring and mutual support.
• There are endless local opportunities to draw on resources offered by a range of services in the community .
• To talk of 'privatising' welfare support services is to miss the point. People in society are not either 'independent' or' dependent' - they are inter-dependent, and the public/private mix is the essential 'social cement' for a cooperative civil community.
• The 'privatisation' of social responsibility will never work because of that inter-dependency. What might work better is a renewal of responsibility at every level, focused on where people liye and work rather than at some abstracted bureaucratic and administrative level.
• A society can only thrive by sharing responsibility for both public and private wellbeing.
• Small community accountability will be more effective in meeting the diversity of needs and drawing together existing resources than 'the big stick' from higher levels of government.
• A true civil community is one in which individuals and families feel Q9!1 of, hold a stake in the quality of civic life, the wellbeing of others. This should be the moral focus of families, schools, church and leisure groups.
52
, I I I 1 I • I J I I I I I 1 I • I J I t I I
(x) Developing a child-friendly, family-friendly community
• One way to approach the notion of strengthening communities is to focus on 'child policy', a requirement now under Australia's ratification of the UN Convention on the Rights of the Child.
• A starting set of propositions for child policy would include the following:
- Parental resources and capacities are the key to healthy child development.
- Children are everyone's responsibility, not just parents' .
- Full development of every child's potential is the goaf~ not just child care.
- Parent support and empowerment are better than substitution.
- Non-parental care is always needed.
Children's rights and needs come before parent interests.
- The wOrkplace seriously affects parent/child relationships.
- The media (TV for children) should be used, not ignored.
Neighbourhoods for growth are important - how' child-friendly' is the local community?
- Inter-generational linkages are vital, not isolated child/parent policies and programs.
• To pick up the notion of a 'child-friendly' community, questions such as these could be built on:
- Are road crossings safe?
- Are there bicycle paths?
- Are there baby change rooms in the local shopping centres, train stations, libraries?
- Are drinking fountains low enough for children to use?
- Is there plenty of shade, open play spaces for children?
- Are local parks designed to help children develop all their learning capacities? e.g. a music park? a science park? a physical skills park? a reading signs park? a kinaesthetic/movement park? a grow-your-own garden park? etc.
53
I I I I I I • I J I I I t I I I • I J I t I
- Are nature strips planted with herbs, fruit trees, plants that attract birds?
- Are spaces/seats/opportunities provided for young to meet old?
- Are musical (band) instruments available for less well off youth to 'perform' in public (Milan, Italy, has a successful program of this kind).
Do community activities (e.g. fairs, social clubs, sporting events) encourage a mix of the young and old, boys and gins?
Above all, what is needed is a recognition that families, parents and other carers cannot do it all alone. While the terms 'family support' and 'prevention' still·sit at the 'problem' end of policy, they nevertheless point to a more cost-effective way to improve family and community life than the crisis-oriented' ambulance at the bottom of the cliff'.
A developmental, strengthening, surrounding and supportive approach to the diverse structures and needs of Australian family life will require some new and imaginative thinking.
The whole community and its resources need to be harnessed and linked in the cause of creating the conditions in which families can:
define and redefine their own values and roles
- live decently and harmoniously
- avoid conflict, disruption and instability
both earn a living and fulfil their caring responsibilities without undue stress
- nurture children into responsible and productive citizenship.
With 1994 designated International Year of the Family, that is the challenge of the 1990s.
54
I I I I I I • I J I I I t I 1 I • I J I I I
To conclude
Families are valued and valuable.
Families are very diverse, not uniform.
Family policies are not just 'women's issues' but matters for men, children, youth, the elderly, the workplace, schools, every community group.
Family wellbeing results not just from internal family relationships but from a supportive partnership between governments, employers, community groups and families themselves.
55
, "
I I I I I • I J I I I I I 1 I • I
I I I I 1
REFERENCES
Adie, J.A. and Carmody, H.!. (1991), Families at work: practical examples from 140 businesses, Melbourne, Council for Equal Opportunity in Employment
Amato, P. (1987), Children in Australian families: the growth of competence, Prentice-Hall
Burdekin, B. (1989), Homeless Children, Report of the National Inquiry into Homeless Children, Human Rights & Equal Opportunity Commission, Canberra, AGPS
d' Abbs, P. (1991), Who Helps? Support Networks and Social Policy in Australia, Monograph No.12, Australian Institute of Family Studies
Edgar, D.E. (1980), Introduction to Australian society: a sociological perspective, Prentice-Hall
Edgar, D. (1985), 'Getting the family act together: Children, competence and family process', Australian Journal of Educational Research, November
Edgar, D. (1987), 'The Family in Between - The Hidden Factor in Employer/Employee Relationships', paper for Business Council of Australia Journal, Vo1.30, January
Glezer, H. (1988) 'Mothers in the workforce', Family Matters No.21, AIFS, August 1988. p.34
Hardwick, J. and A. Graycar (1982), Volunteers in non-government welfare organisations in Australia, SWRC Report No.25
Hartley, R. (1987), 'Ethnic Family Decision Making and Youth Destination', Family Matters No.19, Australian Institute of Family Studies, August 1987
and
Hartley, R. & F. Maas (1987), Ethnic family decision-making for youth postschool destinations, MACMME and the Australian Institute of Family Studies, Melbourne .
Jackson, B. (1984), Fatherhood, London, George Alien & Unwin
McDonald, P. (1985), The economic consequences of marriage breakdown in Australia; A summary, Institute of Family Studies, Melbourne
McDonald, P. (1990), 'Bird's-eye view of Australia's Children', Family Matters No.27, November
McNicholl, G. (1990), Are Australian Families Like Others? Working Papers in Demography No.17, Research School of Social Sciences, ANU
56
I I I I 1 I • I J I I I t I , I • I , I t I 1
t.
National Population Council (1991), Population Issues and Australia's Future, Environment, Economy and Society, AGPS
NSW Carrick Report (1991), From Excellence to Equity, Board of Studies, S~n~ .
Ochiltree, G. (1990), Children in Stepfamilies, Sydney, Prentice-Hall
Wolcott, I. & Glezer, H. (1989), Marriage Counselling in Australia : An Evaluation, Monograph No. 8, Australia., Institute of Family Studies, Melbourne
Wolcott, I. (1991), Work and Family: Employers' Views, Australian Institute of Family Studies, Monograph No.11
Wolcott, I. (1993), A Matter of Give and Take: Small Business Views of Work and Family, Australian Institute of Family Studies, Melbourne