UNAUDITED CONDENSED INTERIM CONSOLIDATED FINANCIAL INFORMATION FOR THE QUARTER ENDED SEPTEMBER 30, 2017 The condensed interim consolidated financial information has been prepared on the basis of the recognition and measurement requirements of International Financial Reporting Standards (IFRS) as adopted by the European Union (EU) and implemented in the UK and IFRS as issued by the IASB. The accounting policies, methods of computation and presentation used in the preparation of the interim financial information are the same as those used in the Company's audited financial statements for the period ended December 31, 2016, which this interim consolidated financial information should be read in conjunction with. The financial information has been prepared in accordance with International Accounting Standard 34 - Interim Financial Reporting. The financial information in this statement does not constitute full statutory accounts within the meaning of Section 434 of the Companies Act 2006. The financial information for the three and nine months ended September 30, 2017 and September 30, 2016 is unaudited, and has not been reviewed by the auditors. The financial information for the period ended December 31, 2016 has been derived from the Company's audited financial statements for the period as filed with the Registrar of Companies. It does not constitute the financial statements for that period. The auditor's report on the statutory financial statements for the period ended December 31, 2016 was unqualified and did not contain any statement under sections 498 (2) or (3) of the Companies Act 2006. 1
Transcript
UNAUDITED CONDENSED INTERIM CONSOLIDATED FINANCIAL INFORMATION
FOR THE QUARTER ENDED SEPTEMBER 30, 2017 The condensed interim consolidated financial information has been prepared on the basis of the recognition and measurement requirements of International Financial Reporting Standards (IFRS) as adopted by the European Union (EU) and implemented in the UK and IFRS as issued by the IASB. The accounting policies, methods of computation and presentation used in the preparation of the interim financial information are the same as those used in the Company's audited financial statements for the period ended December 31, 2016, which this interim consolidated financial information should be read in conjunction with. The financial information has been prepared in accordance with International Accounting Standard 34 - Interim Financial Reporting. The financial information in this statement does not constitute full statutory accounts within the meaning of Section 434 of the Companies Act 2006. The financial information for the three and nine months ended September 30, 2017 and September 30, 2016 is unaudited, and has not been reviewed by the auditors. The financial information for the period ended December 31, 2016 has been derived from the Company's audited financial statements for the period as filed with the Registrar of Companies. It does not constitute the financial statements for that period. The auditor's report on the statutory financial statements for the period ended December 31, 2016 was unqualified and did not contain any statement under sections 498 (2) or (3) of the Companies Act 2006.
1
RAMBLER METALS AND MINING PLC UNAUDITED CONDENSED INTERIM CONSOLIDATED INCOME STATEMENTS For the Three and Nine Months Ended September 30, 2017 (EXPRESSED IN US DOLLARS)
Quarter ended September 30
2017
Quarter ended September 30
2016
Nine months ended
September 30 2017
Nine months ended
September 30 2016
US$’000 US$’000 US$’000 US$’000
Revenue 7,280 6,686 19,944 22,625 Production costs (6,728) (5,486) (19,386) (16,120) Depreciation and amortisation (2,342) (1,842) (6,483) (5,503) Gross (loss)/profit (1,790) (642) (5,925) 1,002 Administrative expenses (730) (709) (2,431) (2,376) Impairment charge - (11,268) - (11,268) Exploration expenses - - (5) (17) Operating loss (2,520) (12,619) (8,361) (12,659) Bank interest receivable 11 4 34 6 Gain on disposal of available for sale investments - 451 779 451 Gain on derivative financial instruments 819 414 964 289 Finance expense (675) (2,468) (1,187) (3,749) Foreign exchange differences 460 (322) 1,011 661 Net financing income/(expense) 615 (1,921) 1,601 (2,342) Loss before tax (1,905) (14,540) (6,760) (15,001) Income tax credit 552 3,746 1,926 3,894 Loss for the period and attributable to owners of the parent
(1,353)
(10,794)
(4,834)
(11,107)
Earnings per share
Quarter ended September 30
2017
Quarter ended September 30
2016
Nine months ended
September 30 2017
Nine months ended
September 30 2016
US$ US$ US$ US$
Basic and diluted earnings per share (0.003) (0.026) (0.009) (0.028)
2
RAMBLER METALS AND MINING PLC UNAUDITED CONSOLIDATED STATEMENTS OF COMPREHENSIVE INCOME For the Three and Nine Months Ended September 30, 2017 (EXPRESSED IN US DOLLARS) Quarter ended
September 30 2017
Quarter ended September 30
2016
Nine months ended
September 30 2017
Nine months ended
September 30 2016
US$’000 US$’000 US$’000 US$’000 Loss for the period (1,353) (10,794) (4,834) (11,107) Other comprehensive income/(loss) Items that may be reclassified into profit or loss Exchange differences on translation of foreign operations (net of tax)
2,538
274
4,503
(1,927)
Disposal of available for sale investments (net of tax) - (383) (232) (383) Gain on available for sale investment (net of tax) 23 1,160 (81) (795) Other comprehensive income/(loss) for the period 2,561 1,051 4,190 (3,105) Total comprehensive income/(loss) for the period 1,208 (9,743) (644) (14,212)
3
RAMBLER METALS AND MINING PLC UNAUDITED CONSOLIDATED BALANCE SHEETS As at September 30, 2017 (EXPRESSED IN US DOLLARS)
Note Unaudited Audited September 30
2017 December 31
2016 US$’000 US$’000 Assets Intangible assets 3 3,145 2,169 Mineral properties 4 38,148 34,453 Property, plant and equipment 5 27,497 23,056 Available for sale investments 6 692 1,333 Deferred tax 14,534 11,545 Restricted cash 11 3,554 3,243 Total non-current assets 87,570 75,799 Inventory 7 2,291 2,496 Trade and other receivables 766 1,284 Derivative financial asset 8 244 756 Cash and cash equivalents 1,323 2,156 Total current assets 4,624 6,692 Total assets 92,194 82,491 Equity Issued capital 9 8,055 6,374 Share premium 9 89,287 81,442 Share warrants reserve 859 2,089 Merger reserve 180 180 Translation reserve (14,246) (18,749) Fair value reserve 163 476 Retained profits (20,203) (15,443) Total equity 64,095 56,369 Liabilities Loans and borrowings 10 15,892 14,412 Provision 11 1,991 1,804 Total non-current liabilities 17,883 16,216 Loans and borrowings 10 3,914 4,814 Trade and other payables 6,302 5,092 Total current liabilities 10,216 9,906 Total liabilities 28,099 26,122 Total equity and liabilities 92,194 82,491
4
RAMBLER METALS AND MINING PLC CONSOLIDATED STATEMENTS OF CHANGES IN EQUITY (EXPRESSED IN US DOLLARS) Share
capital Share premium Warrants
Reserve Merger reserve
Translation reserve
Fair value reserve
Accumulated Losses
Total
Audited US$’000 US$’000 US$’000 US$’000 US$’000 US$’000 US$’000 US$’000 Balance at August 1, 2016 6,374 81,455 2,089 180 (16,756) 1,075 (12,731) 61,686 Comprehensive income Loss for the year - - - - - - (2,745) (2,745) Foreign exchange translation differences - - - - (1,993) - - (1,993) Disposal of available for sale investment (net of tax) - - - - - (383) - (383) Gain on available for sale investments (net of tax) - - - - - (216) - (216) Total other comprehensive loss - - - - (1,993) (599) - (2,592) Total comprehensive loss for the period - - - - (1,993) (599) (2,745) (5,337) Transactions with owners Share issue expenses - (13) - - - - - (13) Share-based payments - - - - - - 33 33 Transactions with owners - (13) - - - - 33 20 Balance at December 31, 2016 6,374 81,442 2,089 180 (18,749) 476 (15,443) 56,369 Unaudited Balance at January 1, 2017 6,374 81,442 2,089 180 (18,749) 476 (15,443) 56,369 Comprehensive income Loss for the period - - - - - - (4,834) (4,834) Foreign exchange translation differences - - - - 4,503 - - 4,503 Disposal of available for sale investment (net of tax) - - - - - (232) - (232) Gain on available for sale investments (net of tax) - - - - - (81) - (81) Other comprehensive income/(loss) - - - - 4,503 (313) - 4,190 Total comprehensive income/(loss) for the period - - - - 4,503 (313) (4,834) (644) Issue of share capital 1,681 7,957 (1,230) - - - - 8,408 Share issue expenses - (112) - - - - - (112) Share-based payments - - - - - - 74 74 Transactions with owners 1,681 7,845 (1,230) - - - 74 8,370 Balance at September 30, 2017 8,055 89,287 859 180 (14,246) 163 (20,203) 64,095
5
RAMBLER METALS AND MINING PLC UNAUDITED STATEMENTS OF CASH FLOWS For the Three and Nine Months Ended September 30, 2017 (EXPRESSED IN US DOLLARS)
Quarter ended September 30
2017
Quarter ended September 30
2016
Nine months ended
September 30 2017
Nine months ended
September 30 2016
US$’000 US$’000 US$’000 US$’000 Cash flows from operating activities Operating loss (2,520) (12,619) (8,361) (12,659) Depreciation and amortisation 2,349 13,140 6,503 16,832 Share based payments 26 11 75 23 Foreign exchange difference (137) (481) (283) (582) Decrease/(increase) in inventory 429 (524) 205 (891) (Increase)/decrease in debtors 383 (270) 518 135 (Increase)/decrease in derivative financial instruments 1,687 (726) 1,476 (309) Increase/(decrease) in creditors 123 (344) 803 (506) Cash (utilised in)/generated from operations 2,340 (1,813) 936 2,043 Interest paid (101) (83) (302) (200) Net cash (utilised in)/generated from operating activities
2,239
(1,896)
634
1,843
Cash flows from investing activities Interest received 11 4 34 15 Disposal of available for sale investments - 783 1,103 783 Acquisition of evaluation and exploration assets (509) (3) (762) (198) Acquisition of mineral properties – net (1,792) (686) (4,244) (2,753) Acquisition of property, plant and equipment (994) (475) (2,721) (1,631) Net cash utilised in investing activities (3,284) (377) (6,590) (3,784) Cash flows from financing activities Share issue proceeds - - 8,408 15,106 Share issue expenses 12 46 (112) (850) Acquisition of subsidiary (net of cash) - - - (49) Receipt of government contributions (note 10) - - 334 - Restricted cash - (844) - (844) Repayment of Gold loan (note 10) (290) (908) (436) (2,064) Repayment of advanced purchase facility (note 10) - (541) (1,136) (1,541) Capital element of finance lease payments (450) (560) (1,964) (1,883) Net cash from/(utilised) in financing activities (728) (2,807) 5,094 7,875 Net increase/(decrease) in cash and cash equivalents (1,773) (5,080) (862) 5,934 Cash and cash equivalents at beginning of period 3,098 10,870 2,156 1,166 Effect of exchange rate fluctuations on cash held (2) (5) 29 (1,315) Cash and cash equivalents at end of period 1,323 5,785 1,323 5,785
6
RAMBLER METALS AND MINING PLC UNAUDITED NOTES TO THE FINANCIAL STATEMENTS 1 Nature of operations and going concern
The principal activity of the Company is the operation, development and exploration of the Ming Copper-Gold Mine (“Ming Mine”) located in Baie Verte, Newfoundland and Labrador, Canada. The Company’s business activities, together with the factors likely to affect its future development, performance and position, its financial position, cash flows, liquidity position and borrowing facilities are set out in the Management Discussion and Analysis. In addition, notes 21 and 26 to the consolidated financial statements for the five months ended December 31, 2016 include the Company’s objectives, policies and processes for managing its capital; its financial risk management objectives; details of its financial instruments and hedging activities; and its exposures to credit risk and liquidity risk. Historically the Company has been successful in accessing the equity and debt markets to finance the acquisition and initial development of the Ming Mine site. In the future, the Company plans to fund operational requirements through internally generated cash flow, proceeds from the exercise of warrants, debt offerings and, if necessary, additional equity financing.
The Company continually reviews operational results, expenditures and additional financial opportunities in order to ensure adequate liquidity to support its growth strategy while maintaining or increasing production levels at the Ming Mine. However, there is no guarantee that the Company will have access to future capital or the ability to generate positive cash flows.
Based on the above management concludes the Company has adequate resources to continue in operational existence for the foreseeable future. Thus, it continues to adopt the going concern basis of accounting in preparing the financial statements.
2 Statement of compliance
The condensed consolidated interim financial statements (the “Interim Financial Statements”) have been prepared in accordance with International Accounting Standard 34, Interim Financial Reporting (“IAS 34”), and follow the same accounting policies and methods of application as the annual consolidated financial statements of the Company for the five months ended December 31, 2016. These Interim Financial Statements do not contain all disclosures required by International Financial Reporting Standards (“IFRS”) and accordingly should be read in conjunction with the 2016 annual consolidated financial statements and the notes thereto. The Interim Financial Statements were approved by the Audit Committee of the Company on November 15, 2017. These Interim Financial Statements have been prepared under the historical cost convention, except for certain financial instruments, as set out in the accounting policies in note 2 of the 2016 annual consolidated financial statements. The preparation of financial statements in accordance with IAS 34 requires the use of certain critical accounting estimates. It also requires management to exercise its judgment in the process of applying the Company’s accounting policies. The significant judgements made by management in applying the Company’s accounting policies and the key sources of estimation uncertainty were the same as those that applied to the consolidated financial statements for the five months ended December 31, 2016 International Financial Reporting Standards that have recently been issued or amended but are not yet effective have not been adopted for the annual reporting period ended December 31, 2016:
7
RAMBLER METALS AND MINING PLC UNAUDITED NOTES TO THE FINANCIAL STATEMENTS (CONTINUED) 2 Statement of compliance (continued) IFRS /Amendment
Title Nature of change to accounting policy
Application date of standard
Application date for Company
IFRS 9 Financial instruments: Classification and Measurement
No change to accounting policy, therefore, no impact
January 1, 2018 January 1, 2018
IFRS 15 Revenue from contracts with customers
No change to accounting policy, therefore, no impact
January 1, 2018 January 1, 2018
IFRS 16 Leases No change to accounting policy, therefore, no impact
January 1, 2019 January 1, 2019
Management have reviewed the impact of the above Standards and Interpretations and have concluded that they will not result in any material changes to previously reported results. .
3. Intangible assets Exploration and evaluation costs Ming Mine Little Deer Project Total
US$’000 US$’000 US$’000 Cost Balance at 1 August 2016 - 2,233 2,233 Additions - - - Effect of movements in foreign exchange - (64) (64) Balance at 31 December 2016 - 2,169 2,169 Balance at 1 January 2017 - 2,169 2,169 Additions 722 41 763 Effect of movements in foreign exchange 15 198 213 Balance at September 30, 2017 737 2,408 3,145 Carrying amounts At December 31, 2016 - 2,169 2,169 At September 30, 2017 737 2,408 3,145
8
RAMBLER METALS AND MINING PLC UNAUDITED NOTES TO THE FINANCIAL STATEMENTS (CONTINUED) 4. Mineral Property
Mineral property
US$’000 Cost Balance at August 1, 2016 70,058 Additions 1,673 Effect of movements in foreign exchange (2,030) Balance at December 31, 2016 69,701 Balance at January 1, 2017 69,701 Additions 4,225 Effect of movements in foreign exchange 5,570 Balance at September 30, 2017 79,496 Amortisation Balance at August 1, 2016 12,589 Amortisation charge 1,444 Effect of movements in foreign exchange (376) Balance at December 31, 2016 13,657 Balance at January 1, 2017 13,657 Amortisation charge 3,228 Effect of movements in foreign exchange 1,206 Balance at September 30, 2017 18,091 Impairment Balance at August 1, 2016 22,231 Effect of movements in foreign exchange (640) Balance at December 31, 2016 21,591 Balance at January 1, 2017 21,591 Effect of movements in foreign exchange 1,666 Balance at September 30, 2017 23,257 Carrying amounts At December 31, 2016 34,453 At September 30, 2017 38,148
9
RAMBLER METALS AND MINING PLC UNAUDITED NOTES TO THE FINANCIAL STATEMENTS (CONTINUED) 5. Property, plant and equipment
Land and buildings
Assets under construction
Motor
vehicles
Plant and equipment
Fixtures, fittings and equipment
Computer equipment
Total US$’000 US$’000 US$’000 US$’000 US$’000 US$’000 US$’000
Cost Balance at August 1, 2016 4,063 728 228 39,885 96 764 45,764 Additions 10 654 - 1,407 - 26 2,097 Disposals - - - (823) - - (823) Effect of movements in foreign exchange (117) (25) (6) (1,107) (2) (21) (1,278) Balance at December 31, 2016 3,956 1,357 222 39,362 94 769 45,760 Balance at January 1, 2017 3,956 1,357 222 39,362 94 769 45,760 Additions - 1,837 - 3,862 - 48 5,747 Reclassification - (91) - 91 - - - Effect of movements in foreign exchange 306 173 17 3,291 7 61 3,855 Balance at September 30, 2017 4,262 3,276 239 46,606 101 878 55,362 Depreciation and impairment losses Balance at August 1, 2016 2,045 - 217 19,549 90 738 22,639 Depreciation charge for the period 156 - 4 1,302 2 19 1,483 Eliminated on disposals - - - (805) - - (805) Effect of movements in foreign exchange (60) - (6) (523) (3) (21) (613) Balance at December 31, 2016 2,141 - 215 19,523 89 736 22,704 Balance at January 1, 2017 2,141 - 215 19,523 89 736 22,704 Depreciation charge 271 - 7 2,971 3 17 3,269 Effect of movements in foreign exchange 177 - 17 1,634 7 57 1,892 Balance at September 30, 2017 2,589 - 239 24,128 99 810 27,865 Carrying amounts At December 31, 2016 1,815 1,357 7 19,840 5 33 23,056 At September 30, 2017 1,673 3,276 - 22,478 2 68 27,497 Assets under construction are net of US$130,000 representing the benefit of an interest free repayable contribution from a Canadian government agency (see note 10).
10
RAMBLER METALS AND MINING PLC UNAUDITED NOTES TO THE FINANCIAL STATEMENTS (CONTINUED) 6. Available for sale investments
US$’000 Cost or valuation Balance at August 1, 2016 2,402 Disposals (783) Revaluation (245) Effect of movements in foreign exchange (41) Balance at December 31, 2016 1,333 Balance at January 1, 2017 1,333 Disposals (324) Revaluation (313) Effect of movements in foreign exchange (4) Balance at September 30, 2017 692 Carrying amounts At December 31, 2016 1,333 At September 30, 2017 692
7. Inventories September
30 2017 December
31 2016 US$’000 US$’000 Metals in process 264 884 Operating supplies 2,027 1,612 2,291 2,496 8. Derivative financial asset September
30 2017 December
31 2016 US$’000 US$’000 Concentrate receivables from off-taker 244 756
11
RAMBLER METALS AND MINING PLC UNAUDITED NOTES TO THE FINANCIAL STATEMENTS (CONTINUED) 9. Share capital
10. Loans and borrowings This note provides information about the contractual terms of the Company’s loans and borrowings. For more information about the Company’s exposure to interest rate and foreign currency risk, see note 15. September
30 2017 December
31 2016 US$’000 US$’000 Non-current liabilities Finance lease liabilities 2,678 1,371 Gold Loan 12,987 13,041 Government Assistance 227 - 15,892 14,412 Current liabilities Current portion of finance lease liabilities 1,483 1,284 Advance purchase facility - 1,121 Current portion of Gold Loan 2,431 2,409 3,914 4,814 Finance lease liabilities Finance lease liabilities are payable as follows: Minimum
lease Payments
Interest
Principal
Minimum lease
Payments
Interest
Principal September
30 2017 September
30 2017 September
30 2017 December 31 2016
December 31 2016
December 31 2016
US$’000 US$’000 US$’000 US$’000 US$’000 US$’000
Less than one year 1,641 158 1,483 1,354 70 1,284
Between one and five years 2,830 152 2,678 1,430 59 1,371 4,471 310 4,161 2,784 129 2,655 Under the terms of the lease agreements, no contingent rents are payable. The finance lease liabilities are secured on the underlying assets.
Share
capital Share
premium
Number
US$’000 US$’000 ‘000
In issue at August 1, 2016 6,374 81,455 414,290 Issued during the year - (13) - In issue at December 31, 2016 6,374 81,442 414,290 In issue at January 1, 2017 6,374 81,442 414,290 Share issue 1,681 7,956 135,000 Share issue expenses - (111) - In issue at September 30, 2017 8,055 89,287 549,290
12
RAMBLER METALS AND MINING PLC UNAUDITED NOTES TO THE FINANCIAL STATEMENTS (CONTINUED) 10. Interest-bearing loans and borrowings (continued) Gold Loan In March 2010, the Company entered into an agreement (“Gold Loan”) with Sandstorm Resources Ltd. (‘Sandstorm’) to sell a portion of the life-of-mine gold production from its Ming Mine. Under the terms of the agreement Sandstorm made staged upfront cash payments for the gold to the Company totalling US$20 million. For this, in each production year following the first year of production, until 175,000 oz of payable gold has been produced, the Company has agreed to sell to Sandstorm, at market price, a percentage equal to 25% x (85% divided by the actual percentage of metallurgical recovery of gold realized in the immediately preceding production year) provided that, if the payable gold production in any production year after the third production year is less than 15,000 ounces, then in each such production year, Sandstorm payable gold shall not be less than 25% of the payable gold. The percentage of payable gold of 25% falls to 12% after 175,000 oz of payable gold has been produced and remains payable for the remainder of the period ending 40 years after the date of the agreement. After the expiry of the 40 year term, the agreement is renewable in 10 year terms at the option of Sandstorm. At September 30, 2017, the Company has produced 41,218 payable ounces of gold of which 12,709 ounces were transferrable to Sandstorm under the agreement as follows:
The Gold Loan is accounted for as a financial liability carried at amortised cost. In determining the effective interest rate implicit in the cash flows arising from the loan the cash flows are forecast at each quarter end based on management’s best estimates of the time of delivery of payable gold, the total amount of gold expected to be produced over the mine life and the timing of that production. Total interest of US$546,000 (Q2/17: US$109,000 credited, Q3/16: US$1,350,000 charged) was charged during the quarter. The Gold Loan is secured by a fixed and floating charge over the assets of the Company.
13
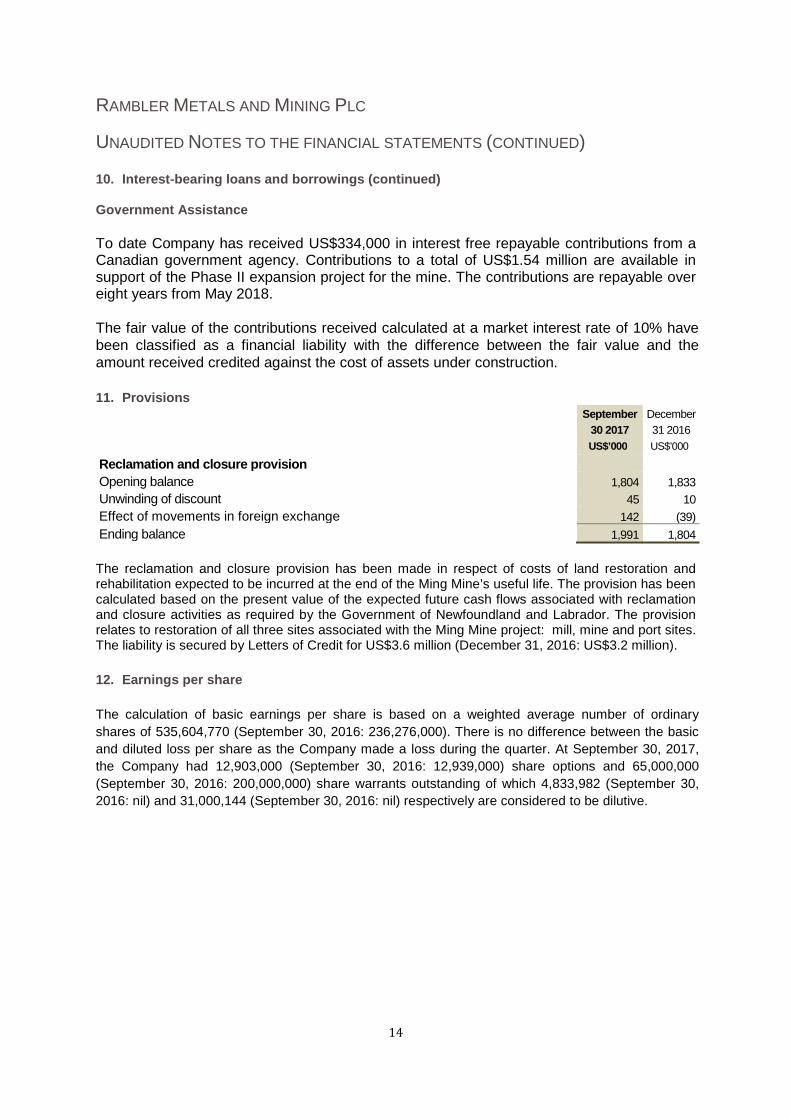
RAMBLER METALS AND MINING PLC UNAUDITED NOTES TO THE FINANCIAL STATEMENTS (CONTINUED) 10. Interest-bearing loans and borrowings (continued) Government Assistance To date Company has received US$334,000 in interest free repayable contributions from a Canadian government agency. Contributions to a total of US$1.54 million are available in support of the Phase II expansion project for the mine. The contributions are repayable over eight years from May 2018. The fair value of the contributions received calculated at a market interest rate of 10% have been classified as a financial liability with the difference between the fair value and the amount received credited against the cost of assets under construction. 11. Provisions September
30 2017 December 31 2016
US$’000 US$’000
Reclamation and closure provision Opening balance 1,804 1,833 Unwinding of discount 45 10 Effect of movements in foreign exchange 142 (39) Ending balance 1,991 1,804 The reclamation and closure provision has been made in respect of costs of land restoration and rehabilitation expected to be incurred at the end of the Ming Mine’s useful life. The provision has been calculated based on the present value of the expected future cash flows associated with reclamation and closure activities as required by the Government of Newfoundland and Labrador. The provision relates to restoration of all three sites associated with the Ming Mine project: mill, mine and port sites. The liability is secured by Letters of Credit for US$3.6 million (December 31, 2016: US$3.2 million). 12. Earnings per share The calculation of basic earnings per share is based on a weighted average number of ordinary shares of 535,604,770 (September 30, 2016: 236,276,000). There is no difference between the basic and diluted loss per share as the Company made a loss during the quarter. At September 30, 2017, the Company had 12,903,000 (September 30, 2016: 12,939,000) share options and 65,000,000 (September 30, 2016: 200,000,000) share warrants outstanding of which 4,833,982 (September 30, 2016: nil) and 31,000,144 (September 30, 2016: nil) respectively are considered to be dilutive.
14
RAMBLER METALS AND MINING PLC UNAUDITED NOTES TO THE FINANCIAL STATEMENTS (CONTINUED) 13. Related parties Transactions with key management personnel Total key management personnel compensations were as follows: Quarter
ended September
30 2017
Quarter ended
September 30 2016
Nine months ended
September 30 2017
Nine months ended
September 30 2016
US$’000 US$’000 US$’000 US$’000
Salaries 132 127 382 367 Share based payments 22 6 42 9 154 133 424 376 14. Share-based payments The number and weighted average exercise prices of share options are as follows: Weighted
average exercise
price
Number of options
Weighted average exercise
price
Number of options
September 30 2017
September 30 2017
December 31 2016
December 31 2016
US$’000 No. 000 US$’000 No. 000 Outstanding at the beginning of the period 0.14 13,014 0.36 5,079 Granted during the period 0.12 230 0.06 9,580 Cancelled during the period (0.12) (341) 0.28 (1,620) Expired during the period - - 0.52 (25) Outstanding at the end of the period 0.15 12,903 0.14 13,014
Exercisable at the end of the period 0.39 3,449 0.38 3,430
The options outstanding at September 30, 2017 have an exercise price in the range of US$0.05 to US$0.85 and a weighted average remaining contractual life of 3.65 years (December 31, 2016: 4.8 years). The fair value of services received in return for share options granted are measured by reference to the fair value of share options granted. The estimate of the fair value of the services received is measured based on the Black-Scholes model. The contractual life of the option (10 years) is used as an input into this model. Expectations of early exercise are incorporated into the Black-Scholes model.
15
RAMBLER METALS AND MINING PLC UNAUDITED NOTES TO THE FINANCIAL STATEMENTS (CONTINUED) 14. Share-based payments (continued) Fair value of share options and assumptions Quarter
ended September
30 2017
Quarter ended
September 30 2016
Nine months ended
September 30 2017
Nine months ended
September 30 2016
US$ US$’000 US$ US$’000
Weighted average fair value per option granted in period - 0.04 0.09 0.04 Share price (weighted average) - 0.06 0.12 0.06 Exercise price (weighted average) - 0.06 0.12 0.06 Expected volatility (expressed as weighted average volatility used in the modelling under Black-Scholes model) - 94.39% 97.33% 94.39% Expected option life (years) - 5 5 5 Expected dividends (%) - 0 0 0 Risk-free interest rate (based on national government bonds) - 0.64% 1.07% 0.64% The expected volatility is based on the historic volatility (calculated based on the weighted average remaining life of the share options), adjusted for any expected changes to future volatility due to publicly available information. There are no performance or market conditions associated with the share option grants. Quarter
ended September
30 2017
Quarter ended
September 30 2016
Nine months ended
September 30 2017
Nine months ended
September 30 2016
US$’000 US$’000 US$’000 US$’000
Total expense recognised as employee costs 26 11 75 23
15. Financial risk management The Company’s principal financial assets comprise: cash and cash equivalents, restricted cash, available for sale investments, derivative financial instruments and trade and other receivables. The Company’s financial liabilities comprise: trade payables; other payables and interest bearing loans and borrowings. All of the Company’s financial liabilities are measured at amortised cost and their financial assets are classified as loans and receivables and measured at amortised cost with the exception of available for sale investments and derivative financial instruments which are measured at fair value.
16
RAMBLER METALS AND MINING PLC UNAUDITED NOTES TO THE FINANCIAL STATEMENTS (CONTINUED) 15. Financial risk management (continued) The Company held the following categories of financial instruments at September 30, 2017: Sept 30,
2017 Dec 31, 2016
US$’000 US$’000 Financial assets Assets at fair value through profit and loss: Derivative financial instruments – level 2 fair value 244 756 Available for sale investments: Investment in quoted equity securities – level 1 fair value 692 1,333 Loans and receivables: Trade receivables - - Other receivables 247 200 Sales taxes recoverable 330 684 Cash at bank 1,323 2,156 Restricted cash 3,554 3,243 5,454 6,283 Total financial assets 6,390 8,372
Liabilities at amortised cost or equivalent: Sept 30,
2017 Dec 31,
2016 US$’000 US$’000 Trade payables (4,401) (3,669) Non trade payables (321) (125) Accrued expenses (1,580) (1,298) Loans and borrowings (19,806) (19,226) Total financial liabilities (26,108) (24,318) The board of directors determines, as required, the degree to which it is appropriate to use financial instruments and hedging techniques to mitigate risks. The main risks for which such instruments may be appropriate are liquidity risk, credit risk and market risk which includes foreign currency risk, interest rate risk and commodity price risk each of which is discussed below. Liquidity risk With finite cash resources the liquidity risk is significant. This risk is managed by controls over expenditure and concentrating on achieving the payment milestones under the financing arrangement. Success will depend largely upon the outcome of on-going and future exploration and development programmes. Given the nature of the Company’s current activities the entity will remain dependent on a mixture of debt and equity funding in the short to medium term until such time as the Company becomes self-financing from the commercial production of mineral resources.
17
RAMBLER METALS AND MINING PLC UNAUDITED NOTES TO THE FINANCIAL STATEMENTS (CONTINUED) 15. Financial risk management (continued) Liquidity risk (continued) The Company’s trade payables, other payables and accrued expenses are generally due between one and three months and the maturity profile of the Company’s other financial liabilities, based on contractual undiscounted payments are due as follows: September
30, 2017 December 31, 2016
US$’000 US$’000 Due within one year 4,214 5,945 Due within one to two years 3,580 2,443 Due within two to three years 3,586 2,893 Due within three to four years 2,927 2,605 Due within four to five years 2,972 2,615 Due after five years 14,423 17,318 31,702 33,819 Fixed rate financial liabilities At the year end the analysis of finance leases which were all due in Canadian Dollars and are at fixed interest rates was as follows:
Fixed rate liabilities September 30, 2017
December 31, 2016
US$’000 US$’000 Due within one year 1,641 1,354 Due within one to two years 1,351 662 Due within two to three years 1,159 574 Due within three to four years 320 194 4,471 2,784
The average fixed interest rate for the finance leases and hire purchase contracts outstanding at September 30, 2017 was 5.4%. Credit risk The Company generally holds the majority of its cash resources in Canadian dollars given that the majority of the Company’s outgoings are denominated in this currency. Given the current climate, the Company has taken a very risk averse approach to management of cash resources and management and Directors monitor events and associated risks on a continuous basis. There is little perceived credit risk in respect of trade and other receivables. The Company’s maximum exposure to credit risk at September 30, 2017 was represented by receivables and cash resources.
18
RAMBLER METALS AND MINING PLC UNAUDITED NOTES TO THE FINANCIAL STATEMENTS (CONTINUED) 15. Financial risk management (continued) Market risk Foreign currency risk The Company has a small amount of cash resources and certain liabilities including the Gold Loan and the advance purchase agreement denominated in US dollars. All other assets and liabilities are denominated in Canadian dollars and GB pounds. Revenue is generated in US dollars while the majority of the expenditure is incurred in Canadian dollars and, to a lesser extent, GB pounds. The Company has a downside exposure to any strengthening of the Canadian Dollar or GB pound as this would increase expenses in US dollar terms. This risk is mitigated by reviewing the holding of cash balances in Canadian Dollars and GB pounds. Any weakening of the Canadian Dollar or GB pound would however result in the reduction of the expenses in US dollar terms. In addition movements in the Canadian dollar and GB pound/US Dollar exchange rates would affect the consolidated balance sheets. The policy in relation to the translation of foreign currency assets and liabilities is set out in note 2(d), 'Accounting Policies Foreign Currency' to the consolidated financial statements for the five months ended December 31, 2016. The Company does not hedge its exposure of foreign investments held in foreign currencies. There is no significant impact on profit or loss from foreign currency movements associated with the Parent company’s assets and liabilities as the foreign currency gains or losses are recorded in the translation reserve. Exchange rate fluctuations may adversely affect the Company’s financial position and results. The following table details the Company’s sensitivity to a 10% strengthening and weakening in the GB pound and Canadian Dollar against the US Dollar. 10% represents management’s assessment of the reasonable possible exposure. Equity September
30, 2017 December 31, 2016
US$’000 US$’000 10% strengthening of GB pound (5) 98 10% weakening of GB pound 4 (89) 10% strengthening of Canadian dollar (251) (107) 10% weakening of Canadian dollar 228 97
19
RAMBLER METALS AND MINING PLC UNAUDITED NOTES TO THE FINANCIAL STATEMENTS (CONTINUED) 15. Financial risk management (continued) Market risk (continued) Foreign currency risk (continued) At the period end the cash and short term floating rate deposits were as follows: At September 30, 2017
US$’000
Canadian $ 37 US $ 1,134 Sterling 152 1,323 At December 31, 2016
US$’000
Canadian $ 948 US $ 37 Sterling 1,171 2,156
Interest rate risk The Company's policy is to retain its surplus funds on the most advantageous term of deposit available up to twelve month's maximum duration. Details of the Company’s borrowings are described in note 10. If the interest rate on deposits were to fluctuate by 1% there would be no material effect on the Company’s reported results. Commodity price risk Commodity price risk is the risk that the Company’s future earnings will be adversely impacted by changes in the market prices of commodities. The Company is exposed to commodity price risk as its future revenues will be derived based on contracts with customers at prices that will be determined by reference to market prices of copper and gold at the delivery date. The Company calculates the effective interest rate on the Gold Loan based on estimates of future cash flows arising from the sale of payable gold. In estimating the cash flows the following table details the Company’s sensitivity to a 10% increase and a 25% decrease in the price of gold. These percentages represent management’s assessment of the reasonable possible exposure. Gross assets September
30, 2017 December 31, 2016
US$’000 US$’000 10% increase in the price of gold (1,542) (1,368) 25% decrease in the price of gold 3,855 3,397
20
RAMBLER METALS AND MINING PLC UNAUDITED NOTES TO THE FINANCIAL STATEMENTS (CONTINUED) 15. Financial risk management (continued) Commodity price risk (continued) Receivables in respect of the sale of copper concentrate which contain an embedded derivative linking them to future commodity prices are measured at fair value through profit and loss and are treated as derivative financial assets or liabilities. In estimating the value of the derivative the following table details the Company’s sensitivity to a 5% increase and a 5% decrease in the price of copper and gold. These percentages represent management’s assessment of the reasonable possible exposure. Gross assets September
30, 2017 December
31, 2016 US$’000 US$’000 5% increase in the price of copper and gold 150 603 5% decrease in the price of copper and gold (150) (603) Financial assets The floating rate financial assets comprise interest earning bank deposits at rates set by reference to the prevailing LIBOR or equivalent to the relevant country. Fixed rate financial assets are cash held on fixed term deposit. Fair values In the directors’ opinion there is no material difference between the carrying value and fair value of any of the Company’s financial instruments. 16. Subsequent events On October 19, 2017 the Company announced that it had entered into a loan agreement with CE Mining II Rambler Limited. The loan is for US$1 million, is unsecured, carries interest at a fixed rate of 9.5% and is repayable 12 months from the date of drawdown.