63
Severn Thames Transfer - Longdon Marsh Reservoir Report on Flood Pumping and Storage Version 3 July 2012

Severn Thames Transfer -Longdon Marsh Reservoir Report on Flood Pumping and Storage
Version 3 July 2012

Prepared by Jacobs UK Ltd

Thames Water Longdon Marsh Reservoir Company Confidential Report on Flood Pumping and Storage
F1-Rp Longdon Marsh - Report on Flood Pumping and Storage v3_July 2012.doc
DISCLAIMER This report is based on the findings of TWUL's preliminary and ongoing investigation. The report is based on the most accurate information available to TWUL as at the date of publication. The report is subject to change if and when new information becomes available to TWUL.

Thames Water Longdon Marsh Reservoir Company Confidential Report on Flood Pumping and Storage
F1-Rp Longdon Marsh - Report on Flood Pumping and Storage v3_July 2012.doc

Thames Water Longdon Marsh Reservoir Company Confidential Report on Flood Pumping and Storage
F1-Rp Longdon Marsh - Report on Flood Pumping and Storage v3_July 2012.doc
Document control sheet BPP 04 F8
Client: Thames Water Project: Longdon Marsh Flood
Pumping Project No: B02034K1
Document title : Longdon Marsh Reservoir – Report on Flood Pumping and Storage
Originated by Checked by Reviewed by Approved by
NAME NAME NAME NAME ORIGINAL v0.1 DATE
3 October 2011
A. Courtnadge
Nigel Widgery
A. Courtnadge
Nigel Widgery L. Attewill A. Courtnadge
Status Draft for comment
NAME NAME NAME NAME REVISION v1
DATE
January 2012 Nigel Widgery L. Attewill L. Attewill J. Ruddick
Status Revised draft for issue to client
NAME NAME NAME NAME REVISION v2
DATE
May 2012 Nigel Widgery A. Courtnadge L. Attewill J. Ruddick
Status Revised for issue to client
NAME NAME NAME NAME REVISION v3 Nigel Widgery A. Courtnadge L. Attewill J. Ruddick
DATE SIGNATURE SIGNATURE SIGNATURE SIGNATURE July 2012
Status Final
Jacobs Engineering U.K. Limited This document has been prepared by a division, subsidiary or affiliate of Jacobs Engineering U.K. Limited (“Jacobs”) in its professional capacity as consultants in accordance with the terms and conditions of Jacobs’ contract with the commissioning party (the “Client”). Regard should be had to those terms and conditions when considering and/or placing any reliance on this document. No part of this document may be copied or reproduced by any means without prior written permission from Jacobs. If you have received this document in error, please destroy all copies in your possession or control and notify Jacobs. Any advice, opinions, or recommendations within this document (a) should be read and relied upon only in the context of the document as a whole; (b) do not, in any way, purport to include any manner of legal advice or opinion; (c) are based upon the information made available to Jacobs at the date of this document and on current UK standards, codes, technology and construction practices as at the date of this document. It should be noted and it is expressly stated that no independent verification of any of the documents or information supplied to Jacobs has been made. No liability is accepted by Jacobs for any use of this document, other than for the purposes for which it was originally prepared and provided. Following final delivery of this document to the Client, Jacobs will have no further obligations or duty to advise the Client on any matters, including development affecting the information or advice provided in this document. This document has been prepared for the exclusive use of the Client and unless otherwise agreed in writing by Jacobs, no other party may use, make use of or rely on the contents of this document. Should the Client wish to release this document to a third party, Jacobs may, at its discretion, agree to such release provided that (a) Jacobs’ written agreement is obtained prior to such release; and (b) by release of the document to the third party, that third party does not acquire any rights, contractual or otherwise, whatsoever against Jacobs and Jacobs, accordingly, assume no duties, liabilities or obligations to that third party; and (c) Jacobs accepts no responsibility for any loss or damage incurred by the Client or for any conflict of Jacobs’ interests arising out of the Client's release of this document to the third party

Thames Water Longdon Marsh Reservoir Company Confidential Report on Flood Pumping and Storage
F1-Rp Longdon Marsh - Report on Flood Pumping and Storage v3_July 2012.doc

Thames Water Longdon Marsh Reservoir Company Confidential Report on Flood Pumping and Storage
F1-Rp Longdon Marsh - Report on Flood Pumping and Storage v3_July 2012.doc i
Contents
Note: References are indicated by eg Ref. 1 within the text and grouped together in Section 11.
Executive Summary v
1 Introduction 1
1.1 Background 1
1.2 GARD proposals 2
2 Precedent flood pumping schemes 3
2.1 Introduction 3
2.2 St Germans pumping station on the River Ouse, East Anglia 3
2.3 Abberton Reservoir, Essex and Suffolk Water 3
2.4 Conclusion 3
3 Technical feasibility assessment 4
3.1 Reservoir size and shape 4 3.1.1 Options for reservoir deployable output 4 3.1.2 Live storage volume 4 3.1.3 Simulation modelling 5 3.1.4 Reservoir footprint/depth options 5 3.1.5 Water quality considerations 7
3.2 Flood storage volume required 8
3.3 Location of pumping stations 9
3.4 Flood pumping capacity required 10 3.4.1 Previous proposals 10 3.4.2 Approach now adopted 10 3.4.3 Basis for design flood peak and rate of rise 12 3.4.4 Summary of flood pumping capacity required 13
3.5 Operational rules 14
3.6 Discharge provision for emergency drawdown 14
3.7 Flood storage drawdown and operation during sequential flood events 15
4 Outline design for basis of cost estimate 16
4.1 Embankment design 16 4.1.1 Borrow areas 16 4.1.2 Embankment section 16 4.1.3 Freeboard 17

Thames Water Longdon Marsh Reservoir Company Confidential Report on Flood Pumping and Storage
F1-Rp Longdon Marsh - Report on Flood Pumping and Storage v3_July 2012.doc ii
4.2 River intake/outfall and transfer tunnel 17
4.3 Watercourse diversion and drainage tunnel 18
4.4 Pumping stations 18 4.4.1 General 18 4.4.2 Civil works 18 4.4.3 Mechanical and electrical equipment 19
4.5 Water quality 21
5 Maintenance and operation 22
5.1 General 22
5.2 Operating staff 22
5.3 Maintenance costs and procedures 22
6 Cost estimate 23
6.1 Principal statistics 23
6.2 Capital cost 24 6.2.1 Construction cost 24 6.2.2 Specific risks 26 6.2.3 Total capital cost 26
6.3 Operating, maintenance and replacement costs 27 6.3.1 Energy costs 27 6.3.2 Operations, maintenance and replacement costs 28 6.3.3 Present Value OPEX 28
6.4 Cost summary 28
7 Environmental and social impacts 30
7.1 Introduction 30
7.2 Factors affecting reassessment of sustainability measures 30 7.2.1 Nature conservation and biodiversity 30 7.2.2 Landscape sensitivity 30 7.2.3 Visual sensitivity 30 7.2.4 Floodplain encroachment 30 7.2.5 Birdstrike risk 30 7.2.6 Availability of construction materials on site 30 7.2.7 Variation in topographic levels 31 7.2.8 Archaeology and the historic environment 31 7.2.9 Impact of construction on local residents 31 7.2.10 Impact of construction traffic on local roads 31 7.2.11 Impact on existing residential properties 31 7.2.12 Impact on existing recreation uses 31 7.2.13 People benefiting from provision of a potential recreational resource 31
8 Potential benefits for flood alleviation at Tewkesbury 32

Thames Water Longdon Marsh Reservoir Company Confidential Report on Flood Pumping and Storage
F1-Rp Longdon Marsh - Report on Flood Pumping and Storage v3_July 2012.doc iii
9 Risk review 35
9.1 Flood pumping risk 35 9.1.1 Reliability of equipment 35 9.1.2 Operational rules and flood forecasting 35 9.1.3 Adapting to climate change 35 9.1.4 Performance during floods exceeding design flows and rates of rise 37 9.1.5 Temporary flood mitigation during reservoir construction 38 9.1.6 Risk allowance for flood pumping and storage capacity 38
9.2 Geological risk 38 9.2.1 Level of geotechnical investigation 38 9.2.2 Embankment stability 38 9.2.3 Borrow areas 39 9.2.4 Reservoir seepage 39
9.3 Water quality risk 39
9.4 Landscape and visual impact 40
10 Comparison and conclusions 41
10.1 Flood pumping versus floodplain compensation 41
10.2 Reservoir layout option 41
10.3 Flood pumping capacity 42
11 References 43
Appendix A – Cost Estimates
Thames Water Longdon Marsh Reservoir Company Confidential Report on Flood Pumping and Storage
F1-Rp Longdon Marsh - Report on Flood Pumping and Storage v3_July 2012.doc iv
List of Figures Page
Figure 3.1 Longdon Marsh Reservoir – Storage - Inflow Relationship
5
Figure 3.2 Model run for Option B with live storage of 39M.m3 and inflow rate of 900Ml/d
6
Figure 3.3 Reservoir Layout - Flood Pumping Option 1
Figure 3.4 Reservoir Layout - Flood Pumping Option 2
following page 6
Figure 3.5 Historic flood level hydrographs at Saxons Lode gauging station
11
Figure 3.6 Variation of rate of water level rise at Saxons Lode gauging station
11
Figure 3.7 Pumping capacity required to mimic rate of rise in lost floodplain
12
Figure 8.1 Inferred flow hydrographs at Saxons Lode 32
Figure 9.1 Estimate of frequency of flooding from Severn 37
List of Tables Table 3-1 Summary of Longdon Marsh reservoir options 7
Table 3-2 Comparison of reservoir geometry 8
Table 3-3 Floodplain storage lost due to construction of the reservoir
9
Table 3-4 Flood pumping capacity required 13
Table 4-1 Tunnel sizing 17
Table 6-1 Principal statistics 23
Table 6-2 Summary of cost estimates 25
Table 6-3 Cost allowances for specific risks 26
Table 6-4 Summary of total capital costs 27
Table 6-5 Average annual energy consumption 27
Table 6-6 Cost summary 29
Table 8-1 Indicative potential reductions in flood peaks in historic flood events at Bushley Brook confluence
33
Table 9-1 River flow change factors for adaptation to climate change
36
Table 9-2 Compensation storage requirements under climate change scenarios
36
Table 9-3 Temporary flood mitigation during reservoir construction
38

Thames Water Longdon Marsh Reservoir Company Confidential Report on Flood Pumping and Storage
F1-Rp Longdon Marsh - Report on Flood Pumping and Storage v3_July 2012.doc v
Executive Summary
This report examines the feasibility of an engineered solution to the issue of compensation for the loss of natural floodplain which would occur if a reservoir was constructed at Longdon Marsh. Flood storage capacity would be created within the reservoir and high capacity pumps used to lift the flood water into the reservoir. This study examines reservoir options at Longdon Marsh which would provide a nominal deployable output of 208 Ml/d from the Severn Thames Transfer plus a 20Ml/d direct supply to the SWOX supply region. It also considers the possibility of a revised reservoir layout with a smaller footprint, which reduces the floodplain impact while maintaining maximum depth for water quality reasons. A summary of the reservoir options considered is presented in Table 1 together with a comparison with Option B from the 2010 study.
Table 1 Summary of Longdon Marsh reservoir options
Storage Capacity (M.m3) Option
Dam Crest Level
(mAOD) Dead Live Flood Total
Max pumping
rate (Ml/d)
Capital Cost
Estimate (£M)
B Full size as proposed in 2010 study
28 26 99 nil 125 350 not
compar- able
B0 With level for level floodplain compensation
24 26 63 nil 89 350 684
1A 3500 575 1B
Large footprint flood pumping 22 25.8 37.5 6.9 70.2
1200 560 2A 1900 550 2B
Small footprint flood pumping 28 11.1 38.7 3.6 53.4
900 541 Notes: 1. As presented in the 2010 study, Option B has “spare” capacity of 40 M.m3 which, with
additional pumping capacity, could be used to provide additional direct supply. 2. Bottom operating level for all options is 16 mAOD (~5m depth over reservoir floor). 3. Alternative maximum pumping rates considered for flood pumping options.
Flood pumping versus floodplain compensation
This study has shown that it is technically feasible to mitigate the loss of natural floodplain caused by development of Longdon Marsh reservoir by creating additional flood storage capacity within the reservoir and using high capacity pumps to lift flood water into it. It is understood based on their Option Note dated May 2010 (Ref. 4) that the Environment Agency would be prepared to accept such an engineered scheme and, if this is the case, then it is concluded that a flood pumping scheme is likely to be a lower cost means of mitigation than level for level floodplain compensation along the banks of Bushley Brook and the River Severn as previously investigated. Two reservoir layout options for the flood pumping scheme have been considered. Allowing for risk items and some £6million as the present value for the incremental flood

Thames Water Longdon Marsh Reservoir Company Confidential Report on Flood Pumping and Storage
F1-Rp Longdon Marsh - Report on Flood Pumping and Storage v3_July 2012.doc vi
pumping operating costs, the total costs of these options are estimated to be between £102 and £137million (14 to 19%) less than the revised estimate for the modified floodplain compensation scheme (Option B0). However, there are greater risks associated with the flood pumping scheme compared to floodplain compensation which, once constructed, is guaranteed to work in any situation. These include reliability of flood pumping equipment, the flexibility to adapt for climate change, the performance during floods exceeding the design event and the temporary case during construction. However appropriate control measures and risk items have been included in the cost estimates and it is concluded that the residual risks do not affect the overall conclusion that flood pumping is a more cost-effective solution than floodplain compensation. An optimum solution might combine some areas of floodplain compensation, which can be created on Bushley Brook with relatively small scale excavation and disruption close to the reservoir site together with a lower capacity flood pumping scheme. However, this optimisation is beyond the scope of this study and is only warranted if the Longdon Marsh scheme is to be further developed. Reservoir layout option
Of the two reservoir layout options considered in this report, Option 2 (small footprint) is lower by around 4 to 5% in terms of overall cost. It would also be beneficial in terms of water quality, reduced land take and general scheme impact and for these reasons it is considered preferable to Option 1. Also, because Option 2 has less encroachment into the natural floodplain, the risks associated with flood pumping are reduced. However there could be problems with obtaining sufficient engineering fill for Option 2 which would need detailed investigation if this scheme is to be pursued. Neither of the options lend themselves particularly well to future reservoir expansion.
The choice of reservoir layout would need to be reviewed depending on the use of the reservoir. In this study it is assumed that the reservoir would only be used to supply the Thames Region but if it was ever developed it may be more logical to make it a combined resource for Thames Water and other water supply companies, in which case the larger footprint may become more attractive. Water quality issues are an important consideration in the layout design at Longdon Marsh and could potentially affect the viability of the scheme, particularly for Options 1 and B0. If the Longdon Marsh reservoir scheme is to be pursued then it is strongly recommended that a detailed study on water quality is carried out. Meanwhile a specific risk item based on the cost of forming a separate reservoir compartment for the potentially low quality water during flood events has been included for the flood pumping options. Flood pumping capacity
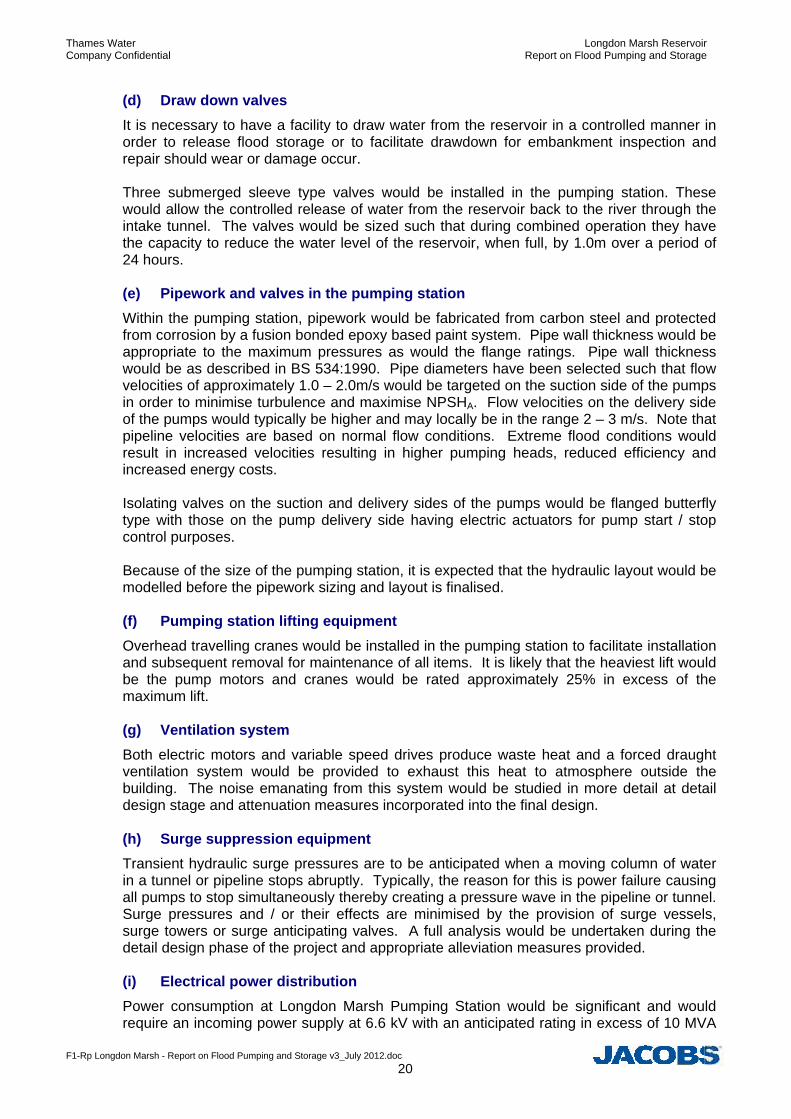
Of the two sub-options considered for Option 2, relating to the rate of flood rise which the flood pumps should be designed for, it is suggested that Option 2A (sized for the extreme rate of flood rise seen in 2007) is preferable given that the cost difference is less than £10million. This is relatively small compared to the overall scheme costs (less than 2%) and would be required to avoid any adverse impact in a repeat of the 2007 flood event.

Thames Water Longdon Marsh Reservoir Company Confidential Report on Flood Pumping and Storage
F1-Rp Longdon Marsh - Report on Flood Pumping and Storage v3_July 2012.doc 1
1 Introduction
1.1 Background
This report assesses the feasibility of an engineered solution to the mitigation of floods that would be significantly exacerbated by the development of a reservoir at Longdon Marsh. In the April 2010 report on the Longdon Marsh Reservoir (Ref. 1), which was based on a 1976 report by Binnie and Partners (Ref. 2), the reservoir was assumed to be formed using the natural depression of Longdon Marsh and by the construction of eight separate embankments which would link natural ridges of higher ground. The 2010 study showed that a 99M.m3 capacity Longdon Marsh reservoir with a pumping capacity of 350Ml/d could supply the same quantity of water to the River Thames and to the SWOX supply region as a 100M.m3 Upper Thames Reservoir (UTR) located at Abingdon, and that additional water resources could also be available by increasing the pumping capacity. This analysis was based on a “hands off” flow constraint equivalent to the 50th percentile flow at the abstraction point below Saxons Lode gauging station on the Severn. However the development of such a reservoir would be problematic in two specific areas: i) water quality considerations and ii) the reduction in natural floodplain storage. It was proposed that the water quality problem could be at least partially mitigated by maximising reservoir water depth, this being judged a critical parameter in the water quality studies carried out for the UTR. However, maximising the reservoir water depth, because of the topography of the natural depression, results in a larger reservoir capacity than is required to match the UTR deployable output. It was also recognised that, in conjunction with an increased pumping capacity, some of this excess reservoir capacity could provide potential surplus resource availability. It was proposed that the loss of natural floodplain be mitigated by the provision of 5M.m3 compensation storage along the banks of Bushley Brook and on the River Severn between the reservoir site and Worcester. Such a scheme, described in the Annex on floodplain compensation dated March 2010 (Ref. 3), would provide level-for-level compensation as normally required by the Environment Agency. However, the 2010 study identified major issues with the feasibility of creating this volume of floodplain compensation in terms of cost, environmental and social impacts and permanent land use. However in both their Briefing Note on the Longdon Marsh Scheme dated 23 September 2009 (Ref. 4) and a subsequent revision as an Option Note dated 13 May 2010 (Ref. 5), the Environment Agency stated that “should a normal flood compensation scheme be unachievable then an engineered solution could be considered…”. This report examines the feasibility of an engineered solution, whereby flood storage would be created within the reservoir and high capacity pumps used to lift the flood water into the reservoir. This study also considers the possibility of a revised reservoir layout with a smaller footprint, which reduces the floodplain impact while maintaining maximum depth for water quality reasons.

Thames Water Longdon Marsh Reservoir Company Confidential Report on Flood Pumping and Storage
F1-Rp Longdon Marsh - Report on Flood Pumping and Storage v3_July 2012.doc 2
1.2 GARD proposals
The feasibility of Longdon Marsh Reservoir as an alternative to the UTR at Abingdon was debated at the 2010 Public Inquiry into Thames Water’s Water Resources Management Plan (WRMP). In their rebuttal document GARD/3.4 (Ref. 6, Appendix R2), the Group Against Reservoir Development [at Abingdon] (GARD) analysed the flooding issues and, recognising that the Longdon Marsh scheme as originally envisaged by Binnie and Partners had significantly more capacity than required to match the UTR deployable output, suggested the following engineered scheme for pumping floodwater into the reservoir:
• Keep the original reservoir footprint but reduce the embankment crest level to around 21 mAOD for water resource purposes to give a deployable output of at least 200Ml/d
• On top of this, provide 5M.m3 additional reservoir capacity for flood storage • Mitigate flooding from upstream tributaries as follows:
o A 3.5m diameter drainage tunnel around the reservoir (or triple 2m box culvert under the reservoir) to bypass base flow of up to about 600Ml/d
o Two upstream pumping stations to lift upstream flood peaks into the reservoir with capacity of about 650Ml/d each
• Mitigate flooding from the River Severn with a 670Ml/d capacity downstream pumping station (although GARD noted an alternative design scenario assuming Longdon Marsh is filled wholly by the Severn flood peak, in which case the pumping capacity would need to be 1400Ml/d).
The analysis and proposals made by GARD have been considered as part of this report. GARD have also made comments on the scope of this study dated May 2011 (Ref. 7), which are also addressed.

Thames Water Longdon Marsh Reservoir Company Confidential Report on Flood Pumping and Storage
F1-Rp Longdon Marsh - Report on Flood Pumping and Storage v3_July 2012.doc 3
2 Precedent flood pumping schemes
2.1 Introduction
Two instances of flood pumping were cited by Mr John Lawson in his Proof of Evidence to the 2010 Public Inquiry in support of GARD’s proposal that flood mitigation can be provided by a pumping scheme as an alternative to the provision of compensating flood storage. 2.2 St Germans pumping station on the River Ouse, East Anglia
St Germans pumping station just south of Kings Lynn in Norfolk pumps water from the Middle Level Main Drain from below sea level into the tidal River Ouse. It serves a catchment area of 700km2. This station offers flood protection to over 20,000 residential properties and agricultural land valued at £3.6 billion, all of which are totally dependent on the timely and reliable operation of the station. This region has for centuries depended on flood pumping and recently the Middle Level Commissioners have replaced the 1934 vintage 6000Ml/d diesel powered pumping station with a new electric powered 8600Ml/d capacity scheme. Six concrete volute pumps were installed and the station was opened in April 2011. The total cost was reported in the press to be £38M. There is no doubt that this pumping station, the largest in the country, has been designed with reliability as the key requirement. The old facility was pushed to its limits in April 1998 when it pumped at full capacity for over 50hrs continuously. If there had been a mechanical failure of one or more pumps then the consequences would have been disastrous. Even so the differences with the proposals for Longdon Marsh are not to be overlooked:
• The St Germans scheme does not provide flood pumping to mitigate the loss of flood storage as a result of building development in a floodplain
• The pumping station operates at relatively low heads on an almost daily basis • At St Germans there was no possible alternative to a pumping station as much of
the land protected is below sea level. 2.3 Abberton Reservoir, Essex and Suffolk Water
The Abberton reservoir, situated close to Colchester in Essex, was constructed in 1936 -39 as a water supply reservoir. The reservoir is formed by a dam across the Layer Brook, which has only a small catchment, and is filled by transfers from the Ely Ouse Scheme and other sources. To meet growing water demand in the area, Essex and Suffolk Water are now increasing the capacity of the scheme by raising the Abberton dam by over 3m to increase the reservoir storage volume by 58%, and by increasing the water transfer capacity. As part of the reservoir raising scheme the upstream (central) section of the reservoir and the inflow from the Layer Brook would no longer drain by gravity to the main section of the reservoir. The Causeway Pumping Station is being constructed to pump all the local inflow from the Layer Brook into the main section of the reservoir, primarily for local land drainage and flood mitigation purposes.
2.4 Conclusion
Neither the St Germans pumping scheme nor the raising of Abberton reservoir can be regarded as precedents to flood pumping at Longdon Marsh, as neither provides flood pumping in mitigation of a loss of flood storage resulting from building development in the floodplain. We are not aware that there are any precedents for this.

Thames Water Longdon Marsh Reservoir Company Confidential Report on Flood Pumping and Storage
F1-Rp Longdon Marsh - Report on Flood Pumping and Storage v3_July 2012.doc 4
3 Technical feasibility assessment
3.1 Reservoir size and shape
3.1.1 Options for reservoir deployable output
Three options for Longdon Marsh Reservoir were considered in the 2010 study:
Option Deployable output from Severn Thames Transfer (Ml/d)
Direct Supply to SWOX Region (Ml/d)
Equivalent UTR scheme (M.m3)
A 280 40 150 B 208 20 100 C 85 20 50
It is unlikely that the choice of pumping versus floodplain compensation would be sensitive to reservoir deployable output for the following reasons:
• At Longdon Marsh, the marginal cost of providing the additional live storage capacity and abstraction rate to achieve a higher deployable output is relatively low compared with the capital cost differential between pumping and floodplain compensation options.
• Factors other than capital cost will influence this choice such as reliability, response to more extreme events than designed for, the flexibility to adapt to climate change and the temporary case during construction. Such factors are essentially independent of the deployable output assumed.
Only Option B is therefore considered in detail in this report, since it was the main focus of the 2010 Public Inquiry. 3.1.2 Live storage volume
It was previously suggested in Section 4.1.3 of the 2010 study that the reservoir footprint should be fixed to use the natural ridge of hills to form the north, east and south sides of the reservoir. This is the same layout as proposed by Binnie & Partners in 1976 (Ref. 2) and is considered the optimum design in terms of earthworks cost and maximising the use of the site. On this basis changes in reservoir volume could only be achieved by varying the depth of water and because water depth is critical to water quality it was previously proposed that a 125M.m3 reservoir, with 99M.m3 live storage, should be adopted for each of the Options A, B and C, i.e. regardless of the deployable output required. However, this line of reasoning has been reviewed as part of this study and the reservoir has been specifically sized for Option B, i.e. to give the minimum live storage volume required to provide a nominal deployable output 208 Ml/d from the Seven Thames Transfer plus a 20Ml/d direct supply to the SWOX supply zone. This has been determined based on the simulation modelling described in Section 3.1.3 below, taking into account the increased inflow pumping capacity possible with the flood pumping scheme. Whilst a larger reservoir may be beneficial for potential surplus resource availability, as recognised in the 2010 study, this has not been considered in this study. The same bottom operating level has been assumed as in the 2010 study, i.e. 16 mAOD which leaves approximately 5m dead storage. This prevents large areas of the reservoir floor being exposed when the reservoir is drawn down.

Thames Water Longdon Marsh Reservoir Company Confidential Report on Flood Pumping and Storage
F1-Rp Longdon Marsh - Report on Flood Pumping and Storage v3_July 2012.doc 5
3.1.3 Simulation modelling
The same model, data, acceptance criteria and dead storage level was used in the simulation modelling as was used for previous modelling and these are fully described in Section 4.2 of the 2010 study report (Ref. 1).
For a range of inflow pumping capacities, the live storage volume was determined to provide the deployable output defined for each of the Option A, B and C schemes (see Section 3.1.1). The modelling results are presented in Figure 3.1 and show how a smaller live storage volume is required with higher inflow pumping capacities. This is because higher pumping rates provide a greater refill volume during the short periods of high river flow. The simulation modelling is based on a flow series for the River Severn derived by Severn Trent Water with a “hands off” flow constraint equivalent to the 50th percentile flow at the abstraction point below Saxons Lode gauging station on the Severn. There is some uncertainty associated with the gauged and modelled flows and we understand that Severn Trent Water are working to improve their modelled flow series. The pumping capacity will be determined by the flood mitigation requirements which in turn depend on the footprint of the reservoir (see Section 3.4 below). However, in general terms, Figure 3.1 shows that the minimum live storage capacity for Option B is between 37 and 39 M.m3 with inflow pumping rates over 900Ml/d. An example model run with 900Ml/d maximum inflow rate is presented in Figure 3.2.
0
10
20
30
40
50
60
70
80
90
100
0 200 400 600 800 1000 1200 1400 1600 1800 2000
Max Inflow Rate (Ml/d)
Live
Sto
rage
Req
uire
d (M
. m3 )
Option A
Option B
Option C
Figure 3.1 Longdon Marsh Reservoir – Storage - Inflow Relationship
3.1.4 Reservoir footprint/depth options
Two reservoir footprint/depth options for flood pumping have been selected to provide a live storage volume of around 37.5-39 M.m3: These options have been compared with a version of the floodplain compensation option (designated Option B0).

Thames Water Longdon Marsh Reservoir Company Confidential Report on Flood Pumping and Storage
F1-Rp Longdon Marsh - Report on Flood Pumping and Storage v3_July 2012.doc 6
Figure 3.2 Model run for Option B with live storage of 39M.m3 and inflow rate of 900Ml/d
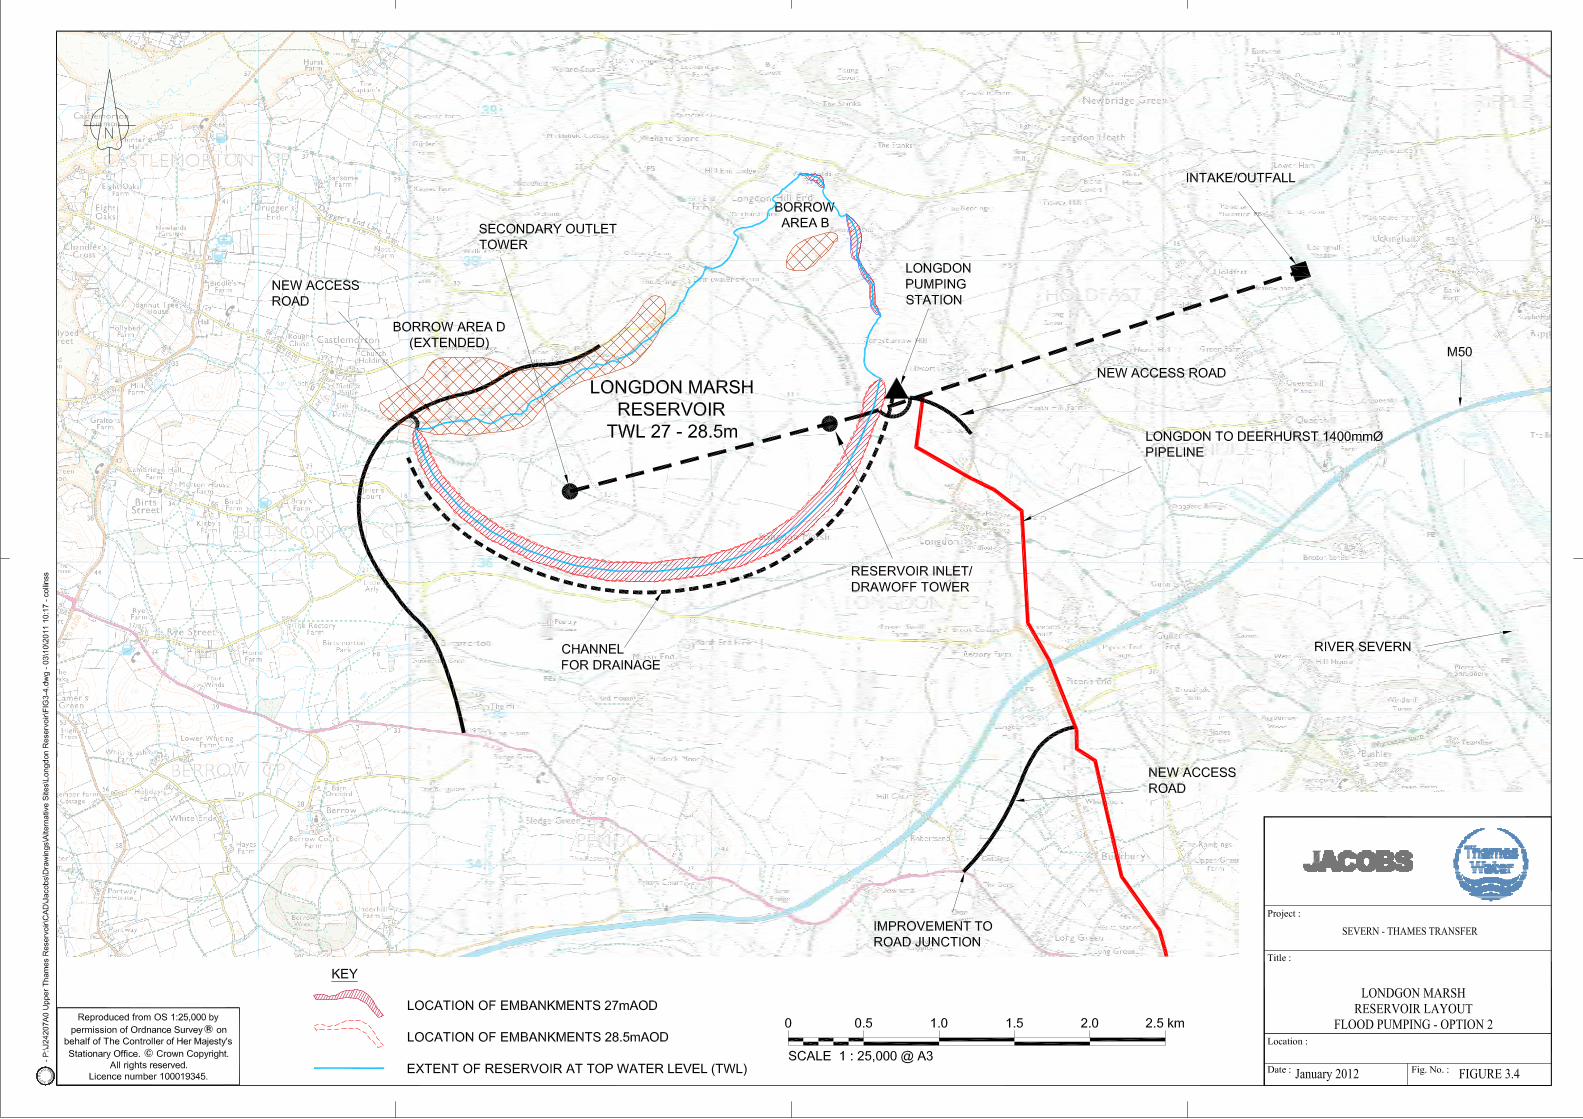
Option 1: The same footprint as previously adopted, using the natural topography, but with a reduced depth of water. In this option the formal top water level would be 21 mAOD based on the height storage curve presented in Figure 4.2 of the 2010 study report (including an allowance of 6.9M.m3 for flood storage capacity to take account of a 1 in 100 + 20% design event – see explanation below). Option 2: The same top water level as previously adopted (27 mAOD), but with a reduced footprint. In this option the footprint would be reduced from 1,000ha to 434ha and the allowance for flood storage capacity to take account of a 1 in 100 + 20% design event reduced to 3.6M.m3 (see explanation below). Option B0: This option has been modified from Option B presented in the 2010 study report, primarily by reducing the height of the embankment to give the live storage volume required to provide a nominal deployable output of 208 Ml/d (plus 20 Ml/d to SWOX) with the 350Ml/d abstraction capacity previously adopted for Option B.
The outline of Options 1 and 2 are shown on Figures 3.3 and 3.4. Note that compared to the previous analysis, the required flood storage has been reconsidered and is now based on the 1 in 100 (1%) +20% annual exceedance probability (AEP) design event for two reasons:
• The current EA guidance issued in September 2011 (Ref. 8) adopts a change factor allowing for climate change as the base case for analysis, rather than as a sensitivity.
• With pumped flood storage the adaptive approach previously assumed (i.e. where potentially additional flood compensation storage could be provided at some point in the future) is less likely to be viable than with “level for level” compensation storage volume. This aspect is considered further in the risk review in Section 9.1.3.
The required flood storage capacity is discussed in more detail in Section 3.2 below. A further option with an even smaller footprint and a correspondingly higher top water level than Option 2 was briefly investigated but was found to be unattractive due to the extent of embankments that would be required in the northern corner of the reservoir.


Thames Water Longdon Marsh Reservoir Company Confidential Report on Flood Pumping and Storage
F1-Rp Longdon Marsh - Report on Flood Pumping and Storage v3_July 2012.doc 7
Option 1 would require the least earthworks but is likely to be problematic in terms of water quality (see Section 3.1.5 below). Option 2 would require a greater length and average height of embankment but would be preferable in terms of water quality. Option 2 would also have a smaller encroachment into the floodplain and allow upstream tributary flows to pass the reservoir without the need for a substantial diversion tunnel and/or local pumping stations. A summary of the reservoir options considered is presented in Table 3-1 together with a comparison with Option B from the 2010 study.
Table 3-1 Summary of Longdon Marsh reservoir options
Levels (mAOD) Storage Capacity (M.m3) Option
Full Supply
Top Water
Dam Crest Dead Live Flood Total
Max pumping
rate (Ml/d)
Full size Option B proposed in 2010 study report
27 27 28 26 99 nil 125 350
Reduced height Option B0 23 23 24 26 63 nil 89 350
Option 1 (large footprint) 20.3 21 22 25.8 37.5 6.9 70.2 1200
Option 2 (small footprint) 26.1 27 28 11.1 38.7 3.6 53.4 900
Notes: 1. All options have a nominal deployable output of 208 Ml/d plus 20 Ml/d to SWOX. 2. As indicated in Figure 3.1, for Options B and B0, with 350 Ml/d abstraction rate, a live storage
volume of around 59 M.m3 is required. 3. Option B has “spare” capacity of 40 M.m3 which, in conjunction with additional pumping
capacity, could be used to provide additional direct supply. 4. The full supply level of Option B0 has been rounded to 23 mAOD, providing a nominal “spare”
capacity of 4 M.m3. 5. Bottom operating level for all options is 16 mAOD (~5m depth over reservoir floor).
3.1.5 Water quality considerations
During the design of the UTR at Abingdon, a working group was set up with various industry experts to consider water quality. Although the Computational Fluid Dynamics (CFD) modelling was never completed, it was widely acknowledged that reservoir depth and aspect ratio are crucial to maintaining water quality. It was concluded that for the proposed UTR geometry, acceptable water quality could be achieved using air diffusers. However, Table 3-2 below shows how the UTR is both deeper and has a significantly more favourable area to depth ratio than any of the full size (original Option B), reduced height (Option B0) or the large footprint (Option 1) Longdon Marsh schemes, and it is uncertain whether similar water quality could be achieved. A separate study is recommended to investigate this issue. However, of the various options for Longdon Marsh, Option 2 is clearly preferable in terms of water quality,. The precise design of the mitigation measures required is a complicated and important issue which is beyond the scope of this study. However, in order to assess the sensitivity on the overall scheme viability, this study considers a range of possible mitigation measures that may be required as follows:
Provisional estimate Extra reservoir depth 1m for Options B0 and 1 Maximum case Extra reservoir depth 3m for Options B0 and 1

Thames Water Longdon Marsh Reservoir Company Confidential Report on Flood Pumping and Storage
F1-Rp Longdon Marsh - Report on Flood Pumping and Storage v3_July 2012.doc 8
Table 3-2 Comparison of reservoir geometry
Scheme Maximum water depth at full supply level,
including dead storage (m)
Reservoir area at full supply level
(km2)
Ratio of reservoir area : maximum
water depth
Abingdon UTR (150M.m3) 33 6.7 0.20 Abingdon UTR (100M.m3) 29 5.4 0.19 Longdon Marsh – Full size (125M.m3) as Option B proposed in 2010 study report
16 10 0.62
Longdon Marsh – Reduced height Option B0 12 9.7 0.81
Longdon Marsh - Option 1 (large footprint) 9.3 9.4 1.01
Longdon Marsh - Option 2 (small footprint) 15.1 4.2 0.28
During times of flood the water in the River Severn is laden with sediment and is rich in nutrients. Water storage reservoirs would not normally be filled during these periods because of the associated detrimental impact on water quality within the reservoir. However, the proposed flood pumping scheme would require exactly the opposite, potentially exacerbating the other water quality issues at Longdon Marsh. The flood pumping scheme may therefore require additional measures compared to the flood compensation scheme to mitigate the problems of pumping sediment and nutrient rich water into the reservoir. These measures may include a water treatment works at the site and/or increased reservoir depth to compensate. As sufficient data is not currently available to assess either of these possibilities, an alternative mitigation solution has been costed to provide a specific risk/contingency item (see Section 6.2.2). This comprises an additional embankment within the reservoir to form two separate compartments for normal storage and flood storage respectively, together with additional inlet/outlet arrangements so that the potentially poor quality flood water can be kept separate and returned directly to the River Severn if necessary.
3.2 Flood storage volume required
The floodplain compensation option (Ref. 3) did not include an allowance for climate change as data was not available from the EA. However, for the floodplain compensation scheme, it was considered that there was no benefit in building in the extra compensation storage required at the outset as it would be relatively straightforward to add it at a future date. For the flood pumping scheme however, it would be better to build the embankments slightly higher at the outset rather than having to raise them at a future date which would be costly and disruptive to the reservoir operation. The flood pumping scheme should therefore be designed for the in 1 in 100 AEP flood with an allowance for climate change in accordance with current guidance. The most recent guidance issued by the Environment Agency (Ref. 8), provides a range of climate change factors by river basin district compared to a 1961-90 baseline. For the Severn, the central estimate change factor is 20% for the period 2040-2069 and 25% for the period 2070-2099. An upper end estimate of 70% for the latter period is given as well as an extreme “H++ river flow scenario” factor of 100% for “non-standard catchments.” which includes the Severn. This study assumes a climate change factor of 20%.

Thames Water Longdon Marsh Reservoir Company Confidential Report on Flood Pumping and Storage
F1-Rp Longdon Marsh - Report on Flood Pumping and Storage v3_July 2012.doc 9
The 1 in 100 AEP level at the Bushley Brook confluence (which at the peak of a flood event would be reflected in Longdon Marsh) is estimated by the Environment Agency to be 13m AOD. Based on currently available river flow and level data and extrapolating the relationship between flow and water level, it is estimated that a 20% increase in flow for climate change equates to a flood level of 13.3m AOD. The volume of floodplain storage which would be lost due to construction of the reservoir has been measured for both Options 1 and 2 as the volume enclosed by the reservoir footprint, existing ground levels and the 13.3m AOD level. The reservoir footprint was based on the embankment profile described in Section 4.1. The volumes were estimated using 12D modelling software and are presented in Table 3-3.
Table 3-3 Floodplain storage lost due to construction of the reservoir (M.m3)
Reservoir footprint/ depth option
1 in 100 AEP flood 1 in 100 AEP flood + 20% allowance
for climate change
1 in 1,000 AEP flood
Option 1 (large footprint) 5.2 6.9 13 Option 2 (small footprint) 2.8 3.6 7
3.3 Location of pumping stations
In both reservoir options a single flood pumping station is proposed located as part of the Longdon Pumping station. In both options flood water from the western and southern catchments would be diverted to the Longdon pumping station by gravity around the southern perimeter of the reservoir. In the case of Option 1 this would require a considerable length of tunnel, as previously proposed, whereas in Option 2 a simple drainage channel would suffice. For Option 1, the cost of the tunnel could be saved by constantly pumping the stream flows into the reservoir at the points where the streams are blocked. This would require separate pumping stations to the west and south of the reservoir, as well as the main pumping station to the east. The idea was suggested in the 1976 Binnie & Partners report and discussed in Section 4.7.3 of the 2010 study report. Although it may possibly be cheaper than a diversion tunnel, it is undesirable for the following reasons as stated in the 2010 report and has not been considered in this study.
• The pumping capacity that must be provided. This option was costed by Binnie & Partners on the basis of pumping stations with a capacity of 700Ml/d for the combined catchments to the NW and west of the site, and 450Ml/d for the catchment to the south. However on the basis of estimates made as part of this study using the FEH synthetic rainfall-runoff method1 (based on unit hydrograph theory) and modern safety standards, the pumping station capacities should be increased to 1340 and 1450 Ml/d respectively.
• The annual energy cost of pumping • The long term (>100year) reliability of a pumping solution: the viability of
communities, extensive farmland and infrastructure would be compromised in the event of a pumping failure.
A further alternative proposed by GARD combined a smaller diversion tunnel and two local pumping stations:
• A 3.5m diameter drainage tunnel around the reservoir (or triple 2m box culvert under the reservoir) to bypass base flow of up to about 600Ml/d
1 Flood Estimation Handbook, Volume 4

Thames Water Longdon Marsh Reservoir Company Confidential Report on Flood Pumping and Storage
F1-Rp Longdon Marsh - Report on Flood Pumping and Storage v3_July 2012.doc 10
• Two upstream pumping stations to lift upstream flood peaks into the reservoir with capacity of about 650Ml/d each
On balance and for similar reasons to those given before, we consider a larger capacity diversion tunnel would be preferable to such a composite arrangement.
3.4 Flood pumping capacity required
3.4.1 Previous proposals
It was previously suggested in the 2010 study report and during the 2010 Public Inquiry that the peak flows from the 1 in 100 AEP flood would need to be pumped into the reservoir to fully mitigate the loss of floodplain. The proposed pumping rates were as follows, associated with 5M.m3 of storage reserved to accommodate pumped flood water:
• 1340Ml/d from northwest and west tributaries (Section 4.7.3 of 2010 study report)
• 1450Ml/d from southern tributaries (Section 4.7.3 of report) • 1944Ml/d from River Severn backflows (Public Inquiry Document TWR/9b,
Annex 1, Section A2.22). The total of the above figures equals 4734Ml/d, which represents a “worst case”. In practice, as the likelihood of 1 in 100 peak flows from all three sources coinciding is small, the total capacity required for a single combined pumping installation can be expected to be less than this figure. Evidence submitted to the Public Inquiry by GARD (Ref. 6, para 3.3.4) confirmed the 5M.m3 requirement for flood storage and proposed lower pumping rates as follows in conjunction with a bypass tunnel with a capacity of about 600 Ml/d, used at normal flow levels:
• 1300Ml/d upstream pumping capacity split equally between two pumping stations
• Total pumping capacity from the Severn of 670Ml/d, including the pumping capacity needed to re-fill the reservoir in normal operation.
Even with continuous operation of the proposed total pumping capacity of 1970Ml/d, it would take 61 hours to pump 5M.m3 of flood storage. As shown below, for the large footprint options at Longdon Marsh, this pumping rate does not acceptably mimic the natural rate of flood rise experienced during the 2007 event. 3.4.2 Approach now adopted
The approach to the required flood storage and pumping capacity has now been reconsidered based on the current EA guidance (Ref. 8) and the observed rate of rise of historic flood events at Longdon Marsh and on the Severn. The latter effect is illustrated on Figures 3.5 and 3.6, which show the level hydrographs for 10 historic flood events, including the 7 highest recorded floods since regular gauging commenced in 1970. The flood hydrographs have been “normalised” with time zero when the water level on the Severn at Saxons Lode exceeds a gauge level of 3.75m. This corresponds approximately to the time when the level at the Bushley Brook confluence (some 3 km downstream) rises above the critical level of 11 mAOD, which corresponds to the level for the onset of flooding in Longdon Marsh.

Thames Water Longdon Marsh Reservoir Company Confidential Report on Flood Pumping and Storage
F1-Rp Longdon Marsh - Report on Flood Pumping and Storage v3_July 2012.doc 11
3.50
3.75
4.00
4.25
4.50
4.75
5.00
5.25
5.50
5.75
6.00
-24 0 24 48 72 96 120 144 168 192 216 240 264 288 312 336 360 384 408 432 456 480 504 528 552 576 600
Time from level at 3.75m on gauge (hours)
Saxo
ns L
ode
Rec
orde
d Le
vel (
m a
bove
7.5
mA
OD
)
10.75
11.00
11.25
11.50
11.75
12.00
12.25
12.50
12.75
13.00
13.25
App
rox
wat
er le
vel a
t Bus
hley
Bro
ok (m
AO
D)
1982 Jan
1989 Dec
1990 Feb
1998 Jan
1999 Dec (1)
1999 Dec (2)
2000 Nov
2000 Dec
2007 Jun
2007 Jul
Figure 3.5 Historic flood level hydrographs at Saxons Lode gauging station
3.50
3.75
4.00
4.25
4.50
4.75
5.00
5.25
5.50
5.75
6.00
-12 -6 0 6 12 18 24 30 36 42 48 54 60 66 72 78 84 90 96 102 108 114 120
Time from level at 3.75m on gauge (hours)
Saxo
ns L
ode
Rec
orde
d Le
vel (
m a
bove
7.5
mA
OD
)
10.75
11.00
11.25
11.50
11.75
12.00
12.25
12.50
12.75
13.00
13.25
App
rox
wat
er le
vel a
t Bus
hley
Bro
ok (m
AO
D)
1982 Jan
1989 Dec
1990 Feb
1998 Jan
1999 Dec (1)
1999 Dec (2)
2000 Nov
2000 Dec
2007 Jun
2007 Jul
Figure 3.6 Variation of rate of water level rise at Saxons Lode gauging station
Flood pumping options need to broadly reproduce the effect of filling of the natural floodplain storage so that there is negligible impact on water levels further downstream on the Severn. The total pumping capacity therefore has to be sufficient to match the rate of

Thames Water Longdon Marsh Reservoir Company Confidential Report on Flood Pumping and Storage
F1-Rp Longdon Marsh - Report on Flood Pumping and Storage v3_July 2012.doc 12
rise of the rising limb of the relevant flood hydrograph over the critical range of levels. Figure 3.5 and 3.6 clearly illustrate the unusual nature of the July 2007 flood event, both in terms of the maximum water level reached and, particularly, the rate of rise which was up to four times greater than during the earlier flood events. Various estimates of the AEP of the July 2007 flood event have been made ranging from 1 in 150 to 1 in 180. However, these estimates refer to the peak flow or level rather than the rate of rise. It is the latter which is in fact more critical for determining the required pumping capacity and for which there is no generally accepted methodology for determining the probability of occurrence, particularly for large diverse catchments such as the Severn. Figure 3.7 shows how different total flood pumping capacities (assuming constant rate pumping) can mitigate the loss of floodplain with Options 1 and 2 by mimicking the rate of rise in the natural floodplain, and assuming pumping commences when water levels at the Bushley Brook confluence exceed 11 mAOD. Figure 3.7 is plotted in terms of level rather than volume since the historical data is directly recorded in this manner. As a consequence, the pairs of lines representing Options 1A/2A and 1B/2B are very close as the pumping capacity has been selected to achieve a similar rate of rise but for a different reservoir footprint and hence different loss of floodplain area.
3.50
3.75
4.00
4.25
4.50
4.75
5.00
5.25
5.50
5.75
6.00
-12 -6 0 6 12 18 24 30 36 42 48 54 60 66 72 78 84 90 96 102 108 114 120
Time from level at 3.75m on gauge (hours)
Saxo
ns L
ode
Rec
orde
d Le
vel (
m a
bove
7.5
mA
OD
)
10.75
11.00
11.25
11.50
11.75
12.00
12.25
12.50
12.75
13.00
13.25
App
rox
wat
er le
vel a
t Bus
hley
Bro
ok /
Long
don
Mar
sh (m
AO
D)
Saxons LodeRecorded Jul 2007
Saxons Lode maxrise rate except Jul2007
Longdon MarshRecorded Jul 2007
Option 1A - effect ofpumping at max rate(3500 Ml/d)
Option 1B - effect ofpumping at reducedrate (1200 Ml/d)
Option 2A - effect ofpumping at max rate(1900 Ml/d)
Option 2B - effect ofpumping at reducedrate (700 Ml/d)
Figure 3.7 Pumping capacity required to mimic rate of rise in lost floodplain 3.4.3 Basis for design flood peak and rate of rise
A key question is the extent to which the July 2007 flood event should be regarded as an appropriate “design flood”. In terms of peak flood level on the River Severn the July 2007 event peaked at about 13.2 mAOD at the Bushley brook confluence, i.e. somewhat less than the level of 13.3 mAOD estimated for the 1 in 100 +20% event for which current guidance indicates that the flood compensation volume should be designed. However, the appropriate rate of rise to be assumed for the “design flood” is less clear cut.

Thames Water Longdon Marsh Reservoir Company Confidential Report on Flood Pumping and Storage
F1-Rp Longdon Marsh - Report on Flood Pumping and Storage v3_July 2012.doc 13
It has been argued (e.g. GARD Ref.6, Appendix R2, para 5.6) that the likelihood of such an extreme summer flood event occurring can be expected to diminish with changing climate. Moreover, the extreme rate of rise during this event would have been closely associated with the extreme local rainfall (e.g. that recorded at Pershore College, which has been noted (Ref. 9) as exceeding 10mm for six successive hours and having a probability of occurrence of around 0.1% in any one year).
The latest EA guidance (Ref, 8) makes no explicit recommendations for summer rainfall events. The scientific basis on which this guidance is based includes a Met Office report (Ref. 10) which provides estimated changes in seasonal extreme winter and summer daily rainfall totals for 40 locations. With regard to summer (June, July, August) rainfall the report concludes:
• There is no clear signal for the change in frequency of summer rainfall events. The range of possible changes means that summer rainfall events could become much less frequent, or that that they might be much more frequent.
• There is a large spread in the projected extreme rainfall amounts … and so these results (particularly those for summer) should be used with caution. They have been generated using the latest science available for extreme value analysis, but some of this science is still being developed and evaluated.
For the specific locations pertinent to the Severn and the local catchment (eg Shrewsbury, Birmingham) the report shows a small increase in the probability of current 1 in 100 rainfall occurring to around 1 in 80 by the 2080s, but with 90 and 10 percentile estimates varying from around 1 in 125 to around 1 in 50-60.
In view of the above, it is considered that a reservoir development at Longdon Marsh should not have an adverse impact downstream in the event of a repeat of the July 2007 flood. Indicative layouts and cost estimates are therefore presented for both the extreme rate of rise apparent in the July 2007 flood event and also for alternative arrangements assuming that the reduced pumping rates indicated on Figure 3.7 might be acceptable with an improved understanding of the probability of the rate of rise.
3.4.4 Summary of flood pumping capacity required
Table 3-4 summarises the flood pumping capacity required for the various options.
Table 3-4 Flood pumping capacity required
Reservoir footprint/ depth option
Flood pumping capacity required (Ml/d)
Flood volume (1 in 100 AEP + 20% flood - see Table 3-3)
(M.m3)
For 2007 extreme rate
of rise
Excluding 2007 extreme rate of
rise
Option 1 (large footprint) 6.9 3,500 (Option 1A)
1,200 (Option 1B)
Option 2 (small footprint) 3.6 1,900 (Option 2A)
700* (Option 2B)
* Note: With 39 M.m3 live storage, Option 2B requires 900 Ml/d pumping capacity to achieve a deployable output of 208 Ml/d plus 20 Ml/d direct supply to SWOX – see Figures 3.1 and 3.2. Alternatively, the reservoir TWL could be increased by about 1.5m to increase the live storage capacity and maintain the deployable output. The proposed arrangement of Longdon Pumping Station on the eastern edge of the reservoir, connected to the River Severn by a tunnel and to Bushley Brook by an overflow arrangement, would effectively ensure there was a large sump around the pumping station

Thames Water Longdon Marsh Reservoir Company Confidential Report on Flood Pumping and Storage
F1-Rp Longdon Marsh - Report on Flood Pumping and Storage v3_July 2012.doc 14
linked to the natural floodplains of both Bushley Brook and the River Severn. Both options would divert local flood inflows to this sump, in Option 1 via a tunnel and in Option 2 via a drainage channel. The pumping facility can therefore readily handle the requirements for flood storage compensation from flood events which are predominantly the consequence of high flows on either the Severn or the local catchment as well as those events which combine both. 3.5 Operational rules
Operational rules would need to be established to ensure that, during the rise of each flood event, the appropriate volume of flood water is pumped into storage and at the right time. The overall objective would be to pump flood water into storage in a time pattern which broadly mimics the natural storage accumulation of the floodplain lost to the reservoir footprint. This would require real time monitoring of flood levels in both Longdon Marsh and on the Severn. It would also be essential to obtain regular updates from a reliable flood forecasting system which provides both forecast peak levels and the forecast time of peak. The Environment Agency’s flood forecasting system, which can be expected to be further developed before Longdon Marsh reservoir would be commissioned, may provide sufficient information for this purpose. Nevertheless, options relying on flood pumping would inherently involve an added level of risk in terms of the development of the necessary operational rules compared with the “fail safe” approach of providing compensation storage. Issues pertinent to the development of operational rules to mitigate this risk are discussed in this section. Generally, flood pumping would need to commence when water levels in Longdon Marsh or at the Bushley Brook/Severn confluence exceed about 11 mAOD. However, the appropriate pumping rate during a flood event would need to be determined from forecasts of the peak water level and the time to peak. During the flood rise which, as indicated in Figure 3.5, can vary from 2 to 8 days or more, the rate of pumping is likely to require modification as revised forecasts become available. For flood events with an outturn less severe than the design flood condition, there would be scope for making adjustments in the event that forecasts of the flood peak change substantially during the course of the event. This flexibility would be available in terms of both “spare” available flood storage and pumping capacity. For flood events with an outturn similar to or more severe than the design flood conditions, operation would be more critical. If the pumping rate during the early part of the flood rise is too high, then there may be insufficient flood storage available to continue pumping at the appropriate rate up to the peak of the event, which is likely to result in higher flows passing downstream on the Severn and hence causing marginally higher peak water levels than would have occurred with the natural floodplain. Conversely, if it transpires that the pumping rate during the early part of the flood rise is too low then, provided sufficient pumping capacity were available (which, for rapid rise events, may not be the case with the lower flood pumping capacity Options 1B and 2B), then an increased rate of pumping towards the peak of the flood event could make up for the earlier deficiency in the pumping rate. 3.6 Discharge provision for emergency drawdown
For Option 1 the discharge capacity required to provide a drawdown of 1m per day would be about 110m3/s. As before, this capacity would most economically be provided by a siphon system in addition to the main transfer tunnels, as described in the 2010 study

Thames Water Longdon Marsh Reservoir Company Confidential Report on Flood Pumping and Storage
F1-Rp Longdon Marsh - Report on Flood Pumping and Storage v3_July 2012.doc 15
report. 2.8m diameter pipework in the tunnel between the intake tower and the pumping station combined with a 4.2m diameter Severn Longdon tunnel would provide a capacity of about 40m3/s, with the balance of about 70m3/s being accommodated through 4 no. 1.8m diameter siphons and an auxiliary channel. For Option 2, with a smaller reservoir surface area, the discharge capacity for the same rate of drawdown is 49m3/s and, with the higher available static head, could be provided by the same size pipework and tunnels as Option 1, but without the need for additional siphons. 3.7 Flood storage drawdown and operation during sequential flood events
As indicated in Section 3.5, the overall objective of the pumped storage arrangements would be to pump flood water into storage in a time pattern which broadly mimics the natural storage accumulation of the floodplain lost to the reservoir footprint. In a similar manner the drawdown capacity would need to be utilised to empty the flood storage in a way which mimics the draining of the natural floodplain which is being replaced. The capacity of the emergency drawdown arrangements is based on drawing the reservoir down by 1m per day at top water level. Drawdown at 50% of this rate is equivalent to ‘emptying’ the natural floodplain at a rate of around 1.5 m/day. From the rate of drop in level during the recession of the flood events shown on Figure 3.5 it can be seen that this rate is well in excess of that experienced during any of the recorded historic floods. Figure 3.5 also shows a number of historic floods with sequential flood peaks. Such flood events include those with a few days between the two peaks (e.g. Jan 1982, Dec 1989, and Feb 1990) and those with rather longer (e.g. two in Dec 1999, Nov/Dec 2000 and Jun/Jul 2007). The latter would not present any real issues since there is plenty of time to utilise the drawdown capacity to empty the flood storage, even if drawdown were to be deferred until levels on the Severn had dropped below 11 mAOD. Operation during closer sequential flood peaks (such as those which occurred in Jan 1982, Dec 1989, and Feb 1990) would need more careful consideration to determine the appropriate time to initiate drawdown and the appropriate rate so as to broadly mimic what would have been the response of the natural floodplain. In such cases the natural Longdon Marsh floodplain would not have emptied fully before the rise of the second flood peak as the effectiveness of drainage is compromised under such conditions. This is evident from Figure 3.7, which shows that, in 2007, the time to drain Longdon Marsh from the peak recorded level to 12.75 mAOD is about 50% longer than for the River Severn at Saxons Lode. The closer sequential flood peaks of up to a few days can essentially be considered as part of the same flood event. As discussed in Section 3.5, successful mitigation of the loss of floodplain storage would require the development of appropriate operational rules and would be dependent on the availability of a sufficiently reliable flood forecasting system with regular updates. Such forecasts can reasonably be expected to be available on the Severn for a few days in advance.

Thames Water Longdon Marsh Reservoir Company Confidential Report on Flood Pumping and Storage
F1-Rp Longdon Marsh - Report on Flood Pumping and Storage v3_July 2012.doc 16
4 Outline design for basis of cost estimate
4.1 Embankment design
4.1.1 Borrow areas
The embankment would be constructed of compacted marl excavated from the borrow areas provisionally located as shown in the Binnie & Partners report (Ref. 2) and on Figures 3.3 and 3.4:
• Borrow Areas A and C on the southern rim (providing 3.2 and 0.22 M.m3
respectively), • Borrow Area B in the northeast (providing 0.4M.m3) and • Borrow Area D in the northwest (providing 0.4M.m3).
As shown in Section 4.3.4 of the 2010 study report (Ref. 1), Borrow areas A, B and C are likely to provide sufficient material for reservoir Option 1 (large footprint) in which the embankment volume is estimated to be less than 1M.m3. With Option 2 (small footprint), the fill requirement is greater at around 5M.m3 allowing for contingency, and it may be considered inappropriate to use Borrow Area A (Red House Hill) and C, both of which lie well outside the reservoir area, in which case another borrow area in addition to Borrow Area D must be identified. It may be possible to extend borrow area D eastwards along the reservoir side of the northern rim, as shown in Figure 3.4: such an extension could provide sufficient fill for Option 2. However this area has not been investigated and must be considered a risk for this option, as noted in Section 9. 4.1.2 Embankment section
The embankment section adopted in the 2010 study report is that selected by Binnie & Partners in their 1976 report, that is slopes of 1:4 (horizontal:vertical) on the upstream slope and 1:3 on the downstream slope. The embankment would be founded on marl after excavation of the lake sediments, till and weathered soliflucted marl. The slopes are based on the relatively high strength of undisturbed Keuper marl, but there is a risk that pre-existing shear surfaces may exist in the marl foundations which might make it necessary to flatten the slopes: the level of detail of the 1976 investigation was not sufficient to confirm that such surfaces do not exist. Until a thorough investigation is carried out, the possibility that the embankment slopes may have to be flattened must be taken into account in the cost estimates. This risk has been taken into account in the cost estimates with an appropriate estimating allowance factor (see Section 9.2.2). Design allowances have been included for landscaping: the outer face with overburden material excavated from the embankment foundations and borrow area, and this has been taken into account in the cost estimates. For the inner face landscaping is proposed, comprising undulations, lagoons and promontories constructed from engineered fill which amounts to an increase of nearly 10% of engineered fill quantities. This additional landscaping requirement was not included previously in the costs of the Longdon Marsh reservoir but an allowance for this has now been included.

Thames Water Longdon Marsh Reservoir Company Confidential Report on Flood Pumping and Storage
F1-Rp Longdon Marsh - Report on Flood Pumping and Storage v3_July 2012.doc 17
4.1.3 Freeboard
The freeboard, or the vertical distance between the top water level (full supply level plus flood storage), should be such as to limit overtopping flows from wave run up taking into account long term settlement. At this stage it is proposed to adopt a freeboard of 1m, made up as:
Vertical height to limit overtopping discharge 0.7m Long term settlement 0.25m Wind set up (say) 0.05m
Total 1.0m
This estimate is in contrast to the freeboard of 1.75m used in the Binnie report. The latter is considered, in the light of the more recent work undertaken on this subject, to be unnecessarily conservative.
4.2 River intake/outfall and transfer tunnel
The river intake would be similar to that proposed for the flood compensation storage option but with some modifications, mainly to the civil works, to cater for the various extreme flood pumping rates. In all options a tunnel is required connecting the river intake, the Longdon Marsh Pumping Station and the main tower in the reservoir. Tunnel capacity would be governed by flood pumping rates and reservoir emergency drawdown requirements, which are summarised in Table 4-1.
Table 4-1 Tunnel sizing
Flood pumping rate
(Ml/d)
Tunnel diameter (m)
Option
Ml/d m3/s
Emergency drawdown
rate m3/s River –
Pumping Station
Pumping Station - Reservoir
Notes
1A 3500 40 110 4.2 4.8 (pipe 2.8)
1B 1200 14 110 4.2 4.8 (pipe 2.8)
Additional 70 m3/s drawdown capacity through siphons
2A 1900 22 49 4.2 4.8 (pipe 2.8)
2B 700* 8 49 4.2 4.8 (pipe 2.8)
No siphons required
Original Option B - - 105 Siphons required
(75 m3/s) * Note: With 39 M.m3 live storage, Option 2B requires 900 Ml/d pumping capacity to achieve a deployable output of 208 Ml/d plus 20 Ml/d direct supply to SWOX – see Figures 3.1 and 3.2. Alternatively, the reservoir TWL could be increased by about 1.5m to increase the live storage capacity and maintain the deployable output. The transfer tunnel between the river and the pumping station has been sized at 4.2m diameter to allow for emergency drawdown of 1m/day, although for Option 1 this would need to be supplemented by a siphon system. For all options it is proposed that the tunnel between the river and the pumping station should be a 4.2m diameter bored tunnel. This tunnel size has been checked for the flood pumping capacities shown in Table 4-1 and is adequate for all except the maximum flood pumping rate with Option 1A. However, high flood flows can also be pumped directly from the watercourse near the pumping station,

Thames Water Longdon Marsh Reservoir Company Confidential Report on Flood Pumping and Storage
F1-Rp Longdon Marsh - Report on Flood Pumping and Storage v3_July 2012.doc 18
either tributary flows from the outlet of the diversion tunnel or from the Severn up Bushley Brook. Where the tunnel passes below the embankment, flow would be contained within a 2.8m diameter pipe within the tunnel so as to permit inspections and ensure reservoir safety. To accommodate the 2.8m diameter pipe and space for access around it, it is proposed that this section of tunnel be 4.8m diameter. Again, the maximum flood pumping rate with Option 1A would require additional capacity and it is proposed that the emergency drawdown siphons could be used to achieve the necessary flow capacity.
4.3 Watercourse diversion and drainage tunnel
The previous cost estimate for Longdon Marsh assumed that the drainage tunnel to divert local watercourses around the reservoir would be a 4.2m diameter tunnel, 5.8km long around the southern perimeter of the reservoir. Following a review of the latest hydrological analysis, based on 1 in 100 (1%) AEP floods with 20% allowance for climate change, it is now realised that this would be too small to pass the combined flow from the local tributaries during short duration floods. For Options 1 and B0 it is therefore proposed that the downstream 3km section of tunnel, east of Horse Bridge where flows from Longdon Brook would be collected, should be a twin 4.2m diameter tunnel. Adopting a twin tunnel is considered more economical than enlarging the tunnel diameter as it would allow a single tunnel boring machine to be used for all the tunnelling. An allowance for increasing the tunnel capacity in this way has therefore been included as a specific item within the cost estimate. With the smaller reservoir footprint with Option 2 it would be possible to effect the watercourse diversion with a simple drainage channel generally following the toe of the embankment. The cost saving of not having to construct a considerable length of tunnel largely offsets the cost of the additional embankment fill required with Option 2.
4.4 Pumping stations
4.4.1 General
It is proposed that a single pumping station, situated at Longdon would be required to fulfil the following duties: a) refilling the reservoir from the River Severn b) high lift pumping delivering water to the booster pumping station near Winchcombe c) flood pumping from the River Severn and tributaries into the reservoir
4.4.2 Civil works
The civil works for the pumping station would differ depending on the option for flood pumping capacity (see Section 3.4). For Options 1B and 2B (normal rate of flood rise, see Table 3-4), the civil works would be substantially below ground level in an excavation approximately 17m deep with the tunnel passing through the excavation. This allows for a single excavation below ground containing a central wet well in water retaining reinforced concrete with a pumping hall on one side and the equipment for pressure dissipation on the other side. The pumping hall would also include the high lift pumps for water transfer.
For Options 1A and 2A (extreme rate of flood rise) the pumping station would differ significantly in that the design would be based on the use of concrete volute pumps. This type of pump is required to handle the very large volumes of water associated with the flood scenarios anticipated with these options. Because the pump volutes and inlets are cast in concrete, a forebay or stilling area is required between the tunnel outlet and the pump inlets in order to stabilise flow patterns and provide a means of isolation. The cost estimates therefore allow for the increased volume of excavation and concrete and the cost of casting the low lift pump volutes in concrete.

Thames Water Longdon Marsh Reservoir Company Confidential Report on Flood Pumping and Storage
F1-Rp Longdon Marsh - Report on Flood Pumping and Storage v3_July 2012.doc 19
Above ground, a surface building would contain the major electrical transformers and switchgear, standby generators, local control room, communications equipment for remote control and monitoring, workshop facilities and an unloading bay for handling of equipment from the underground building and transfer to road-going vehicles. An allowance of just over £1million has been included for architectural treatment of this building.
4.4.3 Mechanical and electrical equipment
(a) General description of mechanical and electrical equipment The pumping station at Longdon Marsh would, for some of the options (1B, 2B) defined in Table 3-4, be similar in concept to that proposed in the 2010 study, including the need for high lift pumps which are large and energy intensive.
For those Options (1A, 2A) which include higher capacity pumps for flood alleviation purposes, a different layout is required to incorporate the use of concrete volute pumps which are needed to cope with the large volumes of water involved. The following describes the main plant and equipment which would be installed in the Longdon Marsh Pumping Station as part of the proposed scheme. (b) Main transfer pumps The main transfer pumps would be used to pump river water into the storage reservoir from the wet well in the pumping station. The normal maximum flow from these pumps would be around 900Ml/d and they would operate at a head of around 10-14m for Option 1 and 16-20m for Option 2. Should the option be chosen to size these pumps for the maximum flood pumping rate then the maximum flow would be 3500 Ml/d for Option 1A and 1900 Ml/d for Option 2A. Two types of pump would be considered for this application: double entry vertical split casing pumps for the smaller flow options and vertical concrete volute type for the larger flow options, the final selection being made during the detail design phase depending on the ultimate flow rate selected. Both types of pump would require motors rated between 0.8 – 2.5 MW using a 3.3kV power supply. Should the higher pumping rate Option 1A be selected the motors would be at the higher end of the scale to cope with the larger flows. Motor speed would depend on final pump selection but it is likely that the speed would be relatively low due to the high flow, low head pump duty. For options with the higher flood pumping rates (1A and 2A) it is anticipated that three pump sets would be installed, all of which would operate to achieve the maximum flood pumping duty. Normal reservoir filling duties would be achieved with one or two pumps in service, providing significant redundancy and standby capacity for normal conditions. Options 1B and 2B with the lower flood pumping rate would have a similar number of smaller pumps. The pump motors would be controlled with a variable speed drive in order to closely control pumping rates with availability of river water.
(c) High lift pumps The high lift pumps would be used to transfer water from the reservoir to the booster pumping station on the escarpment of the Cotswold Hills. The flow from these pumps would be a total of 230 Ml/d against a head of 121 m. It is anticipated that four pump sets would be installed, with any three achieving the maximum duty. Pumps would be of the vertical double entry split casing type. Motors would be rated at approximately 1.5 MW with a 3.3kV supply. The motors would be controlled by a variable speed drive in order to closely match the required demand.
Thames Water Longdon Marsh Reservoir Company Confidential Report on Flood Pumping and Storage
F1-Rp Longdon Marsh - Report on Flood Pumping and Storage v3_July 2012.doc 20
(d) Draw down valves It is necessary to have a facility to draw water from the reservoir in a controlled manner in order to release flood storage or to facilitate drawdown for embankment inspection and repair should wear or damage occur. Three submerged sleeve type valves would be installed in the pumping station. These would allow the controlled release of water from the reservoir back to the river through the intake tunnel. The valves would be sized such that during combined operation they have the capacity to reduce the water level of the reservoir, when full, by 1.0m over a period of 24 hours.
(e) Pipework and valves in the pumping station Within the pumping station, pipework would be fabricated from carbon steel and protected from corrosion by a fusion bonded epoxy based paint system. Pipe wall thickness would be appropriate to the maximum pressures as would the flange ratings. Pipe wall thickness would be as described in BS 534:1990. Pipe diameters have been selected such that flow velocities of approximately 1.0 – 2.0m/s would be targeted on the suction side of the pumps in order to minimise turbulence and maximise NPSHA. Flow velocities on the delivery side of the pumps would typically be higher and may locally be in the range 2 – 3 m/s. Note that pipeline velocities are based on normal flow conditions. Extreme flood conditions would result in increased velocities resulting in higher pumping heads, reduced efficiency and increased energy costs.
Isolating valves on the suction and delivery sides of the pumps would be flanged butterfly type with those on the pump delivery side having electric actuators for pump start / stop control purposes. Because of the size of the pumping station, it is expected that the hydraulic layout would be modelled before the pipework sizing and layout is finalised.
(f) Pumping station lifting equipment Overhead travelling cranes would be installed in the pumping station to facilitate installation and subsequent removal for maintenance of all items. It is likely that the heaviest lift would be the pump motors and cranes would be rated approximately 25% in excess of the maximum lift.
(g) Ventilation system Both electric motors and variable speed drives produce waste heat and a forced draught ventilation system would be provided to exhaust this heat to atmosphere outside the building. The noise emanating from this system would be studied in more detail at detail design stage and attenuation measures incorporated into the final design. (h) Surge suppression equipment Transient hydraulic surge pressures are to be anticipated when a moving column of water in a tunnel or pipeline stops abruptly. Typically, the reason for this is power failure causing all pumps to stop simultaneously thereby creating a pressure wave in the pipeline or tunnel. Surge pressures and / or their effects are minimised by the provision of surge vessels, surge towers or surge anticipating valves. A full analysis would be undertaken during the detail design phase of the project and appropriate alleviation measures provided. (i) Electrical power distribution Power consumption at Longdon Marsh Pumping Station would be significant and would require an incoming power supply at 6.6 kV with an anticipated rating in excess of 10 MVA

Thames Water Longdon Marsh Reservoir Company Confidential Report on Flood Pumping and Storage
F1-Rp Longdon Marsh - Report on Flood Pumping and Storage v3_July 2012.doc 21
for Option 1A with 3500 Ml/d flood pumping capacity. This is based on a peak operating condition of 3 abstraction pumps and 3 high lift pumps operating simultaneously.
The power distribution equipment would comprise a 6.6kV substation with independent breakers feeding twin 6.6kV to 3.3kV transformers rated at approximately 10 – 12 MVA each. The transformers would feed the main 3.3 kV MCC which would house the drives for the raw water and high lift pumps. The 3.3 kV panel would have an incomer for a standby generator and a feed to a 3.3 kV to 415 V transformer which would in turn feed the low voltage MCC for equipment and station auxiliaries which require a 415V supply as well as a single phase connection for lighting and small power. (j) Electrical backup Because of the extreme weather conditions likely to be prevailing when the flood alleviation pumps are required to operate it is considered essential to provide standby power generation capacity should mains supply fail. It is proposed that standby generating capacity of 12.5 MVA is installed comprising up to 5 No 2.5 MVA diesel generator sets. This would allow power generation capacity to be matched to pumping demand. It is anticipated that sufficient fuel would be stored on site to allow continuous operation for a period of up to 4 days. 4.5 Water quality
In the absence of any modelling analysis of reservoir water quality, the provisions for water quality amelioration is based on the TWUL experience of large reservoirs and modelling carried out for other major resource developments. For Option 1 it is envisaged that a main tower and two secondary towers would be required plus pumped water recirculation and air bubblers, although it is by no means certain that this provision would be effective in a reservoir of such a large area and such shallow water. For Option 2, where the reservoir area: depth aspect ratio is more favourable, it is probable that recirculation and bubblers would be effective and hence only one secondary tower has been allowed for in the cost estimates.

Thames Water Longdon Marsh Reservoir Company Confidential Report on Flood Pumping and Storage
F1-Rp Longdon Marsh - Report on Flood Pumping and Storage v3_July 2012.doc 22
5 Maintenance and operation
5.1 General
Maintenance and operation of the project would primarily be centred on the Longdon Marsh Pumping Station. This would be a modern pumping station capable of being operated locally or remotely from a designated Control Room. Costs would fall into three categories; Operations, Maintenance and Energy. Energy requirements and costs are considered in Section 6.3.1. 5.2 Operating staff
Although normally unmanned and remotely operated and monitored, it would be prudent to allow for routine daily visits by operations staff. 5.3 Maintenance costs and procedures
The equipment provided would be heavy duty and engineered for the application and expected to last many years. However, it would be subject to wear and tear and because of its size; spares may be bespoke and expensive. Maintenance typically costs 5 – 10% of capital cost per annum. Routine maintenance would comprise visual checks including lubricant and fuel levels. Lubricants would be replenished or changed in accordance with manufacturers’ instructions as would air, fuel and oil filters as well as any filters or consumable items in the power distribution system. A detailed schedule of routine maintenance would be created after consultation with equipment suppliers during the construction phase of the project. Any pumps which have not been used in the recent past should be rotated manually in order to prevent brinelling of bearings. This should be done as frequently as possible but at no more than three month intervals. Similarly, the standby generators should be run up on a monthly basis to ensure they function correctly when needed. It is anticipated that this would be carried out by in house O&M staff as required by the detailed maintenance schedule. Large rotating machinery such as this would require major overhaul, the timing of which is usually dependent on usage but which could typically be at 10 year intervals. Such maintenance would include replacement of bearings, wear rings, seals, filters and any obviously worn components observed at the time. It is anticipated that major overhaul would be undertaken by the original equipment supplier or other specialist contractor. For the options where the pumping station is to be used for flood alleviation it is important that the plant is maintained in a state of operational readiness. Whilst this is also desirable for the supply only options, it is less critical with regard to planned maintenance outages. We would anticipate that, in addition to routine maintenance, a “black start” scenario exercise be conducted, generally on a monthly basis, to simulate power failure and flood conditions. This would mean starting the standby generators and running the pumps to simulate an emergency condition. Abstraction rates would be limited by the available flow in the river and abstraction would not be possible under low flow conditions. It is important to “exercise” the standby engines and electrical equipment so that it functions correctly under an emergency situation. This would incur staff and fuel costs as well as highlighting any consequential maintenance issues. Maintenance would need to be undertaken by sub contractors with appropriate experience.

Thames Water Longdon Marsh Reservoir Company Confidential Report on Flood Pumping and Storage
F1-Rp Longdon Marsh - Report on Flood Pumping and Storage v3_July 2012.doc 23
6 Cost estimate
6.1 Principal statistics
The principal statistics of the various options, which form the basis of the cost estimates, are set out in Table 6-1 below.
Table 6-1 Principal statistics Description Unit Option 1
(large footprint) Option 2
(Small Footprint) Option B0
Reservoir Bottom operating level (BOL) mAOD 16 16 16 Full supply level mAOD 20.3 26.1 23 Top water level (TWL) (including flood storage)
mAOD 21 27 23
Embankment crest level (excluding any extra depth required for water quality reasons)
mAOD 22 28 24
Dead storage volume M.m3 25.8 11.2 26 Live storage volume (excluding flood storage)
M.m3 37.5 38.7 63
Flood storage volume M.m3 6.9 3.6 nil Total storage volume M.m3 70.2 53.4 85 Surface area at TWL ha 949 420 969 Embankment footprint (excluding any extra depth required for water quality reasons)
ha 14 51 20
Total embankment length km 3.8 5.0 3.8 Earthworks Embankment fill above EGL m3 430,000 3,670,000 760,000 Embankment fill below EGL (assuming 2m foundation strip)
m3 270,000 950,000 365,000
Total embankment fill m3 700,000 4,620,000 1,120,000 Watercourse diversion Length km 5.8 + 3.0 4.0 5.8 + 3.0 Type - 4.2m diameter
tunnel Diversion channel 4.2m diameter
tunnel Severn Longdon Tunnel River to Pumping Station
- Length km 2.6 2.6 2.6 - Diameter m 4.2 4.2 4.2
Pumping station to reservoir tower
- Length km 0.4 0.4 0.4 - pipe diameter m 2.8 2.8 2.8 - tunnel diameter m 4.8 4.8 4.8

Thames Water Longdon Marsh Reservoir Company Confidential Report on Flood Pumping and Storage
F1-Rp Longdon Marsh - Report on Flood Pumping and Storage v3_July 2012.doc 24
Option 1 (large footprint)
Option 2 (Small Footprint)
Option 1A
Option 1B
Option 2A
Option 2B
Description Unit
(3500Ml/d) (1200Ml/d) (1900Ml/d) (900Ml/d)
Option B0
Pumping Stations Reservoir low lift pumping station
- Time required to pump flood storage Hours 47 138 45 96 n/a
- Pumping capacity Ml/d 3500 1200 1900 900 350 - Head m 14 11 1.58 16.5 14.5 - Total absorbed power kW 6,970 1,940 5,040 2,130 730 - Motor rating kW 3 x 2,450 3 x 850 3 x 2,000 3 x 850 3 x 300
Reservoir high lift pump station (motor rating) kW 3,750 3,750 3,750
Booster pump station (motor rating) kW 4,650 4,650 4,650
Auxiliary drawdown Number of siphons No. 4 0
(Emergency drawdown achievable through
tunnel alone)
6
Diameter of siphons m 1.8 - Reservoir Towers Number of reservoir towers No. 3 2 3 Approximate tower height m 14 20 16 Roads Road diversion km 6.5 6.5 6.5 Access roads km 2.1 2.1 2.1 Haul roads km 11 11 11
6.2 Capital cost
6.2.1 Construction cost
The 2010 cost estimate for the Option B scheme has been updated for the revised options shown in Table 6-1. The detailed cost estimates are included in Appendix A and are summarised in Table 6-2 below where they are also compared against the directly comparable estimate for Option B0 (with floodplain compensation and reservoir sized to provide the same deployable output) and the original Option B estimate. The estimates are colour coded as follows:
Green – reduced cost compared to the Option B0 Floodplain Compensation Scheme Pink – increased cost compared to the Option B0 Floodplain Compensation Scheme
The estimates are generally consistent with the previous estimate in the 2010 study of Longdon Marsh for the Option B scheme. To ensure compatibility with earlier estimates, the rates are based on September 2007 prices. The estimates do not include the cost of scheme development, land acquisition, overall risk, fuel contingency or optimism bias.

Thames Water Longdon Marsh Reservoir Company Confidential Report on Flood Pumping and Storage
F1-Rp Longdon Marsh - Report on Flood Pumping and Storage v3_July 2012.doc 25
Table 6-2 Summary of cost estimates
Option 1A Option 1B Option 2A Option 2B(3500Ml/d) (1200Ml/d) (1900Ml/d) (900Ml/d)
1 Enabling works1.1 Services diversion 15,349,966 15,349,966 7,674,983 7,674,983 15,349,966 15,349,9661.2 Demolition 1,519,799 1,519,799 759,899 759,899 1,519,799 1,519,7991.3 Clearance & recycling 2,672,045 2,672,045 1,336,022 1,336,022 2,672,045 2,672,0451.4a TBM for watercourse diversion tunnel and from PS to river 9,118,792 9,118,792 9,118,792 9,118,792 9,118,7921.4b Watercourse diversion tunnel construction 32,755,946 32,755,946 0 0 32,755,946 33,830,0671.4c Drainage channel 179,160 179,160 286,656 286,656 179,1601.5 Security 610,633 610,633 610,633 610,633 610,633 610,6331.6 Site investigations 2,035,445 2,035,445 2,035,445 2,035,445 2,035,445 2,035,4451.7 Environmental management 2,517,167 2,517,167 2,517,167 2,517,167 2,517,167 2,517,167
Sub total 66,758,952 66,758,952 24,339,597 24,339,597 66,758,952 58,535,121
2 Floodplain Compensation Not required for Options 1 and 2 as flood pumping instead - - - - 111,744,609 111,744,609
3 Embankment Earthworks3.1 Trial embankment 4,149,954 4,149,954 4,149,954 4,149,954 4,149,954 4,149,9543.2 Embankment fill 5,202,957 5,202,957 34,108,383 34,108,383 7,738,123 22,051,8443.3 Provision for landscaping (undulations, lagoons etc) 1,342,517 1,342,517 4,048,166 4,048,166 1,790,031 -3.4 Slope protection 2,586,421 2,586,421 7,798,967 7,798,967 3,448,561 5,927,2153.5 Miscellaneous 5,484,512 5,484,512 7,182,099 7,182,099 5,484,512 12,000,634
Sub-contractors overheads and profit (10%) 1,876,636 1,876,636 5,728,757 5,728,757 2,261,118 4,412,965Sub total 20,642,997 20,642,997 63,016,325 63,016,325 24,872,299 48,542,612
4 Tunnels and shafts4.1 Tunnel from tower to PS (excluding tunnel pipe work which is in
Item 5.3)5,710,253 5,710,253 5,710,253 5,710,253 5,710,253 1,700,003
4.2 Tunnel from PS to river (TBM in item 1.4a) 9,677,893 9,677,893 9,677,893 9,677,893 9,677,893 13,755,2864.3 Shafts below tower & river intake 765,756 765,756 765,756 765,756 765,756 765,756
Sub total 16,153,902 16,153,902 16,153,902 16,153,902 16,153,902 16,221,045
5 Hydraulic structures5.1 River intake 4,290,937 2,860,625 3,718,812 2,860,625 2,860,625 2,860,6255.2 Pumping station civil works 12,416,337 8,277,558 10,760,826 8,277,558 8,277,558 8,277,5585.3 Pumping station E&M equipment (including flood pumps, pipe
work, electrical supply & back up)20,580,512 14,904,239 18,499,350 14,826,928 13,429,280 6,431,028
5.4 Main tower 8,428,167 8,428,167 12,040,239 12,040,239 9,632,191 12,040,2395.5 Secondary towers and culverts 7,022,942 7,022,942 5,016,387 5,016,387 8,026,220 10,032,7755.6 Water mixing 5,080,470 5,080,470 3,810,352 3,810,352 5,080,470 5,080,4705.7 Auxiliary drawdown siphons and channel 13,553,618 13,553,618 0 0 13,553,618 13,553,618
Sub total 71,372,984 60,127,620 53,845,967 46,832,090 60,859,963 58,276,313
6 Roads6.1 Road diversions 11,686,492 11,686,492 11,686,492 11,686,492 11,686,492 11,686,4926.2 Reservoir access roads 3,775,636 3,775,636 3,775,636 3,775,636 3,775,636 3,775,6366.3 Reservoir temporary roads 6,209,463 6,209,463 6,209,463 6,209,463 6,209,463 6,209,4636.4 Pipeline access roads 2,822,483 2,822,483 2,822,483 2,822,483 2,822,483 2,822,483
Sub total 24,494,074 24,494,074 24,494,074 24,494,074 24,494,074 24,494,074
7 Longdon to Culham transfer7.1 Longdon Marsh high lift pump station civil included under Item 5.2 2,637,1767.2 Longdon Marsh high lift pump station E&M equipment included under Item 5.3 2,433,0017.3 Hailes high lift pump station civil 2,637,176 2,637,176 2,637,176 2,637,176 2,637,176 2,637,1767.4 Hailes high lift pump station E&M equipment 2,580,554 2,580,554 2,580,554 2,580,554 2,580,554 2,580,5547.5 1400mm Pipeline from Longdon Marsh to Winchcombe summit 41,387,157 41,387,157 41,387,157 41,387,157 41,387,157 41,387,1577.6 Winchcombe summit break pressure tank 2,782,161 2,782,161 2,782,161 2,782,161 2,782,161 2,782,1617.7 1200mm Pipeline from Winchcombe summit to Culham outfall 72,986,811 72,986,811 72,986,811 72,986,811 72,986,811 72,986,8117.8 Culham outfall 2,496,812 2,496,812 2,496,812 2,496,812 2,496,812 2,496,812
Sub total 124,870,672 124,870,672 124,870,672 124,870,672 124,870,672 129,940,849
8 Delivery system (SWOX supply)8.1 Water treatment civil works 12,728,314 12,728,314 12,728,314 12,728,314 12,728,314 12,728,3148.2 Water treatment equipment 13,759,606 13,759,606 13,759,606 13,759,606 13,759,606 13,759,6068.3 Wastewater treatment & disposal 6,866,233 6,866,233 6,866,233 6,866,233 6,866,233 6,866,2338.4 Treated water pipeline 9,182,982 9,182,982 9,182,982 9,182,982 9,182,982 9,182,9828.5 Treated water pumping station 1,006,290 1,006,290 1,006,290 1,006,290 1,006,290 1,006,290
Sub total 43,543,425 43,543,425 43,543,425 43,543,425 43,543,425 43,543,425
9 Finishing Works9.1 Miscellaneous 7,911,095 7,911,095 7,911,095 7,911,095 7,911,095 7,911,0959.2 Conservation, Access and Recreation (CAR) 8,798,114 8,798,114 8,798,114 8,798,114 8,798,114 8,798,1149.3 Maintenance works 759,899 759,899 759,899 759,899 759,899 759,8999.4 Renewable energy 6,715,134 6,715,134 6,715,134 6,715,134 6,715,134 6,715,134
Sub total 24,184,242 24,184,242 24,184,242 24,184,242 24,184,242 24,184,242
10 Rail 0 0 0 0 0 0
Total works items 392,021,248 380,775,884 374,448,203 367,434,326 497,482,138 515,482,291
General Items (contractors on-costs) @ 36% 141,127,649 137,079,318 134,801,353 132,276,357 179,093,570 185,573,625
Total Construction cost 533,148,898 517,855,203 509,249,557 499,710,684 676,575,707 701,055,916
KeyReduced cost compared to revised Option B0 scheme with floodplain compensationIncreased cost compared to revised Option B0 scheme with floodplain compensation
Original "Option B" with floodplain
compensation Item
Option 2 (small footprint)
Option 1 (large footprint)
Revised "Option B0" with
floodplain compensation

Thames Water Longdon Marsh Reservoir Company Confidential Report on Flood Pumping and Storage
F1-Rp Longdon Marsh - Report on Flood Pumping and Storage v3_July 2012.doc 26
Each item within the construction cost estimates (see Appendix A) includes estimating allowances to allow for uncertainties in the assumed quantities, rates and design. These allowances are generally consistent with those assumed previously for the floodplain compensation options, except for Item 3.2 (Embankment Fill) where the allowance for design uncertainty has now been revised from 5 to 15% as noted in Section 4.1.2 to allow for uncertainties in the embankment profile design.
6.2.2 Specific risks
In addition to these allowances, the costs of the specific risks identified in Chapter 9 below are estimated in Table 6-3. Note that some of these costs also apply to the original floodplain compensation Option B although they were not previously quantified in the 2010 study report.
Table 6-3 Cost allowances for specific risks
Amount (£million) Specific risk Basis of estimate Revised
Option B0 Option
1 Option 2
Geological risk Cost of 100m wide upstream clay blanket
5.7 5.7 7.5
Water quality (reservoir shape not amenable to mixing)
Raising crest level by: • Provisional estimate: 1m • Maximum case: 3m
1.4
5.4
1.4
5.4
n/a (favourable
aspect ratio)
Water quality (impact of pumping sediment and nutrient rich floodwater)
• Compartmentalisation of reservoir with additional embankment to separate flood storage from normal storage
• Additional inlet/outlet arrangement for flood storage compartment
n/a (pumping could be
suspended during
major flood events)
27.0
27.0
Requirement for additional flood pumping capacity (or for enhanced standby/reliability)
Based on difference in cost between pumping capacity variants A and B. • Provisional estimate: 50% of
difference • Maximum case: 100%
not required
7.6
15.2
4.7
9.5
Requirement for additional flood storage capacity (eg for climate change)
Based on: • Provisional estimate: 50%
extra • Maximum case: 100%
not required
0.5
1.0
2.0
4.0 Total
Provisional estimateMaximum case
7.1 11.1
42.2 54.3
41.2 48.0
6.2.3 Total capital cost
The total combined capital costs, including the construction costs in Table 6-2 and the risk items in Table 6-3 are summarised below in Table 6-4.

Thames Water Longdon Marsh Reservoir Company Confidential Report on Flood Pumping and Storage
F1-Rp Longdon Marsh - Report on Flood Pumping and Storage v3_July 2012.doc 27
Table 6-4 Summary of total capital costs (£million) Option 1 Option 2
flood pumping (large footprint)
flood pumping (small Footprint)
Options with floodplain
compensation Option 1A Option 1B Option 2A Option 2B
Item
(3500Ml/d) (1200Ml/d) (1900Ml/d) (900Ml/d) Revised
Option B0 Original Option B
Total construction cost 533.1 517.9 509.2 499.7 676.6 701.1
Specific risks: Provisional
estimate 42.2 42.2 41.2 41.2 7.1
Maximum case 54.3 54.3 48.0 48.0 11.1
Not deter- mined
Total capital cost:
Provisional estimate
575.3 560.1 550.4 540.9 683.7
Maximum case 587.4 572.2 557.2 547.7 687.7
Not directly compar-
able
6.3 Operating, maintenance and replacement costs
6.3.1 Energy costs
Annual energy consumption for the flood pumping scheme would be as described in Section 4.13.1 of the 2010 study report, but would also include the additional energy required for flood pumping. This has been calculated by assessing the number of historic flood events when the level of the River Severn at Saxons Lode exceeded 11mOD and calculating the average annual volume of flood water and the head which would need to be pumped. On average the flood pumps would only need to be operated for 3.4 days a year and at very much lower pumping rates than the design conditions for a 1 in 100 (1%) AEP flood event. The energy consumption is therefore relatively low compared to the main transfer pumps which would operate against a much higher head on average 79 days a year (plus year round smaller SWOX releases). The annual average flood pumping energy is estimated to be 59MWh for Option 2 and 63 to 65MWh for Option 1A and 1B. Table 6-5 shows how this represents around just 0.2% of the total energy requirements and is therefore considered negligible in terms of overall operating costs.
Table 6-5 Average annual energy consumption
Description Estimated average annual energy consumption (MWh) % of total
Reservoir filling 800 3%
High lift pumping for water transfer 20,236 70%
Reservoir mixing 880 3%
Onward SWOX supply (incl. treatment) 7,400 25%
Flood pumping (maximum assuming Option 1B) 65 0.2%
Total 29,381 100%

Thames Water Longdon Marsh Reservoir Company Confidential Report on Flood Pumping and Storage
F1-Rp Longdon Marsh - Report on Flood Pumping and Storage v3_July 2012.doc 28
Assuming a unit rate of £56 per MWh, the average annual cost of flood pumping is therefore estimated as around £4k, although the actual cost in any one year could be many times this amount depending on the occurrence of major floods. 6.3.2 Operations, maintenance and replacement costs
Compared to the floodplain compensation scheme, the flood pumping scheme would cost more to operate and maintain. An annual budget for such additional costs is estimated at £200k. Whilst the figure quoted may be high for the first few years, spares and maintenance would be needed for this heavy duty equipment over time and an appropriate budget should be allowed. 6.3.3 Present Value OPEX
The total annual OPEX cost of the flood pumping scheme over and above the floodplain compensation scheme is therefore estimated as follows: Energy £4,000 Operations, maintenance and replacement £200,000 Total £204,000 The Present Value (PV) of this, discounted over a 100 year investment period using the discount rates from the Treasury Green Book, is £6.1million. Assuming the same discount factors and a unit rate of electricity of £56 per MWh, the PV energy cost of transferring water to the Thames region is around £34million for all Longdon Marsh options. 6.4 Cost summary
A summary of the capital costs, risk allowances and PV operating costs are presented in Table 6-6. It is concluded that the flood pumping schemes would have a significantly lower cost than the floodplain compensation scheme (Option B0), even with the maximum case risk allowances and the increased operating costs. This is because the capital cost of excavating floodplain compensation is around £111million plus on-costs, whereas the costs for slightly increasing the reservoir storage capacity and installing flood pumps are only a fraction of this. Of the two options considered, Option 2 (small footprint) would be around 4 to 5% lower cost overall and would also be beneficial in terms of reduced land take and general scheme impact.

Thames Water Longdon Marsh Reservoir Company Confidential Report on Flood Pumping and Storage
F1-Rp Longdon Marsh - Report on Flood Pumping and Storage v3_July 2012.doc 29
Table 6-6 Cost summary
Option 1 Option 2 (large footprint) (Small Footprint)
Option 1A Option 1B Option 2A Option 2B Item (3500Ml/d) (1200Ml/d) (1900Ml/d) (900Ml/d)
Revised Option B0
with floodplain compen-
sation
CAPITAL COSTS - £ million
Total capital cost: Provisional
estimate 575.3 560.1 550.4 540.9 683.7
Maximum case 587.4 572.2 557.2 547.7 687.7
PV OPEX COSTS - £ million (see Note 1)
Pumping energy for transferring water to the Thames Region
34.0 34.0 34.0 34.0 34.0
OPEX associated with flood pumping scheme
6.1 6.1 6.1 6.1 0
Total OPEX (see Note 1) 40.1 40.1 40.1 40.1 34.0
TOTALS - £ million
Provisional estimate 615.4 600.2 590.5 581.0 717.7
Maximum case 627.5 612.3 597.3 587.8 721.7
Notes 1./ OPEX estimates exclude other items which are constant for all Longdon Marsh options such as reservoir filling, reservoir mixing, SWOX supply and treatment etc.

Thames Water Longdon Marsh Reservoir Company Confidential Report on Flood Pumping and Storage
F1-Rp Longdon Marsh - Report on Flood Pumping and Storage v3_July 2012.doc 30
7 Environmental and social impacts
7.1 Introduction
The suitability of the Longdon Marsh scheme was previously assessed against various sustainability measures by Cascade Consulting in Chapter 5 of the 2010 study report (Ref. 1). The assessment for the proposals for the floodplain compensation areas was assessed by Cascade Consulting in a separate report. The following section identifies the sustainability measures which may now need to be reassessed in light of the revised options proposed in this report, i.e. the replacement of floodplain compensation with flood pumping and the revised reservoir depth/footprint options. 7.2 Factors affecting reassessment of sustainability measures
7.2.1 Nature conservation and biodiversity
The flood pumping option would score significantly higher against this measure as it would not require the large scale excavation of the existing floodplain over an area of 7 to 10km2
as previously proposed. Option 2 would be better still as the overall footprint of the reservoir would be reduced by approximately half and would avoid Pendock Bank Special Wildlife Site. 7.2.2 Landscape sensitivity
The sensitivity of the landscape is unchanged but the impact of the scheme on the landscape would now be reduced: with Option 1 the embankment would be approximately 7m lower and with Option 2 the reservoir footprint would be approximately half the size. Furthermore, without the need for floodplain compensation, the impact on the banks of Bushley Brook and the River Severn would be avoided. 7.2.3 Visual sensitivity
For Option 1, the visual impact of the embankment would be reduced as its height is now approximately 7m lower. The visual impact of the 4km long 18m high embankment required in Option 2 would however be significant, and extensive landscaping to the inner and outer faces, would probably be required. A specific allowance for the cost of such landscaping is included in the cost estimates (Section 4.1.2). 7.2.4 Floodplain encroachment
Option 1 would be the same as before but for Option 2 the encroachment would be approximately 50% less. 7.2.5 Birdstrike risk
Option 1 would be the same as before but for Option 2 the water surface area would be approximately 50% less and may therefore attract fewer birds. 7.2.6 Availability of construction materials on site
Option 1 would be improved from before as less fill material is required and therefore the borrow pits could be smaller. Option 2 may score worse than before as it requires a greater

Thames Water Longdon Marsh Reservoir Company Confidential Report on Flood Pumping and Storage
F1-Rp Longdon Marsh - Report on Flood Pumping and Storage v3_July 2012.doc 31
volume of embankment fill, although it is still considered likely that sufficient fill could be obtained from local on-site borrow pits.
7.2.7 Variation in topographic levels
This was previously deemed not applicable as the Longdon Marsh reservoir would be constructed within the existing landform. Whilst this remains the case for Option 1, it may now be appropriate to review this measure for Option 2 which requires a longer length of embankment across the middle of the marsh, tying into the ridge along the northern side. 7.2.8 Archaeology and the historic environment
Three Grade II listed buildings lie within the Option 1 reservoir boundary as well as 2 Scheduled Monuments within the immediate setting. The assessment will need to consider how many of these are still affected by the reduced reservoir footprint of Option 2, together with any similar issues in the floodplain compensation storage areas. 7.2.9 Impact of construction on local residents
Over 400 people would be within 300m of the boundary of the Option 1 reservoir site. Within 300m a population of 507 residents has been calculated. These figures exclude the floodplain compensation storage areas which would also need to be considered. With the smaller area affected with Option 2 the population within 300m likely to be less. However, total fill volumes differ substantially – e.g. Option 2 has over 6 times the volume needed for Option 1. Hence on-site construction traffic will be greater. 7.2.10 Impact of construction traffic on local roads
There would be no appreciable difference between the various Longdon Marsh options for the reservoir and pumping station as both primary traffic routes would be used by all options. However, the impact of the floodplain compensation storage areas needs to be considered. 7.2.11 Impact on existing residential properties
2 residential properties and 3 farms are within the Option 1 reservoir site. The assessment will need to consider how many of these are still affected by the reduced reservoir footprint of Option 2, together with any similar issues in the floodplain compensation storage areas. 7.2.12 Impact on existing recreation uses
12 footpaths, 2 bridleways and a Long Distance Trail are within the boundary of the Option 1 reservoir site. The assessment will need to consider how many of these are still affected by the reduced reservoir footprint of Option 2, together with any similar issues in the floodplain compensation storage areas. 7.2.13 People benefiting from provision of a potential recreational resource
The main difference between the various Longdon Marsh options would be the area available for recreational use, which would be approximately one half for Option 2 compared with Option 1.

Thames Water Longdon Marsh Reservoir Company Confidential Report on Flood Pumping and Storage
F1-Rp Longdon Marsh - Report on Flood Pumping and Storage v3_July 2012.doc 32
8 Potential benefits for flood alleviation at Tewkesbury
The Longdon Marsh options utilising pumped flood storage potentially have the capacity to be used in flood events less severe than the design flood conditions to marginally reduce water levels further downstream on the Severn. Operation in this manner would be heavily dependent on the availability and the reliability of a comprehensive flood forecasting system and would reduce the flexibility noted in Section 3.5 to respond to changes in the forecast peak level or timing of flood events. The town of Tewkesbury some 3 km below the Bushley Brook confluence would be the primary beneficiary if such a mode of operation proved to be practical. A comprehensive analysis would require the utilisation of a suitable hydraulic model and an assessment of the changes in economic damages to properties and other receptors. Without further development work the Environment Agency do not consider their current hydraulic models to be suitable for this purpose and so these models have not been made available for this study. However, based on the recorded hydrographs for the Saxons Lode gauging station and an inferred rating curve, we have been able to determine an indication of the likely potential reduction in flood levels in the vicinity of the Bushley Brook confluence for a number of historic flood events. The inferred flood hydrographs are shown on Figure 8.1.
200
300
400
500
600
700
800
900
1000
0 24 48 72 96 120 144 168 192 216 240 264 288 312 336 360 384 408 432 456 480
Time from level at 3.75m on gauge (hours)
Saxo
ns L
ode
infe
rred
flow
(m3 /s
) 1982 Jan
1989 Dec
1990 Feb
1998 Jan
1999 Dec (1)
1999 Dec (2)
2000 Nov
2000 Dec
2007 Jun
2007 Jul
Figure 8.1 Inferred flow hydrographs at Saxons Lode Note: The grid “squares” on this graph represent 4.3 M.m3 of water. The total flood storage provided is 6.9 and 3.6 M.m3 for Options 1 and 2 respectively. The estimates of potential flood level reductions are shown in Table 8-1.

Thames Water Longdon Marsh Reservoir Company Confidential Report on Flood Pumping and Storage
F1-Rp Longdon Marsh - Report on Flood Pumping and Storage v3_July 2012.doc 33
Table 8-1 Indicative potential reductions in flood peaks in historic flood events at Bushley Brook confluence
Flood Event Peak Level at
Saxons Lode Gauge
Approx Peak Flow
Approx annual exceedance probability
Assumed Peak Level in Longdon
Marsh m gauge m3/s m AOD 2007 Jul 5.925 1000 0.5% 13.30 2000 Dec 5.457 764 4% 12.71 2000 Nov 5.393 735 5% 12.64 1990 Feb 5.309 697 7% 12.56 1998 Jan 5.143 627 14% 12.39 2007 Jun 5.115 616 16% 12.37 1982 Jan 5.114 616 16% 12.36 1999 Dec (2) 5.052 591 21% 12.30 1989 Dec 5.019 578 24% 12.27 1999 Dec (1) 4.817 505 54% 12.07
Flood Storage Utilised
"Spare" flood
storage
Potential reduced peak
flow
Potential reduction in
peak flow
Indicative reduction in peak level
M.m3 M.m3 m3/s % m Option 1 2007 Jul 6.9 0.0 0% 2000 Dec 3.7 3.2 729 5% 0.08 2000 Nov 3.4 3.5 709 3% 0.06 1990 Feb 3.0 3.9 664 5% 0.08 1998 Jan 2.4 4.5 592 6% 0.09 2007 Jun 2.2 4.7 559 9% 0.15 1982 Jan 2.2 4.7 568 8% 0.12 1999 Dec (2) 2.0 4.9 545 8% 0.12 1989 Dec 1.8 5.1 550 5% 0.08 1999 Dec (1) 1.2 5.7 455 10% 0.15 Option 2 2007 Jul 3.6 0.0 0% 2000 Dec 2.1 1.5 742 3% 0.05 2000 Nov 1.9 1.7 717 3% 0.04 1990 Feb 1.7 1.9 673 4% 0.06 1998 Jan 1.4 2.2 603 4% 0.06 2007 Jun 1.3 2.3 580 6% 0.09 1982 Jan 1.3 2.3 587 5% 0.07 1999 Dec (2) 1.2 2.4 561 5% 0.08 1989 Dec 1.1 2.5 558 4% 0.05 1999 Dec (1) 0.7 2.9 473 6% 0.09 Note: Flood events shaded and in italics are sequential events, with a subsequent flood peak exceeding the initial event within a few weeks. The indicative estimates of reductions in peak levels should be considered as a theoretical “upper bound” for the following reasons:
• The analysis effectively assumes perfect advance knowledge of the levels and timing of the peak of the flood. It is unlikely that flood forecasting systems would be sufficiently sophisticated to provide this level of certainty. Realistically, operation of the flood pumping system would therefore need to recognise this factor and possibly reserve some flood storage capacity in lesser events to cover this uncertainty.

Thames Water Longdon Marsh Reservoir Company Confidential Report on Flood Pumping and Storage
F1-Rp Longdon Marsh - Report on Flood Pumping and Storage v3_July 2012.doc 34
• Tewkesbury lies at the confluence with the Avon which is a major tributary. The potential percentage reduction in peak flows affecting flooding at Tewkesbury would therefore be less than estimated here, which can be expected to further reduce the indicative reductions in peak levels.
As noted in Section 3.7, a number of these events are sequential events, with a subsequent flood peak exceeding the initial event within a few weeks or less. Any potential benefits as a consequence of reducing water levels during the initial event are likely to be limited to those which may arise during the subsequent flood peak. Overall, it is concluded that the downstream benefits of potential flood alleviation, primarily at Tewkesbury, would be relatively small. For the larger footprint reservoir with Option 1, the potential benefits might be a reduction of up to 12 cm in flood levels at the Bushley Brook confluence, but rather less downstream at Tewkesbury. For the smaller footprint reservoir with Option 2, the corresponding potential reduction is only 8 cm.

Thames Water Longdon Marsh Reservoir Company Confidential Report on Flood Pumping and Storage
F1-Rp Longdon Marsh - Report on Flood Pumping and Storage v3_July 2012.doc 35
9 Risk review
9.1 Flood pumping risk
9.1.1 Reliability of equipment
An inherent risk with the flood pumping scheme is that the flood pumps fail to operate correctly at the time of a major flood event due to mechanical or electrical failure. There are a number of factors which make this risk particularly relevant:
• During a major flood event, when the pumps are needed, there are likely to be power failures, transport disruption and general disorder relating to key infrastructure and communication links.
• Without careful design, maintenance and testing the flood pumps could potentially sit idle for long periods at a time.
• The design life of mechanical and electrical equipment is relatively short compared to the long term nature of the reservoir development (>100years).
As discussed in Section 4.4.3 these risks would be mitigated as far as practicable by including back up generators with sufficient emergency fuel storage. To ensure the flood pumps are not left idle for long periods, the pumping station would be designed so that the flood pumps are used on rotation to routinely fill the reservoir and would undergo a strict schedule of regular resting, operation and maintenance. The whole system would be designed to be operated automatically or remotely in case access to the pumping station was made impossible by flooding. Allowances for all these measures are included in the cost estimate, including a “specific risk” item for increased pump capacity, which could cover enhanced standby/reliability measures. Nevertheless, a flood pumping scheme would not be as foolproof and reliable as floodplain compensation excavations.
9.1.2 Operational rules and flood forecasting
As discussed in Section 3.5, options relying on flood pumping will inherently involve an added level of risk in terms of the development of the necessary operational rules compared with the “fail safe” approach of providing compensation floodplain storage. During a significant flood event, decisions would need to be made on when pumping should commence, at what rate, when that rate should be varied and by how much. Such decisions would need to be based on a live flood forecasting system with regular updates. Major variations between the eventual pattern and timing of the rise to the peak of the flood and the forecasts of that pattern and timing could result in marginally higher peak water levels downstream than would have occurred under natural conditions.
9.1.3 Adapting to climate change
As noted in Section 3.2, new guidance relating to climate change has recently been issued by the Environment Agency (Ref. 8). This states: “Given the long lifetime and high cost of the built environment and many flood and coastal erosion management measures, it is imperative that plans and investment projects take into account, in an appropriate way, the changing risks over the coming century. This includes designing for adaptation to a changing climate where appropriate”. The guidance provides a range of change factors for river flow by River Basin District. Those applicable to the Severn are shown in Table 9-1.

Thames Water Longdon Marsh Reservoir Company Confidential Report on Flood Pumping and Storage
F1-Rp Longdon Marsh - Report on Flood Pumping and Storage v3_July 2012.doc 36
Table 9-1 River flow change factors for adaptation to climate change
Total potential change
anticipated for the 2020s
Total potential change
anticipated for the 2050s
Total potential change
anticipated for the 2080s
H++ extreme scenario 40% 55% 100% Upper end estimate 25% 40% 70% Change factor 10% 20% 25% Lower end estimate -10% -5% 0%
Applying a range of these change factors to the Longdon Marsh floodplain, based on an estimated extrapolation of a stage discharge relationship for the Severn at the Bushley Brook confluence results in the levels and compensation volumes indicated in Table 9-2.
Table 9-2 Compensation storage requirements under climate change scenarios
1 in 100 flood estimate
Compensation storage required (M.m3)
Corresponding top water level (m AOD)
Climate change scenario
Flow (m3/s)
Level (m AOD)
Option 1 Option 2 Option 1 Option 2
Current 910 13.0 5.2 2.8 +20% 1090 13.3 6.9 3.6 22.0 27.0 +25% 1140 13.4 7.5 3.9 22.1 27.1 +70% 1550 14.0 11 5.7 22.4 27.5 +100% 1820 14.3 13 7 22.6 27.8
Note: Options presented earlier in this report are based on the +20% climate change scenario The earlier proposals for flood compensation storage on a “level for level” basis were inherently adaptive to a wide range of change factors since the excavations required also provide significant volumes above the design flood level which would be mobilised in the event of higher river flows and flood levels for the 1 in 100 AEP event as a consequence of more extreme climate change. With the flood pumping options considered in this report, it may be necessary to increase the storage reserved for flood compensation. As indicated in Table 9-2 this could be achieved from the outset by adopting a precautionary approach and increasing the dam height by up to 0.6m (Option 1) or 0.8m (Option 2). Alternatively, an adaptive approach could recognise the possible need for increased flood storage at some point in the future by accepting that in such circumstances the normal maximum operating level (and hence the live storage) could be reduced by a similar amount, leading to a marginal reduction in reservoir deployable output. As indicated in Section 3.4, a more critical factor is the assumed rate of rise of a flood event in Longdon Marsh, which determines the maximum pumping capacity required. With the earlier proposals for flood compensation storage on a “level for level” basis there is effectively no physical constraint on the rate of inflow to the compensation storage. With flood pumping, the maximum pumping capacity determines how rapidly the storage can be filled. Table 9-2 indicates that the extreme +100% climate change scenario requires roughly double the volume compared with the +20% scenario adopted for the current design. To pump this volume over the same period as before (i.e. around 48 hours on the rising limb of the flood) would therefore require a doubling of the pumping capacity. This

Thames Water Longdon Marsh Reservoir Company Confidential Report on Flood Pumping and Storage
F1-Rp Longdon Marsh - Report on Flood Pumping and Storage v3_July 2012.doc 37
could conceivably be installed on an adaptive basis at some point in the future by duplicating the transfer tunnel and flood pumps.
If the pumping system were to be designed from the outset for the extreme rate of rise apparent in the July 2007 flood event then duplication of the transfer tunnel and flood pumps might not in fact be required if there was an improved understanding of the probability of the rate of rise. 9.1.4 Performance during floods exceeding design flows and rates of rise
The performance of the earlier proposals for flood compensation storage on a “level for level” basis during floods exceeding design flows and rates of rise would provide a broadly similar response to the current floodplain. However, with pumped flood storage, the impact of more extreme floods needs to be considered more carefully since both the available flood storage capacity and the maximum pumping rate would be physically constrained. Figure 9.1 shows the estimated frequency of flooding of Longdon Marsh from the Severn, based on currently available data.
Longdon Marsh - Frequency of flooding from River Severn
July 2007 1 in ~180 1:100 EA estimate 13.0m
1.E-04
1.E-03
1.E-02
1.E-01
1.E+00
1.E+01
11.0 11.2 11.4 11.6 11.8 12.0 12.2 12.4 12.6 12.8 13.0 13.2 13.4 13.6 13.8 14.0 14.2
River Severn Level at Bushley Brook Confluence (mAOD)
Ave
rage
ann
ual n
o. o
f flo
od e
vent
s ex
ceed
ing
give
n le
vel
Low FloodsIntermediate FloodsMajor FloodsMajor Floods extrapolatedIntermediate Floods trend lineLow Floods trend lineMajor Floods trend line
Figure 9.1 Estimate of frequency of flooding from Severn From this analysis it can be seen that peak river level in an extreme flood with an AEP of 1 in 10,000 (0.01%) might be expected to be about 14.2 mAOD – i.e. marginally lower than that shown in Table 9-2 for the +100% climate change factor. The deficiency in terms of the volume of flood water pumped into storage would be about 6 M.m3 and 3 M.m3 for Options 1 and 2 respectively. Over an assumed 48 hours for the rising limb the flood (based on the July 2007 flood event which as indicated in Section 3.4 had a rate of rise up to four times that of other recorded floods) this would represent flows of 34 and 17 m3/s respectively. Based on the estimated stage-discharge relationship the peak flow in the Severn to give a peak water level of 14.2 mAOD would be of the order of 1700 m3/s, so the effect of the deficiency of flood storage volume might be to increase flows downstream of the Bushley Brook confluence by perhaps 2% and 1% respectively for Options 1 and 2.

Thames Water Longdon Marsh Reservoir Company Confidential Report on Flood Pumping and Storage
F1-Rp Longdon Marsh - Report on Flood Pumping and Storage v3_July 2012.doc 38
The corresponding increase in water level, assuming no attenuating effect within the existing Severn floodplain, might at most be of the order of 4 cm and 2 cm respectively. For an extreme event with a slower rate of rise, such as would more normally occur, particularly in winter floods, the impact on peak flows and the increase in water levels would be less. The increase in water level is likely to reduce downstream at Tewkesbury, below the Avon confluence. 9.1.5 Temporary flood mitigation during reservoir construction
The mitigation of the impact of the loss of floodplain storage during construction would require careful consideration. The various risk factors and possible means of mitigation are summarised in Table 9-3.
Table 9-3 Temporary flood mitigation during reservoir construction
Possible means of mitigation Risk factor requiring mitigation
Option B0 (compensation
storage)
Option 1 Pumped storage
large footprint
Option 2 Pumped storage
small footprint Floodplain loss due to embankment footprint
Advance construction of some storage areas
Limited scope, but embankment footprint
is relatively small
Advance construction of drainage channel would provide some
compensation storage Flows from local tributaries Leave sections of embankment on existing
watercourses low until diversion tunnel commissioning
Advance construction of drainage channel
Floodplain loss due to reservoir impoundment prior to project commissioning
Advance construction of storage areas
Advance construction of Severn-Longdon tunnel and reservoir tower to allow flood inflow to
reservoir area 9.1.6 Risk allowance for flood pumping and storage capacity
In view of the uncertainties outlined in Sections 9.1.1 to 9.1.4, it is considered prudent to include allowances for these risks as “specific risks” items of the cost estimates based on increasing both the flood pumping capacity and storage capacity (see Section 6.2.2). 9.2 Geological risk
9.2.1 Level of geotechnical investigation
Although the geotechnical investigation carried out for the 1976 study comprised 24 boreholes, the overall level of detail of the investigation was considerably lower than has been undertaken in recent years for other potential major resource developments. Thus a considerable degree of uncertainty attaches to the embankment profile, the quality and quantity of fill material available from the borrow areas and the nature of the embankment foundation and reservoir floor as acknowledged in the 1976 report.
9.2.2 Embankment stability
The embankment profile proposed by Binnie and Partners was adopted unchanged in the 2010 study report. The slopes are based on the relatively high strength characteristics of the intact Keuper Marl. However there remains a risk of the existence of periglacial shear surfaces in the marl which would require a significant flattening of the embankment slopes. The possibility that minor adjustments of the profile may be necessary has been taken into

Thames Water Longdon Marsh Reservoir Company Confidential Report on Flood Pumping and Storage
F1-Rp Longdon Marsh - Report on Flood Pumping and Storage v3_July 2012.doc 39
account in the cost estimates by an increase in the design uncertainty allowance from 5% to 15% but this would not be sufficient to cover the consequences of a more fundamental redesign.
9.2.3 Borrow areas
For Option 1 the total embankment fill requirement is much less than either the 1976 scheme or that of Option B of the 2010 study report, so that adequate fill quantities can be obtained from the identified borrow areas. For Option 2 however the fill requirement would be around 20% greater than before, and greater than the availability of fill from all the identified borrow areas. It is probable that Borrow area D could be extended eastwards as explained in section 4.1.1 above, but until the suitability of this material and the environmental acceptability of such an extension have been determined, the availability of fill material remains a risk.
9.2.4 Reservoir seepage
As noted in the 1976 report, the limited testing carried out at that time showed that the permeability of the reservoir rim and the embankment foundations to be “very variable” resulting in a seepage loss estimated to be 23Ml/d in the absence of any cut off or upstream seepage blanket. This level of seepage may not be significant from a pumping energy point of view, but would require further review in view of issues such as the possibility of particle migration in the complex marl foundation. If seepage needed to be reduced, an upstream blanket as shown in the embankment profile in the Binnie report might reduce this level of seepage by 50%, but may not be a satisfactory solution. No allowance has been made for either a blanket or a cut-off in the estimates because in the absence of adequate geotechnical data the costing of either would be conjectural. An allowance for this risk has been included in the “specific risks” item of the cost estimates (see Section 6.2.2). 9.3 Water quality risk
Section 4 of the 2010 study report (Ref. 1) discussed the reservoir water quality risks of a 125M.m3 capacity reservoir with a maximum water depth of 15m and concluded:
• Average concentrations of nitrate and phosphorous in the River Severn are high. • There would be a high risk of algal blooms in the reservoir, especially in the summer
and autumn. • A reservoir with a smaller volume but with the same area is likely to be more prone
to thermal stratification and less amenable to mixing through circulation than the 125M.m3 reservoir.
• High levels of nutrients and possible algal blooms would constitute a significant water treatment burden for the direct supply element of the scheme.
• As part of a discharge consent, it may be necessary to treat high nutrient water before discharging into the River Thames.
This section of the 2010 study report concludes by recommending that a detailed investigation and study would be necessary to quantify the water quality risk. The risks identified in the 2010 study report, summarised above, apply equally to Option 2 but are considered to be more acute for Option 1 because of the shallow water depth and the consequent increase in stratification risk and ineffectiveness of mixing. The cost of mixing is included in the cost estimates. The risk that these measures may not be effective could be at least partially offset by increasing the water depth above the minimum required;

Thames Water Longdon Marsh Reservoir Company Confidential Report on Flood Pumping and Storage
F1-Rp Longdon Marsh - Report on Flood Pumping and Storage v3_July 2012.doc 40
in effect raising the bottom operating level and the cost of such a raising has been included in the “specific risks” item of the cost estimate (see Section 6.2.2). Furthermore, there is additional risk to water quality associated with pumping flood water into the reservoir which is likely to be laden with sediment and rich in nutrients. As noted in Section 3.1.5), water supply pumped storage reservoirs would not normally be filled during these periods because of the associated detrimental impact on water quality within the reservoir. This is recognised for the unsupported transfer proposal in Section 2.6 of the rebuttal document GARD/3.4 (Ref. 6). However, the proposed flood pumping scheme would require exactly the opposite, potentially exacerbating the other water quality issues at Longdon Marsh. The flood pumping scheme may therefore require additional measures compared to the flood compensation scheme to mitigate the problems of pumping sediment and nutrient rich water into the reservoir. Such measures could include a water treatment works at the site or increased reservoir depth to compensate. The design of such mitigation measures is a complicated and important issue which is beyond the scope of this study. An alternative means of mitigation would be to provide two separate storage compartments in the reservoir which would be formed by the construction of an additional embankment. One compartment would normally be left effectively empty and only used when flood storage compensation was required. The northern part of the reservoir site appears to be the area most suitable for this use. In addition to the embankment, a separate inlet/outlet arrangement from the pumping station, mostly in tunnel, would be required. The cost of this provision has been included in the “specific risks” item of the cost estimate (see Section 6.2.2). If the concept of a separate compartment for flood storage were to be developed further, there may be merit in considering a lower top water level for this compartment and making adjustments to the location of the embankments to maintain the necessary storage volumes. Additionally, the flood storage area could be designed as a permanent wetland feature with occasional flooding. Such creative use of part of the existing Longdon Marsh floodplain and Borrow Area B may provide an opportunity for environmental enhancement. 9.4 Landscape and visual impact
An exhaustive review of the visual impact of another major resource development led to the adoption of various measures to mitigate the impact: undulations in the surface of the inner face and the construction of a number of promontories and lagoons. Such a review on visual impact has not yet been carried out for Longdon Marsh. However the need for similar measures is likely, especially for the long embankment required in Option 2. An allowance to cover this cost has therefore been included as a specific item within the cost estimates (see Section 4.1.2).

Thames Water Longdon Marsh Reservoir Company Confidential Report on Flood Pumping and Storage
F1-Rp Longdon Marsh - Report on Flood Pumping and Storage v3_July 2012.doc 41
10 Comparison and conclusions
10.1 Flood pumping versus floodplain compensation
This study has shown that it is technically feasible to mitigate the loss of natural floodplain caused by development of Longdon Marsh reservoir by creating additional flood storage capacity within the reservoir and using high capacity pumps to lift flood water into it. It is understood based on their Option Note dated May 2010 (Ref. 4) that the Environment Agency would be prepared to accept such an engineered scheme and, if this is the case, then it is concluded that a flood pumping scheme is likely to be a lower cost means of mitigation than level for level floodplain compensation along the banks of Bushley Brook and the River Severn as previously proposed. This report considered two reservoir layout options for the flood pumping scheme. Allowing for risk and long term operating costs, the total costs of these options are estimated to be between £102 and £137million (14 to 19%) less than the revised estimate for the modified floodplain compensation scheme (Option B0). These savings primarily reflect the cost of the floodplain compensation earthworks, as the cost of creating extra flood storage in the reservoir, and installing and operating flood pumps is relatively insignificant in comparison. Although the accuracy of the cost estimates could be refined it would not alter the overall conclusions that the flood pumping scheme is likely to be significantly more cost-effective than floodplain compensation. However, there are greater risks associated with the flood pumping scheme compared to floodplain compensation which, once constructed, is guaranteed to work in any situation. These include reliability of flood pumping equipment, the flexibility to adapt for climate change, the performance during floods exceeding the design event and the temporary case during construction. However appropriate control measures and risk items have been included in the cost estimates and it is concluded that the residual risks do not affect the overall conclusion that flood pumping is a more cost-effective solution than floodplain compensation, if acceptable to the Environment Agency. An optimum solution might combine some areas of floodplain compensation, which can be created on Bushley Brook with relatively small scale excavation and disruption close to the reservoir site together with a lower capacity flood pumping scheme. However, this optimisation is beyond the scope of this study and is only warranted if the Longdon Marsh scheme is to be further developed. 10.2 Reservoir layout option
Of the two reservoir layout options considered in this report, Option 2 (small footprint) is lower by around 4 to 5% in terms of overall cost. It would also be beneficial in terms water quality, reduced land take and general scheme impact and for these reasons it is considered preferable to Option 1. Also, because Option 2 has less encroachment into the natural floodplain, the risks associated with flood pumping are reduced. However there could be problems with obtaining sufficient engineering fill for Option 2 which would need detailed investigation if this scheme is to be pursued. Neither of the options lend themselves particularly well to future reservoir expansion.

Thames Water Longdon Marsh Reservoir Company Confidential Report on Flood Pumping and Storage
F1-Rp Longdon Marsh - Report on Flood Pumping and Storage v3_July 2012.doc 42
The choice of reservoir layout would need to be reviewed depending on the use of the reservoir. In this study it is assumed that the reservoir would only be used to supply the Thames Region but if it was ever developed it may be more logical to make it a combined resource for Thames Water and other water supply companies, in which case the larger footprint may become more attractive. Water quality issues are an important consideration in the layout design at Longdon Marsh and could potentially affect the viability of the scheme, particularly for Options 1 and B0. If the Longdon Marsh reservoir scheme is to be pursued then it is strongly recommended that a detailed study on water quality is carried out. Meanwhile a specific risk item based on the cost of forming a separate reservoir compartment for the potentially low quality water during flood events has been included for the flood pumping options. 10.3 Flood pumping capacity
Of the two sub-options considered for Option 2, relating to the rate of flood rise which the flood pumps should be designed for, it is suggested that Option 2A (sized for the extreme rate of flood rise seen in 2007) is preferable given that the cost difference is less than £10million. This is relatively small compared to the overall scheme costs (less than 2%) and would be required to avoid any adverse impact in a repeat of the 2007 flood event.

Thames Water Longdon Marsh Reservoir Company Confidential Report on Flood Pumping and Storage
F1-Rp Longdon Marsh - Report on Flood Pumping and Storage v3_July 2012.doc 43
11 References
1 Jacobs, September 2010, Severn Thames Transfer – Longdon Marsh Reservoir, • Version 1.7 (latest version but redacted to remove sensitive information for public
issue) • Version 1.6 (slightly earlier but unredacted version)
2 Binnie & Partners, February 1976, Severn – Trent Water Authority; Report on
Longdon Marsh Reservoir, Volume 1 3 Jacobs, September 2010, Severn Thames Transfer – Longdon Marsh Reservoir,
Annex on Floodplain Compensation, Version 1.2 (Final) 4 Environment Agency, Briefing Note: Longdon Marsh, dated 23/09/09 5 Environment Agency, Option Note: Severn to Thames Transfer - Longdon Marsh,
dated 13/05/10 6 GARD/3.4, Rebuttal Proof by John Lawson, 2 June 2010 7 Group Against Reservoir Development (GARD), 28/05/11, GARD comments on
Longdon Marsh flood mitigation specification 8 Environment Agency, Adapting to Climate Change: Advice for Flood and Coastal
Erosion Risk Management Authorities, undated but pdf file dated September 2011 9 Marsh, T. J. and Hannaford, J. (2007) The summer 2007 floods in England and
Wales – a hydrological appraisal. Centre for Ecology & Hydrology. 10 Sanderson M. Changes in the frequency of extreme rainfall events for selected towns
and cities, Met Office report for Ofwat, July 2010.

Thames Water Longdon Marsh Reservoir Company Confidential Report on Flood Pumping and Storage
Appendix A v3.doc
A1
Appendix A – Cost Estimates

Thames Water Longdon Marsh Reservoir Company Confidential Report on Flood Pumping and Storage
Appendix A v3.doc
A2
Longdon Marsh Reservoir - Cost Estimate
COPI Index
Base date Apr 05 149
Flood Pumping Option 1A (Large footprint, extreme rate of flood rise, peak abstraction 3500 Ml/d) Current date Sept 07 161.75
quantities rates design total
1 Enabling works1.1 Services diversion sum 20 15 5 40 10,100,000 1 14,140,000 15,349,9661.2 Demolition sum 25 10 5 40 1,000,000 1 1,400,000 1,519,7991.3 Clearance & recycling sum 17.5 10 2.5 30 1,893,400 1 2,461,420 2,672,045
1.4a TBM for watercourse diversion tunnel and from PS to river sum 15 5 20 7,000,000 1 8,400,000 9,118,7921.4b Watercourse diversion tunnel construction m 25 5 5 35 2,540 8,800 30,173,947 32,755,9461.4c Drainage channel m3 25 5 5 35 1.63 75,000 165,038 179,1601.5 Security sum 17.5 5 2.5 25 450,000 1 562,500 610,6331.6 Site investigations sum 17.5 5 2.5 25 1,500,000 1 1,875,000 2,035,4451.7 Environmental management sum 20 7.5 5 32.5 1,750,000 1 2,318,750 2,517,167
Sub total 61,496,655 66,758,952
2 Floodplain Compensation Not required as flood pumping instead
3 Embankment Earthworks3.1 Trial embankment sum 20 5 2.5 27.5 2,998,300 1 3,822,833 4,149,9543.2 Embankment fill m3 20 13 15 48 4.6 704,000 4,792,832 5,202,9573.3 Provision for landscaping (undulations, lagoons etc) m2 50 5 5 60 12.65 61,091 1,236,693 1,342,5173.4 Slope protection m3 20 5 5 30 30 61,091 2,382,545 2,586,4213.5 Miscellaneous km 20 5 5 30 925,310 4 5,052,193 5,484,512
Sub-contractors overheads and profit (10%) 1,728,710 1,876,636Sub total 19,015,806 20,642,997
4 Tunnels and shafts4.1 Tunnel from tower to PS (4.8m x 400m) m 25 5 5 35 9741 400 5,260,140 5,710,2534.2 Tunnel from PS to river (4.2m x 2.6km) - TBM in Item 1.4a m 25 5 5 35 2,540 2,600 8,915,030 9,677,8934.3 Shafts below tower & river intake sum 25 5 5 35 522515 1 705,395 765,756
Sub total 14,880,565 16,153,902
5 Hydraulic structures5.1 River intake sum 22.5 5 7.5 35 2,927,928 1 3,952,703 4,290,9375.2 Pumping station civil works sum 22.5 5 7.5 35 8,472,308 1 11,437,615 12,416,3375.3 Pumping station E&M equipment (including flood pumps,
electrical supply & back up)sum 20,580,512 1 20,580,512 20,580,512
5.4 Main tower sum 20 5 5 30 5,972,165 1 7,763,814 8,428,1675.5 Secondary towers and culverts sum 20 5 5 30 4,976,428 1 6,469,357 7,022,9425.6 Water mixing sum 20 5 5 30 3,600,000 1 4,680,000 5,080,4705.7 Auxiliary drawdown siphons and channel sum 22.5 5 5 32.5 9,422,830 1 12,485,250 13,553,618
Sub total 67,369,250 71,372,984
6 Roads6.1 Road diversions m 20 5 5 30 1274 6,500 10,765,300 11,686,4926.2 Reservoir access roads m 20 5 5 30 1274 2,100 3,478,020 3,775,6366.3 Reservoir temporary roads m 20 5 5 30 400 11,000 5,720,000 6,209,4636.4 Pipeline access roads m 20 5 5 30 400 5,000 2,600,000 2,822,483
Sub total 22,563,320 24,494,074
7 Longdon to Culham transfer7.1 Longdon Marsh high lift pump station civil included under Item 5.27.2 Longdon Marsh high lift pump station E&M equipment included under Item 5.37.3 Hailes high lift pump station civil sum 15 inc inc 15 2,112,435 1 2,429,300 2,637,1767.4 Hailes high lift pump station E&M equipment sum 15 inc inc 15 2,067,079 1 2,377,141 2,580,5547.5 1400mm Pipeline from Longdon Marsh to Winchcombe summit m 15 inc inc 15 1,120 29,600 38,124,800 41,387,1577.6 Winchcombe summit break pressure tank sum 15 inc inc 15 2,228,571 1 2,562,857 2,782,1617.7 1200mm Pipeline from Winchcombe summit to Culham outfall sum 15 inc inc 15 960 60,900 67,233,600 72,986,8117.8 Culham outfall sum 15 inc inc 15 2,000,000 1 2,300,000 2,496,812
Sub total 115,027,698 124,870,672
8 Delivery system (SWOX supply)8.1 Water treatment civil works sum 11,725,000 12,728,3148.2 Water treatment equipment sum 12,675,000 13,759,6068.3 Winchcombe summit break pressure tank sum 6,325,000 6,866,2338.4 Treated water pipeline sum 8,459,130 9,182,9828.5 Treated water pumping station sum 926,969 1,006,290
Sub total 40,111,099 43,543,425
9 Finishing Works9.1 Miscellaneous sum 22.5 7.5 7.5 37.5 5,300,000 1 7,287,500 7,911,0959.2 Conservation, Access and Recreation sum 25 10 5 40 5,789,000 1 8,104,600 8,798,1149.3 Maintenance works sum 25 10 5 40 500,000 1 700,000 759,8999.4 Renewable energy sum 25 10 5 40 4,418,436 1 6,185,811 6,715,134
Sub total 22,277,911 24,184,242
Total works items 362,742,303 392,021,248
General 36% 130,587,229 141,127,649
Total Construction cost 493,329,532 533,148,898
Notes1 Rates based on April 2005 prices (except Item 5.3). In the last column, costs are escalated from April 2005 to Sept 2007 prices.
estimating allowance (%) AmountUnit
Escalated Amount
(See Note 1)ITEM
QuantityRate(see Note 1)

Thames Water Longdon Marsh Reservoir Company Confidential Report on Flood Pumping and Storage
Appendix A v3.doc
A3
Longdon Marsh Reservoir - Cost Estimate
COPI Index
Base date Apr 05 149
Flood Pumping Option 1B (Large footprint, normal rate of flood rise, peak abstraction 1200 Ml/d) Current date Sept 07 161.75
quantities rates design total
1 Enabling works1.1 Services diversion sum 20 15 5 40 10,100,000 1 14,140,000 15,349,9661.2 Demolition sum 25 10 5 40 1,000,000 1 1,400,000 1,519,7991.3 Clearance & recycling sum 17.5 10 2.5 30 1,893,400 1 2,461,420 2,672,0451.4a TBM for watercourse diversion tunnel and from PS to river sum 15 5 20 7,000,000 1 8,400,000 9,118,7921.4b Watercourse diversion tunnel construction m 25 5 5 35 2,540 8,800 30,173,947 32,755,9461.4c Drainage channel m3 25 5 5 35 1.63 75,000 165,038 179,1601.5 Security sum 17.5 5 2.5 25 450,000 1 562,500 610,6331.6 Site investigations sum 17.5 5 2.5 25 1,500,000 1 1,875,000 2,035,4451.7 Environmental management sum 20 7.5 5 32.5 1,750,000 1 2,318,750 2,517,167
Sub total 61,496,655 66,758,952
2 Floodplain Compensation Not required as flood pumping instead
3 Embankment Earthworks3.1 Trial embankment sum 20 5 2.5 27.5 2,998,300 1 3,822,833 4,149,9543.2 Embankment fill m3 20 13 15 48 4.6 704,000 4,792,832 5,202,9573.3 Provision for landscaping (undulations, lagoons etc) m2 50 5 5 60 12.65 61,091 1,236,693 1,342,5173.4 Slope protection m3 20 5 5 30 30 61,091 2,382,545 2,586,4213.5 Miscellaneous km 20 5 5 30 925,310 4 5,052,193 5,484,512
Sub-contractors overheads and profit (10%) 1,728,710 1,876,636Sub total 19,015,806 20,642,997
4 Tunnels and shafts4.1 Tunnel from tower to PS (4.8m x 400m) m 25 5 5 35 9741 400 5,260,140 5,710,2534.2 Tunnel from PS to river (4.2m x 2.6km) - TBM in Item 1.4a m 25 5 5 35 2,540 2,600 8,915,030 9,677,8934.3 Shafts below tower & river intake sum 25 5 5 35 522515 1 705,395 765,756
Sub total 14,880,565 16,153,902
5 Hydraulic structures5.1 River intake sum 22.5 5 7.5 35 1,951,952 1 2,635,135 2,860,6255.2 Pumping station civil works sum 22.5 5 7.5 35 5,648,205 1 7,625,077 8,277,5585.3 Pumping station E&M equipment (including flood pumps,
electrical supply & back up)sum 14,904,239 1 14,904,239 14,904,239
5.4 Main tower sum 20 5 5 30 5,972,165 1 7,763,814 8,428,1675.5 Secondary towers and culverts sum 20 5 5 30 4,976,428 1 6,469,357 7,022,9425.6 Water mixing sum 20 5 5 30 3,600,000 1 4,680,000 5,080,4705.7 Auxiliary drawdown siphons and channel sum 22.5 5 5 32.5 9,422,830 1 12,485,250 13,553,618
Sub total 56,562,872 60,127,620
6 Roads6.1 Road diversions m 20 5 5 30 1274 6,500 10,765,300 11,686,4926.2 Reservoir access roads m 20 5 5 30 1274 2,100 3,478,020 3,775,6366.3 Reservoir temporary roads m 20 5 5 30 400 11,000 5,720,000 6,209,4636.4 Pipeline access roads m 20 5 5 30 400 5,000 2,600,000 2,822,483
Sub total 22,563,320 24,494,074
7 Longdon to Culham transfer7.1 Longdon Marsh high lift pump station civil included under Item 5.27.2 Longdon Marsh high lift pump station E&M equipment included under Item 5.37.3 Hailes high lift pump station civil sum 15 inc inc 15 2,112,435 1 2,429,300 2,637,1767.4 Hailes high lift pump station E&M equipment sum 15 inc inc 15 2,067,079 1 2,377,141 2,580,5547.5 1400mm Pipeline from Longdon Marsh to Winchcombe summit m 15 inc inc 15 1,120 29,600 38,124,800 41,387,1577.6 Winchcombe summit break pressure tank sum 15 inc inc 15 2,228,571 1 2,562,857 2,782,1617.7 1200mm Pipeline from Winchcombe summit to Culham outfall sum 15 inc inc 15 960 60,900 67,233,600 72,986,8117.8 Culham outfall sum 15 inc inc 15 2,000,000 1 2,300,000 2,496,812
Sub total 115,027,698 124,870,672
8 Delivery system (SWOX supply)8.1 Water treatment civil works sum 11,725,000 12,728,3148.2 Water treatment equipment sum 12,675,000 13,759,6068.3 Winchcombe summit break pressure tank sum 6,325,000 6,866,2338.4 Treated water pipeline sum 8,459,130 9,182,9828.5 Treated water pumping station sum 926,969 1,006,290
Sub total 40,111,099 43,543,425
9 Finishing Works9.1 Miscellaneous sum 22.5 7.5 7.5 37.5 5,300,000 1 7,287,500 7,911,0959.2 CAR sum 25 10 5 40 5,789,000 1 8,104,600 8,798,1149.3 Maintenance works sum 25 10 5 40 500,000 1 700,000 759,8999.4 Renewable energy sum 25 10 5 40 4,418,436 1 6,185,811 6,715,134
Sub total 22,277,911 24,184,242
Total works items 351,935,925 380,775,884
General 36% 126,696,933 137,079,318
Total Construction cost 478,632,857 517,855,203
Notes1 Rates based on April 2005 prices (except Item 5.3). In the last column, costs are escalated from April 2005 to Sept 2007 prices.
estimating allowance (%) AmountUnit
Escalated Amount
(See Note 1)ITEM
QuantityRate(see Note 1)
Thames Water Longdon Marsh Reservoir Company Confidential Report on Flood Pumping and Storage
Appendix A v3.doc
A4
Longdon Marsh Reservoir - Cost Estimate
COPI Index
Base date Apr 05 149
Flood Pumping Option 2A (Small footprint, extreme rate of flood rise, peak abstraction 1900 Ml/d) Current date Sept 07 161.75
quantities rates design total
1 Enabling works1.1 Services diversion sum 20 15 5 40 5,050,000 1 7,070,000 7,674,9831.2 Demolition sum 25 10 5 40 500,000 1 700,000 759,8991.3 Clearance & recycling sum 17.5 10 2.5 30 946,700 1 1,230,710 1,336,0221.4a TBM for tunnel from PS to river sum 15 5 20 7,000,000 1 8,400,000 9,118,7921.4b Watercourse diversion tunnel not required1.4c Drainage channel m3 25 5 5 35 1.63 120,000 264,060 286,6561.5 Security sum 17.5 5 2.5 25 450,000 1 562,500 610,6331.6 Site investigations sum 17.5 5 2.5 25 1,500,000 1 1,875,000 2,035,4451.7 Environmental management sum 20 7.5 5 32.5 1,750,000 1 2,318,750 2,517,167
Sub total 22,421,020 24,339,597
2 Floodplain Compensation Not required as flood pumping instead
3 Embankment Earthworks3.1 Trial embankment sum 20 5 2.5 27.5 2,998,300 1 3,822,833 4,149,9543.2 Embankment fill m3 20 13 15 48 4.6 4,615,126 31,419,778 34,108,3833.3 Provision for landscaping (undulations, lagoons etc) m2 50 5 5 60 12.65 184,211 3,729,068 4,048,1663.4 Slope protection m3 20 5 5 30 30 184,211 7,184,211 7,798,9673.5 Miscellaneous km 20 5 5 30 925,310 6 6,615,967 7,182,099
Sub-contractors overheads and profit (10%) 5,277,186 5,728,757Sub total 58,049,041 63,016,325
4 Tunnels and shafts4.1 Tunnel from tower to PS (4.8m x 400m) m 25 5 5 35 9741 400 5,260,140 5,710,2534.2 Tunnel from PS to river (4.2m x 2.6km) - TBM in Item 1.4a m 25 5 5 35 2,540 2,600 8,915,030 9,677,8934.3 Shafts below tower & river intake sum 25 5 5 35 522515 1 705,395 765,756
Sub total 14,880,565 16,153,902
5 Hydraulic structures5.1 River intake sum 22.5 5 7.5 35 2,537,538 1 3,425,676 3,718,8125.2 Pumping station civil works sum 22.5 5 7.5 35 7,342,667 1 9,912,600 10,760,8265.3 Pumping station E&M equipment (including flood pumps,
electrical supply & back up)sum 18,499,350 1 18,499,350 18,499,350
5.4 Main tower sum 20 5 5 30 8,531,664 1 11,091,163 12,040,2395.5 Secondary towers and culverts sum 20 5 5 30 3,554,592 1 4,620,969 5,016,3875.6 Water mixing sum 20 5 5 30 2,700,000 1 3,510,000 3,810,3525.7 Auxiliary drawdown siphons and channel not required
Sub total 51,059,757 53,845,967
6 Roads6.1 Road diversions m 20 5 5 30 1274 6,500 10,765,300 11,686,4926.2 Reservoir access roads m 20 5 5 30 1274 2,100 3,478,020 3,775,6366.3 Reservoir temporary roads m 20 5 5 30 400 11,000 5,720,000 6,209,4636.4 Pipeline access roads m 20 5 5 30 400 5,000 2,600,000 2,822,483
Sub total 22,563,320 24,494,074
7 Longdon to Culham transfer7.1 Longdon Marsh high lift pump station civil included under Item 5.27.2 Longdon Marsh high lift pump station E&M equipment included under Item 5.37.3 Hailes high lift pump station civil sum 15 inc inc 15 2,112,435 1 2,429,300 2,637,1767.4 Hailes high lift pump station E&M equipment sum 15 inc inc 15 2,067,079 1 2,377,141 2,580,5547.5 1400mm Pipeline from Longdon Marsh to Winchcombe summit m 15 inc inc 15 1,120 29,600 38,124,800 41,387,1577.6 Winchcombe summit break pressure tank sum 15 inc inc 15 2,228,571 1 2,562,857 2,782,1617.7 1200mm Pipeline from Winchcombe summit to Culham outfall sum 15 inc inc 15 960 60,900 67,233,600 72,986,8117.8 Culham outfall sum 15 inc inc 15 2,000,000 1 2,300,000 2,496,812
Sub total 115,027,698 124,870,672
8 Delivery system (SWOX supply)8.1 Water treatment civil works sum 11,725,000 12,728,3148.2 Water treatment equipment sum 12,675,000 13,759,6068.3 Winchcombe summit break pressure tank sum 6,325,000 6,866,2338.4 Treated water pipeline sum 8,459,130 9,182,9828.5 Treated water pumping station sum 926,969 1,006,290
Sub total 40,111,099 43,543,425
9 Finishing Works9.1 Miscellaneous sum 22.5 7.5 7.5 37.5 5,300,000 1 7,287,500 7,911,0959.2 Conservation, Access and Recreation (CAR) sum 25 10 5 40 5,789,000 1 8,104,600 8,798,1149.3 Maintenance works sum 25 10 5 40 500,000 1 700,000 759,8999.4 Renewable energy sum 25 10 5 40 4,418,436 1 6,185,811 6,715,134
Sub total 22,277,911 24,184,242
Total works items 346,390,411 374,448,203
General 36% 124,700,548 134,801,353
Total Construction cost 471,090,959 509,249,557
Notes1 Rates based on April 2005 prices (except Item 5.3). In the last column, costs are escalated from April 2005 to Sept 2007 prices.
estimating allowance (%) AmountUnit
Escalated Amount
(See Note 1)ITEM
QuantityRate(see Note 1)

Thames Water Longdon Marsh Reservoir Company Confidential Report on Flood Pumping and Storage
Appendix A v3.doc
A5
Longdon Marsh Reservoir - Cost Estimate
COPI Index
Base date Apr 05 149
Flood Pumping Option 2B (Small footprint, normal rate of flood rise, peak abstraction 900 Ml/d) Current date Sept 07 161.75
quantities rates design total
1 Enabling works1.1 Services diversion sum 20 15 5 40 5,050,000 1 7,070,000 7,674,9831.2 Demolition sum 25 10 5 40 500,000 1 700,000 759,8991.3 Clearance & recycling sum 17.5 10 2.5 30 946,700 1 1,230,710 1,336,0221.4a TBM for tunnel from PS to river sum 15 5 20 7,000,000 1 8,400,000 9,118,7921.4b Watercourse diversion tunnel not required1.4c Drainage channel m3 25 5 5 35 1.63 120,000 264,060 286,6561.5 Security sum 17.5 5 2.5 25 450,000 1 562,500 610,6331.6 Site investigations sum 17.5 5 2.5 25 1,500,000 1 1,875,000 2,035,4451.7 Environmental management sum 20 7.5 5 32.5 1,750,000 1 2,318,750 2,517,167
Sub total 22,421,020 24,339,597
2 Floodplain Compensation Not required as flood pumping instead
3 Embankment Earthworks3.1 Trial embankment sum 20 5 2.5 27.5 2,998,300 1 3,822,833 4,149,9543.2 Embankment fill m3 20 13 15 48 4.6 4,615,126 31,419,778 34,108,3833.3 Provision for landscaping (undulations, lagoons etc) m2 50 5 5 60 12.65 184,211 3,729,068 4,048,1663.4 Slope protection m3 20 5 5 30 30 184,211 7,184,211 7,798,9673.5 Miscellaneous km 20 5 5 30 925,310 6 6,615,967 7,182,099
Sub-contractors overheads and profit (10%) 5,277,186 5,728,757Sub total 58,049,041 63,016,325
4 Tunnels and shafts4.1 Tunnel from tower to PS (4.8m x 400m) m 25 5 5 35 9,741 400 5,260,140 5,710,2534.2 Tunnel from PS to river (4.2m x 2.6km) - TBM in Item 1.4a m 25 5 5 35 2,540 2,600 8,915,030 9,677,8934.3 Shafts below tower & river intake sum 25 5 5 35 522,515 1 705,395 765,756
Sub total 14,880,565 16,153,902
5 Hydraulic structures5.1 River intake sum 22.5 5 7.5 35 1,951,952 1 2,635,135 2,860,6255.2 Pumping station civil works sum 22.5 5 7.5 35 5,648,205 1 7,625,077 8,277,5585.3 Pumping station E&M equipment (including flood pumps,
electrical supply & back up)sum 14,826,928 1 14,826,928 14,826,928
5.4 Main tower sum 20 5 5 30 8,531,664 1 11,091,163 12,040,2395.5 Secondary towers and culverts sum 20 5 5 30 3,554,592 1 4,620,969 5,016,3875.6 Water mixing sum 20 5 5 30 2,700,000 1 3,510,000 3,810,3525.7 Auxiliary drawdown siphons and channel not required
Sub total 44,309,272 46,832,090
6 Roads6.1 Road diversions m 20 5 5 30 1274 6,500 10,765,300 11,686,4926.2 Reservoir access roads m 20 5 5 30 1274 2,100 3,478,020 3,775,6366.3 Reservoir temporary roads m 20 5 5 30 400 11,000 5,720,000 6,209,4636.4 Pipeline access roads m 20 5 5 30 400 5,000 2,600,000 2,822,483
Sub total 22,563,320 24,494,074
7 Longdon to Culham transfer7.1 Longdon Marsh high lift pump station civil included under Item 5.27.2 Longdon Marsh high lift pump station E&M equipment included under Item 5.37.3 Hailes high lift pump station civil sum 15 inc inc 15 2,112,435 1 2,429,300 2,637,1767.4 Hailes high lift pump station E&M equipment sum 15 inc inc 15 2,067,079 1 2,377,141 2,580,5547.5 1400mm Pipeline from Longdon Marsh to Winchcombe summit m 15 inc inc 15 1,120 29,600 38,124,800 41,387,1577.6 Winchcombe summit break pressure tank sum 15 inc inc 15 2,228,571 1 2,562,857 2,782,1617.7 1200mm Pipeline from Winchcombe summit to Culham outfall sum 15 inc inc 15 960 60,900 67,233,600 72,986,8117.8 Culham outfall sum 15 inc inc 15 2,000,000 1 2,300,000 2,496,812
Sub total 115,027,698 124,870,672
8 Delivery system (SWOX supply)8.1 Water treatment civil works sum 11,725,000 12,728,3148.2 Water treatment equipment sum 12,675,000 13,759,6068.3 Winchcombe summit break pressure tank sum 6,325,000 6,866,2338.4 Treated water pipeline sum 8,459,130 9,182,9828.5 Treated water pumping station sum 926,969 1,006,290
Sub total 40,111,099 43,543,425
9 Finishing Works9.1 Miscellaneous sum 22.5 7.5 7.5 37.5 5,300,000 1 7,287,500 7,911,0959.2 CAR sum 25 10 5 40 5,789,000 1 8,104,600 8,798,1149.3 Maintenance works sum 25 10 5 40 500,000 1 700,000 759,8999.4 Renewable energy sum 25 10 5 40 4,418,436 1 6,185,811 6,715,134
Sub total 22,277,911 24,184,242
Total works items 339,639,925 367,434,326
General 36% 122,270,373 132,276,357
Total Construction cost 461,910,299 499,710,684
Notes1 Rates based on April 2005 prices (except Item 5.3). In the last column, costs are escalated from April 2005 to Sept 2007 prices.
estimating allowance (%) AmountUnit
Escalated Amount
(See Note 1)ITEM
QuantityRate(see Note 1)

Thames Water Longdon Marsh Reservoir Company Confidential Report on Flood Pumping and Storage
Appendix A v3.doc
A6
Longdon Marsh Reservoir - Cost Estimate
COPI Index
Base date Apr 05 149
Floodplain Compensation Option B0 (Large footprint, peak abstraction 350 Ml/d) Current date Sept 07 161.75
quantities rates design total
1 Enabling works1.1 Services diversion sum 20 15 5 40 10,100,000 1 14,140,000 15,349,9661.2 Demolition sum 25 10 5 40 1,000,000 1 1,400,000 1,519,7991.3 Clearance & recycling sum 17.5 10 2.5 30 1,893,400 1 2,461,420 2,672,0451.4a TBM for watercourse diversion tunnel and from PS to river sum 15 5 20 7,000,000 1 8,400,000 9,118,7921.4b Watercourse diversion tunnel construction m 25 5 5 35 2,540 8,800 30,173,947 32,755,9461.4c Drainage channel m3 25 5 5 35 1.63 75,000 165,038 179,1601.5 Security sum 17.5 5 2.5 25 450,000 1 562,500 610,6331.6 Site investigations sum 17.5 5 2.5 25 1,500,000 1 1,875,000 2,035,4451.7 Environmental management sum 20 7.5 5 32.5 1,750,000 1 2,318,750 2,517,167
Sub total 61,496,655 66,758,952
2 Floodplain Compensation (minimum slope at 1:500)2.1 Strip Topsoil to stockpile m3 30 1.75 1,568,540 3,568,429 3,873,7812.1 Excavate subsoil and place directly on disposal areas m3 30 2.26 23,896,076 70,206,671 76,214,2892.1 Strip Topsoil and place directly on completed areas m3 30 2.07 3,137,080 8,441,882 9,164,2582.1 Place Topsoil from stockpiles on completed areas m3 30 1.75 1,568,540 3,568,429 3,873,7812.1 Grass m2 15 0.25 14,116,860 4,058,597 4,405,8932.1 Planting ha 15 10000 157 1,803,821 1,958,1752.1 Fencing m 7.5 20 51,900 1,115,850 1,211,3342.1 Land drains on flood storage areas only ha 20 3000 1,023 3,682,800 3,997,9392.1 Recreate water courses sum 7.5 223091 1 239,823 260,3452.1 Conservation, Access and Recreation prov sum 25 5000000 1 6,250,000 6,784,815
Sub total 102,936,302 111,744,609
3 Embankment Earthworks3.1 Trial embankment sum 20 5 2.5 27.5 2,998,300 1 3,822,833 4,149,9543.2 Embankment fill m3 20 13 5 38 4.6 1,122,899 7,128,163 7,738,1233.3 Provision for landscaping (undulations, lagoons etc) m2 50 5 5 60 12.65 81,455 1,648,931 1,790,0313.4 Slope protection m3 20 5 5 30 30 81,455 3,176,727 3,448,5613.5 Miscellaneous km 20 5 5 30 925,310 4 5,052,193 5,484,512
Sub-contractors overheads and profit (10%) 2,082,885 2,261,118Sub total 22,911,731 24,872,299
4 Tunnels and shafts4.1 Tunnel from tower to PS (4.8m x 400m) m 25 5 5 35 9741 400 5,260,140 5,710,2534.2 Tunnel from PS to river (4.2m x 2.6km) m 25 5 5 35 2,540 2,600 8,915,030 9,677,8934.3 Shafts below tower & river intake sum 25 5 5 35 522,515 1 705,395 765,756
Sub total 14,880,565 16,153,902
5 Hydraulic structures5.1 River intake sum 22.5 5 7.5 35 1,951,952 1 2,635,135 2,860,6255.2 Pumping station civil works sum 22.5 5 7.5 35 5,648,205 1 7,625,077 8,277,5585.3 Pumping station E&M equipment sum 13,429,280 1 13,429,280 13,429,2805.4 Main tower sum 20 5 5 30 6,825,331 1 8,872,931 9,632,1915.5 Secondary towers and culverts sum 20 5 5 30 5,687,346 1 7,393,550 8,026,2205.6 Water mixing sum 20 5 5 30 3,600,000 1 4,680,000 5,080,4705.7 Auxiliary drawdown siphons and channel sum 22.5 5 5 32.5 9,422,830 1 12,485,250 13,553,618
Sub total 57,121,223 60,859,963
6 Roads6.1 Road diversions m 20 5 5 30 1274 6,500 10,765,300 11,686,4926.2 Reservoir access roads m 20 5 5 30 1274 2,100 3,478,020 3,775,6366.3 Reservoir temporary roads m 20 5 5 30 400 11,000 5,720,000 6,209,4636.4 Pipeline access roads m 20 5 5 30 400 5,000 2,600,000 2,822,483
Sub total 22,563,320 24,494,074
7 Longdon to Culham transfer7.1 Longdon Marsh high lift pumpstation civil included under Item 5.27.2 Longdon Marsh high lift pumpstation E&M equipment included under Item 5.37.3 Hailes high lift pumpstation civil sum 15 inc inc 15.0 2,112,435 1 2,429,300 2,637,1767.4 Hailes high lift pumpstation E&M equipment sum 15 inc inc 15.0 2,067,079 1 2,377,141 2,580,5547.5 1400mm Pipeline from Longdon Marsh to Winchcombe summit m 15 inc inc 15.0 1,120 29,600 38,124,800 41,387,1577.6 Winchcombe summit break pressure tank sum 15 inc inc 15.0 2,228,571 1 2,562,857 2,782,1617.7 1200mm Pipeline from Winchcombe summit to Culham outfall sum 15 inc inc 15 960 60,900 67,233,600 72,986,8117.8 Culham outfall sum 15 inc inc 15 2,000,000 1 2,300,000 2,496,812
Sub total 115,027,698 124,870,672
8 Delivery system (SWOX supply)8.1 Water treatment civil works sum 11,725,000 12,728,3148.2 Water treatment equipment sum 12,675,000 13,759,6068.3 Wastewater treatment & disposal sum 6,325,000 6,866,2338.4 Treated water pipeline sum 8,459,130 9,182,9828.5 Treated water pumping station sum 926,969 1,006,290
Sub total 40,111,099 43,543,425
9 Finishing Works9.1 Miscellaneous sum 22.5 7.5 7.5 37.5 5,300,000 1 7,287,500 7,911,0959.2 Conservation, Access and Recreation sum 25 10 5 40 5,789,000 1 8,104,600 8,798,1149.3 Maintenance works sum 25 10 5 40 500,000 1 700,000 759,8999.4 Renewable energy sum 25 10 5 40 4,418,436 1 6,185,811 6,715,134
Sub total 22,277,911 24,184,242
Total works items 459,326,503 497,482,138
General 36% 165,357,541 179,093,570
Total Construction cost 624,684,044 676,575,707
Notes1 Rates based on April 2005 prices (except Item 5.3). In the last column, costs are escalated from April 2005 to Sept 2007 prices.
AmountUnit
Escalated Amount
(See Note 1)ITEM
QuantityRate(see Note 1)
estimating allowance (%)


