28
A FAA's Fiscal Year 2011 Summary of Performance and Financial Information Evolving Technology. Advancing Aviation.
A
FAA's Fiscal Year 2011
Summary of Performance and Financial Information
Evolving Technology. Advancing Aviation.

Our MissionOur continuing mission is to provide the safest, most efficient aerospace system in the world.
Our Strategic Goals and Objectives
INCREASED SAFETYReduce Commercial Air Carrier Fatalities
Reduce General Aviation Fatalities
Reduce the Risk of Runway Incursions
Ensure the Safety of Commercial Space Launches
Enhance the Safety of the FAA’s Air Traffic System
Implement a Safety Management System for the FAA
GREATER CAPACITYIncrease Capacity to Meet Projected Demand
and Reduce Congestion
Increase Reliability and On-Time Performance of Scheduled Carriers
Address Environmental Issues Associated with Capacity Enhancements
INTERNATIONAL LEADERSHIPPromote Improved Safety and Regulatory Oversight
in Cooperation with Bilateral, Regional, and Multilateral Aviation Partners
Promote Seamless Operations Around the Globe in Cooperation with Bilateral, Regional, and Multilateral Aviation Partners
ORGANIZATIONAL EXCELLENCEImplement Human Resource Management Practices to Attract
and Retain Highly Skilled, Diverse Workforce and Provide Employees a Safe, Positive Work Environment
Improve Financial Management While Delivering Quality Customer Service
Make Decisions Based on Reliable Data to Improve Our Overall Performance and Customer Satisfaction
Enhance Our Ability to Respond to Crises Rapidly and Effectively, Including Security-Related Threats and Natural Disasters. The FAA’s current workforce of 48,262 employees includes
more than 15,000 controllers, handling an average of 69,500 flights daily. This year is the 75th anniversary of the air traffic control system, which began in 1936 with three traffic control centers, managed by just 15 controllers. The air traffic control system is key to the FAA’s success in providing the safest and most efficient aerospace system in the world.

TABLE OF CONTENTS
A MESSAGE FROM THE ADMINISTRATOR ________________ 2
MANAGEMENT’S DISCUSSION AND ANALYSIS ___________ 6
PERFORMANCE HIGHLIGHTS __________________________ 9
A MESSAGE FROM THE CHIEF FINANCIAL OFFICER ______ 17
FINANCIAL HIGHLIGHTS ______________________________ 18
ABOUT THIS REPORT
This report summarizes the Federal Aviation Administration’s (FAA) more detailed Performance and Accountability Report (PAR). As an agency within the U.S. Department of Transportation (DOT), the FAA is not required to prepare a separate PAR or summary report. However, to demonstrate accountability, we choose to present our performance, management, and financial information, using the same statutory and guidance framework as that used by the DOT in its reporting. In some cases, however, we may depart from the format required of Chief Financial Officers Act agencies.
This report and reports from prior years are available on the FAA Web site atwww.faa.gov/about/plans_reports/#performance.
FAA AT A GLANCE
ESTABLISHED ____________________ 1958
HEADQUARTERS __________________ 800 Independence Avenue, SW Washington, DC 20591 www.faa.gov
FY 2011 BUDGET __________________ $15.929 billion (enacted)
TOTAL EMPLOYEES _______________ 48,262 employees
HEADQUARTERS __________________ 3,932 employees
REGIONAL AND FIELD OFFICES _____ 39,204 employees
TECHNICAL CENTER ______________ 1,518 employees Atlantic City, NJ
AERONAUTICAL CENTER __________ 3,608 employees Oklahoma City, OK
FY 2011 PASSENGERS ON U.S. CARRIERS ________________ 730.4 million (estimate)
FY 2011 TOWER OPERATIONS ______ 50.8 million arrivals and departures (estimate)
2
A Message from the Administrator
This year we are celebrating the 75th anniversary of U.S. air traffic control. From the earliest years, the FAA’s mission has been to provide the safest, most efficient aerospace system in the world. We proudly continue that mission today.
Civil aviation in the United States has grown dramatically since 1936, when the Bureau of Air Commerce began operation of three air traffic control centers with a total of 15 employees. Last year, despite a challenging economic environment, 730 million passengers flew on U.S. airlines. With a projection of one billion passengers boarding commercial airliners by 2021, we will continue to look for ways to improve the air traffic control system and enhance safety.
This is a time of great innovation in the aviation industry. We are transforming into the Next Generation Air Transportation System, or NextGen. Just as radar revolutionized air traffic control in the 1950s, NextGen is revolutionizing air traffic control now. It is the next milestone in aviation innovation that will bring us greater advances in safety and flexibility, while reducing aviation's environmental footprint.
When people hear NextGen, they may think of the far-off future, but NextGen is happening now. Several operators are taking advantage of NextGen technologies to fly more direct flight paths, reduce taxi times, reduce flight time, save fuel, and lower greenhouse gas emissions. These efforts and others are discussed in more detail on our Web site at http://www.faa.gov/nextgen.
We are working on many fronts to secure the funding that we need to deliver the policies, procedures, and infrastructure that will take us into the aviation system of tomorrow. If we delay infrastructure investments today, the long-term cost to our Nation—to our passengers and our environment—will far exceed the cost of going forward with the technology now. The FAA needs longer-term funding to better plan improvements that will help us maintain our aviation system as the largest and safest in the world.
In FY 2011, we remained committed to safety, increased capacity and NextGen, international leadership, organizational excellence, and environmental responsibility. Our future challenges include:
nn FAA REAUTHORIZATION. The FAA has had 22 short-term extensions over the last three and a half years. It is very difficult to run an agency when you are budgeting for weeks, not years. We need the restoration of predictable long-term funding for aviation programs. A multi-year reauthorization is critical to the smooth and efficient operation of our air transportation system and also helps keep costs down.
J. RANDOLPH BABBITTADMINISTRATOR

A Message from the Administrator
33
nn MOVING FORWARD WITH NEXTGEN. As we continue to implement NextGen, we recognize that it is imperative for both Government and industry to participate in defining what NextGen success looks like and how we will know that we have achieved it. To that end, the FAA created a broad-based panel of industry experts—the NextGen Advisory Committee—to collaborate with us on establishing high-level performance measures and helping us produce the best results from our investments. The agency’s path for future NextGen improvements was updated in March with the annual update to the 2011 NextGen Implementation Plan (www.faa.gov/nextgen).
nn FOUNDATION FOR SUCCESS. An external group presented its findings in 2011 on how we could position the agency for success in light of the fiscal challenges that we face. The group found we have high-caliber, experienced, and motivated employees and leadership. It also identified several opportunities for improvement. These include improving internally shared services, transforming and upgrading our human resources model, and successfully implementing NextGen. A NextGen office that reports to the Deputy Administrator, in addition to other organizational changes that improve efficiency, will help the FAA meet the needs of our Nation’s air transportation system.
Our FY 2011 summary report provides highlights of our performance and financial management to both the flying public and the aviation industry. Our strategic plan—the current Flight Plan—focuses our performance on the top agency targets that position us to meet the future successfully. We achieved 27 out of the 29 goals listed in the Flight Plan.
While we are pleased with our FY 2011 accomplishments, we recognize we must move forward in planning for the future. Beginning in FY 2012, Destination 2025 will replace the FAA’s Flight Plan 2009-2013 as the agency’s map to the years ahead, including our outcomes or goals, strategies, and performance metrics.
We are proud to have received an unqualified opinion with no material weakness from our auditors on our FY 2011 financial statements. We issued an unqualified statement of assurance and can state that the financial and performance data are reliable and complete.
We are working in a difficult budgetary environment. That means we will prioritize even more as we go forward. We will carefully choose and deliver the technologies and programs that will help us improve safety. We will continue to be careful stewards of the tax dollars we receive. This report is a clear indication that we take this responsibility very seriously.
J. Randolph BabbittAdministratorNovember 9, 2011
Federal Aviation Administration | Fiscal Year 2011 Summary of Performance and Financial Information4
NextGen: A Revolution in Air Travel
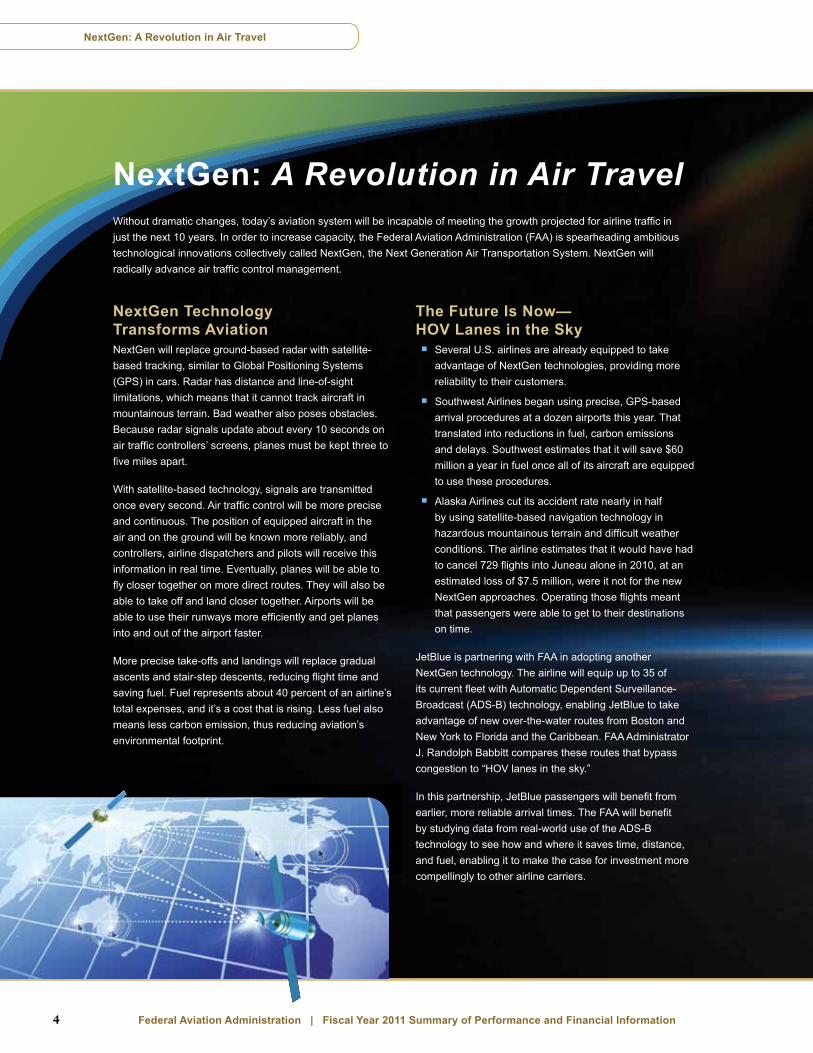
NextGen: A Revolution in Air TravelWithout dramatic changes, today’s aviation system will be incapable of meeting the growth projected for airline traffic in just the next 10 years. In order to increase capacity, the Federal Aviation Administration (FAA) is spearheading ambitious technological innovations collectively called NextGen, the Next Generation Air Transportation System. NextGen will radically advance air traffic control management.
NextGen Technology Transforms AviationNextGen will replace ground-based radar with satellite-based tracking, similar to Global Positioning Systems (GPS) in cars. Radar has distance and line-of-sight limitations, which means that it cannot track aircraft in mountainous terrain. Bad weather also poses obstacles. Because radar signals update about every 10 seconds on air traffic controllers’ screens, planes must be kept three to five miles apart.
With satellite-based technology, signals are transmitted once every second. Air traffic control will be more precise and continuous. The position of equipped aircraft in the air and on the ground will be known more reliably, and controllers, airline dispatchers and pilots will receive this information in real time. Eventually, planes will be able to fly closer together on more direct routes. They will also be able to take off and land closer together. Airports will be able to use their runways more efficiently and get planes into and out of the airport faster.
More precise take-offs and landings will replace gradual ascents and stair-step descents, reducing flight time and saving fuel. Fuel represents about 40 percent of an airline’s total expenses, and it’s a cost that is rising. Less fuel also means less carbon emission, thus reducing aviation’s environmental footprint.
The Future Is Now— HOV Lanes in the Skynn Several U.S. airlines are already equipped to take
advantage of NextGen technologies, providing more reliability to their customers.
nn Southwest Airlines began using precise, GPS-based arrival procedures at a dozen airports this year. That translated into reductions in fuel, carbon emissions and delays. Southwest estimates that it will save $60 million a year in fuel once all of its aircraft are equipped to use these procedures.
nn Alaska Airlines cut its accident rate nearly in half by using satellite-based navigation technology in hazardous mountainous terrain and difficult weather conditions. The airline estimates that it would have had to cancel 729 flights into Juneau alone in 2010, at an estimated loss of $7.5 million, were it not for the new NextGen approaches. Operating those flights meant that passengers were able to get to their destinations on time.
JetBlue is partnering with FAA in adopting another NextGen technology. The airline will equip up to 35 of its current fleet with Automatic Dependent Surveillance-Broadcast (ADS-B) technology, enabling JetBlue to take advantage of new over-the-water routes from Boston and New York to Florida and the Caribbean. FAA Administrator J. Randolph Babbitt compares these routes that bypass congestion to “HOV lanes in the sky.”
In this partnership, JetBlue passengers will benefit from earlier, more reliable arrival times. The FAA will benefit by studying data from real-world use of the ADS-B technology to see how and where it saves time, distance, and fuel, enabling it to make the case for investment more compellingly to other airline carriers.

5
NextGen: A Revolution in Air Travel
NextGen: An Engine for U.S. Prosperity and Competitiveness
“Aviation is an economic engine for our country. We move passengers. We move freight. And we ensure that our economy remains competitive and prosperous.”
NextGen will make the FAA even “more efficient with our assets.”
— FAA Administrator J. Randolph Babbitt
http://www.faa.gov/news/testimony/news_story.cfm?newsId=12640http://www.faa.gov/news/speeches/news_story.cfm?newsId=12441
The FAA estimates one billion passengers will take to the sky annually by 2021, up from the current 730 million. To meet this increased demand for air travel, NextGen will offer the precision of satellite-based technology, enabling more planes to fly more safely in crowded skies.
nn NextGen expands air traffic capacity. The upcoming switch to NextGen satellite-based technology will enable JetBlue to fly more direct, less congested air routes, maximizing use of the national air space.
nn NextGen is safer.In Alaska, the accident rate has been cut nearly in half by using NextGen satellite-based navigation technology in hazardous mountain terrain and dangerous weather conditions.
nn NextGen saves fuel and money.Southwest Airlines uses more direct and fuel-saving GPS-based landing procedures at some airports. Once its entire fleet is equipped to use these procedures, Southwest forecasts savings of $60 million a year.
nn NextGen reduces aviation’s environmental footprint.Seattle-Tacoma International Airport is home to the “Greener Skies over Seattle” initiative, which uses more direct, satellite-guided descents to deliver reduced emissions and
less fuel burn. These descents also reduce noise over populated areas, because planes remain over Puget Sound and away from neighborhoods during most of their final approach.
nn NextGen has a global impact.The increasingly global face of aviation requires that airplanes be able to use the same avionics to get similar benefits around the world. The FAA is working with its global counterparts to make sure that happens. Over the next few years, work under a U.S.-European Union memorandum of cooperation continues to ensure interoperability between NextGen and SESAR, its European counterpart.
The FAA is continuing to participate in flight trials to prove a variety of NextGen concepts through the Atlantic Interoperability Initiative to Reduce Emissions and the Asia and Pacific Initiative to Reduce Emissions while continuing to work with developing aviation nations such as China, Japan, and India.
6
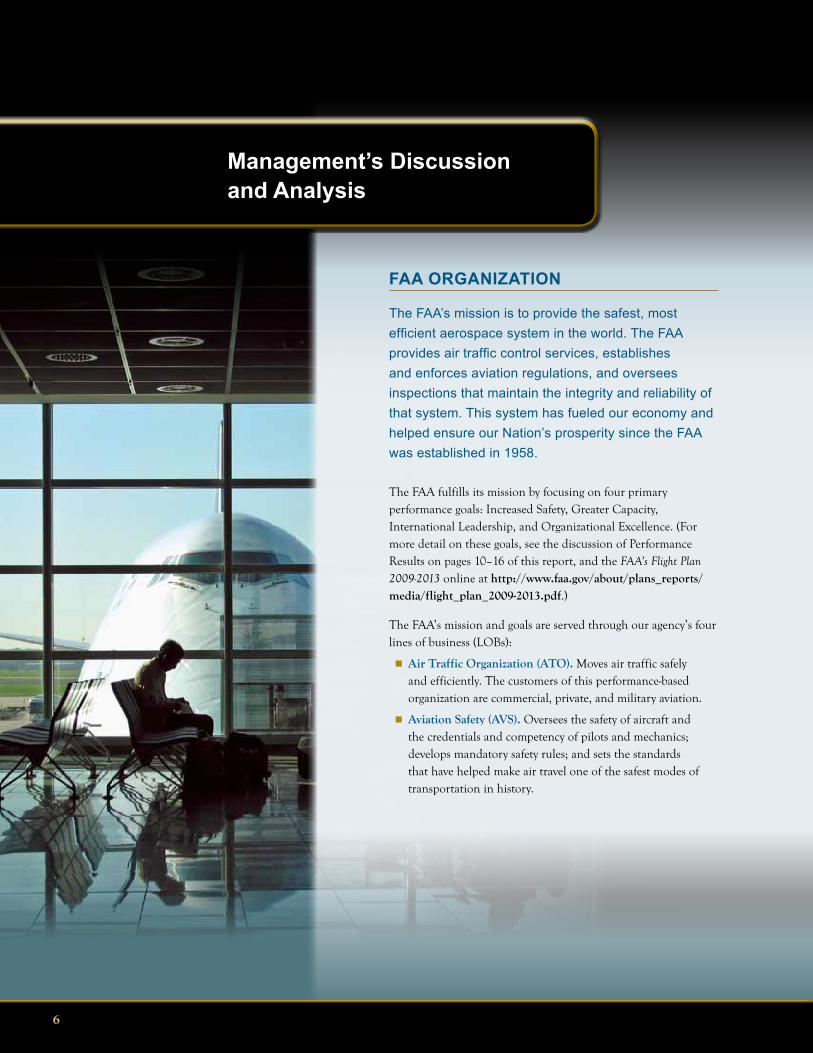
Management’s Discussion and Analysis
FAA ORGANIZATION
The FAA’s mission is to provide the safest, most efficient aerospace system in the world. The FAA provides air traffic control services, establishes and enforces aviation regulations, and oversees inspections that maintain the integrity and reliability of that system. This system has fueled our economy and helped ensure our Nation’s prosperity since the FAA was established in 1958.
The FAA fulfills its mission by focusing on four primary performance goals: Increased Safety, Greater Capacity, International Leadership, and Organizational Excellence. (For more detail on these goals, see the discussion of Performance Results on pages 10–16 of this report, and the FAA’s Flight Plan 2009-2013 online at http://www.faa.gov/about/plans_reports/media/flight_plan_2009-2013.pdf.)
The FAA’s mission and goals are served through our agency’s four lines of business (LOBs):
nn Air Traffic Organization (ATO). Moves air traffic safely and efficiently. The customers of this performance-based organization are commercial, private, and military aviation.
nn Aviation Safety (AVS). Oversees the safety of aircraft and the credentials and competency of pilots and mechanics; develops mandatory safety rules; and sets the standards that have helped make air travel one of the safest modes of transportation in history.

7
nn Airports (ARP). Provides leadership in planning and developing a safe, secure, and efficient airport system; manages the Airport Improvement Program, which provides grants to state and local governments; enhances environmental quality related to airport development; develops standards for the design and construction of airport facilities; establishes regulations for the safe operation of commercial service airports; and inspects airports for compliance.
nn Commercial Space Transportation (AST). Oversees the safety of commercial space transportation activities; regulates the U.S. commercial space transportation industry, including human space flight; and encourages, facilitates, and promotes U.S. commercial space transportation.
These LOBs are supported by other organizations within the agency, including the Mike Monroney Aeronautical Center in Oklahoma City, Oklahoma, and the William J. Hughes Technical Center, in Atlantic City, New Jersey. Go to www.faa.gov/about/office_org for more information about our organization.
Inspectors at the Miami Flight Standards District Offices. FAA photo.
THE NEW ENVIRONMENT OF COMMERCIAL SPACE TRANSPORTATION
FAA and Human Space FlightThe FAA is currently being faced with two challenges: the commercial launch of crewmembers to and from the International Space Station (due to NASA's retirement of the Space Shuttle) and suborbital human spaceflight (space tourism).
The publication of the new National Space Policy emphasized an increased reliance on the commercial space industry in America’s overall space strategy. The FAA provides regulatory oversight for commercial space transportation activities. As such, we actively and continuously participate in joint working groups with the U.S. Air Force to maintain common launch safety requirements at Air Force launch sites.
The FAA's activities address national objectives for security of space-based assets and increased technical and economic competitiveness in the aerospace industry.
Private-Sector Space Travel The FAA has the responsibility both to nurture and regulate for safety the nascent world of commercial space travel. The FAA licenses U.S. commercial space launches and reentries, as well as the operation of non-governmental launch and reentry sites, called “spaceports.”
The launches involve not only trips to the International Space Station, but also the development and operation of reusable launch vehicles, for both science missions and space tourism. http://www.faa.gov/news/speeches/news_story.cfm?newsId=12705
nn Members of the scientific community will be able to use space science missions for experiments to test hypotheses and materials.
nn Several hundred would-be space tourists have already paid Virgin Galactic tens of millions of dollars to reserve seats on suborbital commercial space flights.
In FY 2011, we achieved a major milestone toward these goals: a commercial spacecraft was launched into space and returned safely to earth.
Management's Discussion and Analysis

Federal Aviation Administration | Fiscal Year 2011 Summary of Performance and Financial Information48
MANAGEMENT CHALLENGES
The Reports Consolidation Act of 2000 requires the Inspector General (IG) to identify and report each year on the most serious management and performance challenges that Federal agencies face. In keeping with the requirements of the Act, the DOT Office of Inspector General (OIG) annually identifies and reports on the top challenges that DOT management will face in the coming year. While prepared for the department as a whole, the report includes certain challenges that pertain specifically to the FAA. The DOT OIG this year identified five areas in which the FAA will face its greatest management challenges in Fiscal Year (FY) 2012:
nn Managing the Advancement of the NextGen Air Transportation System While Controlling Costs
nn Ensuring Effective Oversight of Key Initiatives That Can Improve Aviation Safety—including pilot training and fatigue remediation
nn Improving the DOT’s Cyber Security
nn Managing DOT Acquisitions in a Smarter and More Strategic Manner
nn Ensuring Effective Oversight of American Recovery and Reinvestment Act (ARRA) Projects and Applying Related Lessons Learned to Improve DOT’s Infrastructure Programs
We agree that the FAA faces significant management and performance challenges as we continue to enhance aviation safety in an environmentally responsible way while simultaneously increasing efficiency in a fiscally restrained system. The management challenges are not issues that can be easily solved. In many cases, they require investments or upgrades to technology or substantial changes in long-standing procedures or program activities. To mitigate a management challenge completely may take more than a single fiscal year. However, the challenges will be met through the focused efforts of our leadership and the commitment of our workforce.
The DOT IG reports on the FY 2011 and FY 2012 Top Management Challenges can be found at: http://www.oig.dot.gov/top-management-challenges. Detailed information on the FAA’s actions in response to the FY 2011 DOT IG’s Top Management Challenges can be found at http://www.faa.gov/about/office_org/headquarters_offices/aba/media/FY11IGMgmtChallengesATR.pdf.
FY 2011 HIGHLIGHTS
The FAA serves the flying public by running a system that:
n; Operates 24 hours a day, 7 days a week, 365 days a year
n; Provides more than 67,000 facilities and pieces of equipment
n; Maintains FAA-operated or -contracted towers at more than 500 airports
n; Inspects and certifies approximately 234,000 aircraft and more than 618,000 pilots
n; Facilitates almost 5,800 takeoffs and landings per hour
n; Transports more than 730 million passengers annually
n; Moves more than 36 billion (preliminary) cargo revenue ton miles of freight a year
n; Safely guides approximately 69,500 flights through the world’s preeminent aerospace system every day
n; Supports 10.2 million jobs and contributes $1.3 trillion to the national economy through aviation and related industries.
The FAA provides:
n; A workforce of more than 48,000 professionals to operate and maintain the most complex air traffic control system in the world
n; An annual budget of approximately $15.9 billion
n; More than 15,000 controllers who manage and ensure ever-increasing levels of safety in the busiest air traffic system in the world
n; More than 6,000 technicians (preliminary) who maintain the equipment in the National Airspace System (NAS) to extremely high levels of operability
n; Research to improve aviation safety and efficiency
n; Grants to improve 3,332 eligible public-use airports in the United States
n; Protection of the public, property, and the national security and foreign policy interests of the United States during commercial space launch and reentry activities.
Management's Discussion and Analysis

99
Performance Highlights
MEASURING PERFORMANCE
Our strategic plan, annual business plans, human capital plans, program evaluations, and the annual PAR create a recurring cycle of planning, program execution, measurement, verification, and reporting, a process to which performance measurement is central. The linking of resources and performance focuses us on accomplishing defined priorities in the context of their costs, promotes organizational efficiency, and reinforces accountability for the way that the agency spends taxpayer money.
In FY 2011, the FAA had 29 performance measures and targets, spanning four main strategic goal areas: Increased Safety, Greater Capacity, International Leadership, and Organizational Excellence. We achieved a 93 percent success rate in meeting our performance goals in these areas—our highest success rate to date. The fulfillment of our performance goals over the past five years, culminating in figures for FY 2011, is captured in the following table.
YEAR TO YEAR PERFORMANCE GOALS ACHIEVED
FY 2005 FY 2006 FY 2007 FY 2008 FY 2009 FY 2010 FY 2011
Number of Performance Targets Met
28 of 31 27 of 30 24 of 30 26 of 29 28 of 31 28 of 31 27 of 29
Percentage of Performance Targets Met
90% 90% 80% 90% 90% 90% 93%
Safety has always been our hallmark. The FAA reinforced the culture of safety this year not only through actions taken in relation to air traffic controller fatigue, but by continuing its commitment to a relatively new reporting system, the Air Traffic Safety Action Program (ATSAP). ATSAP encourages air traffic controllers to report operational errors (errors in which a controller fails to maintain a safe distance between aircraft) voluntarily, without fear of punishment.
Federal Aviation Administration | Fiscal Year 2011 Summary of Performance and Financial Information410
FY 2011 PERFORMANCE AND BUDGET
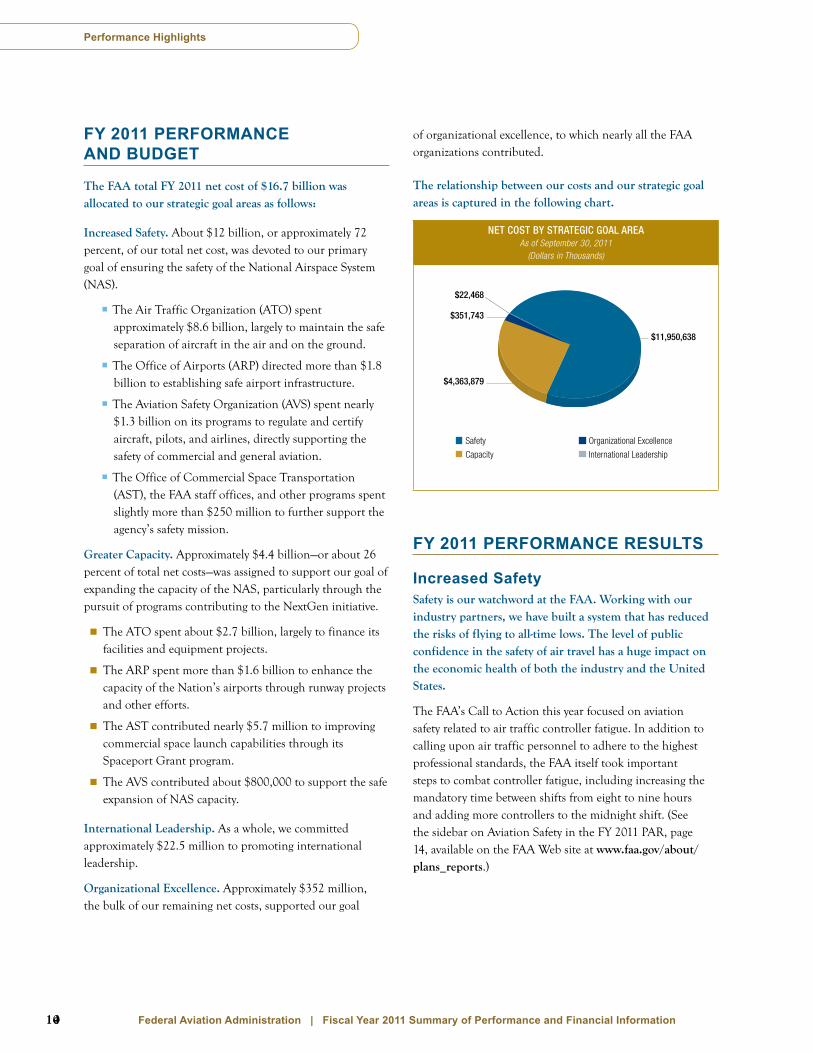
The FAA total FY 2011 net cost of $16.7 billion was allocated to our strategic goal areas as follows:
Increased Safety. About $12 billion, or approximately 72 percent, of our total net cost, was devoted to our primary goal of ensuring the safety of the National Airspace System (NAS).
nn The Air Traffic Organization (ATO) spent approximately $8.6 billion, largely to maintain the safe separation of aircraft in the air and on the ground.
nn The Office of Airports (ARP) directed more than $1.8 billion to establishing safe airport infrastructure.
nn The Aviation Safety Organization (AVS) spent nearly $1.3 billion on its programs to regulate and certify aircraft, pilots, and airlines, directly supporting the safety of commercial and general aviation.
nn The Office of Commercial Space Transportation (AST), the FAA staff offices, and other programs spent slightly more than $250 million to further support the agency’s safety mission.
Greater Capacity. Approximately $4.4 billion—or about 26 percent of total net costs—was assigned to support our goal of expanding the capacity of the NAS, particularly through the pursuit of programs contributing to the NextGen initiative.
nn The ATO spent about $2.7 billion, largely to finance its facilities and equipment projects.
nn The ARP spent more than $1.6 billion to enhance the capacity of the Nation’s airports through runway projects and other efforts.
nn The AST contributed nearly $5.7 million to improving commercial space launch capabilities through its Spaceport Grant program.
nn The AVS contributed about $800,000 to support the safe expansion of NAS capacity.
International Leadership. As a whole, we committed approximately $22.5 million to promoting international leadership.
Organizational Excellence. Approximately $352 million, the bulk of our remaining net costs, supported our goal
of organizational excellence, to which nearly all the FAA organizations contributed.
The relationship between our costs and our strategic goal areas is captured in the following chart.
NET COST BY STRATEGIC GOAL AREAAs of September 30, 2011
(Dollars in Thousands)
Safety
Capacity
Organizational Excellence
International Leadership
$351,743
$4,363,879
$11,950,638
$22,468
FY 2011 PERFORMANCE RESULTS
Increased SafetySafety is our watchword at the FAA. Working with our industry partners, we have built a system that has reduced the risks of flying to all-time lows. The level of public confidence in the safety of air travel has a huge impact on the economic health of both the industry and the United States.
The FAA’s Call to Action this year focused on aviation safety related to air traffic controller fatigue. In addition to calling upon air traffic personnel to adhere to the highest professional standards, the FAA itself took important steps to combat controller fatigue, including increasing the mandatory time between shifts from eight to nine hours and adding more controllers to the midnight shift. (See the sidebar on Aviation Safety in the FY 2011 PAR, page 14, available on the FAA Web site at www.faa.gov/about/plans_reports.)
Performance Highlights

11
FY 2011 INCREASED SAFETY PERFORMANCE MEASURES AND RESULTS
Performance MeasureFY 2011 Target
FY 2011 Result
FY 2011 Status
FY 2012 Target
Commercial Air Carrier Fatality RateCut the rate of fatalities per 100 million persons on board in half by 2025.
7.9 0.01 7.6
General Aviation Fatal Accident RateReduce the fatal accident rate per 100,000 flight hours by 10% over a 10-year period (2009-2018).
1.08 1.161 1.07
Alaska Accident RateBy the end of FY 2019 reduce the Rate of Fatal and Serious Injury Accidents by 10% in 10 Years.
1.84 1.431 1.82
Runway Incursions (Category A&B)By 2010, reduce Category A and B (most serious) runway incursions to a rate of no more than 0.45 per million operations, and maintain or improve through FY 2013.
0.450 0.1382 0.450
Total Runway IncursionsBy the end of FY 2013, reduce total runway incursions by 10% to 909 from the FY 2008 baseline number of 1009.
959 9532 939
Commercial Space Launch AccidentsNo fatalities, serious injuries, or significant property damage to the uninvolved public during licensed or permitted space launch and reentry activities.
0 0 0
System Risk Event RateReduce risks in flight by limiting the rate of the most serious losses of standard separation to 20 or fewer for every thousand (.02) losses of standard separation within the National Airspace System.
20 23.992 20
Safety Management SystemIn FY 2011, integrate Air Traffic Organization, Office of Aviation Safety, and Office of Airports into an interoperable, agency-wide SMS. In FY 2012, implement SMS policy in all appropriate FAA organizations.
SMS Implemented
in 3 LOBs
SMS Implemented
in 3 LOBs
SMS Implemented
in all Organizations
1 Preliminary estimate. Final results available March 2013.2 Preliminary estimate. Final results available January 2012. Goal AchievednGoal Not Achieved
Overall, we met six of our eight safety goals this year. We missed two of the FY 2011 safety targets.
One of our successfully met safety goals of which we are most proud relates to Alaska. Because Alaska’s topography and extreme weather present unique safety challenges to pilots, we made it a priority performance target to reduce the number of accidents within the state. In a major advance this year over last, we met and exceeded our safety target for the Alaska Accident Rate, ending with a rate of 1.43 fatal and serious injury (FSI) accidents per 100,000 flight hours, bettering our target of 1.84 accidents per 100,000 flight hours.
ALASKA ACCIDENT RATEFatal and Serious Injury Accidents per 100,000 Flight Hours
Fiscal Year Target Actual Performance Target Achieved?
2009 This measure was redefined in FY 2010.
2010 1.86 2.191 2011 1.84 1.432 1 Preliminary estimate. Final results available March 2012.2 Preliminary estimate. Final results available March 2013.
The safety targets that we missed were in the areas of:
nn General Aviation Fatal Accident Rate. General aviation (GA) encompasses a diverse range of aviation activities, from single-seat homebuilt aircraft, helicopters, balloons, single- and multiple-engine land and seaplanes, to highly sophisticated extended range turbojets. More people perish from GA accidents each year than in U.S. commercial air carrier accidents, so reducing the rate
Performance Highlights

Federal Aviation Administration | Fiscal Year 2011 Summary of Performance and Financial Information412
of fatal GA accidents is a top priority for the FAA. We finished the year with a rate of 1.16 fatal accidents per 100,000 flight hours, missing our target rate of 1.08 fatal accidents. Most of the fatalities occurred in the area of amateur-built aircraft, many caused by human factors.
To counter the trend, we reenergized the Government-industry General Aviation Joint Steering Committee to take a more data-driven approach to understanding these accidents. In addition, we are working with various members of the GA community, including aero-medical evacuation and charter services, to promote education and training on night landings, weather, and other areas of concern. The FAA is also using NextGen technology in Alaska, such as satellite-based Automatic Dependent
Surveillance-Broadcast (ADS-B) navigation and terrain awareness avionics, to increase safety.
nn System Risk Event Rate. “System risk event” refers to the loss of the required separation between aircraft flying within the NAS. For the most serious separation loss events, we finished the year with a rate of 23.99 per 1,000 loss events, missing our target of 20 or fewer such losses per 1,000 loss events. In FY 2011, we introduced a new Safety Management System-based approach to measuring the loss of separation, called the System Risk Event Rate (SRER), which will improve risk analysis. The changeover to SRER will improve our ability to measure the safety impact of new NextGen air traffic technologies and procedures, which will over time enable us to reduce separation standards, so that more planes can fly closer together.
For more information on our safety performance results, see the FY 2011 PAR, pages 40-51, available on the FAA Web site
at www.faa.gov/about/plans_reports.
Greater Capacity Meeting capacity needs continues to be one of our biggest challenges today and into the future. Progress with NextGen will enable us to meet long-term demands for capacity. Other initiatives, such as airfield construction, airspace redesign, and air traffic control procedure revisions, are helping us meet the Nation’s short-term capacity needs.
Since NextGen ADS-B technology was deployed nationwide in September 2010, the public has benefited from the increased accuracy, integrity, and reliability of satellite signals over radar. ADS-B already allows air traffic controllers to safely reduce the mandatory separation between aircraft flying in non-radar areas, for example, the Gulf of Mexico, which in turn increases capacity in these areas. In addition, we are partnering with JetBlue to equip some of its aircraft with ADS-B, which will enable those planes to fly more direct, less congested routes over the water. Thus, JetBlue will now be able to take advantage of new NextGen routes from Boston and New York to Florida and into the Caribbean. The result will be more planes flying more routes, thus increasing capacity. See the NextGen sidebar in this report on pages 4–5. For more information about the ways in which NextGen technology is improving capacity, see the FY 2011 PAR, page 11, available on the FAA Web site at www.faa.gov/about/plans_reports.
FAA TAKES AIM AT LASER POINTERS
Simple hand-held laser pointers, when aimed at aircraft, can cause pilots temporary blindness or hazardous distraction, make it impossible to land the aircraft safely, and jeopardize the safety of both passengers and people on the ground. http://www.faa.gov/news/press_releases/news_story.cfm?newsId=12765
With the incidents of laser beams shining into cockpits escalating precipitously, the FAA has imposed a civil fine of up to $11,000 per violation.
How can the beams that emanate from these small, inexpensive devices, which typically supplement office and classroom presentations, threaten aircraft? Laser light expands with distance to two to three feet in width by the time that it reaches an airliner.
These incidents are not gags or pranks. Some cities and states have Federal laws making it illegal to shine lasers at aircraft, and FAA is prepared to work with Federal, state, and local law enforcement agencies to assist with criminal prosecutions. In addition, legislation that would make purposefully aiming a laser device at an aircraft a Federal crime in every state is currently pending in Congress.
The increase in incidents is apparently due to the availability of inexpensive, more powerful laser devices through online laser stores; the introduction of green lasers (more easily seen than red lasers); and increased pilot reporting of laser strikes.
Performance Highlights
13
FY 2011 GREATER CAPACITY PERFORMANCE MEASURES AND RESULTS
Performance MeasureFY 2011 Target
FY 2011 Result
FY 2011 Status
FY 2012 Target
Average Daily Airport Capacity (Core Airports)Achieve an average daily airport capacity for the Core Airports of 86,606 arrivals and departures per day by FY 2011 and maintain through FY 2013.
86,606 87,3381 86,606
Average Daily Airport Capacity( 7 Metro Areas)Achieve an average daily airport capacity for the seven major metropolitan areas of 39,484 arrivals and departures per day by FY 2009, and maintain through FY 2013.
39,484 42,8241 39,484
Adjusted Operational AvailabilitySustain adjusted operational availability at 99.70% for the reportable facilities that support the Core Airports through FY 2013.
99.70% 99.71%1 99.70%
NAS On-Time ArrivalsAchieve a NAS on-time arrival rate of 88.00% at the Core Airports and maintain through FY 2013.
88.00% 90.26%1 88.00%
Noise ExposureReduce the number of people exposed to significant noise by 4% compounded annually through FY 2013 from the calendar year 2005.
-19.28% -38.31%2 -22.51%
Aviation Fuel EfficiencyImprove aviation fuel efficiency by 2% per year, through FY 2015, as measured by the calendar year 2010 fuel burned per revenue mile flown, relative to the calendar year 2000 baseline.
-12.00% -14.50% -14.00%
1 Preliminary estimate. Final result will be available January 2012. 2 Projection to be finalized in May 2012. Goal AchievednGoal Not Achieved
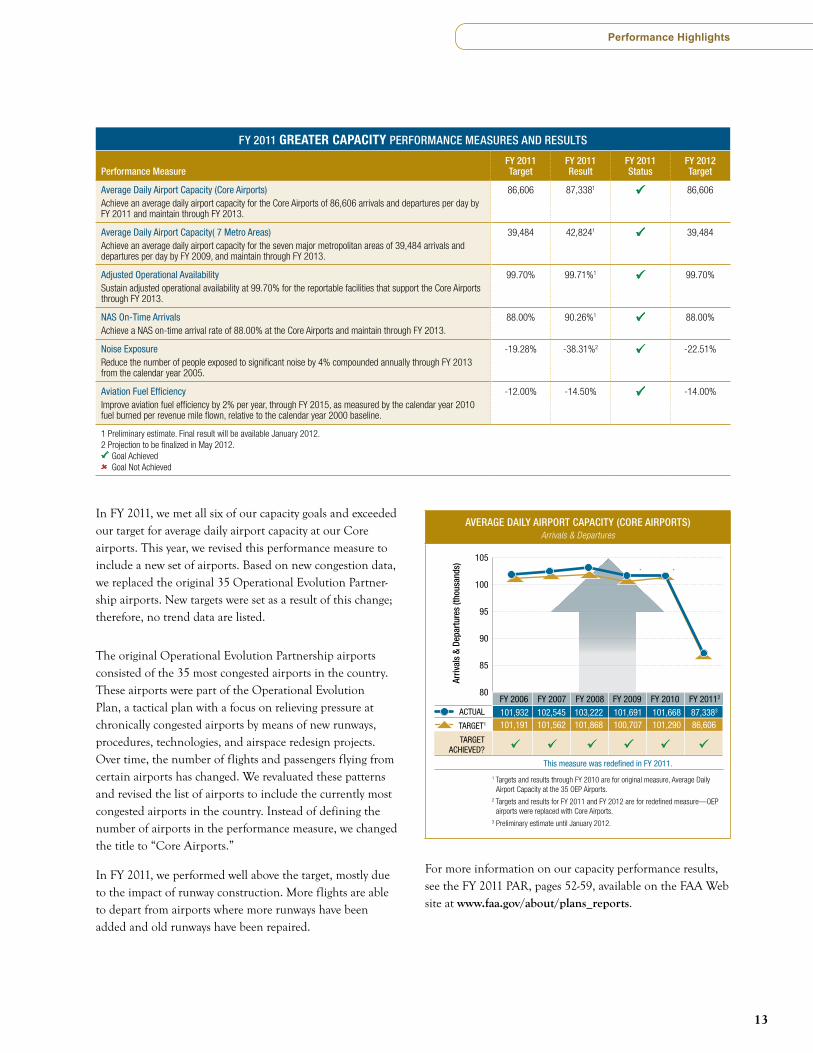
In FY 2011, we met all six of our capacity goals and exceeded our target for average daily airport capacity at our Core airports. This year, we revised this performance measure to include a new set of airports. Based on new congestion data, we replaced the original 35 Operational Evolution Partner-ship airports. New targets were set as a result of this change; therefore, no trend data are listed.
The original Operational Evolution Partnership airports consisted of the 35 most congested airports in the country. These airports were part of the Operational Evolution Plan, a tactical plan with a focus on relieving pressure at chronically congested airports by means of new runways, procedures, technologies, and airspace redesign projects. Over time, the number of flights and passengers flying from certain airports has changed. We revaluated these patterns and revised the list of airports to include the currently most congested airports in the country. Instead of defining the number of airports in the performance measure, we changed the title to “Core Airports.”
In FY 2011, we performed well above the target, mostly due to the impact of runway construction. More flights are able to depart from airports where more runways have been added and old runways have been repaired.
AVERAGE DAILY AIRPORT CAPACITY (CORE AIRPORTS)Arrivals & Departures
This measure was redefined in FY 2011.
80
85
90
95
100
105
Arriv
als
& De
part
ures
(tho
usan
ds)
FY 2008 FY 2009FY 2006 FY 2007 FY 2010 FY 20112
103,222 101,691101,932 102,545 101,668 87,3383
101,868 100,707101,191 101,562 101,290 86,606
1 Targets and results through FY 2010 are for original measure, Average Daily Airport Capacity at the 35 OEP Airports.
2 Targets and results for FY 2011 and FY 2012 are for redefined measure—OEP airports were replaced with Core Airports.
3 Preliminary estimate until January 2012.
ACTUAL
TARGET1
TARGETACHIEVED?
For more information on our capacity performance results, see the FY 2011 PAR, pages 52-59, available on the FAA Web site at www.faa.gov/about/plans_reports.
Performance Highlights

Federal Aviation Administration | Fiscal Year 2011 Summary of Performance and Financial Information414
Our biggest challenge today and in the future is to increase capacity. In FY 2011, the FAA again met all of its capacity goals, including expanding its capacity to meet projected demand and reduce congestion, increasing its reliability and on-time performance, and addressing environmental issues associated with capacity, such as aviation noise. In the future, NextGen will enable us to safely meet the challenge posed by dramatically escalating numbers of air travelers and flights. Photo by Christian Großekathöfer.
International LeadershipThe FAA currently facilitates direct or indirect technical assistance to 150 countries to help them improve their aviation systems. We also enhance our international leadership role by continuing to work with international civil aviation authorities, organizations, and states on harmonization with NextGen technologies, procedures, and concepts. This global harmonization of aviation systems will also increase the safety, capacity, and efficiency of
international aviation not only for U.S. carriers, but also for U.S. citizens traveling on foreign flag air carriers.
While safety is our top priority domestically and internationally, we cannot overlook the impact that global aviation has on trade and commerce. Aviation systems within and among nations are lifelines to the future, free trade, accelerated economic growth, and greater cultural exchange. Seamless global aviation is critical to an increasingly global economy that hinges on efficient supply chains and just-in-time manufacturing.
FY 2011 INTERNATIONAL LEADERSHIP PERFORMANCE MEASURES AND RESULTS
Performance MeasureFY 2011 Target
FY 2011 Result
FY 2011 Status
FY 2012 Target
Global Safety EnhancementsPrioritize efforts to work with foreign aviation entities and industry in Africa, the Americas, Asia, Europe and the Middle East to adopt at least one U.S. aviation safety best practice per region each year.
3 25 3
International Aviation Development ProjectsBy 2014, arrange commitment for external funding for at least 35 aviation development projects (7 per year).
7 12 7
Aviation LeadersBy 2014, work with at least 18 countries or regional organizations to develop aviation leaders to strengthen the global aviation infrastructure.
4 10 7
NextGen TechnologiesBy FY 2014, expand the use of NextGen performance-based systems and concepts to five priority countries.
1 2 1
Goal AchievednGoal Not Achieved
Performance Highlights
15
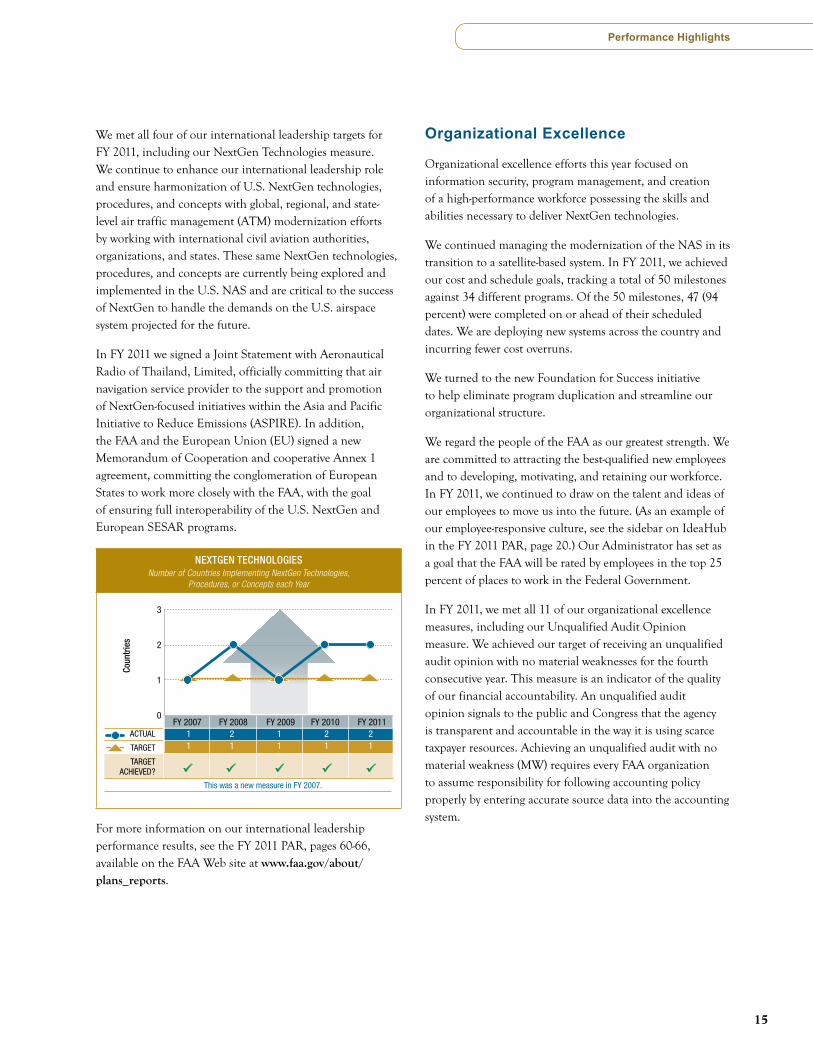
We met all four of our international leadership targets for FY 2011, including our NextGen Technologies measure. We continue to enhance our international leadership role and ensure harmonization of U.S. NextGen technologies, procedures, and concepts with global, regional, and state-level air traffic management (ATM) modernization efforts by working with international civil aviation authorities, organizations, and states. These same NextGen technologies, procedures, and concepts are currently being explored and implemented in the U.S. NAS and are critical to the success of NextGen to handle the demands on the U.S. airspace system projected for the future.
In FY 2011 we signed a Joint Statement with Aeronautical Radio of Thailand, Limited, officially committing that air navigation service provider to the support and promotion of NextGen-focused initiatives within the Asia and Pacific Initiative to Reduce Emissions (ASPIRE). In addition, the FAA and the European Union (EU) signed a new Memorandum of Cooperation and cooperative Annex 1 agreement, committing the conglomeration of European States to work more closely with the FAA, with the goal of ensuring full interoperability of the U.S. NextGen and European SESAR programs.
NEXTGEN TECHNOLOGIESNumber of Countries Implementing NextGen Technologies,
Procedures, or Concepts each Year
ACTUAL
TARGET
TARGETACHIEVED?
This was a new measure in FY 2007.
FY 2007 FY 2008 FY 2009 FY 2010 FY 2011
11
12
11
12
12
0
1
2
3
Coun
trie
s
For more information on our international leadership performance results, see the FY 2011 PAR, pages 60-66, available on the FAA Web site at www.faa.gov/about/plans_reports.
Organizational Excellence
Organizational excellence efforts this year focused on information security, program management, and creation of a high-performance workforce possessing the skills and abilities necessary to deliver NextGen technologies.
We continued managing the modernization of the NAS in its transition to a satellite-based system. In FY 2011, we achieved our cost and schedule goals, tracking a total of 50 milestones against 34 different programs. Of the 50 milestones, 47 (94 percent) were completed on or ahead of their scheduled dates. We are deploying new systems across the country and incurring fewer cost overruns.
We turned to the new Foundation for Success initiative to help eliminate program duplication and streamline our organizational structure.
We regard the people of the FAA as our greatest strength. We are committed to attracting the best-qualified new employees and to developing, motivating, and retaining our workforce. In FY 2011, we continued to draw on the talent and ideas of our employees to move us into the future. (As an example of our employee-responsive culture, see the sidebar on IdeaHub in the FY 2011 PAR, page 20.) Our Administrator has set as a goal that the FAA will be rated by employees in the top 25 percent of places to work in the Federal Government.
In FY 2011, we met all 11 of our organizational excellence measures, including our Unqualified Audit Opinion measure. We achieved our target of receiving an unqualified audit opinion with no material weaknesses for the fourth consecutive year. This measure is an indicator of the quality of our financial accountability. An unqualified audit opinion signals to the public and Congress that the agency is transparent and accountable in the way it is using scarce taxpayer resources. Achieving an unqualified audit with no material weakness (MW) requires every FAA organization to assume responsibility for following accounting policy properly by entering accurate source data into the accounting system.
Performance Highlights
Federal Aviation Administration | Fiscal Year 2011 Summary of Performance and Financial Information416
FY 2011 ORGANIZATIONAL EXCELLENCE PERFORMANCE MEASURES AND RESULTS
Performance MeasureFY 2011 Target
FY 2011 Result
FY 2011 Status
FY 2012 Target
OPM Hiring StandardBy FY 2010, 80% of FAA external hires will be filled within OPM’s 45-day standard for government-wide hiring.
80.00% 83.85% 80.00%
Reduce Workplace InjuriesReduce the total workplace injury and illness case rate to no more than 2.44 per 100 employees by the end of FY 2011, and maintain through FY 2013.
2.44 per 100 1.57 per 1001
2.44 per 100
Grievance Processing TimeReduce grievance processing time by 30% (to an average of 102 days) by FY 2010 over the FY 2006 baseline of 146 days, and maintain the reduction through FY 2013.
-30.00% -69.87% -30.00%
Air Traffic Controller Workforce PlanMaintain the air traffic control workforce at, within two percent above or below, the projected annual totals in the Air Traffic Controller Workforce Plan.
+/- 2% of annual target
0.01% +/- 2% of annual target
Aviation Safety Critical Positions Workforce PlanMaintain the aviation safety workforce within one percent of the projected annual totals in the Aviation Safety Workforce Plan.
+/- 1% of annual target
0.86% above annual
target
+/- 1% of annual target
Cost ControlOrganizations throughout the agency will continue to implement cost efficiency initiatives such as:nn $20 million in savings for strategic sourcing for selected products and services;nn Reduction of $30 million in Information Technology operating costs in FY 2011.
90% of Targeted Savings
111.32% of Targeted
Savings
90% of Targeted Savings
Unqualified Audit OpinionObtain an unqualified opinion on the agency’s financial statements (unqualified audit with no material weakness) each fiscal year.
Unqualified Audit Opinion with No MW
Unqualified Audit Opinion with No MW
Unqualified Audit Opinion with No MW
Critical Acquisitions on BudgetIn FY 2009, 90% of Major System Investments are within 10% variance of current baseline total budget estimate at completion (BAC).
90.00% 100% 90.00%
Critical Acquisitions on ScheduleIn FY 2009, 90% of Major System Investments selected annual milestones are achieved.
90.00% 94.00% 90.00%
Information SecurityAchieve zero cyber security events that disable or significantly degrade FAA mission critical Line of Business systems.
0 0 0
Continuity of OperationsExceed Federal Emergency Management Agency continuity readiness levels by 5%.
5% ahead of requirements
6% ahead of requirements
5% ahead of requirements
1 Projection to be finalized in December 2011. Goal AchievednGoal Not Achieved
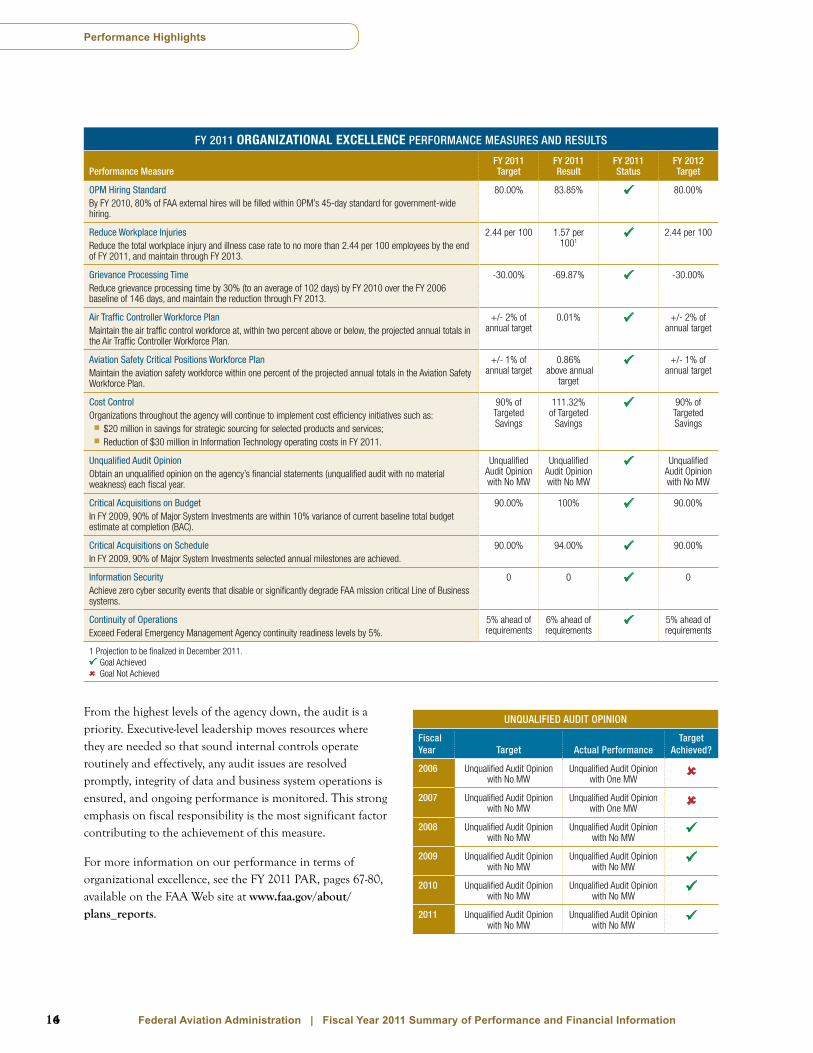
From the highest levels of the agency down, the audit is a priority. Executive-level leadership moves resources where they are needed so that sound internal controls operate routinely and effectively, any audit issues are resolved promptly, integrity of data and business system operations is ensured, and ongoing performance is monitored. This strong emphasis on fiscal responsibility is the most significant factor contributing to the achievement of this measure.
For more information on our performance in terms of organizational excellence, see the FY 2011 PAR, pages 67-80, available on the FAA Web site at www.faa.gov/about/plans_reports.
UNQUALIFIED AUDIT OPINION
Fiscal Year Target Actual Performance
Target Achieved?
2006 Unqualified Audit Opinion with No MW
Unqualified Audit Opinion with One MW
2007 Unqualified Audit Opinion with No MW
Unqualified Audit Opinion with One MW
2008 Unqualified Audit Opinion with No MW
Unqualified Audit Opinion with No MW
2009 Unqualified Audit Opinion with No MW
Unqualified Audit Opinion with No MW
2010 Unqualified Audit Opinion with No MW
Unqualified Audit Opinion with No MW
2011 Unqualified Audit Opinion with No MW
Unqualified Audit Opinion with No MW
Performance Highlights

1717
MARK HOUSECHIEF FINANCIAL OFFICER
A Message from the Chief Financial Officer
The American people expect solid financial management from the FAA as the Nation transitions into the next century of flight. The current fiscal environment serves as a reminder that in a period of economic uncertainty, the need for vigilance has never been greater. From financial planning and budgeting on the front end, through cost management during program execution, to final accounting and reporting at the back end, we must manage the funds with which we have been entrusted in order to accomplish our mission in the most efficient manner possible.
We continue our focus on reducing costs where it makes sense by applying innovative financial tools, models, and procedures. We are also enhancing program oversight by carefully monitoring our progress in meeting performance measures and targets. This focus supports the efficient use of resources, paving the way for future innovation and investment.
Throughout this document, you will read about our many financial accomplishments in FY 2011. In addition to these highlighted activities, we achieved an unqualified audit opinion with no material weaknesses in our FY 2011 financial statements. Also during FY 2011, the Association of Government Accountants awarded FAA the prestigious Certificate of Excellence in Accountability Reporting (CEAR) award for our FY 2010 PAR. This is considered the highest form of recognition in Federal Government financial and performance management reporting. The FAA has won the award seven times.
By tracking and managing performance of key programmatic, operational, and financial indicators, we are making the FAA work better, faster, and more efficiently. We hold ourselves accountable for obtaining results consistent with our mission. Our goal is to move the national air traffic control system safely, efficiently, and responsibly into the future, and to do it in a manner that reflects the highest standards of fiscal responsibility.
Mark HouseChief Financial Officer November 9, 2011

18
Financial Highlights
Highlights of our FY 2011 financial performance appear on pages 19–22. For a more detailed look at the FAA’s financial statements and the accompanying notes, see our FY 2011 PAR, pages 28-33 and 97-133. The PAR is also available on the FAA Web site at www.faa.gov/about/plans_reports.
For FY 2011, the Airport and Airway Trust Fund (AATF) provided approximately 68.8 percent of our enacted budgetary authority. Created by the Airport and Airway Revenue Act of 1970, the AATF derives its funding from excise taxes and earned interest. Aviation excise taxes that are deposited into the fund come from taxes on domestic passenger tickets, freight waybills, general and commercial aviation fuel, and international departures and arrivals.
19
The DOT maintains the AATF and invests in Government securities. Interest earned is deposited into the fund. Money is withdrawn as needed and transferred into each FAA appropriation to cover obligations.
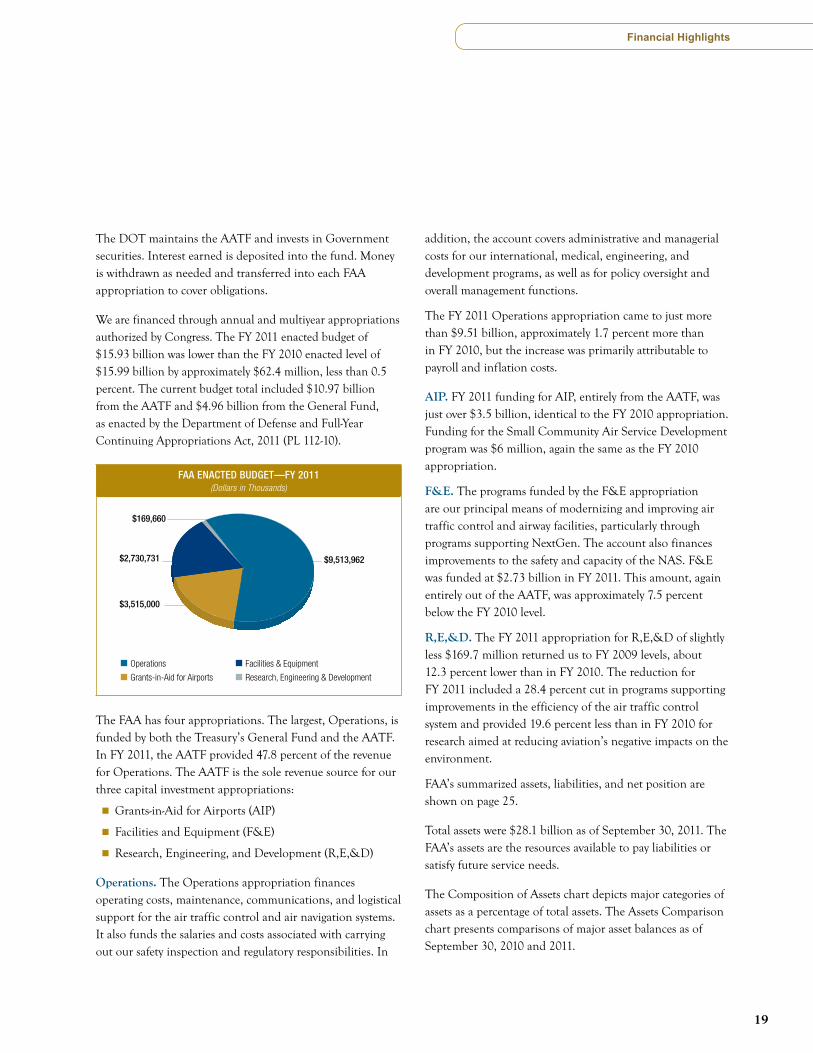
We are financed through annual and multiyear appropriations authorized by Congress. The FY 2011 enacted budget of $15.93 billion was lower than the FY 2010 enacted level of $15.99 billion by approximately $62.4 million, less than 0.5 percent. The current budget total included $10.97 billion from the AATF and $4.96 billion from the General Fund, as enacted by the Department of Defense and Full-Year Continuing Appropriations Act, 2011 (PL 112-10).
FAA ENACTED BUDGET—FY 2011 (Dollars in Thousands)
Operations
Grants-in-Aid for Airports
$2,730,731
$3,515,000
$9,513,962
$169,660
Facilities & Equipment
Research, Engineering & Development
The FAA has four appropriations. The largest, Operations, is funded by both the Treasury’s General Fund and the AATF. In FY 2011, the AATF provided 47.8 percent of the revenue for Operations. The AATF is the sole revenue source for our three capital investment appropriations:
nn Grants-in-Aid for Airports (AIP)
nn Facilities and Equipment (F&E)
nn Research, Engineering, and Development (R,E,&D)
Operations. The Operations appropriation finances operating costs, maintenance, communications, and logistical support for the air traffic control and air navigation systems. It also funds the salaries and costs associated with carrying out our safety inspection and regulatory responsibilities. In
addition, the account covers administrative and managerial costs for our international, medical, engineering, and development programs, as well as for policy oversight and overall management functions.
The FY 2011 Operations appropriation came to just more than $9.51 billion, approximately 1.7 percent more than in FY 2010, but the increase was primarily attributable to payroll and inflation costs.
AIP. FY 2011 funding for AIP, entirely from the AATF, was just over $3.5 billion, identical to the FY 2010 appropriation. Funding for the Small Community Air Service Development program was $6 million, again the same as the FY 2010 appropriation.
F&E. The programs funded by the F&E appropriation are our principal means of modernizing and improving air traffic control and airway facilities, particularly through programs supporting NextGen. The account also finances improvements to the safety and capacity of the NAS. F&E was funded at $2.73 billion in FY 2011. This amount, again entirely out of the AATF, was approximately 7.5 percent below the FY 2010 level.
R,E,&D. The FY 2011 appropriation for R,E,&D of slightly less $169.7 million returned us to FY 2009 levels, about 12.3 percent lower than in FY 2010. The reduction for FY 2011 included a 28.4 percent cut in programs supporting improvements in the efficiency of the air traffic control system and provided 19.6 percent less than in FY 2010 for research aimed at reducing aviation’s negative impacts on the environment.
FAA’s summarized assets, liabilities, and net position are shown on page 25.
Total assets were $28.1 billion as of September 30, 2011. The FAA’s assets are the resources available to pay liabilities or satisfy future service needs.
The Composition of Assets chart depicts major categories of assets as a percentage of total assets. The Assets Comparison chart presents comparisons of major asset balances as of September 30, 2010 and 2011.
Financial Highlights

Federal Aviation Administration | Fiscal Year 2011 Summary of Performance and Financial Information420
COMPOSITION OF ASSETSas of September 30, 2011
Fund Balance with Treasury
Investments
Other
Property, plant and equipment net
13%
47% 37%
3%
ASSETS COMPARISON(Dollars in Thousands)
$0 $3M $6M $9M $12M $15M
Other
Property, plant and equipment net
Investments
Fund balance with Treasury
2011
2010
Financial Highlights
Fund balance with Treasury represents 13 percent of the FAA’s current period assets and consists of funding available through Department of Treasury accounts from which FAA is authorized to make expenditures to pay liabilities. It also includes passenger ticket and other excise taxes deposited to the AATF, but not yet invested. Fund balance with Treasury decreased from $4.6 billion to $3.7 billion in FY 2011.
At $10.3 billion, Investments represent 37 percent of the FAA’s current period assets, which are principally derived from passenger ticket and other excise taxes deposited to the AATF. These amounts are used to finance the FAA’s operations to the extent authorized by Congress. Investments increased by $1.8 billion in FY 2011.
At $13.1 billion, General property, plant, and equipment, net (PP&E) represents 47 percent of the FAA’s assets as of September 30, 2011, and primarily comprises construction-in-progress related to the development of NAS assets, and capitalized real and personal property. There was a slight decrease of $115.7 million in the total composition of PP&E, as purchases of equipment and additions to construction-in-progress through the normal course of business were offset by retirements and depreciation.
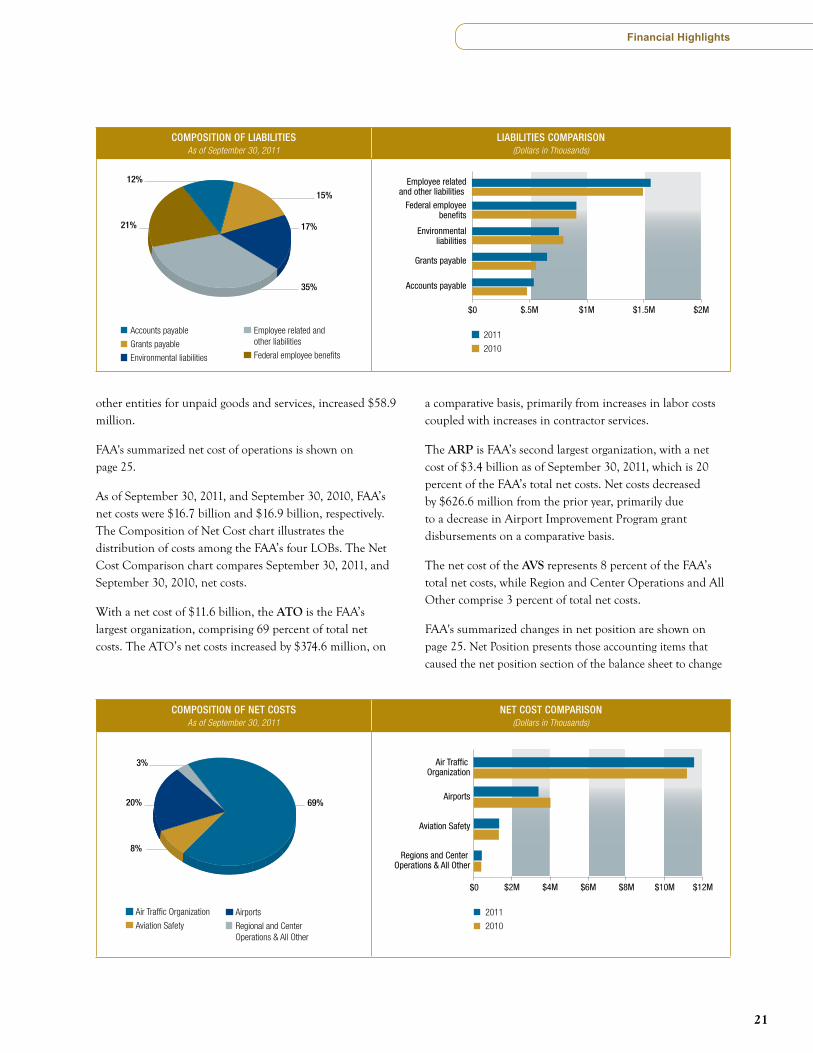
As of September 30, 2011, the FAA reported liabilities of $4.4 billion. Liabilities are probable and measurable future outflows of resources arising from past transactions or events.
The Composition of Liabilities chart depicts the FAA’s major categories of liabilities as a percentage of total liabilities. The Liabilities Comparison chart presents comparisons of major liability balances between September 30, 2010, and September 30, 2011.
A discussion of the major categories of liability follows.
At $1.6 billion, Employee-related and other liabilities represent 35 percent of the FAA’s total liabilities. These liabilities increased by $67.1 million as of September 30, 2011, and are comprised mainly of $150.9 million in advances received, $208.5 million in Federal Employee’s Compensation Act payable, $422.3 million in accrued payroll and benefits, $521.5 million in accrued leave and benefits, $66.2 million in legal claims liability, and $106.3 million in capital lease liability.
At $909.6 million, Federal employee benefits represent 21 percent of the FAA’s current year liabilities, and consist of the FAA’s expected liability for death, disability, and medical costs for approved workers’ compensation cases, plus a component for incurred but not reported claims. The Department of Labor (DOL) calculates the liability for DOT, and DOT attributes a proportionate amount to the FAA based upon actual workers’ compensation payments to FAA employees over the preceding four years. This liability is updated an on annual basis at year’s end.
Environmental liabilities represent 17 percent of the FAA’s total liabilities and totaled $757.4 million as of September 30, 2011, compared with $796.2 million a year earlier. Environmental liabilities include a component for remediation of known contaminated sites and the estimated environmental cost of decommissioning assets presently in service. The FAA’s grants payable, which are estimated amounts incurred but not yet claimed by AIP grant recipients, represent 15 percent of liabilities. Grants payable increased $96.0 million, primarily due to the effects of the interruption of construction during the furlough. Accounts payable, which are amounts that the FAA owes to
21
COMPOSITION OF LIABILITIESAs of September 30, 2011
Accounts payable
Grants payable
Environmental liabilities
Employee related and other liabilities
Federal employee benefits
15%
21% 17%
35%
12%
LIABILITIES COMPARISON(Dollars in Thousands)
$0 $.5M $1M $1.5M $2M
Accounts payable
Grants payable
Environmental liabilities
Federal employee benefits
Employee related and other liabilities
2011
2010
other entities for unpaid goods and services, increased $58.9 million.
FAA's summarized net cost of operations is shown on page 25.
As of September 30, 2011, and September 30, 2010, FAA’s net costs were $16.7 billion and $16.9 billion, respectively. The Composition of Net Cost chart illustrates the distribution of costs among the FAA’s four LOBs. The Net Cost Comparison chart compares September 30, 2011, and September 30, 2010, net costs.
With a net cost of $11.6 billion, the ATO is the FAA’s largest organization, comprising 69 percent of total net costs. The ATO’s net costs increased by $374.6 million, on
a comparative basis, primarily from increases in labor costs coupled with increases in contractor services.
The ARP is FAA’s second largest organization, with a net cost of $3.4 billion as of September 30, 2011, which is 20 percent of the FAA’s total net costs. Net costs decreased by $626.6 million from the prior year, primarily due to a decrease in Airport Improvement Program grant disbursements on a comparative basis.
The net cost of the AVS represents 8 percent of the FAA’s total net costs, while Region and Center Operations and All Other comprise 3 percent of total net costs.
FAA's summarized changes in net position are shown on page 25. Net Position presents those accounting items that caused the net position section of the balance sheet to change
COMPOSITION OF NET COSTSAs of September 30, 2011
Air Traffic Organization
Aviation Safety
20%
8%
69%
3%
Airports
Regional and Center Operations & All Other
NET COST COMPARISON(Dollars in Thousands)
$0 $2M $4M $6M $8M $10M $12M
Regions and Center Operations & All Other
Aviation Safety
Airports
Air Traffic Organization
2011
2010
Financial Highlights
Federal Aviation Administration | Fiscal Year 2011 Summary of Performance and Financial Information422
Financial Highlights
AVIATION GOES GREEN
NextGen encompasses a variety of innovative environmental and energy efficiency efforts. NextGen’s Continuous Lower Energy, Emissions and Noise (CLEEN) program accelerates the development and certification of promising new engine and airframe technologies and sustainable alternative fuels. These will improve air quality and lower net carbon dioxide emissions, moving the industry closer to the goal of carbon-neutral aviation growth by 2020.
CAAFI’s Success with New “Drop-in” FuelsThe FAA is a principal sponsor of the Commercial Aviation Alternative Fuels Initiative (CAAFI). In 2009, the group helped secure approval for an alternative “drop-in" fuel that can be made out of coal, natural gas, or “biomass” (garbage, wood, waste, landfill gases, or alcohol fuels). “Drop-in” means that there is no need to change the engines or equipment already in use.
The alternative fuel was approved for use at a 50 percent blend. This is the first time in 20 years that a new standard for jet fuel has been certified. http://www.faa.gov/news/speeches/news_story.cfm?newsId=12537
In July 2011, renewable, “drop-in,” commercial biofuel made from plants, algae, or other sustainable sources, was approved for use at a 50 percent blend. This is the second alternative fuel approval. Work is already underway to advance approval of additional sustainable “drop-in” alternative fuels and fuel blends made from alcohols, biomass, and sugars.
Next generation biofuels may have benefits over first generation biofuels from the standpoint of cost, environmental sustainability, and overall scale of production.
Greener Skies Over Seattle Seattle Tacoma International Airport (SEATAC) is home to FAA’s environmentally friendly “Greener Skies over Seattle” initiative, which employs NextGen satellite-based flight guidance technology. The technology involves Required Navigation Performance (RNP) approaches to minimize environmental impacts, delivering reduced emissions and less fuel burn.
FAA Administrator J. Randolph Babbitt estimates that for 2011, “Airlines using GPS-based arrival and approach procedures at SeaTac will save a total of about $9 million per year at today’s fuel prices.” http://www.faa.gov/news/speeches/news_story.cfm?newsId=12723
For more on NextGen, see the spread on pages 4-5
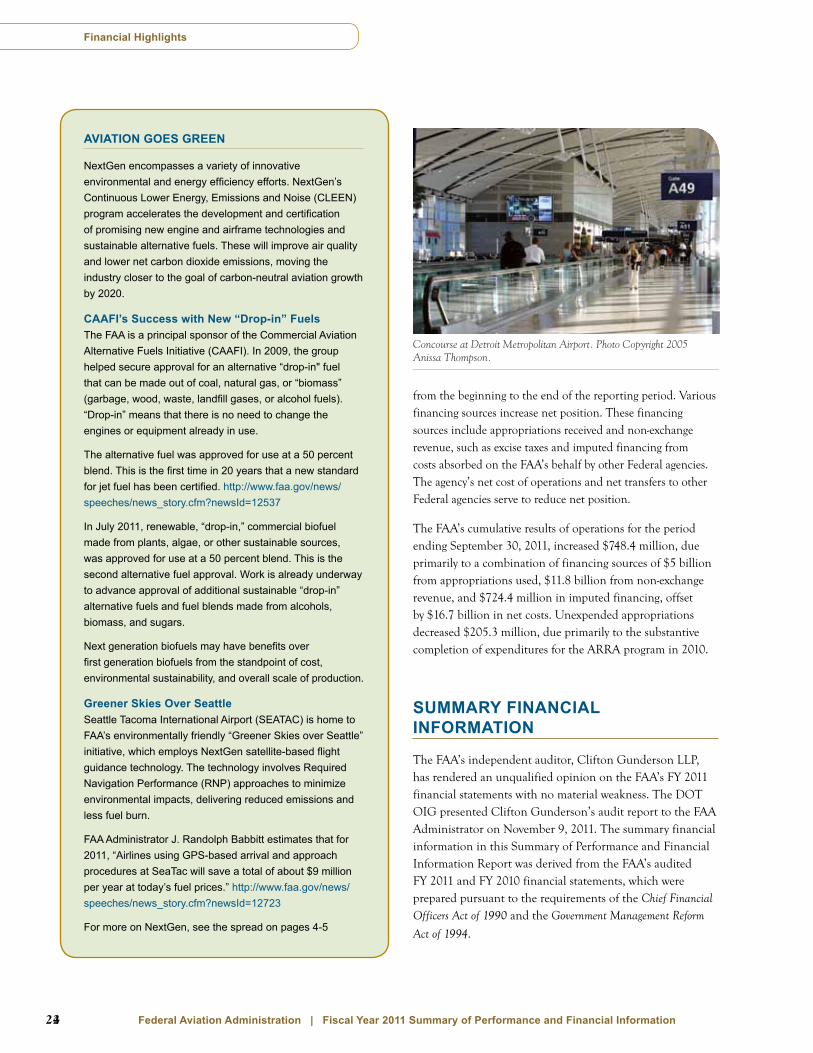
Concourse at Detroit Metropolitan Airport. Photo Copyright 2005 Anissa Thompson.
from the beginning to the end of the reporting period. Various financing sources increase net position. These financing sources include appropriations received and non-exchange revenue, such as excise taxes and imputed financing from costs absorbed on the FAA’s behalf by other Federal agencies. The agency’s net cost of operations and net transfers to other Federal agencies serve to reduce net position.
The FAA’s cumulative results of operations for the period ending September 30, 2011, increased $748.4 million, due primarily to a combination of financing sources of $5 billion from appropriations used, $11.8 billion from non-exchange revenue, and $724.4 million in imputed financing, offset by $16.7 billion in net costs. Unexpended appropriations decreased $205.3 million, due primarily to the substantive completion of expenditures for the ARRA program in 2010.
SUMMARY FINANCIAL INFORMATION
The FAA’s independent auditor, Clifton Gunderson LLP, has rendered an unqualified opinion on the FAA’s FY 2011 financial statements with no material weakness. The DOT OIG presented Clifton Gunderson’s audit report to the FAA Administrator on November 9, 2011. The summary financial information in this Summary of Performance and Financial Information Report was derived from the FAA’s audited FY 2011 and FY 2010 financial statements, which were prepared pursuant to the requirements of the Chief Financial Officers Act of 1990 and the Government Management Reform
Act of 1994.
23
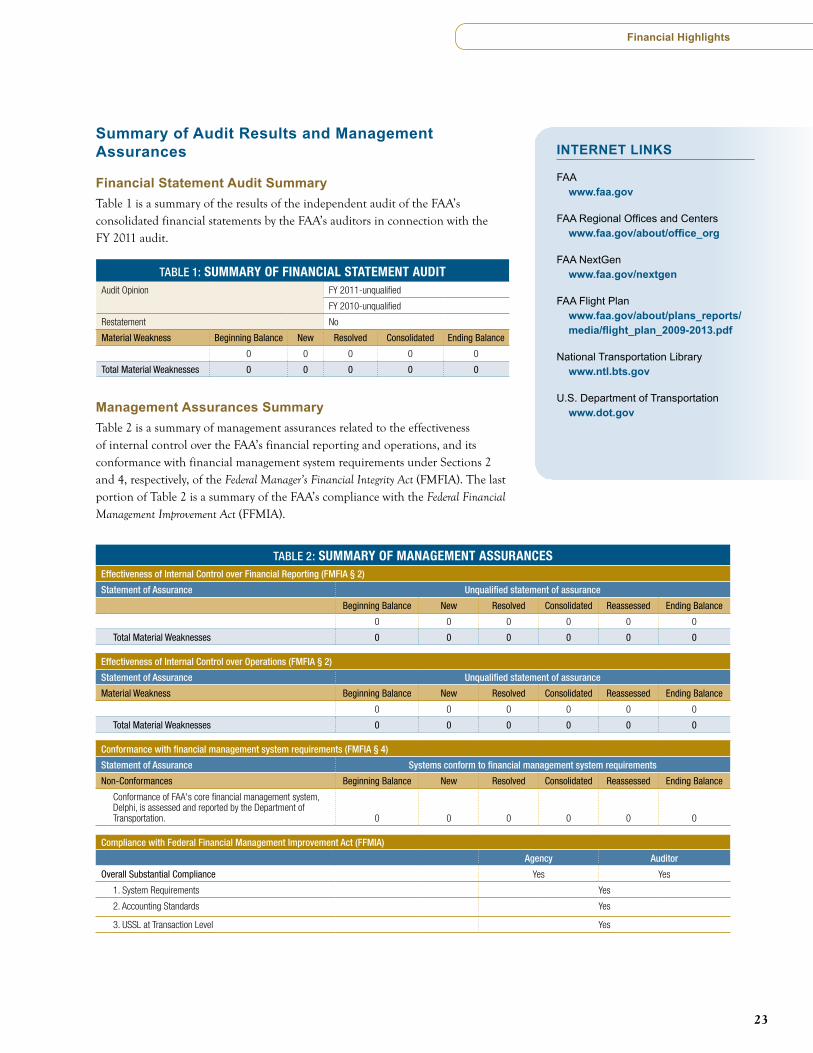
Summary of Audit Results and Management Assurances
Financial Statement Audit Summary Table 1 is a summary of the results of the independent audit of the FAA’s consolidated financial statements by the FAA’s auditors in connection with the FY 2011 audit.
TABLE 1: SUMMARY OF FINANCIAL STATEMENT AUDITAudit Opinion FY 2011-unqualified
FY 2010-unqualified
Restatement No
Material Weakness Beginning Balance New Resolved Consolidated Ending Balance
0 0 0 0 0
Total Material Weaknesses 0 0 0 0 0
Management Assurances SummaryTable 2 is a summary of management assurances related to the effectiveness of internal control over the FAA’s financial reporting and operations, and its conformance with financial management system requirements under Sections 2 and 4, respectively, of the Federal Manager’s Financial Integrity Act (FMFIA). The last portion of Table 2 is a summary of the FAA’s compliance with the Federal Financial Management Improvement Act (FFMIA).
TABLE 2: SUMMARY OF MANAGEMENT ASSURANCES Effectiveness of Internal Control over Financial Reporting (FMFIA § 2)
Statement of Assurance Unqualified statement of assurance
Beginning Balance New Resolved Consolidated Reassessed Ending Balance
0 0 0 0 0 0
Total Material Weaknesses 0 0 0 0 0 0 Effectiveness of Internal Control over Operations (FMFIA § 2)
Statement of Assurance Unqualified statement of assurance
Material Weakness Beginning Balance New Resolved Consolidated Reassessed Ending Balance
0 0 0 0 0 0
Total Material Weaknesses 0 0 0 0 0 0
Conformance with financial management system requirements (FMFIA § 4)
Statement of Assurance Systems conform to financial management system requirements
Non-Conformances Beginning Balance New Resolved Consolidated Reassessed Ending Balance
Conformance of FAA's core financial management system, Delphi, is assessed and reported by the Department of Transportation. 0 0 0 0 0 0
Compliance with Federal Financial Management Improvement Act (FFMIA)
Agency Auditor
Overall Substantial Compliance Yes Yes
1. System Requirements Yes
2. Accounting Standards Yes
3. USSL at Transaction Level Yes
INTERNET LINKS
FAA www.faa.gov
FAA Regional Offices and Centers www.faa.gov/about/office_org
FAA NextGen www.faa.gov/nextgen
FAA Flight Plan www.faa.gov/about/plans_reports/media/flight_plan_2009-2013.pdf
National Transportation Library www.ntl.bts.gov
U.S. Department of Transportation www.dot.gov
Financial Highlights
Federal Aviation Administration | Fiscal Year 2011 Summary of Performance and Financial Information424
For the full Clifton Gunderson report and the FAA response, see the FY 2011 PAR, pages 87-96, available on the FAA Web site at www.faa.gov/about/plans_reports.
Financial Highlights
25
Financial Highlights
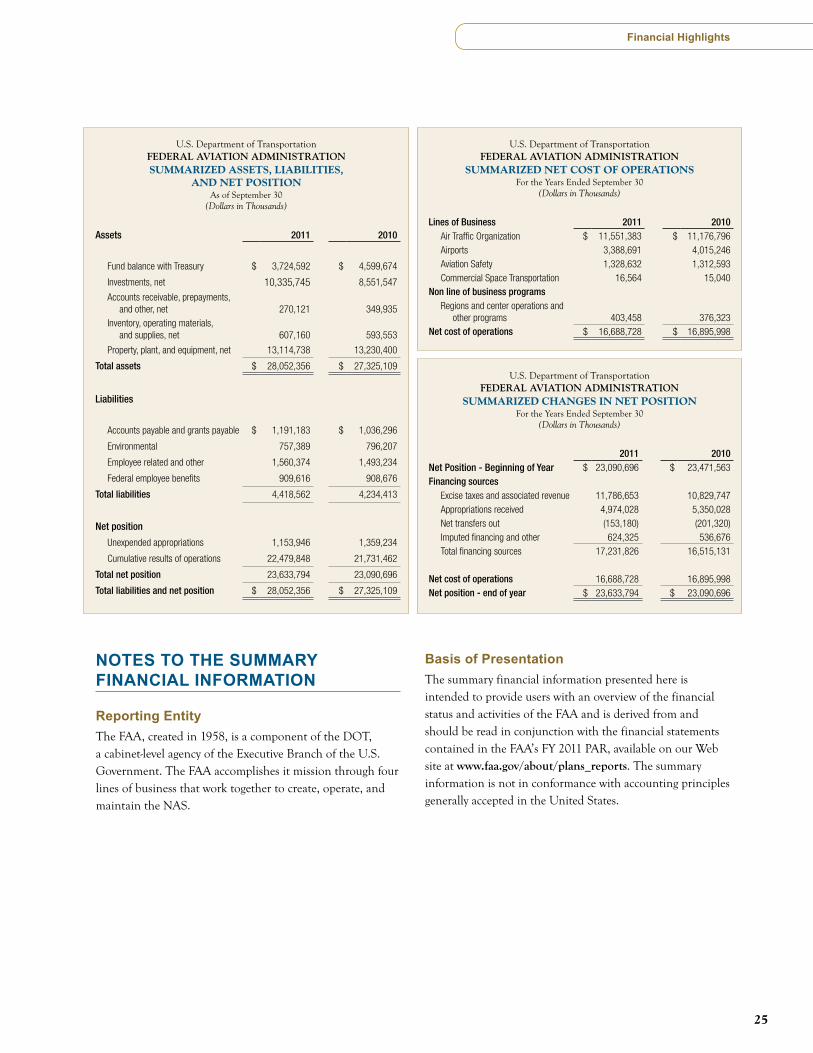
U.S. Department of TransportationFEDERAL AVIATION ADMINISTRATIONSUMMARIZED ASSETS, LIABILITIES,
AND NET POSITIONAs of September 30
(Dollars in Thousands)
Assets 2011 2010
Fund balance with Treasury $ 3,724,592 $ 4,599,674
Investments, net 10,335,745 8,551,547
Accounts receivable, prepayments, and other, net 270,121 349,935
Inventory, operating materials, and supplies, net 607,160 593,553
Property, plant, and equipment, net 13,114,738 13,230,400
Total assets $ 28,052,356 $ 27,325,109
Liabilities
Accounts payable and grants payable $ 1,191,183 $ 1,036,296
Environmental 757,389 796,207
Employee related and other 1,560,374 1,493,234
Federal employee benefits 909,616 908,676
Total liabilities 4,418,562 4,234,413
Net position
Unexpended appropriations 1,153,946 1,359,234
Cumulative results of operations 22,479,848 21,731,462
Total net position 23,633,794 23,090,696
Total liabilities and net position $ 28,052,356 $ 27,325,109
U.S. Department of TransportationFEDERAL AVIATION ADMINISTRATION
SUMMARIZED NET COST OF OPERATIONSFor the Years Ended September 30
(Dollars in Thousands)
Lines of Business 2011 2010Air Traffic Organization $ 11,551,383 $ 11,176,796 Airports 3,388,691 4,015,246 Aviation Safety 1,328,632 1,312,593 Commercial Space Transportation 16,564 15,040
Non line of business programsRegions and center operations and
other programs 403,458 376,323 Net cost of operations $ 16,688,728 $ 16,895,998
U.S. Department of TransportationFEDERAL AVIATION ADMINISTRATION
SUMMARIZED CHANGES IN NET POSITIONFor the Years Ended September 30
(Dollars in Thousands)
2011 2010Net Position - Beginning of Year $ 23,090,696 $ 23,471,563 Financing sources
Excise taxes and associated revenue 11,786,653 10,829,747 Appropriations received 4,974,028 5,350,028 Net transfers out (153,180) (201,320)Imputed financing and other 624,325 536,676 Total financing sources 17,231,826 16,515,131
Net cost of operations 16,688,728 16,895,998 Net position - end of year $ 23,633,794 $ 23,090,696
NOTES TO THE SUMMARY FINANCIAL INFORMATION
Reporting Entity The FAA, created in 1958, is a component of the DOT, a cabinet-level agency of the Executive Branch of the U.S. Government. The FAA accomplishes it mission through four lines of business that work together to create, operate, and maintain the NAS.
Basis of Presentation The summary financial information presented here is intended to provide users with an overview of the financial status and activities of the FAA and is derived from and should be read in conjunction with the financial statements contained in the FAA’s FY 2011 PAR, available on our Web site at www.faa.gov/about/plans_reports. The summary information is not in conformance with accounting principles generally accepted in the United States.

WE WELCOME YOUR COMMENTS
Thank you for your interest in the FAA’s FY 2011 Performance and Accountability Report. We welcome your comments on how we can make this report more informative for our readers.
Please send your comments to Mail: Office of Financial Reporting and Accountability
Federal Aviation Administration 800 Independence Avenue, SW Room 612 Washington, DC 20591
Phone: 202–267–3018 eMail: [email protected] Fax: 202–493–4191
This report and reports from prior years are available on the FAA Web site at www.faa.gov/about/plans_reports.
For a printed copy, call 202–267–3018 or email [email protected].
800 Independence Avenue, SWWashington, DC 20591
www.faa.gov
HQ121535


