NASA / CR- 1998-207642 Fabrication and Testing of Mo-Re Heat Pipes Embedded in Carbon/Carbon David E. Glass Analytical Services & Materials, Inc., Hampton, VA Michael A. Merrigan and J. Tom Sena Los Alamos National Laboratory, Los Alamos, NM National Aeronautics and Space Administration Langley Research Center Hampton, Virginia 23681-2199 Prepared for Langley Research Center under Contract NAS1-96014 March 1998 https://ntrs.nasa.gov/search.jsp?R=19980048413 2020-04-02T09:42:44+00:00Z
Transcript
NASA / CR- 1998-207642
Fabrication and Testing of Mo-Re HeatPipes Embedded in Carbon/Carbon
David E. Glass
Analytical Services & Materials, Inc., Hampton, VA
Michael A. Merrigan and J. Tom Sena
Los Alamos National Laboratory, Los Alamos, NM
National Aeronautics andSpace Administration
Langley Research CenterHampton, Virginia 23681-2199
Prepared for Langley Research Centerunder Contract NAS1-96014
The use of trademarks or names of manufacturers in this report is for
accurate reporting and does not constitute an official endorsement, eitherexpressed or implied, of such products or manufacturers by the NationalAeronautics and Space Adminstration or by Analytical Services &
Materials, Inc.
Available from the following:
NASA Center for AeroSpace Information (CASI)
800 Elkridge Landing Road
Linthicum Heights, MD 21090-2934
(301) 621-0390
National Technical Information Service (NTIS)
5285 Port Royal Road
Springfield, VA 22161-2171(703) 487-4650
Fabrication and Testing of Mo-Re Heat PipesEmbedded in Carbon/Carbon
David E. Glass
Analytical Services & Materials, Inc., Hampton, VA
Michael A. Merrigan and J. Tom Sena
Los Alamos National Laboratory, Los Alamos, NM
Abstract
Refractory-composite/heat-pipe-cooled wing and tail leading edges are beingconsidered for use on hypersonic vehicles to limit maximum temperatures to values
below material reuse limits and to eliminate the need to actively cool the leading edges.The development of a refractory-composite/heat-pipe-cooled leading edge has evolvedfrom the design stage to the fabrication and testing of heat pipes embedded incarbon/carbon (C/C). A three-foot-long, molybdenum-rhenium heat pipe with a lithium
working fluid was fabricated and tested at an operating temperature of 2460°F to verifythe individual heat-pipe design. Following the fabrication of this heat pipe, threeadditional heat pipes were fabricated and embedded in C/C. The C/C heat-pipe testarticle was successfully tested using quartz lamps in a vacuum chamber in both ahorizontal and vertical orientation. Start up and steady state data are presented for the
C/C heat-pipe test article. Radiography and eddy current evaluations were performed onthe test article.
Introduction
Stagnation regions, such as wing and tail leading edges and nose caps, are criticaldesign areas for hypersonic aerospace vehicles because of the hostile thermalenvironment those regions experience during flight. As a hypersonic vehicle travelsthrough the earth's atmosphere, the high local heating and aerodynamic forces cause
extremely high temperatures, severe thermal gradients, and high stresses. Analyticalstudies and laboratory and wind tunnel tests [1-12] indicate that a solution to the thermal-
structural problems associated with stagnation regions of hypersonic aerospace vehiclesmight be alleviated by the use of heat pipes to cool these regions. Recent work to
develop a novel refractory-composite/refractory-metal heat-pipe-cooled leading-edgeconcept for hypersonic vehicles combines advanced high-temperature materials, coatings,and fabrication techniques with an innovative thermal-structural design. Preliminarydesign studies [13] indicate that a heat-pipe-cooled leading edge can reduce the leading-edge mass significantly compared to an actively cooled leading edge, can completelyeliminate the need for active cooling, and has the potential to provide failsafe andredundant features.
The present paper discusses several tests to help verify the fabrication andperformanceof a heat-pipe-cooledleadingedgefor hypersonicvehicles. A three-foot-long molybdenum-rhenium(Mo-Re) "D-shaped"heatpipe was fabricatedand heatedwith induction heatingin a vacuumchamberto an operationaltemperatureof 2460°F.The heatpipeusedlithium asthe workingfluid andhada"D-shaped"cross-section.Theheat-pipewick wasconstructedof 400 x 400 meshMo-Re screenwith a single arteryalongthelengthof theheatpipe. Thesamedesignwasusedto constructthreeadditionalheatpipeswhich wereembeddedin C/C. TheC/C testarticlewasthentestedwith quartzlampsin a vacuumchamberin both the vertical andhorizontal orientation. All of theheat-pipefabricationwasperformedatLosAlamosNationalLaboratory(LANL) andthetestingwasperformedbothat LANL andNASA LangleyResearchCenter.
Description of Heat-Pipe-Cooled Leading-Edge Concept
Heat pipes are being considered for use on both the wing and vertical tails of
hypersonic vehicles. A brief description of how heat pipes operate and are applied forleading-edge cooling is first presented, followed by a description of the proposed heat-
pipe-cooled leading-edge concept.
Leading-Edge Heat-Pipe Operation
Heat pipes transfer heat nearly isothermally by the evaporation and condensation of aworking fluid, as illustrated in Figure 1. The heat is absorbed within the heat pipe byevaporation of the working fluid. The evaporation results in an internal pressuredifferential that causes the vapor to flow from the evaporator region to the condenser
region, where it condenses and gives up heat. The cycle is completed with the returnflow of the liquid condensate to the evaporator region by the capillary action of a wick.
Figure 1: Schematic diagram of the operation of a heat pipe showing the heat-pipecontainer, working fluid, and wick.
Heat pipes provide cooling of the stagnation region by transferring heat nearlyisothermally to locations aft of the stagnation region, thus raising the temperature aft of
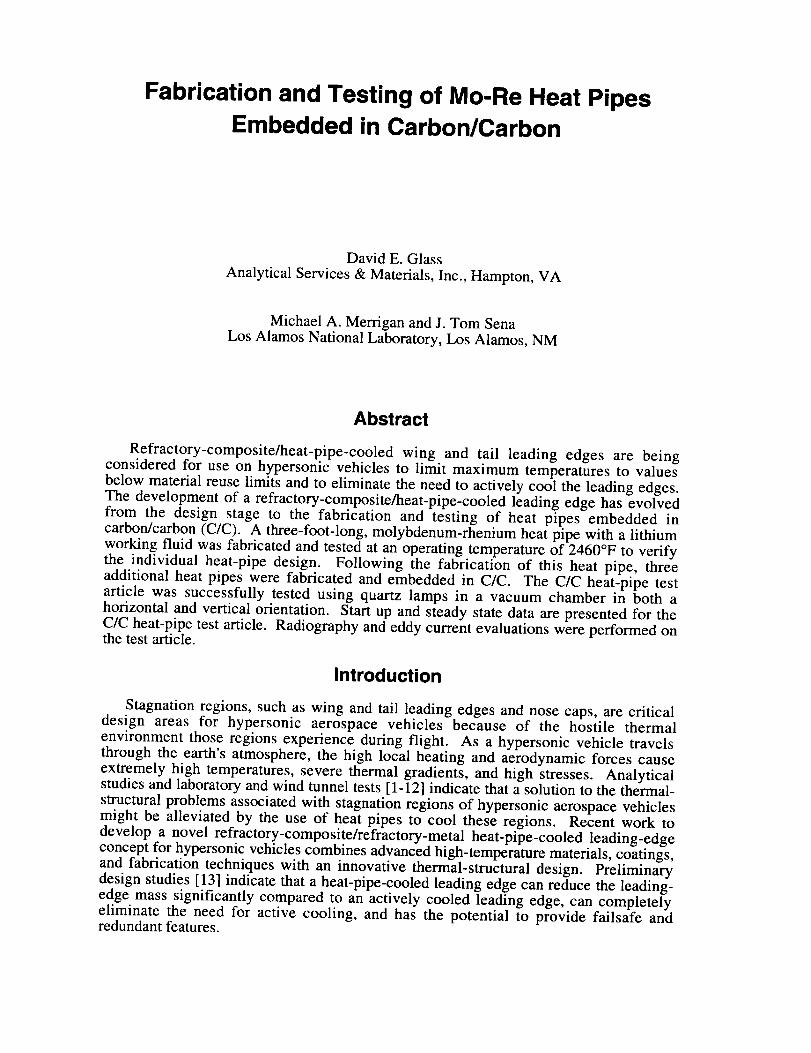
the stagnation region above the expected radiation equilibrium temperature. Whenapplied to leading-edge cooling, heat pipes operate by accepting heat at a high rate over asmall area near the stagnation region and radiating it at a lower rate over a larger surfacearea, as shown in Figure 2. The use of heat pipes results in a nearly isothermal leading-
edge surface; reducing the temperatures in the stagnation region and raising thetemperatures of both the upper and lower aft surfaces.
Figure 2: Schematic diagram of a heat-pipe-cooled leading edge showing regions of netheat input (evaporator) and net heat output (condenser).
Carbon/Carbon Heat-Pipe-Cooled Wing-Leading-Edge
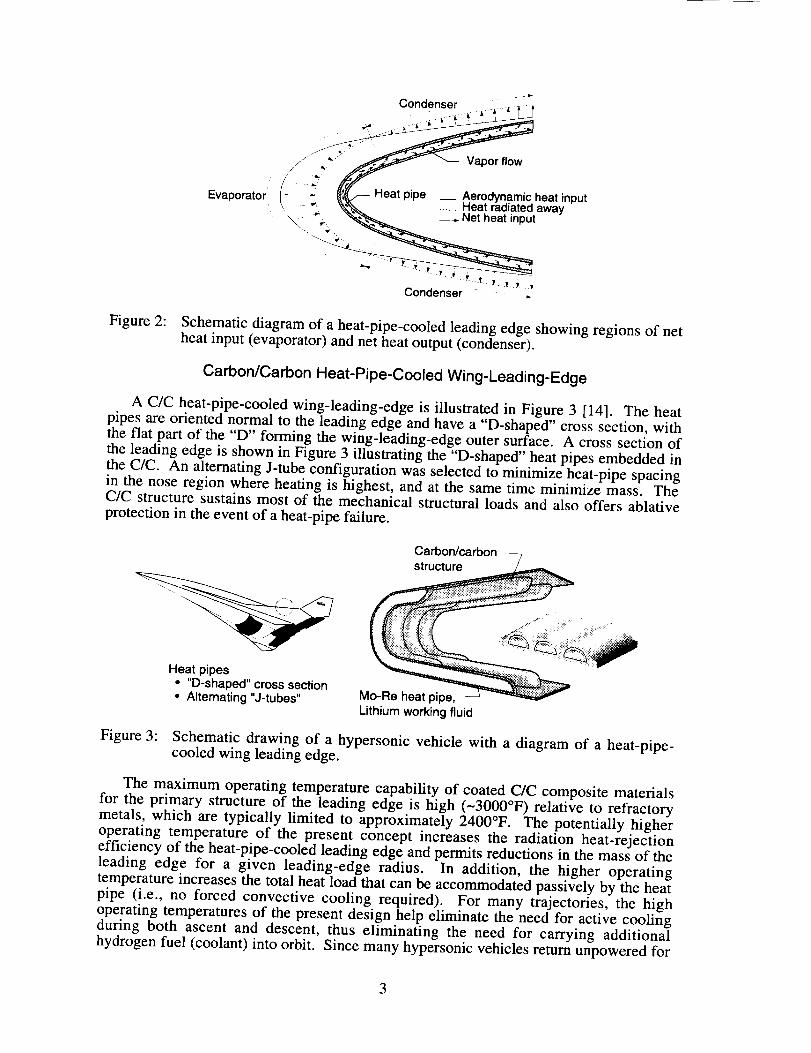
A C/C heat-pipe-cooled wing-leading-edge is illustrated in Figure 3 [14]. The heatpipes are oriented normal to the leading edge and have a "D-shaped" cross section, withthe flat part of the "D" forming the wing-leading-edge outer surface. A cross section of
the leading edge is shown in Figure 3 illustrating the "D-shaped" heat pipes embedded in
the C/C. An alternating J-tube configuration was selected to minimize heat-pipe spacingin the nose region where heating is highest, and at the same time minimize mass. TheC/C structure sustains most of the mechanical structural loads and also offers ablativeprotection in the event of a heat-pipe failure.
Schematic drawing of a hypersonic vehicle with a diagram of a heat-pipe-cooled wing leading edge.
The maximum operating temperature capability of coated C/C composite materials
for the primary structure of the leading edge is high (~3000°F) relative to refractorymetals, which are typically limited to approximately 2400°F. The potentially higheroperating temperature of the present concept increases the radiation heat-rejectionefficiency of the heat-pipe-cooled leading edge and permits reductions in the mass of the
leading edge for a given leading-edge radius. In addition, the higher operatingtemperature increases the total heat load that can be accommodated passively by the heatpipe (i.e., no forced convective cooling required). For many trajectories, the highoperating temperatures of the present design help eliminate the need for active coolingduring both ascent and descent, thus eliminating the need for carrying additionalhydrogen fuel (coolant) into orbit. Since many hypersonic vehicles return unpowered for
3
landing, the additional hydrogen fuel needed for cooling during descent would result in a
mass penalty.
Results and Discussion
Initially, a single heat pipe with a "D-shaped" cross section was fabricated and testedto 2460°F in a vacuum. Upon determining that the heat-pipe design was adequate, three
additional heat pipes were fabricated. These three heat pipes were then embedded in C/Cand tested in a vacuum chamber. A discussion of each of these heat-pipe tests follows.
Design Validation Heat Pipe
A "D-shaped" heat pipe was fabricated and tested to determine the performancecharacteristics of the heat pipe designed for cooling the wing leading edge. A descriptionof the fabrication procedure for the heat pipe is given followed by a discussion of the
heat-pipe testing. Both the fabrication and testing of the design validation heat pipe were
performed at LANL.
Figure 4: Photograph of a section of "D-tube" and screen wick.
Figure 5 Photograph of the parts of the heat pipe prior to final welding, showing the"D-shaped" screen wick, heat-pipe container, end caps, and fill tube.
4
Theheatpipe wasfabricatedfrom aMo-41Re"D-shaped"tubethatwasdrawnfroman arc-castbar at ThermoElectronTecomet, Wilmington, MA. A screenwick wasfabricated by wrapping four layers of 400 x 400 meshMo-5Re screenarounda "D-shaped"mandrel. Figure 4 shows a photographof a sectionof the "D-tube" and thescreenwick. A 0.10-in-diameterarterywasincludedin thewick. Thearteryis locatedinthetop centerof thecurvedportionof theheatpipeandhasa springin it to helpmaintainits shape. Superimposedin Figure 4 is a photographof the closeoutat oneend of thewick. Oneendof thewick is closedout asin thephotograph,while theotherendis openandis coveredby a pool of liquid lithium during operation. Mo-41Reend capsweremachinedandweldedto theendsof theheatpipe. A photographof all of the individualpartsprior to thefinal assemblyis shownin Figure5.
After the heatpipe was assembled,Li vapor was distilled into the heatpipe. Aschematicdiagramof thedistillation apparatusis shownin Figure6. Thedistillation potwasheatedby inductionheating. All of the lithium wasdistilled into the heatpipe toinsurethepurityof the lithium. After the lithium wasdistilled into theheatpipe,theheatpipewasclosedby theuseof avalve.
Figure6:
n_j-Vacuum
ThermocoupleNo.l_ I_/-Tube from charge
__1_ loadingpot
Distillation potcoil
Thermocouple No. 2 _ H_ee_e_Thermocouple No. 3 ' volume" pot
Chill block _
Therm°c°uple N°. 4 _//_ I
Thermocouple No. 5 J ' '
Thermocouple No. 6
_Heat pipe
Schematic diagram of the lithium distillation apparatus used to charge the heatpipes.
The heat pipe was then instrumented with thermocouples. One thermocouple waslocated over the evaporator section end cap, while the remaining thermocouples werespaced along the condenser as shown schematically in Figure 7. A thin piece of 1/16-in.by 1/4-in. Ni foil, was spot welded to the Mo-Re heat pipe. W/W-26Re thermocoupleswere then spot welded to the Ni foil. The accuracy of the thermocouples is +8°F below
800°F and +1% above 800°F. The spot welding of the Ni foil and the thermocouples wasdone in an open atmosphere. All of the thermocouples were centered on the flat portionof the heat pipe.
5
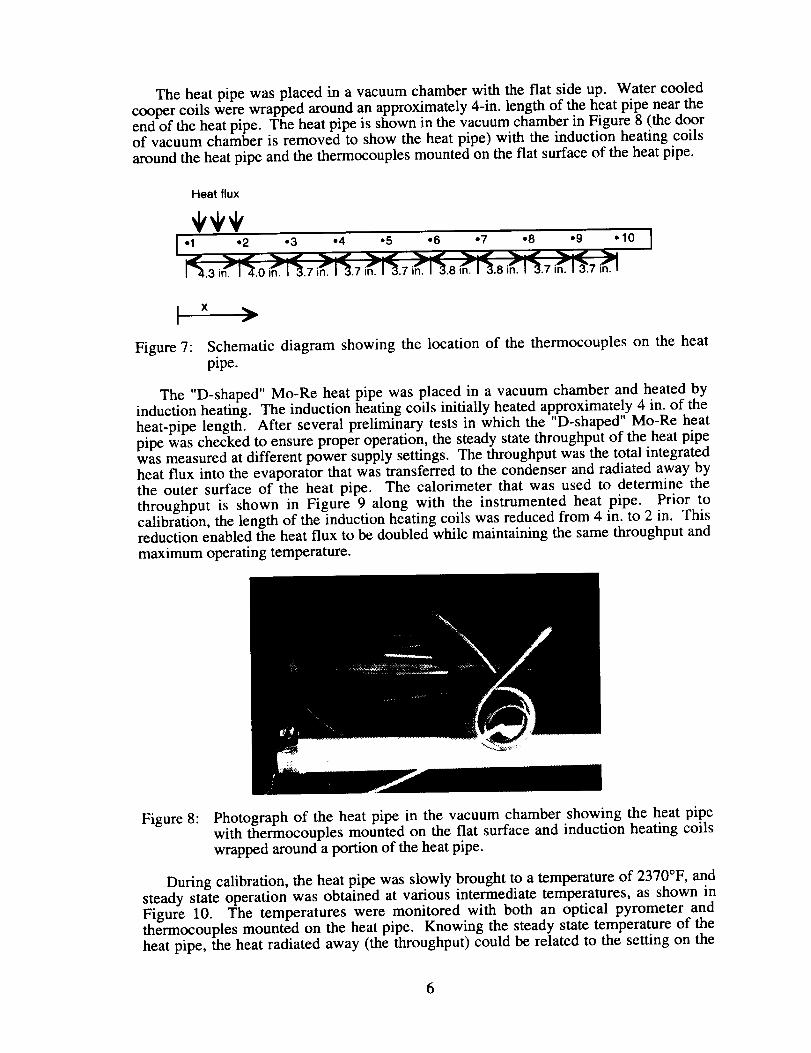
Theheatpipe wasplacedin a vacuumchamberwith theflat sideup. Watercooledcoopercoils werewrappedaroundanapproximately4-in. lengthof theheatpipeneartheendof theheatpipe. Theheatpipe is shownin thevacuumchamberin Figure8 (thedoorof vacuumchamberis removedto showtheheatpipe) with the induction heatingcoilsaroundtheheatpipeandthethermocouplesmountedon theflat surfaceof theheatpipe.
Heat flux
IF f F f ,f .f f =in. I 3.7_.3 in I_0 i, 1`3.7 in. 1`3.7 in. 1"3.7 in. 1`3.8 ,n. 1"3.8 on. 1`3.7 i_.l
f
Figure 7: Schematic diagram showing the location of the thermocouples on the heatpipe.
The "D-shaped" Mo-Re heat pipe was placed in a vacuum chamber and heated byinduction heating. The induction heating coils initially heated approximately 4 in. of theheat-pipe length. After several preliminary tests in which the "D-shaped" Mo-Re heatpipe was checked to ensure proper operation, the steady state throughput of the heat pipewas measured at different power supply settings. The throughput was the total integratedheat flux into the evaporator that was transferred to the condenser and radiated away bythe outer surface of the heat pipe. The calorimeter that was used to determine the
throughput is shown in Figure 9 along with the instrumented heat pipe. Prior tocalibration, the length of the induction heating coils was reduced from 4 in. to 2 in. Thisreduction enabled the heat flux to be doubled while maintaining the same throughput and
maximum operating temperature.
Figure 8: Photograph of the heat pipe in the vacuum chamber showing the heat pipewith thermocouples mounted on the fiat surface and induction heating coils
wrapped around a portion of the heat pipe.
During calibration, the heat pipe was slowly brought to a temperature of 2370°F, andsteady state operation was obtained at various intermediate temperatures, as shown inFigure 10. The temperatures were monitored with both an optical pyrometer andthermocouples mounted on the heat pipe. Knowing the steady state temperature of theheat pipe, the heat radiated away (the throughput) could be related to the setting on the
6
power supply. The throughput for the steady state conditions are listed on the figure.However, due to the temperature dependence of the electrical resistance of the Mo-Re
material, the heat input at a given power setting is different for different heat-pipetemperatures. Thus, the heat input determined from the measured throughput is not as
accurate during transient conditions as during steady state operation. The heat pipeappeared to operate normally and maintained a nearly uniform temperature along itslength.
Figure 9: Photograph of the heat pipe with thermocouples and the calorimeter used todetermine the throughput.
The heat pipe appeared to operate normally and maintained a nearly uniformtemperature along its length. As mentioned previously, the first thermocouple wasmounted over the endcap. Since it was mounted over the endcap, which was inductivelyheated but not cooled by the heat pipe, the first thermocouple temperature is slightlyhigher than the rest of the heat pipe. After the heat pipe reached a steady statetemperature of ~2370°F, the power to the heat pipe was turned off and the heat pipe wasallowed to cool.
Temp, °F
2800
2400
2000
1600
1200
800
400
0
0 4 8 12
q = 3.10 Btu/s
q = 0.38 Btu/s
I I I
16 20 24 28
Position, in.
q, Btu/s3.10
2.14
1.68
1.34
1.07
0.91
0.80
0.64
0.510.45
0.38
I I
32 36
Figure 10: Steady state temperature distributions for a range of heat fluxes. (T = +1%)
7
Inspectionof theheat pipe after removal from the vacuum chamber indicated thatseveral of the thermocouple wires were cracked near the location where they werewelded to the Ni foil. All of the thermocouple wires were then cut off near where theywere welded to the Ni foil. To hold the thermocouple wires steady and to decrease thechance of the wires cracking, the alumina insulation around the thermocouple wires was
held in place with thin-gage tantalum wire. The thermocouple wires were then spotwelded to the Ni foil on the Mo-Re heat pipe. The heat pipe was then placed in thevacuum chamber for subsequent induction heating.
During the heating of the heat pipe, it was noticed that the evaporator end cap of theheat pipe was much brighter in color (and thus hotter) than the remaining portion of theheat pipe. The end cap was too close to the induction heating coils, and as a result, wasbeing inductively heated. The portion of the heat pipe directly under the induction coils,though receiving a high heat flux due to the inductive heating, was being cooled by theoperation of the heat pipe. The end cap, however, was not cooled, but was inductivelycoupled. The heat pipe was heated to approximately 246p°F, with a heat flux in theevaporator region (under the induction coils) of 141 Btu/ft -s, and a throughput of 3.1Btu/s. When the heat-pipe operating temperature reached ~2460°F, the temperature ofthe end cap of the heat pipe was approximately 2820°F. It was then noticed that the flatportion of the heat pipe had deformed outward, and was no longer fiat. The power to theinduction heaters was turned off, and the heat pipe was allowed to cool.
After the heat pipe cooled down to room temperature, it was visually inspected. The
permanent deformation of the flat surface resulted in a cross-sectional thickness increasefrom 0.32 in. to 0.398 in. The increase in cross-sectional thickness was measured with a
micrometer on the outside of the heat pipe. The deformation of the heat pipe occurredover nearly the entire length of the heat pipe. The last few inches of the condenser end ofthe heat pipe did not deform since it was at lower temperatures and pressures. In additionto the softening of the Mo-Re with increased temperature, the vapor pressure of the Liincreases exponentially with temperature. During the initial test with the heat pipeoperating at -2370°F, the vapor pressure in the heat pipe was 11 psi and no permanentstructural deformation occurred. The vapor pressure in the heat pipe during operation at~2460°F was 16 psi. However, with an end cap temperature of -2820°F, the local
pressure in the region of the end cap was 52 psi.
Figure 11: Photograph of the Li leak in the heat pipe.
A decision was made to continue testing the heat pipe by starting up the heat pipewith step changes in the applied heat flux occurring every two minutes. The heat pipebegan to start up as expected. However, a small jet of vaporized Li was soon observed inthe vicinity of the first thermocouple as shown in Figure 11. The heat pipe was operatedfor another 10 minutes, and then the power to the power supply was turned off. Since theheat pipe was fabricated with a small surplus of Li, and since the rate of mass loss of Lifrom the leak in the heat pipe was quite small, the operation of the heat pipe would not beeffected until all of the surplus Li had escaped from the heat pipe. The region where theleak occurred was at thermocouple number 1. Thermocouple number 1 had been weldedto the Ni foil three times, while all other thermocouples had only been welded twice. Inaddition, all the thermocouple spot welds were done in an open atmosphere. As
mentioned previously, the temperature of the heat pipe in the region of the first
8
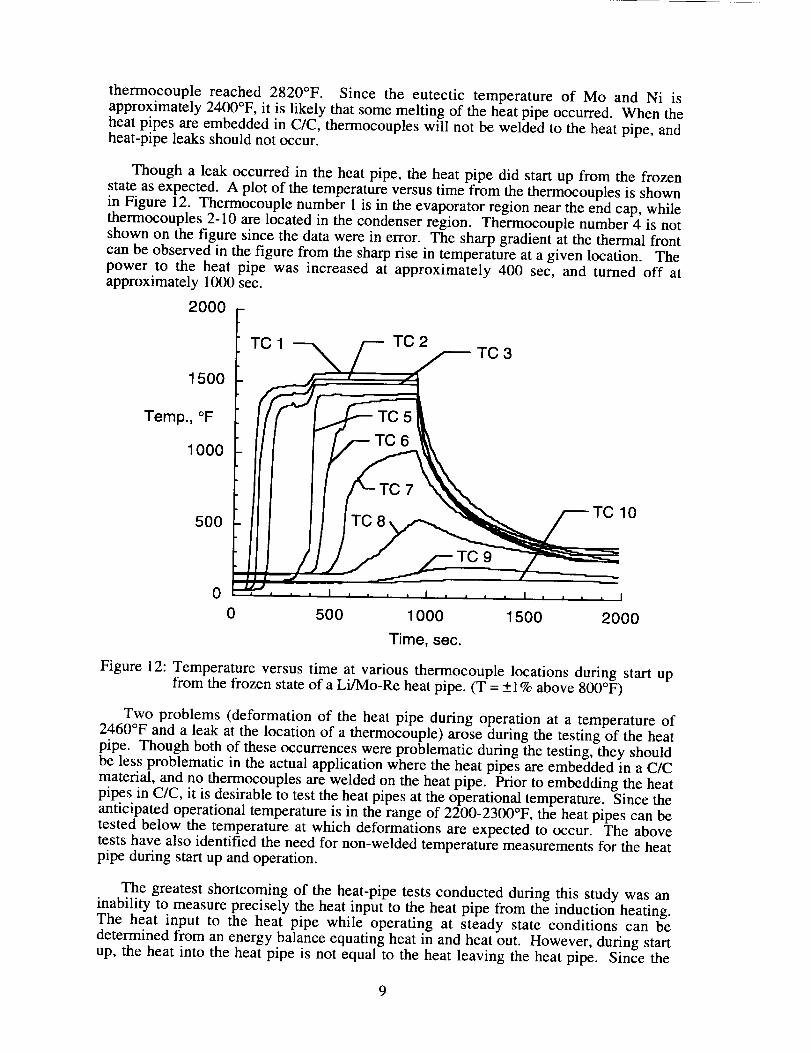
thermocouple reached 2820°F. Since the eutectic temperatureof Mo and Ni isapproximately2400°F,it is likely that somemeltingof theheatpipeoccurred. Whentheheatpipesareembeddedin C/C, thermocoupleswill not beweldedto theheatpipe, andheat-pipeleaksshouldnotoccur.
Thougha leak occurredin the heatpipe, the heatpipe did startup from the frozenstateasexpected.A plot of thetemperatureversustimefrom thethermocouplesis shownin Figure12. Thermocouplenumber1 is in theevaporatorregionneartheendcap,whilethermocouples2-10arelocatedin thecondenserregion. Thermocouplenumber4 is notshownon thefigure sincethedatawerein error. Thesharpgradientat thethermalfrontcanbeobservedin thefigure from thesharprise in temperatureat agiven location. Thepower to the heat pipe was increasedat approximately 400 sec, and turned off atapproximately1000sec.
20O0
1500
Temp.,°F
FTC 1
1000
5OO
TC 2TC 3
TC 5
TC 6
TC 9
TC 10
, , I , , _ _ I _ _ , , I
1000 1500 2000
Time, sec.
Figure 12: Temperature versus time at various thermocouple locations during start upfrom the frozen state of a Li/Mo-Re heat pipe. (T = + 1% above 800°F)
Two problems (deformation of the heat pipe during operation at a temperature of2460°F and a leak at the location of a thermocouple) arose during the testing of the heat
pipe. Though both of these occurrences were problematic during the testing, they shouldbe less problematic in the actual application where the heat pipes are embedded in a C/C
material, and no thermocouples are welded on the heat pipe. Prior to embedding the heatpipes in C/C, it is desirable to test the heat pipes at the operational temperature. Since theanticipated operational temperature is in the range of 2200-2300°F, the heat pipes can betested below the temperature at which deformations are expected to occur. The abovetests have also identified the need for non-welded temperature measurements for the heatpipe during start up and operation.
The greatest shortcoming of the heat-pipe tests conducted during this study was aninability to measure precisely the heat input to the heat pipe from the induction heating.The heat input to the heat pipe while operating at steady state conditions can be
determined from an energy balance equating heat in and heat out. However, during startup, the heat into the heat pipe is not equal to the heat leaving the heat pipe. Since the
9
electricalresistanceof theheat-pipematerialvariesasa functionof temperature,theheatinto theheatpipevaries duringstartupevenwith constantpowersettingson the powersupply.
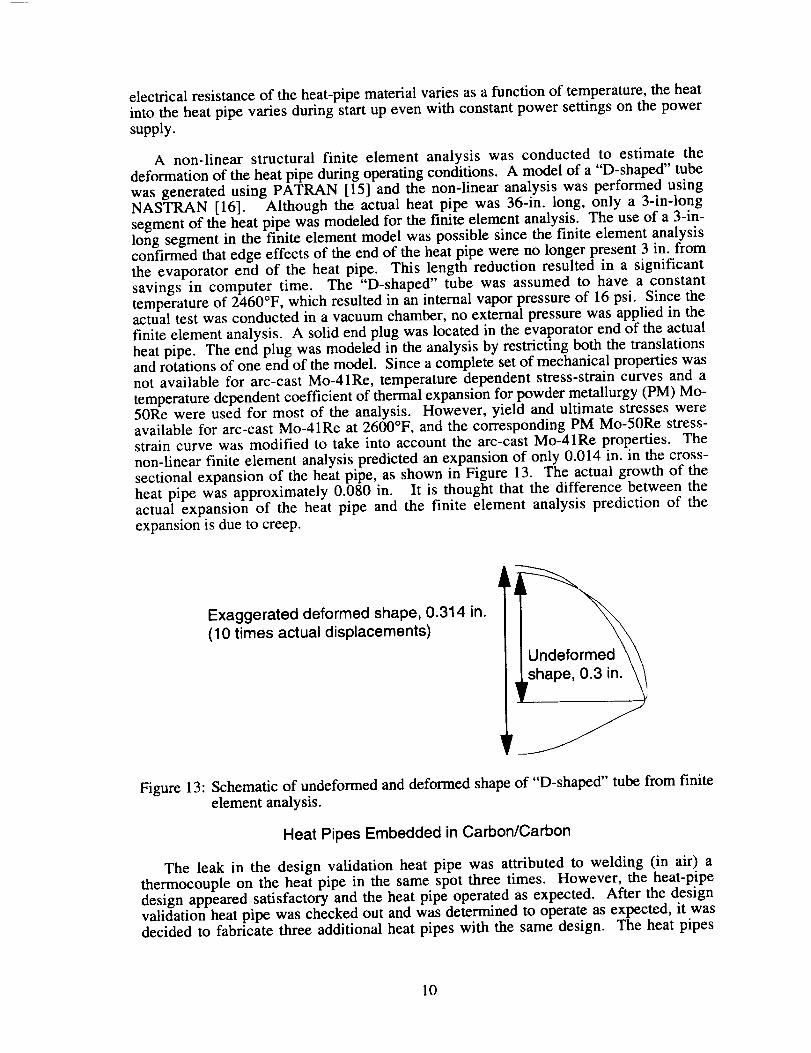
A non-linear structural finite element analysis was conducted to estimate thedeformationof theheatpipeduringoperatingconditions. A modelof a"D-shaped"tubewasgeneratedusing PATRAN [15] and the non-linearanalysiswas performedusingNASTRAN [16]. Although the actual heat pipe was 36-in. long, only a 3-in-longsegmentof theheatpipe wasmodeledfor thefinite elementanalysis.The useof a 3-in-long segmentin the finite elementmodelwaspossiblesincethe finite elementanalysisconfLrmedthatedgeeffectsof theendof theheatpipewereno longerpresent3 in. fromthe evaporatorend of the heatpipe. This length reduction resulted in a significantsavings in computer time. The "D-shaped" tube was assumedto have a constanttemperatureof 2460°F,whichresultedin aninternalvaporpressureof 16psi. Sincetheactualtestwasconductedin a vacuumchamber,no externalpressurewasappliedin thefinite elementanalysis. A solidendplug waslocatedin theevaporatorendof theactualheatpipe. Theend plug wasmodeledin theanalysisby restrictingboth thetranslationsandrotationsof oneendof themodel. Sincea completesetof mechanicalpropertieswasnot available for arc-castMo-41Re, temperaturedependentstress-straincurvesand atemperaturedependentcoefficientof thermalexpansionfor powdermetallurgy(PM) Mo-50Rewere usedfor most of the analysis. However,yield and ultimate stresseswereavailablefor arc-castMo-41Reat 2600°F,andthe correspondingPM Mo-50Restress-straincurve wasmodified to take into accountthe arc-castMo-41Reproperties. Thenon-linearfinite elementanalysispredictedanexpansionof only 0.014in. in the cross-sectionalexpansionof theheatpipe, asshownin Figure 13. The actualgrowth of theheatpipe was approximately0.080 in. It is thought that the differencebetweentheactual expansionof the heat pipe and the finite element analysisprediction of theexpansionisdueto creep.
Exaggerated deformed shape, 0.314 in.
(10 times actual displacements)
_ Undeformed \\
Figure 13: Schematic of undeformed and deformed shape of "D-shaped" tube from finiteelement analysis.
Heat Pipes Embedded in Carbon/Carbon
The leak in the design validation heat pipe was attributed to welding (in air) athermocouple on the heat pipe in the same spot three times. However, the heat-pipe
design appeared satisfactory and the heat pipe operated as expected. After the designvalidation heat pipe was checked out and was determined to operate as expected, it wasdecided to fabricate three additional heat pipes with the same design. The heat pipes
10
were fabricated and checked out at LANL. The heat pipes were then embedded in C/Cand tested at NASA Langley Research Center.
The heat-pipe containers were initially coated with a R512E oxidation protectioncoating [17]. The intent was to put a coating on the heat pipes that would protect the Mo-
Re from both oxidation and carbon diffusion. However, during the firing (for cleaningpurposes) of the tubes at LANL, the coating began to evaporate. Due to the requiredpurity for all heat pipe fabrication steps, an attempt was made to remove the coating sothat the evaporated coating would not contaminate the heat pipe during subsequentprocessing. Most of the coating was removed, but as can be seen in Figure 14, not all the
heat pipes appeared the same after coating removal. In the top left of the photograph is acloseup view of the end of the heat pipes with covers welded over the fill tubes.
Each heat pipe was wet in after it was charged with lithium. Heat pipe #1 was wet infor 42 hours at 1650-1740°F with 0.0099 lb of Li, heat pipe #2 was wet in for 70 hours at1650°F with 0.0088 lb of Li, and heat pipe #3 was wet in for 47 hours at 1650°F with0.018 lb of Li. After the wet in, each heat pipe was tested to evaluate its operation.
Heat pipe #1 was heated to a uniform temperature of approximately 2300°F. Sincethermocouples were not used on the heat pipes, temperatures were estimated with an
optical pyrometer. With a temperature of -2300°F, and an induction heating coil lengthof 1.5 in., a heat flux of approximately 155 Btu/ft2-s was calculated. The heat pipe wastested a second time and heated to approximately 2200°F. At this temperature, the heatpipe appeared fully isothermal with no pool at the condenser end.
Figure 14: Photograph of the three heat pipes prior to embedding in C/C.
Heat pipe #2 was initially operated full length at -2420°F. It was then heated a
second time. Portions of the heat pipe appeared a different color than other portions ofthe heat pipe due to R512E coating that remained on the heat pipe. The coating modifiedthe emittance, and thus the temperature and appearance. In the condenser section, thevapor front was not sharp, but instead consisted of -2-in-long transition. Once the heatpipe was fully operational, it was isothermal over approximately 2 ft, with the last -4 in.
in the condenser cooler due to non condensable gas (NCG) in the heat pipe. There was asharp transition from the isothermal portion (~1830°F) to the cooler, NCG filled region.The power to the heat pipe was increased until the temperature of the isothermal regionwas ~2075°F. At this point, the cool gas region at the condenser end was approximately6-in. long.
11
Heat pipe #3 did not operate properly from the very beginning. A hot spot wasobserved on the flat surface of the heat pipe in the evaporator section (under the induction
heating coils) from the beginning of the heating. The heat pipe was oriented such that thefiat surface was facing upward. The heat pipe did operate full length at -2330°F, but the
hot spot remained during the entire test. The location of the heat source was movedtoward the center of the heat pipe a few inches, but a hot spot remained under the coils
during operation. The heat pipe was then wet in a second time at 1650°F for 72 hours.During the next test, the heat pipe started up slightly better, but a hot spot remained underthe coils.
Heat pipe #3 was then tilted at an 8 ° angle to horizontal to assist in the flow of the
liquid back to the evaporator and the induction coils were approximately 4 in. from theend of the heat pipe. The hot spot remained during testing with the condenser elevated.The hot spot spread approximately 0.5 in. on each side of the coils, slightly longer on thedown hill side of the heat pipe. During heating, the hot spot remained nearly constant in
size, but continued to be hotter than the rest of the heat pipe. The end plug at theevaporator also was hotter than the rest of the heat pipe. A pool of liquid lithium existedat the condenser end that was -1.2 in. in length. Once the power was turned off, the hot
spot disappeared almost immediately. The heat pipe then cooled down uniformly.
Next, an attempt was made to heat the heat pipe in the center. Heating at the oppositeend was considered, but since the wick was open and covered by a pool of liquid, this
option must be ruled out. The heat pipe started up without a hot spot. During start up, anoperational length of -8 in. was hot without a hot spot under the coils. Whenapproximately 13 in. on each side of the coils was hot, the vapor front on the condenserside (side with open wick) maintained a relatively sharp appearance, while the vaporfront on the evaporator side (side with closed wick) had a -2 in. long "V" shapedtransition region, as shown in Figure 15 (not to scale). Though the vapor front shape onthe evaporator end was not sharp as desired, there was not a hot spot present. When theheat pipe was fully operational, a ~ 1-in-long pool of liquid was present at the condenserend. At the evaporator end of the heat pipe, there was an ~ 1-in-long section between theend of the heat pipe and the start of the "V" shaped vapor front. The non-operational endat the evaporator end was hotter than the liquid pool at the condenser end, but both werecooler than the operational portion of the heat pipe, which was ~1910°F.
Induction coils
filla|Ui
Evaporator end Condenser end
Figure 15: Schematic diagram showing the different vapor front shapes in heat pipe #3(not to scale).
From the tests on heat pipe #3, it was determined that the most likely problem withthe heat pipe was a gap between the wick and the flat surface in the evaporator end.When the region with the gap was heated, a hot spot resulted because the heat was notcarried away properly by a fully wetted inner surface. When the region of the heat pipewith the gap between the flat surface and the wick was not heated directly, a cool spotresulted because of poor liquid interchange between the liquid in the gap and the rest of
the heat pipe.
12
After the heat pipes were tested, they were all three embedded in C/C by Carbon-Carbon Advanced Technologies, Fort Worth, TX. A carbon preform was previouslywoven by Fiberite, Greenville, TX, with "D-shaped" channels using T-300 fibers. The
fabric was heat treated at 3000°F. The heat treatment was not performed at as high atemperature as is often done because the use temperature of the heat-pipe test article is1 o •ess than 3000 F and higher heat treatment temperatures result in higher modulus fibers.
For the application here, the lower modulus fibers resulting from the lower temperatureheat treatment is preferable. A 0.005-in-thick layer of Grafoil ® (Grafoil ® is a registeredtrademark of Union Carbide) was placed between the curved portion of the heat pipe andthe carbon fibers prior to densification. This was done by bonding the Grafoil ® to the
heat pipes with superglue. The purpose of the Grafoil ® was to serve as a compliant layerto relieve stresses due to the CTE mismatch between the Mo-Re and the C/C. A graphitetool was used in the densification process to assure proper positioning of the heat pipes.A photograph of the three heat pipes in the C/C after densification is shown in Figure 16.
In the upper left comer of the photograph is a closeup view of the end of the heat pipes inthe C/C.
Figure 16: Photograph of the three heat pipes after embedding in C/C.
Table 1" Thermocouple Calibration
Standard thermocouple, °F Test thermocouple, °F Correction, °F
The heat-pipe test article shown in Figure 16 was instrumented with 34 type Kthermocouples. The 24 AWG wire thermocouples were sleeved with Nextel ® ceramic
sleeving (Nextel ® is a registered trademark of 3M). The mounting procedure for the hightemperature thermocouples is summarized here and detailed in Appendix A. A graphitecement from Dylon Industries was used to bond the thermocouples to the C/C. The
bonding surface was lightly microblasted with 2-rail-diameter alumina at 80 psi toprovide a matte surface for bonding. A precoat of 2-3 mils of the cement was then placedon the surface and allowed to air dry for 2 hours. The entire part was then heated to
13
260°F in air, held for 2 hours, and allowed to cool. The thermocoupleswere thenpositionedon the part and held in place with Permacelaluminum tape. The samegraphitecementwas thenplacedover the thermocouplesandallowed to air dry for 2hours. Thepart was thenheatedto 260°Fin air, held for 2 hours,andallowedto cool.The aluminumtapewas thenremovedandthe final step was to heat the part in air for 2hours at 450°F. Figure 17 shows a thermocouple mounted on the curved surface of theC/C. At the bottom of the figure can be seen eight thermocouple wires routed from the
fiat surface.
A thermocouple was calibrated from the same spool of wire that was used for the
thermocouples bonded to the C/C. The thermocouple was calibrated in a miniaturefurnace with a 392 - 2012°F capability. Though test temperatures were recorded above
2000°F, the calibration could only be performed to ~2000°F. An isothermal well
(Inconel/steel block with holes drilled in it) was placed in the furnace. A standard NISTcalibrated type R thermocouple was inserted in one of the holes in the isothermal welland the thermocouple to be calibrated was inserted in the other hole. The other ends ofthe thermocouples were referenced to a 32°F ice point. At each temperature set point, astable voltage (+1 IxV) was maintained for 30 minutes prior to recording the voltage
output. A HP 3457A digital multimeter was used to measure the output to within _+1 I.tV.ITS 90 thermocouple tables were used to convert the voltages to temperatures. Thecalibration curve comparing the standard NIST type R thermocouple with the type Kthermocouple like those used during testing on the C/C is shown in Table 1.
Figure 17: Photograph of thermocouple on the curved surface of the carbon/carbon.
30.1 in. 23.4 in. 14.7 in. 6.9 in.
27.4 in. 19.1 in. 10.8 in.
I I I I i I I
8 7 6 5 4 216 15 14 13 12 1024 23 22 21 20 19 18
32 31 30 29 28 27 26
311
32.6 in.
I
Fill t:_
tubeend
0.0 in.
3.0 in.
I I
I1 ] Heat pipe #19
17 f IHeat pipe #3
25 'll IHeat pipe #2
Figure 18: Schematic drawing showing location of thermocouples on the flat surface (notto scale) (x = +1/16 in.).
As mentioned previously, 34 thermocouples were bonded to the test article. Thelocation of the thermocouples on the flat surface are shown in Figure 18. The
14
thermocouplejunctionwasunderthegraphitecementandthusits locationwasmeasuredonly to within +1/16 in. Thermocouples No. 33 and 34 are on the side with the curved
surface of the heat pipes (see Figure 17) and are located opposite thermocouples No. 3and 6, respectively. The thermocouples are positioned such that they are centered axially
on each heat pipe (TC No. 1-8, and 17-32) and in the space between two of the heat pipes(TC No. 9-16). The thermocouples are located approximately 4 in. apart except at the filltube end of the heat pipes where the spacing is approximately 3 in.
The testing was performed in a 5 ft diameter by 5 ft long vacuum chamber at NASALangley Research Center using quartz lamps. Prior to initiation of a test, the vacuum
level was usually in the 10 -6 torr range. During testing, the vacuum level was usuallymaintained in the 10 .5 torr range, but was in the 10 .4 torr range during times of significantoutgassing.
2.5-in. long, specimenparallel to heat pipes
Figure 19: Schematic drawing of test setup.
A schematic drawing of the test setup is shown in Figure 19. The test article washeated either in the center or near the end, as shown in the figure. A total of twelve -0.95
Btu/s (1 kW) quartz lamps were used, with six heating the upper surface and six heatingthe lower surface. The lamps, 2.5-in-long halogen cycle lamps, were oriented parallel tothe heat pipes and thus the heated length of the heat pipes was 2.5 in. Four of the lampswere located over the sides of the heat-pipe test article (each side, both top and bottom),and thus did not contribute significantly to the heat flux, but did help maintain a constantheat flux across the width of the test article. Fibrous insulation and rigid insulation boardwere used for all except the first test to insulate the test article. The insulated test article
and the heating fixtures were all placed in the vacuum chamber. (A more detailedschematic drawing of the quartz lamp heating fixture region is shown later in Figure 23).
Steady State
During the first test, the heat-pipe test article was centered under the heaters and theunheated portion was completely uncovered and radiated to the inside walls of thevacuum chamber. As a result of the radiation heat losses from the test article and thelimited heat input, the heat pipes never reached operating temperatures.
From a post test evaluation of the test article, it appeared that the graphite cement
attaching the thermocouples was a major source of outgassing that occurred during thetest. The rows of thermocouples to the right of the centerline (TC #4, #12, #20, and #28)were located underneath the water-cooled fixture. As a result of the outgassing of thegraphite cement, the fixture was much more discolored than the other side which was not
located over a row of thermocouples. Cracks were evident in the graphite cement
attaching the thermocouples that had been heated, but the thermocouples remainedattached.
15
Due to the inability to heat the heat pipes to a level where they began to function as
heat pipes, it was decided to insulate both surfaces of the heat-pipe test article outside ofthe heated zone. The test article was insulated with approximately 2 in. of ceramicinsulation board as shown in Figure 20. The insulation board was baked out for
approximately 2 hours at 1000°F prior to use. The photograph in Figure 20 shows thewater-cooled quartz lamps fixture in the center of the test article and insulationsurrounding the rest of the test article. Fibrous Saffil ® (Saffil ® is a trademark of ImperialChemical Industries PLC for alumina fiber) insulation (not baked out) was placedbetween the C/C and the rigid insulation board since the heat-pipe test article, with
thermocouples and a non-flat surface, did not conform to the flat insulation board. TheSaffil ® and insulation board were held in place with four pieces of stainless steel wire.
Though the photograph does not show it, the heated center portion of the test article wasalso insulated on the sides. The heat-pipe test article was insulated and positioned in the
heating fixture prior to placing the entire test apparatus in the vacuum chamber. Inaddition to adding the insulation, the vacuum chamber was modified by placing a large (-2 ft x 2 ft) cold plate in the chamber for the purpose of condensing gases resulting fromoutgassing. The quartz lamps were centered between the thermocouples near the middleof the test article.
Figure 20: Photograph of the insulated C/C heat-pipe test article.
1800
1700
1600
Temp., °F
1500
1400
A
i!i! iiill
L
i i i i1300 .... i .... I, t .... I .... ,
-15 -10 -5 0 5 10 15
Position, in.
Figure 21" "Steady state" temperatures for each heat pipe (Test 2).
The test article was heated to full power over a time span of approximately 7 hours.
Isothermal operation of the heat pipes was obtained, but not over the full length of the
16
heatpipes. The output from the quartzlampswasapproximately9.5 Btu/s (-10 kW).However, not all 9.5 Btu/s enteredthe C/C heatpipe test article. The "steadystate"temperaturedistributionson theC/Covereachof theheatpipesareshownin Figure21.The term "steadystate" is used,but actually, sincethe testarticle was insulated,a truesteadystatewasnot obtained. Thetime requiredto obtaintrue steadystateconditionswould bequite large. "Steadystate"is usedto describethecondition whereonly veryslow increasesin temperaturewereoccurringdueto theboundaryeffectof the insulation.The thermocouplesclosestto the centerof the heatpipeswere locatedunderneaththewater-cooledheating fixture. Due to radiation to a water cooled boundary, thosethermocouplesdid not readmeaningful temperaturesandare thus not included in thefigure. Heatpipes#1 and#3 wereisothermalovera lengthgreaterthan20 in. Heatpipe#2 wasisothermalover ashorterlengththantheothertwo heatpipes. Heatpipe#2 wasnot entirely isothermalduringcheckoutof theheatpipe prior to embeddingit in theC/C(seeearlier sectionon the checkoutof the heatpipes). As was mentionedearlier, itappearedthat the lower temperatureson this heatpipe weredueto non condensablegas(NCG) in theheatpipe.
Figure22: Photographof the heat-pipetest article with insulationpulled back to showC/C (afterTest3).
SaffilSaffil
j %TC #1
t I I I I I Ix=O.O 0.5 2.25 3.0 4.75 6.5 6.9
Figure 23: Schematic drawing of the positioning (units of inches) of the thermocouplesrelative to the water-cooled fixture (not to scale) (x = +1/16 in.).
17
The heat-pipe test article was later removed from the vacuum chamber. Theinsulationwaspulledoff the testarticle, asshownin Figure 22, andthetestarticle wasinspected.The C/C in contactwith the Saffil®insulationhad a grayishtoneversustheoriginalblackcolor. TheC/Cunderthequartzlamps(not in contactwith theSaffil®)stillappearedblack,andevenlookedslightly charred. The Saffil®insulationin contactwiththeC/C hada graycolor, ascanbe seenat the top of the figure. The graphitecementmountingthe thermocoupleswascracked,but thethermocouplesremainedattachedtotheC/C.
The heatpipe waspositionedwithin theheatingfixture suchthat the heatpipe washeatedat one end of the heatpipe. TC #1 (x = 2.9 in.) was locatedinside the heatedregion (2.25 in. < x < 4.75 in.) in order for TC #2 to be outside the heated region, asshown in Figure 23. Saffil ® insulation was placed between the heat-pipe test article andthe water-cooled fixture to reduce the heat loss radiated to the water-cooled fixture.
The heat-pipe test article was heated over a time period of approximately 2 hours.
Figure 24 shows the temperatures at x = 23.3 in. (TC #6, #22, and #30) as a function oftime. Over most of the temperature range after the heat pipes started operating, heat pipe
#2 was significantly cooler than heat pipes #1 and #3. However, once the higher
temperatures were reached, heat pipe #2 temperatures experienced a sudden increase tothe range of the other two heat pipes.
2000
1500
Temp.,°F
1000
5OO
0
Heat pipe #1 and_
I , I , I , I
0 2000 4000 6000 8000
Time, sec.
Figure 24: Temperatures at x = 23.3 in. (TC #6, #22, and #30) as a function of time foreach of the three heat pipes (Test 5).
After a few minutes at the maximum heat flux attainable with the quartz lamps, one
of the quartz lamps failed and the test was stopped. Figure 25 shows the temperatures atthe maximum heat flux levels just prior to the bulb failure. The temperatures were not
yet steady state as they appeared to be slowly increasing. The temperature of thethermocouples under the quartz lamps are also shown in Figure 25.
Temperature distributions on the C/C over each of the three heat pipes are shown inFigure 26 at two different heat flux levels. The dashed lines represent the "steady state"temperatures with a voltage of 130 V. The "steady state" temperatures represented by thesolid lines are with a voltage of 180 V. The first thermocouple outside of the heated
18
regionon heatpipe#1 (TC #2) wasnot operating properly and is thus not shown on the
figure. Heat pipes #1 and #3 were relatively isothermal over a significant length of thetest article, with heat pipe #3 isothermal over a slightly longer length. Heat pipe #2,however, again demonstrated less capability than heat pipes #1 or #3. At the 130 V level,heat pipe #2 was isothermal over a shorter length than the other two heat pipes. At the180 V level, heat pipe #2 temperatures were still lower than those of the other two heat
pipes, and appeared to have a dome-shaped distribution. This is unlike the temperaturedistribution shown in Figure 25.
2000
Temp., °F
1800
1600
1400
.. Heat pipe #1--/"_k_\' " " - " "
---..earedregion Heat pipe #2..-/ \
.... I .... I , , , , I , , , I .... I
10 15 20 25 30
Position, in.
Figure 25: "Steady state" temperatures for each heat pipe in the horizontal orientation(Test 5).
2000
1900
1800
Temp.,°F
1700
1600
1500
1400
0
l Heat pipe #_
I |
Heated
regioni | I | •
10
.... 130V , ,180 V ','
, , I , , • , I .... I , , , . I
15 20 25 30
Position, in.
Figure 26: Heat-pipe-temperature (on C/C) distributions in the horizontal orientation(Test 6).
19
After a "steady state" condition had been maintainedat 130 V, the voltage wasincreasedto 180 V. Figure 27 shows the transient temperaturefrom each of thethermocouplesover heat pipe #3 prior to and after the increasein voltage. The twothermocouplesfurthestfrom theheatersat x = 27.4in. andx = 30.0in. arelabeledin thefigure. The temperaturesat the remaininglocationswererelatively isothermaland arenot labeled. As canbeseenin Figure27, the temperaturesalongtheentirelengthof theheatpipe (evenat x = 30.0in.) increasetogether.This typeof behavioris to beexpectedfor a heat pipe. However, for heat pipes embeddedin C/C, differencesin thermalresistance(such as contact resistance)would result in different rise times for thetemperaturesat differentlocations. Thustheresultsshownin Figure27 indicatethat thethermal resistancebetweenthe heatpipe and the C/C was consistentalong the entirelengthof thetestarticle.
Temp., °F
2000
1900
1800
1700
1600
1500 I
1400
5000
i I I II , , , , I , , . I
5500 6000 6500
Time, sec
Figure 27: Temperature distribution while transitioning from one steady state conditionto another steady state condition in the horizontal orientation (Test 6).
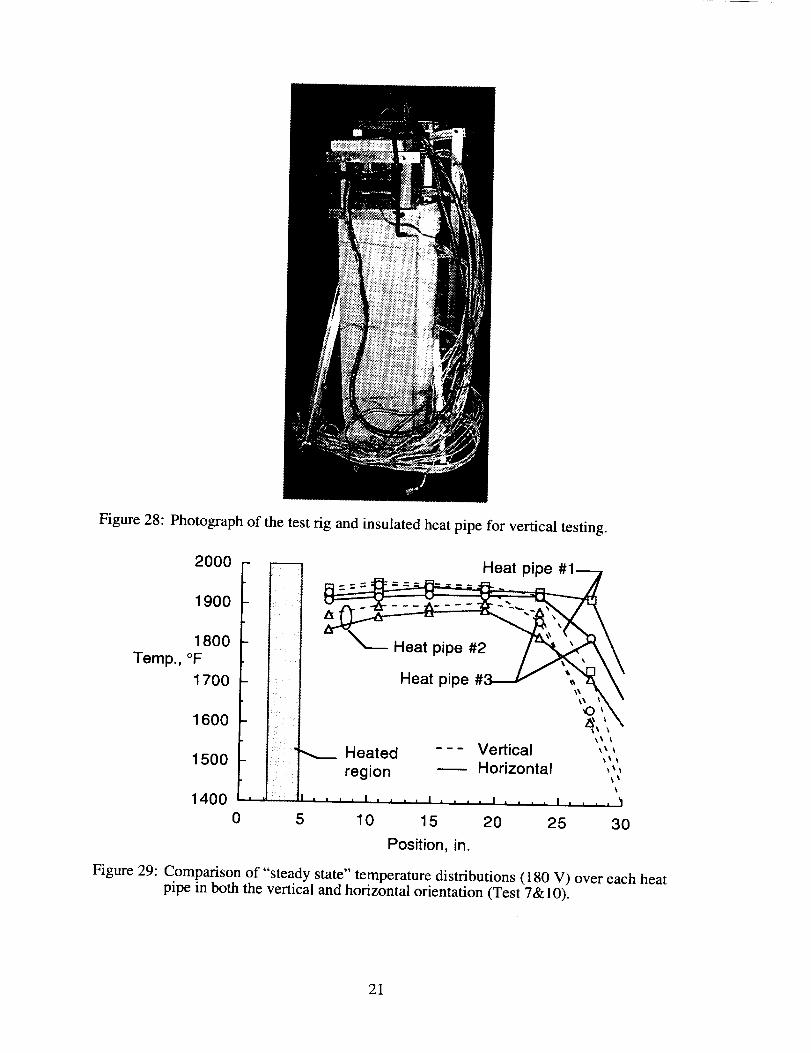
Though most of the testing was performed in the horizontal orientation, testing wasalso performed with the heat pipes vertical, heated at the top. The test rig with the heaterat the top and insulated heat pipe used for the vertical testing are shown in Figure 28.The "steady state" temperature distribution for each of the heat pipes in both the verticaland horizontal orientation is shown in Figure 29. The voltage was 180 V in both tests.
Heat pipe #2 had a dome-shaped temperature distribution, with the temperatures near theheated region lower than those near the center of the heat pipe. The temperatures of thevertical heat pipes were slightly higher than the horizontal heat pipes near the heated
region. However, at the condenser end of the heat pipes, the vertical heat-pipetemperatures were significantly lower than the horizontal temperatures. Though thevoltage to the quartz lamps was the same in both tests, different amount of outgassing
products collected on the quartz lamps reflector or slightly different insulation geometryaround the heat pipes may have had an influence on the heat-pipe temperatures. In bothtests, the thermocouples in the heated regions indicated similar temperatures, indicating
that the heat input was not significantly different.
20
Figure28: Photographof thetestrig andinsulated heat pipe for vertical testing.
2000
1900
1800
Temp.,°F
1700
1600
1500
'b'\"
--- Vertical
HorizontalHeated
region
1400 .. J .... ' .... , .... i , ,,
0 5 10 15 20 25 30
Position, in.
| i ,
Figure 29: Comparison of "steady state" temperature distributions (180 V) over each heatpipe in both the vertical and horizontal orientation (Test 7& 10).
21
Startup From The Frozen State
Start-up of the heat-pipe test article was performed over a time of 30 min. with the
heat pipes in both the vertical and horizontal orientations. The voltage to the quartzlamps was increased to 180 V in six unequal steps. The voltage was maintained at themaximum level of 180 V until a relatively steady state was obtained.
2500
2000
Temp, °F
1500
1000
5O0
00
--- Vertical __._-_-- Horizontal [-'-
.._,.C2, "" ,-.
iI I I_
," TC #1-#8
I I I I I I
600 1200 1800 2400 3000 3600
Time, sec.
Figure 30: Start-up temperature distributions on heat pipe #1 in the horizontal andvertical orientation.
The transient temperatures over heat pipe #1 in both orientations are shown in Figure30 for each of the eight thermocouples. The solid lines represent the horizontalorientation and the dashed lines represent the vertical orientation. The first thermocouple
(TC #1) was located under the quartz lamps and thus responded much quicker andexperienced higher temperatures. Though some difference can be seen in the horizontaland vertical temperatures under the heaters (TC #1), they are similar, indicating similar
heat inputs. The thermocouple next to the heated region (TC #2) did not operate properlyduring a portion of the horizontal test. As a result, its temperatures are shown onlyduring the early stages of the test. The sharp increase in temperatures as the heat-pipeoperating length increased down the length of the heat pipe can be seen. At "steadystate", the heat pipe was operating isothermally over a greater length in the horizontalorientation than in the vertical orientation. However, during the startup, the horizontal
and vertical heat-pipe temperatures were similar. It was only at the higher heat fluxesand at the condenser end of the heat pipes that the vertical heat-pipe temperatures began
to lag the horizontal heat-pipe temperatures. Away from the condenser end of the heatpipe, as the heat pipe was starting up, the temperature rise was steeper for the verticalheat pipe than the horizontal heat pipe. This can be observed by noting that the verticalheat-pipe temperature rise starts after the horizontal heat-pipe temperature rise, but levels
off prior to the horizontal heat-pipe temperatures.
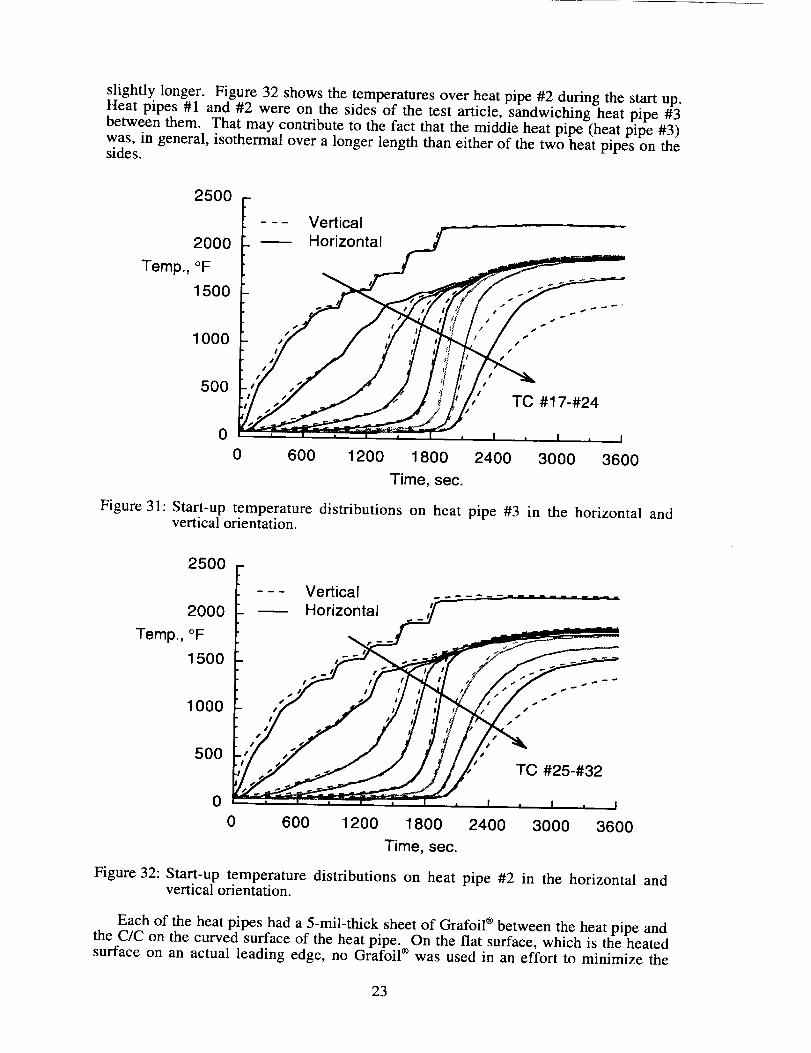
The temperatures over heat pipe #3, the center heat pipe in the test article, can be seen
in Figure 31 in both the horizontal and vertical orientation. The thermocouple next to theheated region (TC #2) did not operate properly during a portion of the horizontal test. Asa result, its temperatures are shown only during the early stages of the test. The
temperatures are similar to those in Figure 30, except that the isothermal length was
22
slightly longer. Figure 32showsthe temperaturesoverheatpipe#2 during the startup.Heat pipes#1 and #2 were on the sidesof the test article, sandwichingheatpipe #3betweenthem. That may contributeto the fact that the middleheatpipe (heatpipe #3)was,in general,isothermalovera longerlengththaneitherof thetwo heatpipeson thesides.
Figure 31" Start-up temperature distributions on heat pipe #3 in the horizontal andvertical orientation.
2500
20O0
Temp.,°F
1500
1000
5OO
0
--- Vertical• _mm Bm
.L _ Horizontal
' S SS _ d¢"" 1' s _ s _*
it #
.,#it # •
0 600 1200 1800 2400 3000 3600
Time, sec.
Figure 32: Start-up temperature distributions on heat pipe #2 in the horizontal andvertical orientation.
Each of the heat pipes had a 5-mil-thick sheet of Grafoil ® between the heat pipe andthe C/C on the curved surface of the heat pipe. On the fiat surface, which is the heatedsurface on an actual leading edge, no Grafoil ® was used in an effort to minimize the
23
thermalresistance. Figure 33 showsthe transienttemperaturesat x = 10.8in. and x =23.3in. on both the flat (no Grafoil ®) and curved (with Grafoil ®) surfaces with the heat
pipes in the horizontal orientation. At x = 10.8 in., the temperature of the surface with noGrafoil ® increased faster than the surface with Grafoil ® between the heat pipe and the
C/C. That was as expected since the Grafoil ® should result in increased thermalresistance. However, at x = 23.3 in., the surface with no Grafoil ® between the C/C and
the heat pipe increased slower than the surface with the Grafoil ®. The difference inthermal response at the two locations was also present in other horizontal tests and with
the heat pipes in the vertical orientation.
2000 -
1500
Temp.,°F
1000
500
0
No E
5-mil-thick
Grafoil
X= 10.8"
X = 23.3 in.
5-mil-thick
Grafoil
No Grafoil
0 600 1200 1800 2400 3000
Time, sec.
Figure 33: Comparison of temperature rise with and without 5-mil-thick Grafoil ®between heat pipe #1 and the C/C with the heat pipe in a horizontal orientation
(Test 7).
Non Destructive Evaluation
Non destructive evaluation of the C/C heat-pipe test article was performed prior to
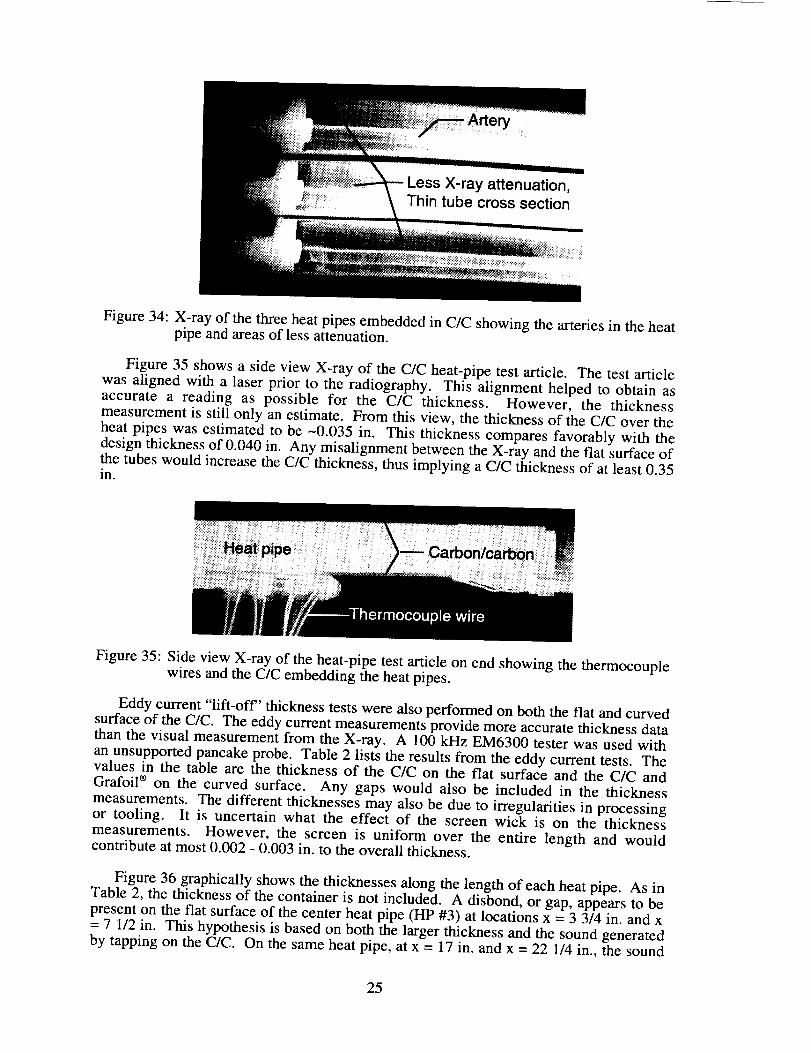
testing and after testing. Prior to testing, radiography was performed on the as fabricatedtest article. Figure 34 shows an X-ray of the heat pipes embedded in the C/C prior to
testing. Arteries, with outer diameters measured between 0.135 in. and 0.160 in. (designdiameter of 0.1 in.), can be seen in each heat pipe. Due to the angle of the X-ray, thearteries (centered at the top, curved portion of the heat pipe) appear not to be located inthe center of the heat pipes. The straight heat pipes also appear to be curved, though they
are straight. The X-ray revealed several areas of lower density, as indicated in the figure.The lower density areas result in less X-ray attenuation, and thus darker images. Thethinner tube cross sections could be the result of the tube drawing or the sandblasting
removal of the R512E coating.
Additional radiography was performed on the heat pipes after testing. The distance
between the heat pipes was measured from the X-rays, and found to be slightly differentbetween different heat pipes. The distance between the heat pipes varied along the
length, but was approximately 0.075 in. and 0.085 in. One gap was noticeably (~0.010in.) wider than the other gap. The spacing was to have been 0.040 in, indicating that the
gaps were approximately twice the design gap.
24
X-ray attenuation,Thin tube cross section
Figure 34: X-ray of the three heat pipes embedded in C/C showing the arteries in the heatpipe and areas of less attenuation.
Figure 35 shows a side view X-ray of the C/C heat-pipe test article. The test article
was aligned with a laser prior to the radiography. This alignment helped to obtain asaccurate a reading as possible for the C/C thickness. However, the thicknessmeasurement is still only an estimate. From this view, the thickness of the C/C over the
heat pipes was estimated to be -0.035 in. This thickness compares favorably with thedesign thickness of 0.040 in. Any misalignment between the X-ray and the flat surface ofthe tubes would increase the C/C thickness, thus implying a C/C thickness of at least 0.35in.
Figure 35: Side view X-ray of the heat-pipe test article on end showing the thermocouplewires and the C/C embedding the heat pipes.
Eddy current "lift-off' thickness tests were also performed on both the flat and curvedsurface of the C/C. The eddy current measurements provide more accurate thickness datathan the visual measurement from the X-ray. A 100 kHz EM6300 tester was used with
an unsupported pancake probe. Table 2 lists the results from the eddy current tests. Thevalues in the table are the thickness of the C/C on the flat surface and the C/C andGrafoil ® on the curved surface. Any gaps would also be included in the thickness
measurements. The different thicknesses may also be due to irregularities in processingor tooling. It is uncertain what the effect of the screen wick is on the thickness
measurements. However, the screen is uniform over the entire length and wouldcontribute at most 0.002 - 0.003 in. to the overall thickness.
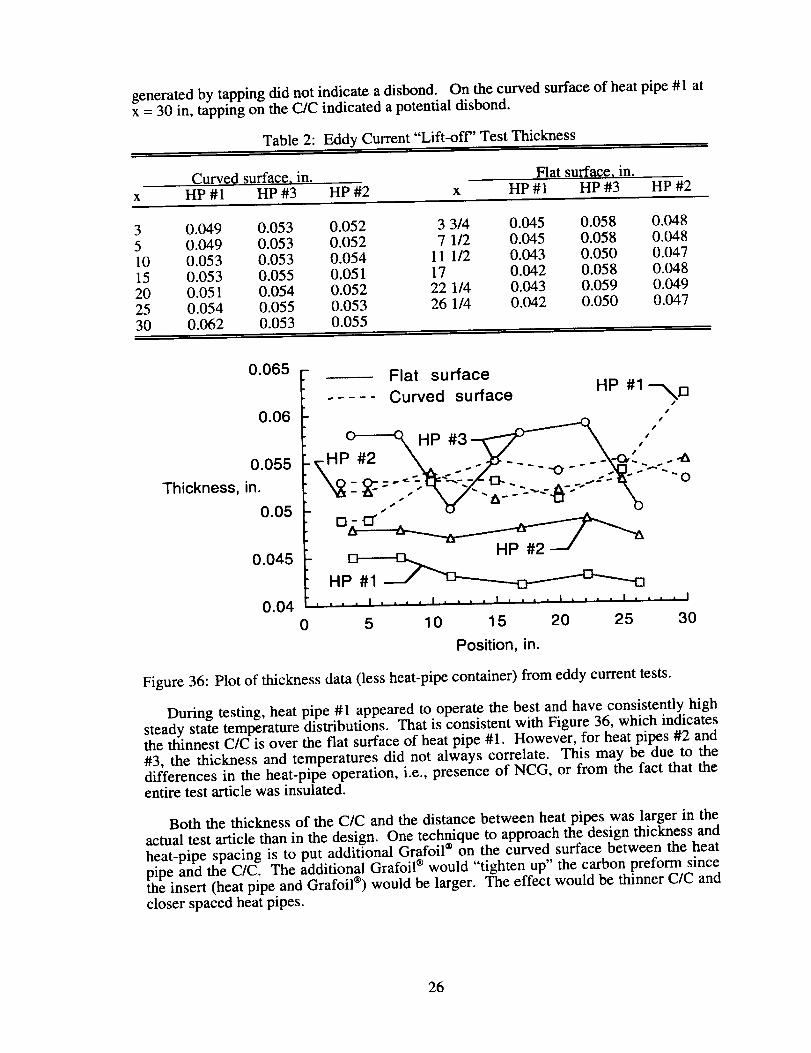
Figure 36 graphically shows the thicknesses along the length of each heat pipe. As inTable 2, the thickness of the container is not included. A disbond, or gap, appears to bepresent on the flat surface of the center heat pipe (HP #3) at locations x = 3 3/4 in. and x
= 7 1/2 in. This hypothesis is based on both the larger thickness and the sound generatedby tapping on the C/C. On the same heat pipe, at x = 17 in. and x = 22 1/4 in., the sound
25
generated by tapping did not indicate a disbond. On the curved surface of heat pipe #1 atx = 30 in, tapping on the C/C indicated a potential disbond.
Table 2: Eddy Current "Lift-off" Test Thickness
Curved surface, in. Flat surface, in.HP #1 HP #3 HP #2 x HP #1 HP #3 HP #2
, . , • I , , , , I , , . , I .... I , , • , I , , • , I
5 10 15 20 25 30
Position, in.
Figure 36: Plot of thickness data (less heat-pipe container) from eddy current tests.
During testing, heat pipe #1 appeared to operate the best and have consistently highsteady state temperature distributions. That is consistent with Figure 36, which indicatesthe thinnest C/C is over the flat surface of heat pipe #1. However, for heat pipes #2 and
#3, the thickness and temperatures did not always correlate. This may be due to thedifferences in the heat-pipe operation, i.e., presence of NCG, or from the fact that the
entire test article was insulated.
Both the thickness of the C/C and the distance between heat pipes was larger in theactual test article than in the design. One technique to approach the design thickness and
heat-pipe spacing is to put additional Grafoil ® on the curved surface between the heatpipe and the C/C. The additional Grafoil ® would "tighten up" the carbon preform sincethe insert (heat pipe and Grafoil ®) would be larger. The effect would be thinner C/C and
closer spaced heat pipes.
26
Concluding Remarks
The fabrication of a heat-pipe-cooled leading edge for hypersonic vehicles has movedfrom the preliminary design stage to the fabrication and testing of several sub-components. The present paper discusses several heat pipes that were fabricated andtested toward this goal.
A Mo-Re "D-shaped" heat pipe was fabricated and successfully operated up to atemperature of 2460°F. However, at that temperature, the flat side of the heat pipedeformed due to the internal pressure. The heat pipe was subsequently started from thefrozen state and it operated as expected. A leak was observed at the location of a
thermocouple which had been spot welded three times in an open atmosphere. Thoughboth of these occurrences were problematic during the testing, they would not beproblematic in actual applications where the heat pipes are embedded in a C/C material,and no thermocouples are welded on the heat pipes.
In addition to testing the single heat pipe, three additional heat pipes were fabricated
and embedded in C/C. The successful operation of each of these heat pipes wasdetermined prior to embedding in C/C. The C/C test article with the three heat pipes wastested with quartz lamps in a vacuum chamber in both a horizontal and verticalorientation. Insulation was required around the entire test article to reduce heat losses in
order for the heat pipes to operate properly. All three heat pipes operated successfully,but each performed differently. The heat pipes were started up successfully from thefrozen state numerous times. Both start up and steady state data are presented.
The tests demonstrated that heat pipes can be embedded in C/C and successfullyoperated. Though the contact resistance across the interface between the heat pipe andthe C/C was unknown, it was not thought to be significant based on relatively uniformsurface temperatures. However, insulating the test article could also contribute to the
relatively uniform temperatures. The non destructive evaluation performed after testingindicated differences in the C/C thickness. One potential disbond area was identified, butmany of the thickness variations may be due to processing or tooling irregularities.
Acknowledgments
The authors would like to thank NASA Langley Research Center for funding thiswork under contract No. NAS1-96014. The authors would also like to thank RobertOrtega (LANL), Joe Sikora (NASA LaRC), and Jeff Knutson (NASA LaRC) for theirassistance in testing the heat pipes.
References
1. Silverstein, C. C.: A Feasibility Study of Heat-Pipe-Cooled Leading Edges forHypersonic Cruise Aircraft. NASA CR 1857, 1971.
2. Niblock, G. A.; Reeder, J. C.; and Huneidi, F.: Four Space Shuttle Wing LeadingEdge Concepts. Journal of Spacecraft and Rockets, Vol. 11 No. 5, May 1974, pp.314-320.
3. Alario, J. P.; and Prager, R. C.: Space Shuttle Orbiter Heat Pipe Application.NASA CR-128498, 1972.
4. Anon.: Study of Structural Active Cooling and Heat Sink Systems for SpaceShuttle. NASA CR-123912, 1972.
5. Anon.: Design, Fabrication, Testing, and Delivery of Shuttle Heat Pipe LeadingEdge Test Modules. NASA CR-124425, 1973.
6. Camarda, Charles J.: Analysis and Radiant Heating Tests of a Heat-Pipe-CooledLeading Edge. NASA TN D-8468, August 1977.
27
7. Camarda, Charles J.: Aerothermal Tests of a Heat-Pipe-Cooled Leading Edge atMach 7. NASA TP-1320, November 1978.
8. Camarda, Charles J.; and Masek, Robert V.: Design, Analysis and Tests of a
Shuttle-Type Heat-Pipe-Cooled Leading Edge. Journal of Spacecraft and Rockets,Vol. 18, No. 1, January-February, 1981.
9. Peeples, M. E.; Reeder, J. C.; and Sontag, K.E.: Thermostructural Applications of
Heat Pipes. NASA CR-159096, 1979.10. Boman, B. L.; Citrin, E. C.; Garner, E. C.; and Stone, J. E.: Heat Pipes for Wing
Leading Edges of Hypersonic Vehicles. NASA CR-181922, January 1990.11. Boman, B.; and Elias, T.: Tests on a Sodium/Hastelloy X Wing Leading Edge Heat
Pipe for Hypersonic Vehicles. Presented at the AIAA/ASME 5th JointThermophysics and Heat Transfer Conference, June 18-20, 1990, Seattle, WA.
AIAA Paper 90-1759.12. Colwell, Gene T.; Jang, Jong H.; and Camarda, Charles J.: Modeling of Startup
from the Frozen State. Presented at the Sixth International Heat Pipe Conference,
Grenoble, France, May 25-29, 1987.13. Glass, David E.; and Camarda, Charles J.: Preliminary Thermal/Structural Analysis
of a Carbon-Carbon/Refractory-Metal Heat-Pipe-Cooled Wing Leading Edge.AIAA Progress in Astronautics and Aeronautics, "Thermal Structures and
Materials", Vol. 140, 1992.14. Glass, D. E.; Camarda, C. J.; Merrigan, M. A.; Refractory-Composite/Heat-Pipe-
Cooled Leading Edge, U.S. Patent No. 5,720,339, February 24, 1998.
15. Anonymous: PATRAN Users Manual, Version 3.0, PDA Engineering, 1993.16. Lee, Sang H., editor: MSC/NASTRAN Handbook for Nonlinear Analysis, Version
67, The MacNeal-Schwendler Corporation.17. Glass, D. E: Oxidation and Emittance Studies of Coated Mo-Re, NASA CR
201753, October 1997.
28
Appendix A: Surface Preparation and Installation of High-Temperature Thermocouples
Installation Materials
1. Thermocouple, type: "K", Omega part No. XC-K-24 (AWG #24, lead wire lengthwill be determined by the test set-up requirements)
2. Thermocouple connectors, type: "K", Omega part No. NMP-K-MF (includes male &female connector pairs)
Surface Preparation1. After determining the exact locations for the thermocouple junctions and the lead
wire routing along the surface of the test article, spots for securing the junction andthe wiring to the surface should also be determined.
2. Mask and micro-sandblast these spots with 2-mil diameter m1203 abrasive powder.3. Remove the masking tape and eliminate any sandblast residue using clean, dry shop
air. Note: When this ceramic cement is to be applied to an uncoated carbon/carbontest article, the test article must first be dried by heating it to 225°F and holding it atthat temperature for one hour.
4. Once the test article is dry and at room temperature, apply a basecoat of the DylonGC cement to all micro-sandblasted spots on the test article surfaces. This coatingshould be kept as thin as possible, i.e., approximately 0.002-in. to 0.003-in. thick.
5. Allow the basecoat to air dry for two hours. Then, place the test article, with thebasecoated spots, in a temperature chamber and slowly raise the temperature to 275°Fand hold the test article at this temperature for 2 hours. The temperature rise shouldnot exceed 4°F/minute.
Installation
1. Once the basecoat has been cured, place the thermocouple lead wires along thepredetermined routes of the test article surfaces with the thermocouple junctionsappropriately positioned. The thermocouple junctions and their lead wires shouldnow be taped down adjacent to the basecoat spots. Permacel brand aluminum tapeworks well.
2. Next, apply a coat of the Dylon GC cement over the thermocouple junctions and leadwires at the previously precoated spots. Note: It is important to maintain a lowprofile with the ceramic cement. Keep the amount of cement over the thermocouplelead wires and junctions at a minimum.
3. Allow the cement to air dry for 2 hours.4. Place the test article in the temperature chamber and slowly raise the temperature of
the test article to 275°F. Hold the test article at this temperature for 2 hours. Thetemperature rise should not exceed 4°F/minute.
5. Cool the test article and inspect the bonded areas making certain that there are nomicro-cracks or debonding of the cement. The test article is now ready for finalcuring.
6. Final curing is achieved by placing the test article in the temperature chamber andslowly raising its temperature to 450°F. Hold the test article at this temperature for 2hours.
7. Finally, cool the test article and perform a final inspection. The thermocoupleinstallations should now be ready for service to test temperatures of 2500°F.
Public mpon'ing bur_n for thin collection of information is es_mated to average 1 hour per response, inckJ_ng the time for revie_ng instnJctions,searching exis_ng data sources,garnering _ memtwn0ng IP_ _a needed, and com pk_ing _ reviewthg the collec_xl of information. Send comments reQarding _is burden es_rnme or any other aspect of thisco,_c1_, n or ,nfon_on, incl.udi_ngsuggestions for moucJng this burden, to Washington HelKIquartam Services, D_rectomte for IoformJ.t_on Operations _KI Reports, 1215 Jeffersonuaws Highway, 5u,to 1204, Arlington, VA 22202-4302, and lo 1he Office of Management and Budget, Paperwork Reduction Project (0704-0188), Wasblngfon, DC 20503.
1. AGENCY USE ONLY (Leave blank) 2. REPORT DATE 3. REPORT TYPE AND DATES COVERED
March 1998 Contractor Report/
4. TITLE AND SUBTHLE 5. FUNDING NUMBERS
Fabrication and Testing of Mo-Re Heat Pipes Embedded in Carbon/Carbon
6. AUTHOR(S)
David E. Glass, Michael A. Merrigan, and J. Tom Sena
7. PERFORMING ORGANIZATION NAME(S) AND ADDRESS(ES)
Analytical Services & Materials, Inc.107 Research Drive
Hampton, VA 23669-1340
9. SPONSORUNC#MONITORING AGENCY NAME(S) AND ADDRESS(ES)
National Aeronautics and Space AdministrationLangley Research Center
Hampton, VA 23681-2199
NAS 1-960 i 4
WU 242-33-03-20
8. PERFORMING ORGANIZATIONREPORT NUMBER
AS&M-LS05-98-01
10. SPONSORING/MONITORINGAGENCY REPORT NUMBER
NASA/CR- 1998-207642
11. SUPPLEMENTARY NOTES
Langley Technical Monitor: Steven J. Scotti
1211. DISTRIBUTION/AVAILABILITY STATEMENT 12b. DISTRIBUTION CODE
Unclassified-Unlimited
Subject Category 34 Distribution: Nonstandard
Availability: NASA CASI (301) 621-0390
13. AB_,HACT (Maximum 200 words)
Refractory-composite/heat-pipe-cooled wing and tail leading edges are being considered for use on hypersonicvehicles to limit maximum temperatures to values below material reuse limits and to eliminate the need to
actively cool the leading edges. The development of a refractory-composite/heat-pipe-cooled leading edge hasevolved from the design stage to the fabrication and testing of heat pipes embedded in carbon/carbon (C/C). A
three-foot-long, molybdenum-rhenium heat pipe with a lithium working fluid was fabricated and tested at an
operating temperature of 2460°F to verify the individual heat-pipe design. Following the fabrication of this heat
pipe, three additional heat pipes were fabricated and embedded in C/C. The C/C heat-pipe test article was
successfully tested using quartz lamps in a vacuum chamber in both a horizontal and vertical orientation. Start
up and steady state data are presented for the C/C heat-pipe test article. Radiography and eddy current evaluationswere performed on the test article.
14. SUBJECT TERMS
Heat pipes, liquid metals, carbon/carbon, leading edges
17. SECURITY CL/kSSIFICATICIN
OF REPORT
Unclassified
NSN 7540-01-280-5500
18. SECURITY CLASSIFICATIONOF THIS PAGE
Unclassified
19. SECURITY CLASSIFICATIONOF ABSTRACT
Unclassified
15. NUMBER OF PAGES
3416. PRICE CODE
A0320. LIMITATION
OF ABSTRACT
Standard Form 298 (Rev. 2-89)Prescribed by ANSI Std. Z-39-18298-102