31
FACEBOOK INITIAL PUBLIC OFFERING ZENITH SOLUTIONS ALPHA KAPPA PSI
| Date post: | 25-Jul-2015 |
| Category: |
Documents |
| Upload: | joshua-kim |
| View: | 209 times |
| Download: | 0 times |

FACEBOOK INITIAL PUBLIC
OFFERING
ZENITH SOLUTIONS ALPHA KAPPA PSI


We will provide solutions for the following:
1. Decision between monetizing through advertisements or third party platform apps
2. Adapting to social media trends
3. Facebook's privacy issues
4. Facebook’s decision to go IPO
5. How Facebook performed since the IPO
KEY ISSUES

- Going public- Advertisement & third party app revenue- Adapt to social media trends- Streamline privacy issues
Key Conclusions

• “Facebook’s mission is to give people the power to share and make the world more open and connected”
• World’s largest and most successful social network
• Over 1 billion monthly active users
• 2011 revenues of $3.7 billion come from: 90% advertising, 10% commissions on sales of virtual goods by third party developers
COMPANY BACKGROUND

USER GROWTH (IN MILLIONS)20
04
2005
2006
2007
2008
2009
2010
2011
2012
1 6 12 58 145 360608 845 1,056

PROS & CONS OF IPOPROS
CONS
• Stock options can be offered to employees
• Increased prestige and visibility of brand
• Expand growth through investment
• Finance acquisitions of other companies
• Stability and support over time
• Obligated to please share holders
• Centralized around revenue instead of UX
• Need approval of majority of shareholders
• Company is required to be transparent
Company Incentives
Long-term Growth
Change in User Interest
Decrease in Control
1
2
1
2

FACEBOOK IPO MAY 18TH, 2012

PERFORMANCE POST IPO

FACEBOOK VS. GOOGLE - POST IPO

STOCK COMPARISON
Mobile Relevance
Search International

Mobile

HOW WE CONNECT97%
94%
37%
46%
3%
16%
7% 7%
3% 4%2% 4%
2% 3%
HANDHELD MUSIC PLAYER
GAME CONSOLE
INTERNET ENABLED TV
COMPUTER
MOBILE PHONE
TABLET
E-READER
2011 | 2012
Mobile

July '12
July '11
74
59.5
(in billions of minutes)
Tablet
Apps
PC
40.8
5.3
23.2
4.2
5.4
TIME SPENT ON SOCIAL MEDIA
Mobile

IS ADVERTISING EFFECTIVE?
MobileMobileMobile

ADVERTISING AND USER EXPERIENCE
Yes19%
No70%
Other11%
Has the increase in Facebook advertisements affected your frequency of use?
Mobile

2010 $1.86 billion TR = $1.97 billion
2011 $3.1 billion TR = $3.7 billion
2012 $4.28 billion TR = $5.09 billion
2013 $5.48 billion TR = $6.6 billion
FACEBOOK REVENUE
2010 2011 2012 20130
1
2
3
4
5
6
7
Facebook Payments & Other Revenue
Ad Revenue
Mobile

REVENUE THROUGH PLATFORM APPS
Mobile

Mobile Relevance
Search International

POPULAR FEATURES
Relevance

AREAS FOR IMPROVEMENT
Relevance

FACEBOOK USERS’ PRIVACY CONCERNS
SearchRelevance

Relevance

Mobile Relevance
Search International


SOCIAL SEARCH

Mobile Relevance
Search International

International
Facebook Products
Display Ads
Payments
Sponsored Stories
Sponsored Search Results
Facebook Exchange
Promoted PostsGifts
Logout Page Ads
Suggested Posts
Customer Audience
Ads
Mobile Apps
Install Ads

International
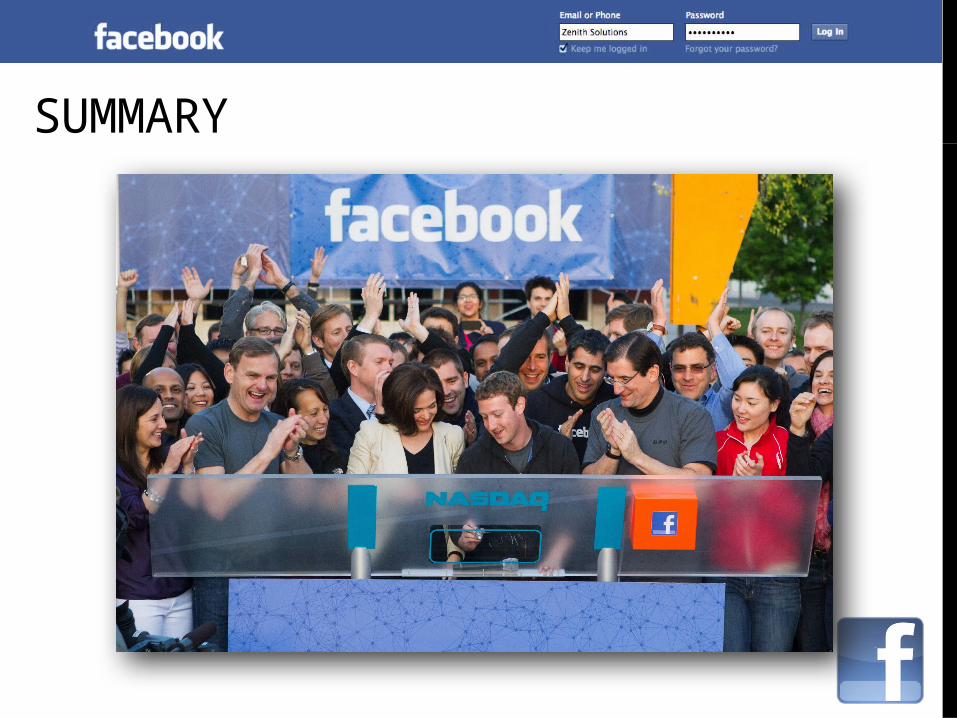
SUMMARY


