38
Pima Community College Facilities Master Plan + Educational Master Plan Board of Governors Presentation 11.30.2015
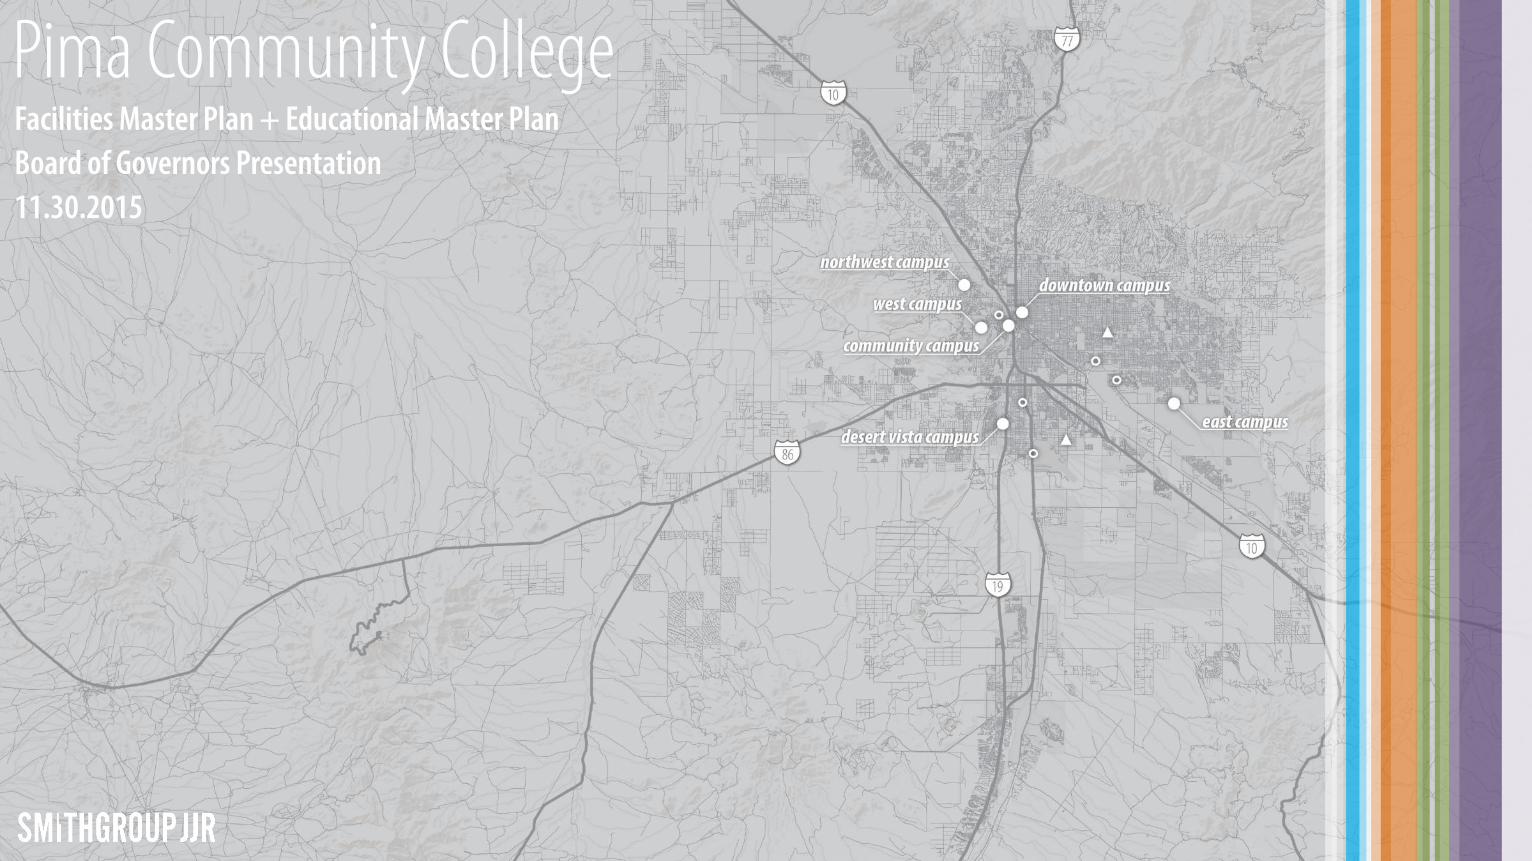
Pima Community College Facilities Master Plan + Educational Master PlanBoard of Governors Presentation 11.30.2015
Agenda
Part I: IntroductionPart II: Master Planning ProcessPart III: Pima TodayPart IV: Utilization FindingsPart V: Discussion

Introduction
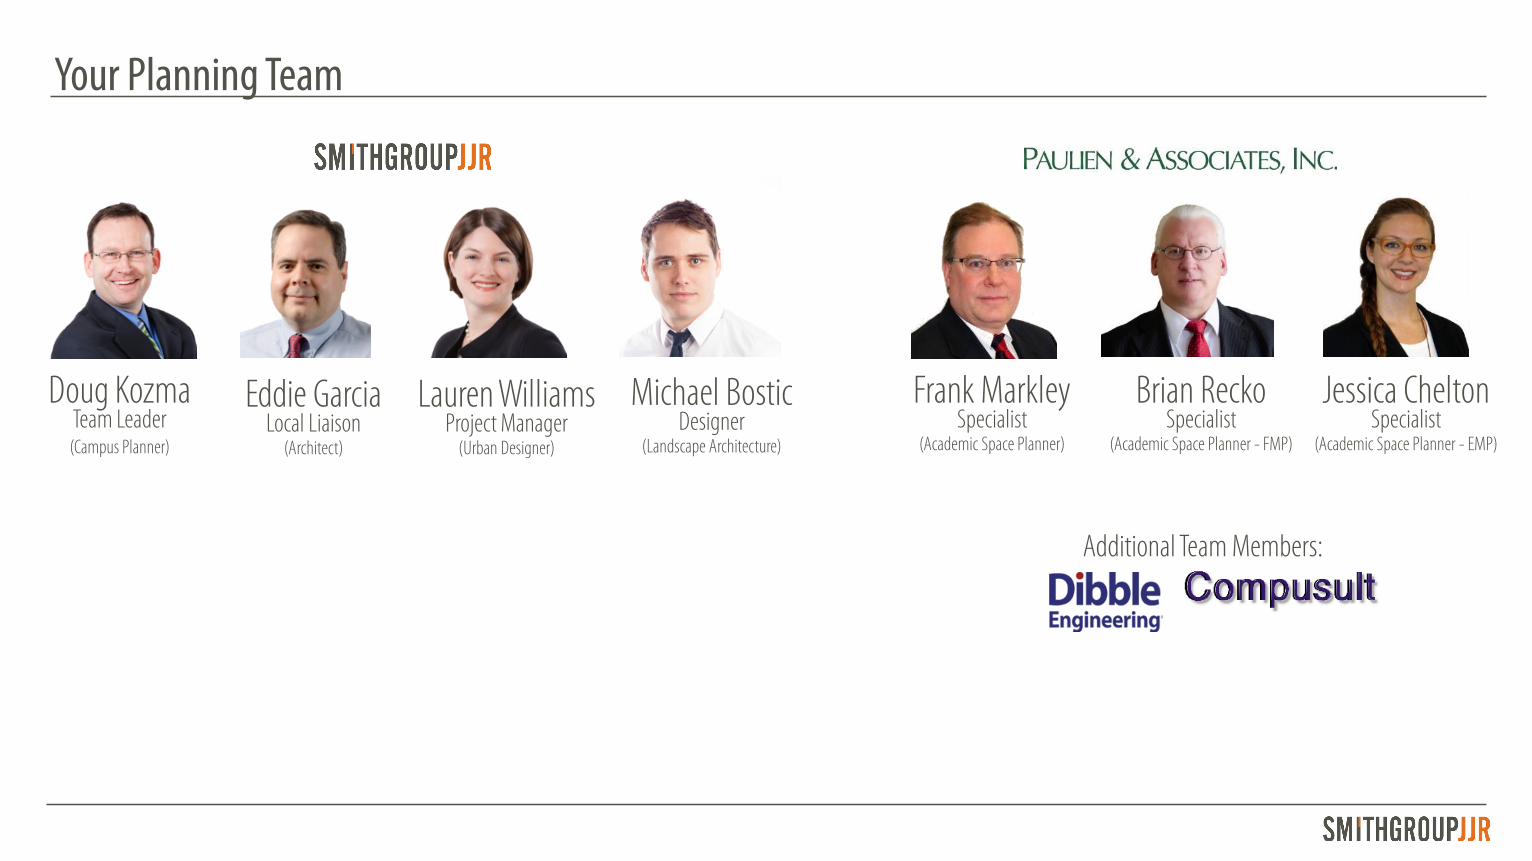
Your Planning Team
Doug Kozma Team Leader
(Campus Planner)
Eddie GarciaLocal Liaison
(Architect)
Lauren WilliamsProject Manager
(Urban Designer)
Frank MarkleySpecialist
(Academic Space Planner)
Michael BosticDesigner
(Landscape Architecture)
Additional Team Members:
Brian ReckoSpecialist
(Academic Space Planner - FMP)
Jessica CheltonSpecialist
(Academic Space Planner - EMP)
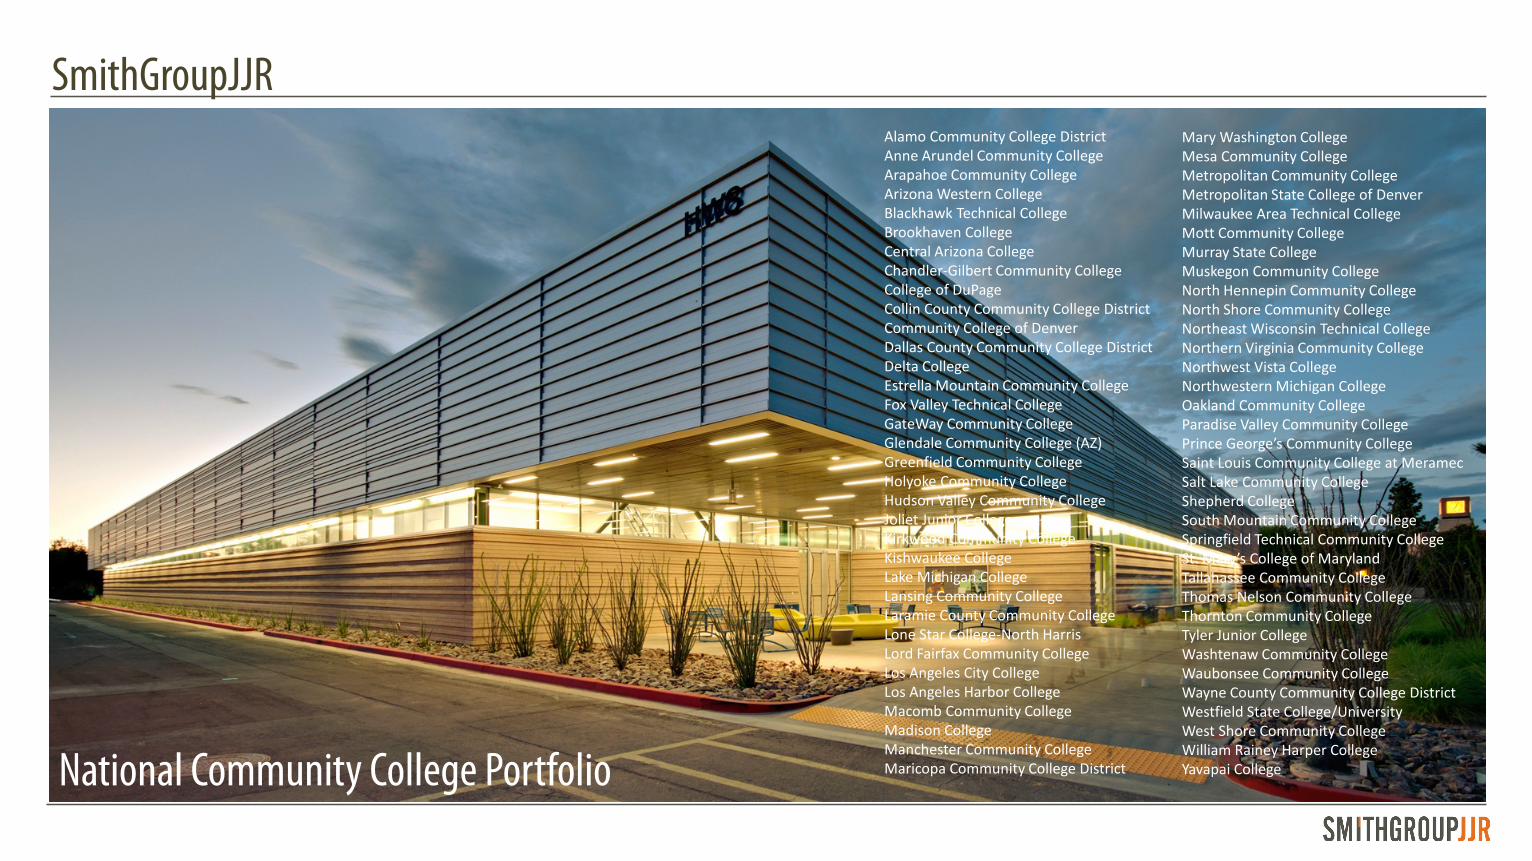
SmithGroupJJR
National Community College Portfolio
Alamo Community College DistrictAnne Arundel Community CollegeArapahoe Community CollegeArizona Western CollegeBlackhawk Technical CollegeBrookhaven CollegeCentral Arizona CollegeChandler-Gilbert Community CollegeCollege of DuPageCollin County Community College DistrictCommunity College of DenverDallas County Community College DistrictDelta CollegeEstrella Mountain Community CollegeFox Valley Technical CollegeGateWay Community CollegeGlendale Community College (AZ)Greenfield Community CollegeHolyoke Community CollegeHudson Valley Community CollegeJoliet Junior CollegeKirkwood Community CollegeKishwaukee CollegeLake Michigan CollegeLansing Community CollegeLaramie County Community CollegeLone Star College-North HarrisLord Fairfax Community CollegeLos Angeles City CollegeLos Angeles Harbor CollegeMacomb Community CollegeMadison CollegeManchester Community CollegeMaricopa Community College District
Mary Washington CollegeMesa Community CollegeMetropolitan Community CollegeMetropolitan State College of DenverMilwaukee Area Technical CollegeMott Community CollegeMurray State CollegeMuskegon Community CollegeNorth Hennepin Community CollegeNorth Shore Community CollegeNortheast Wisconsin Technical CollegeNorthern Virginia Community CollegeNorthwest Vista CollegeNorthwestern Michigan CollegeOakland Community CollegeParadise Valley Community CollegePrince George’s Community CollegeSaint Louis Community College at MeramecSalt Lake Community CollegeShepherd CollegeSouth Mountain Community CollegeSpringfield Technical Community CollegeSt. Mary’s College of MarylandTallahassee Community CollegeThomas Nelson Community CollegeThornton Community CollegeTyler Junior CollegeWashtenaw Community CollegeWaubonsee Community CollegeWayne County Community College DistrictWestfield State College/UniversityWest Shore Community CollegeWilliam Rainey Harper CollegeYavapai College
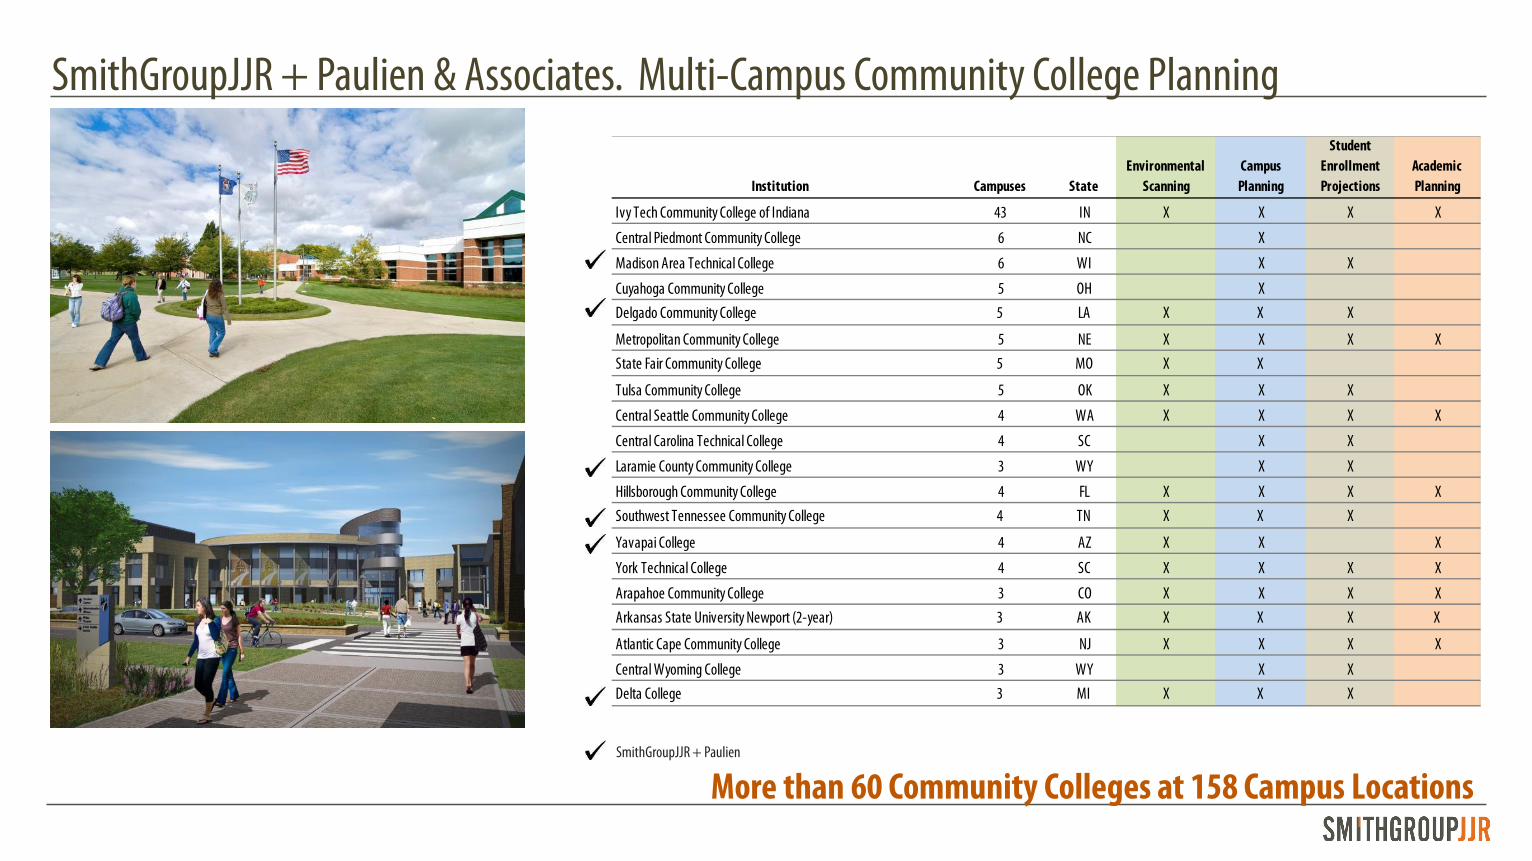
SmithGroupJJR + Paulien & Associates. Multi-Campus Community College Planning Experience
More than 60 Community Colleges at 158 Campus Locations
Paulien & Associate's Multicampus Community College Planning Experience
Institution Campuses StateEnvironmental
ScanningCampus
Planning
Student Enrollment Projections
Academic Planning
Ivy Tech Community College of Indiana 43 IN X X X X
Central Piedmont Community College 6 NC X
Madison Area Technical College 6 WI X X
Cuyahoga Community College 5 OH XDelgado Community College 5 LA X X X
Metropolitan Community College 5 NE X X X XState Fair Community College 5 MO X X
Tulsa Community College 5 OK X X X
Central Seattle Community College 4 WA X X X X
Central Carolina Technical College 4 SC X X
Laramie County Community College 3 WY X X
Hillsborough Community College 4 FL X X X XSouthwest Tennessee Community College 4 TN X X X
Yavapai College 4 AZ X X X
York Technical College 4 SC X X X X
Arapahoe Community College 3 CO X X X XArkansas State University Newport (2-year) 3 AK X X X X
Atlantic Cape Community College 3 NJ X X X X
Central Wyoming College 3 WY X XDelta College 3 MI X X X
SmithGroupJJR + Paulien
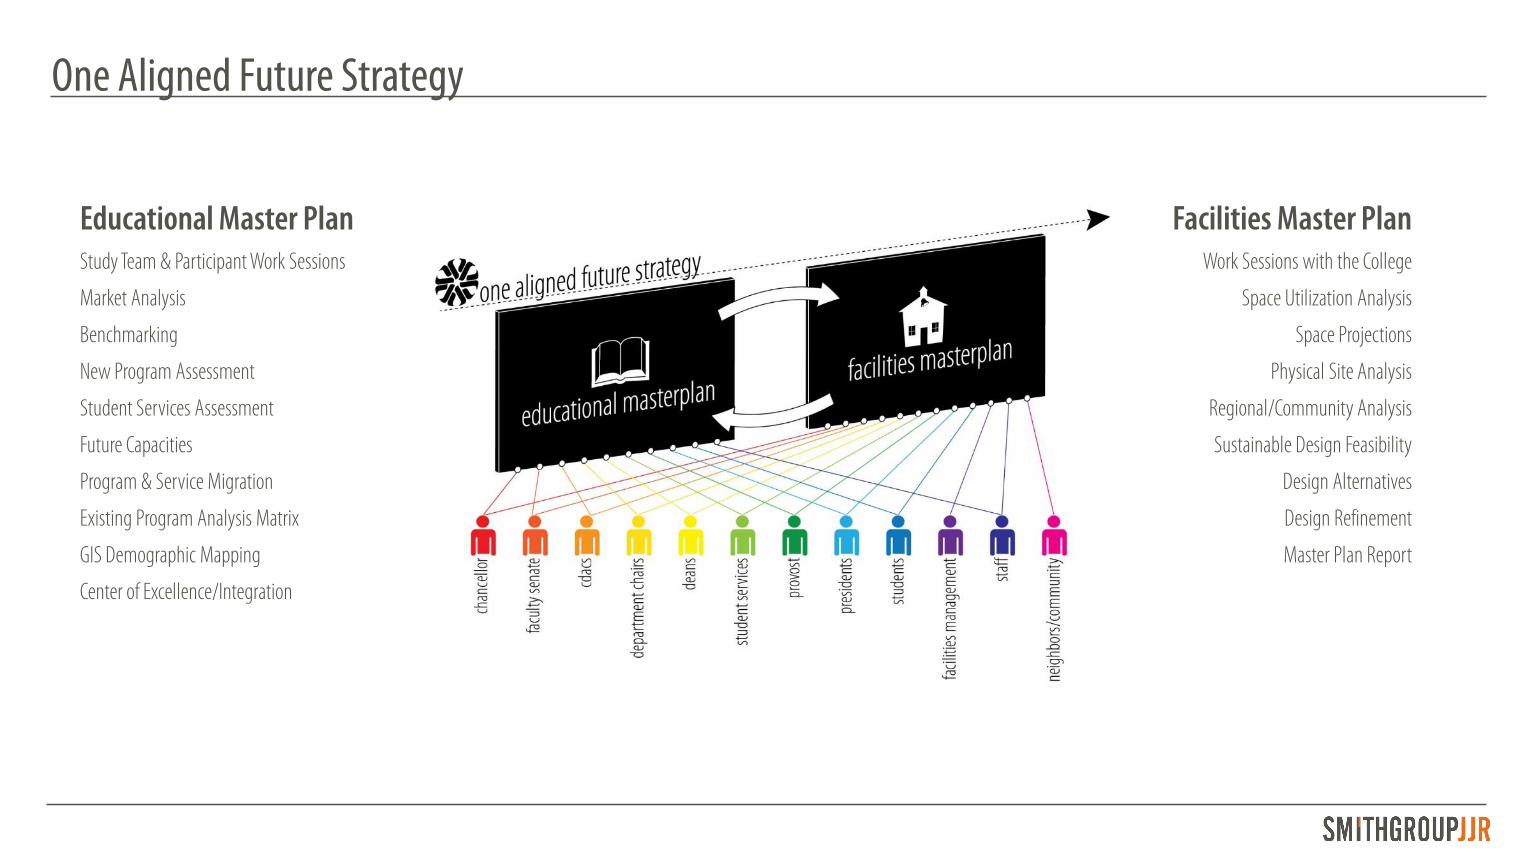
One Aligned Future Strategy
Educational Master PlanStudy Team & Participant Work Sessions
Market Analysis
Benchmarking
New Program Assessment
Student Services Assessment
Future Capacities
Program & Service Migration
Existing Program Analysis Matrix
GIS Demographic Mapping
Center of Excellence/Integration
Facilities Master PlanWork Sessions with the College
Space Utilization Analysis
Space Projections
Physical Site Analysis
Regional/Community Analysis
Sustainable Design Feasibility
Design Alternatives
Design Refinement
Master Plan Report
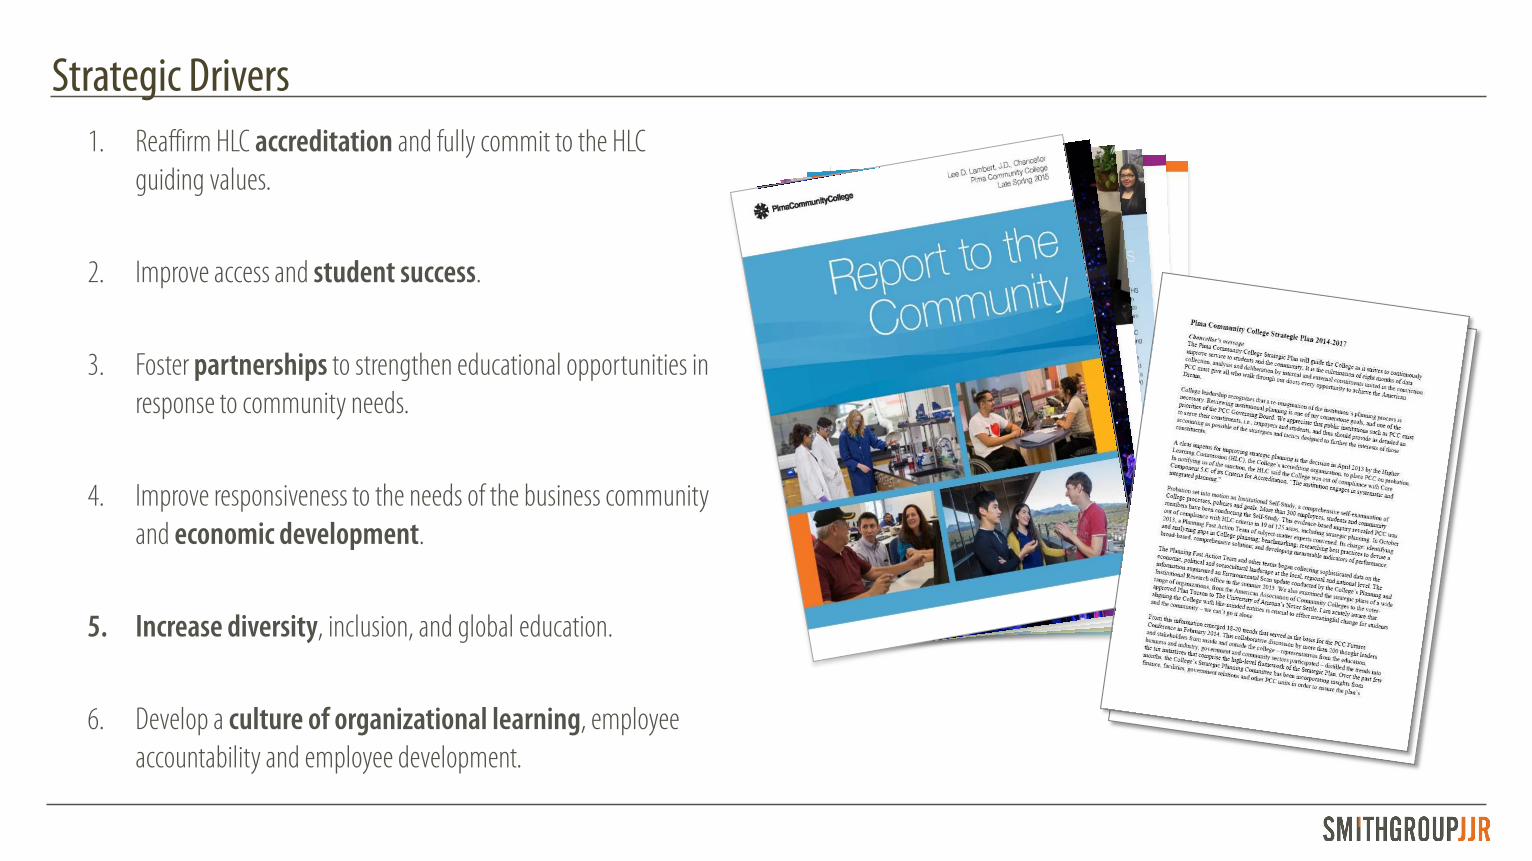
Strategic Drivers1. Reaffirm HLC accreditation and fully commit to the HLC
guiding values.
2. Improve access and student success.
3. Foster partnerships to strengthen educational opportunities in response to community needs.
4. Improve responsiveness to the needs of the business community and economic development.
5. Increase diversity, inclusion, and global education.
6. Develop a culture of organizational learning, employee accountability and employee development.
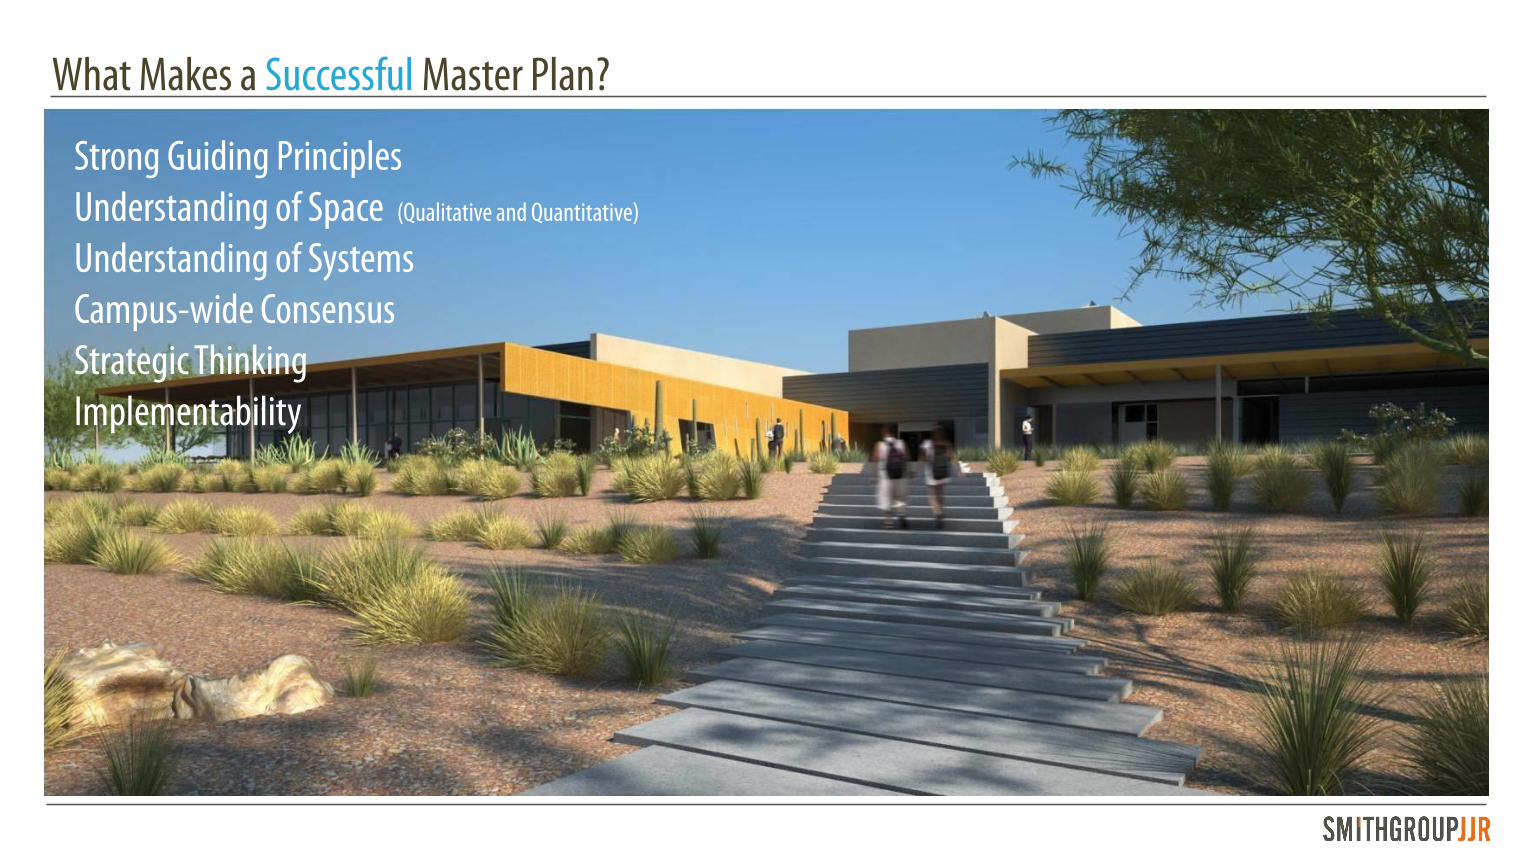
What Makes a Successful Master Plan?
• Strong Guiding Principles• Understanding of Space (Qualitative and Quantitative)
• Understanding of Systems• Campus-wide Consensus• Strategic Thinking• Implementability
Master Planning Process
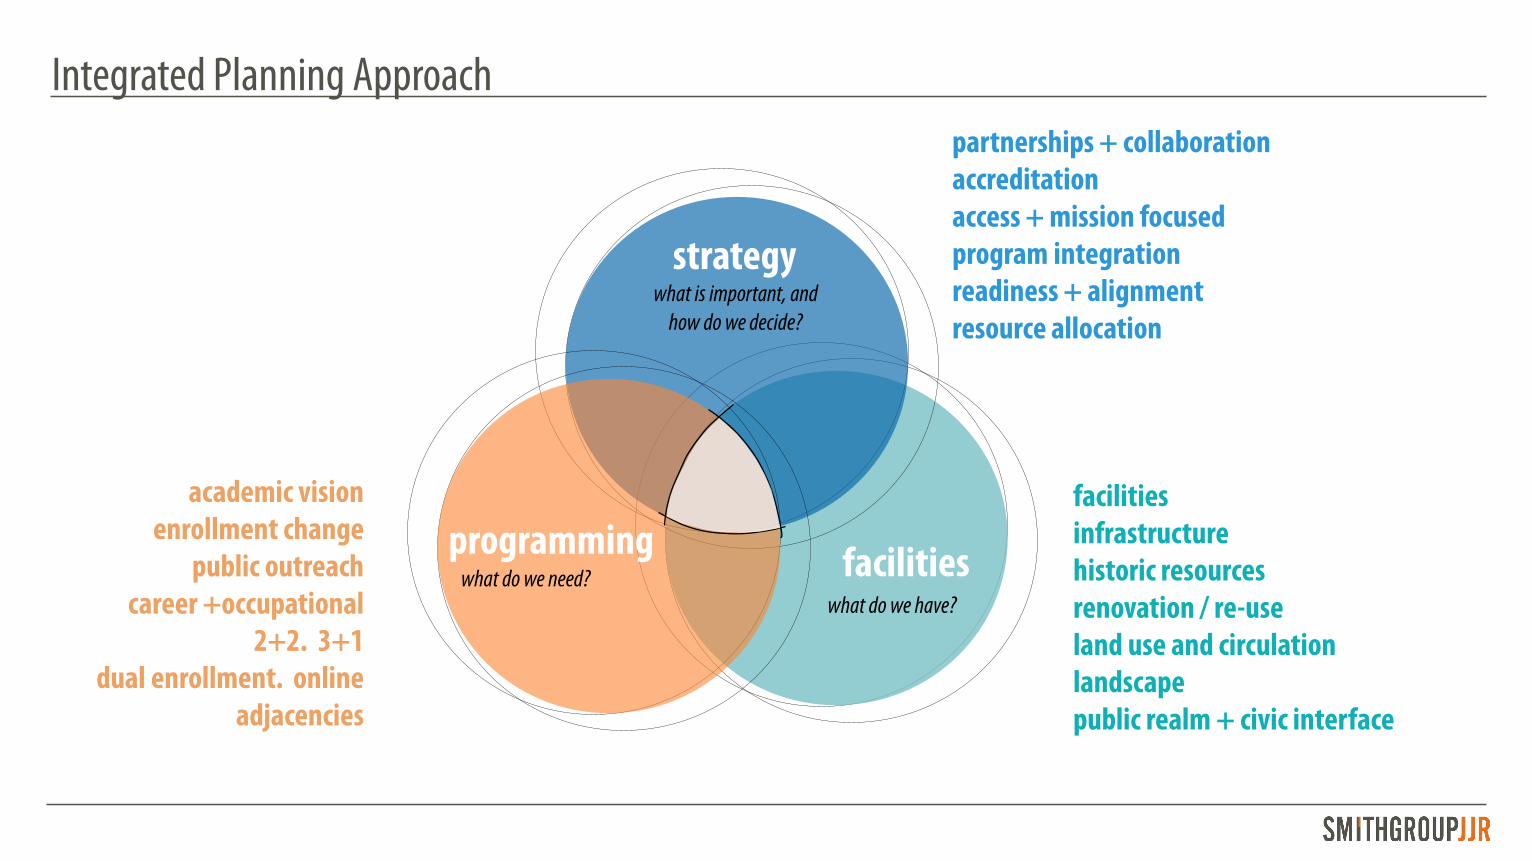
Integrated Planning Approach
strategy
programming facilities
facilitiesinfrastructurehistoric resourcesrenovation / re-useland use and circulationlandscapepublic realm + civic interface
academic vision enrollment change
public outreachcareer +occupational
2+2. 3+1dual enrollment. online
adjacencies
what do we have?what do we need?
what is important, andhow do we decide?
partnerships + collaborationaccreditationaccess + mission focusedprogram integrationreadiness + alignmentresource allocation
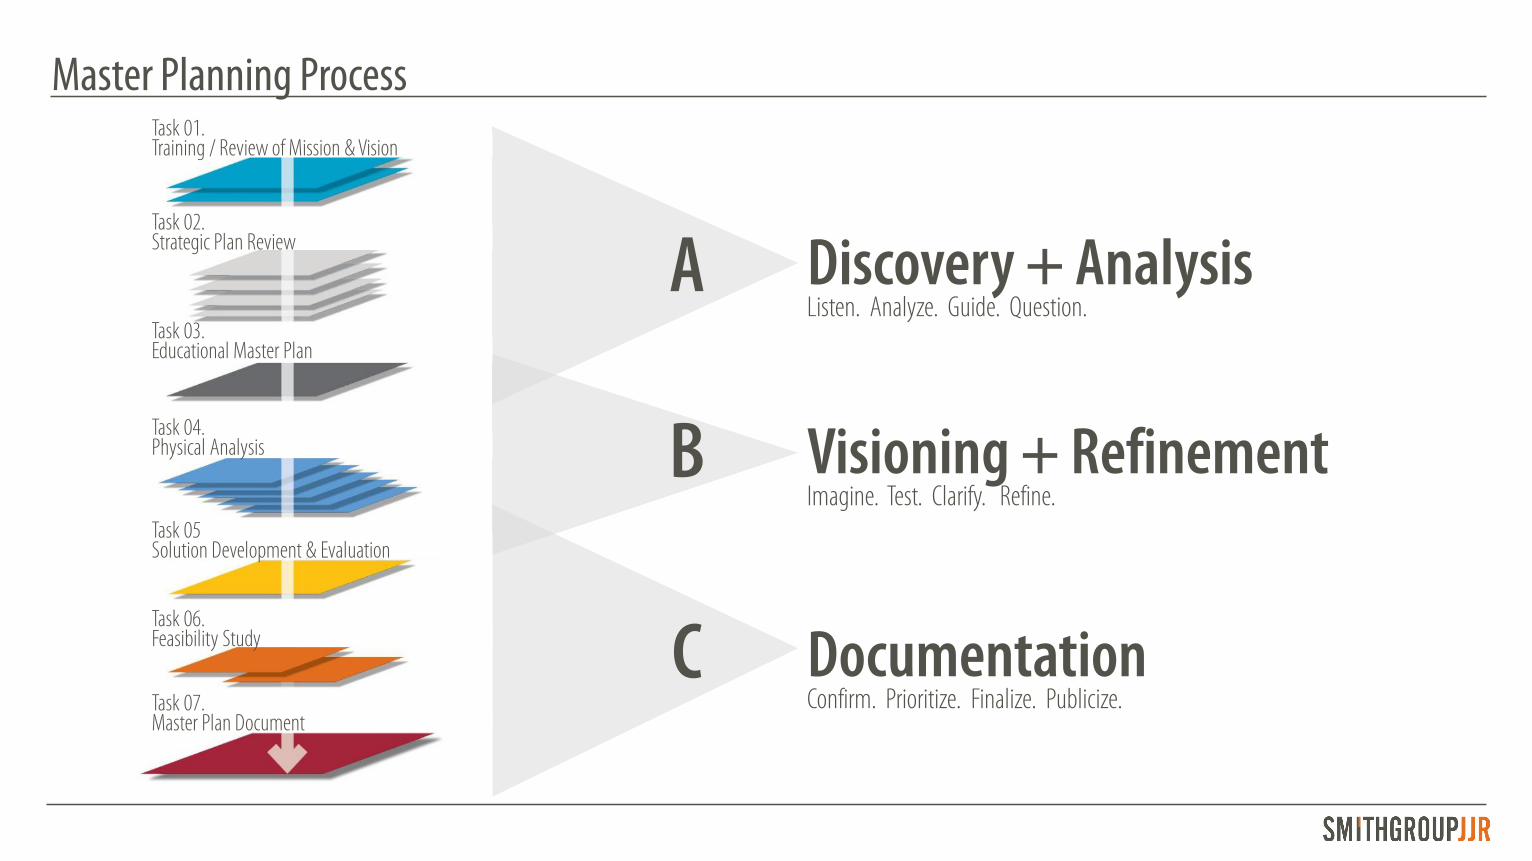
Master Planning Process
A Discovery + AnalysisListen. Analyze. Guide. Question.
Visioning + RefinementImagine. Test. Clarify. Refine.
DocumentationConfirm. Prioritize. Finalize. Publicize.
B
C
Task 01. Training / Review of Mission & Vision
Task 02. Strategic Plan Review
Task 04. Physical Analysis
Task 05Solution Development & Evaluation
Task 06. Feasibility Study
Task 07. Master Plan Document
Task 03. Educational Master Plan
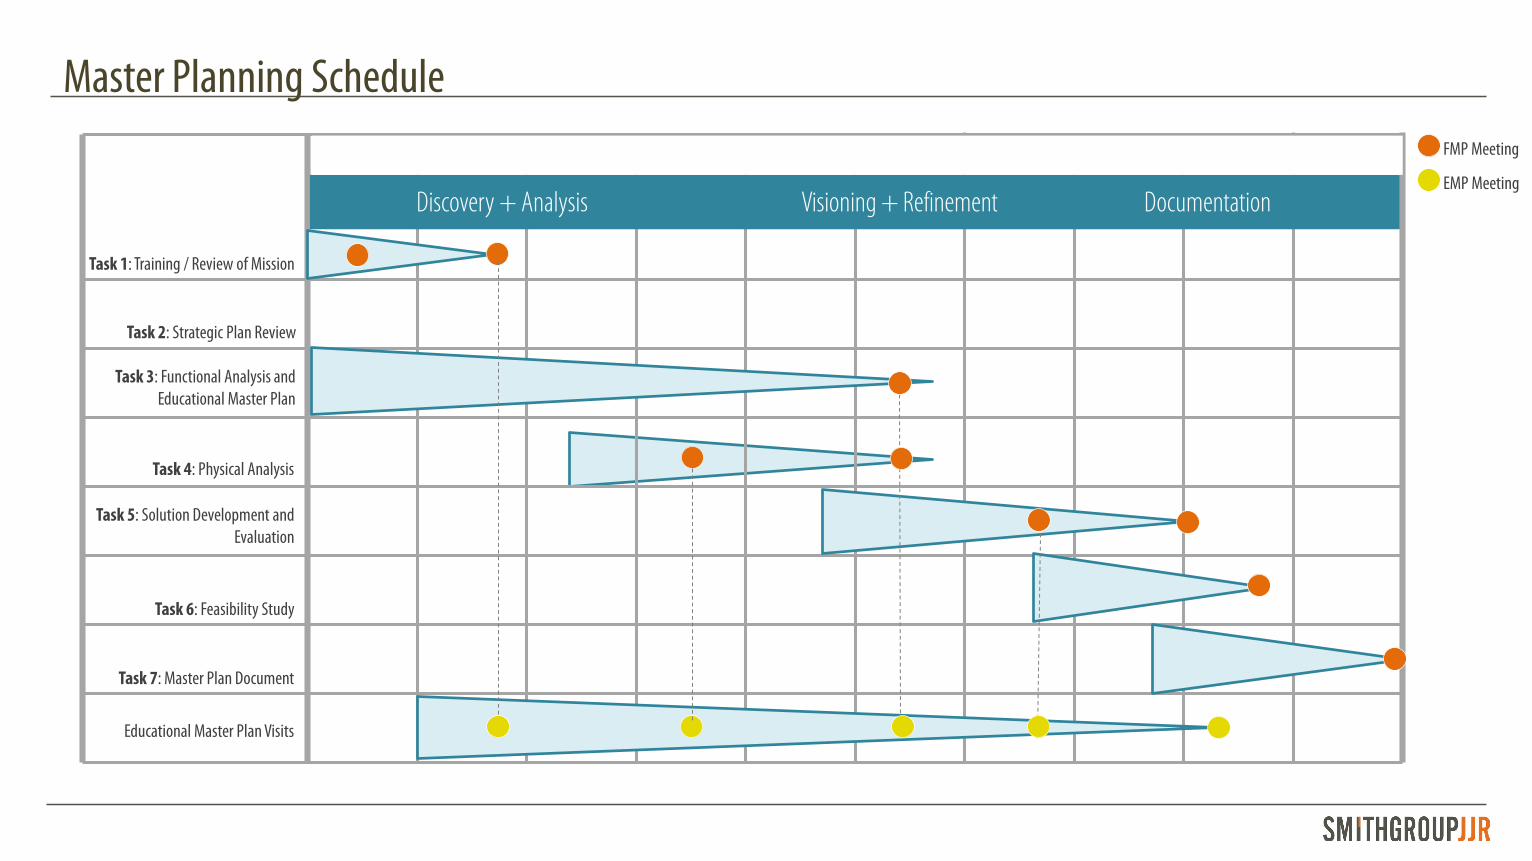
Discovery + Analysis Visioning + Refinement DocumentationSeptember October November December January February March
Task 1: Training / Review of Mission
Task 2: Strategic Plan Review
Task 3: Functional Analysis and Educational Master Plan
Task 4: Physical Analysis
Task 5: Solution Development and Evaluation
Task 6: Feasibility Study
Task 7: Master Plan Document
FMP Meeting
Master Planning Schedule
AprilAugust (2015) May (2016)EMP Meeting
Educational Master Plan Visits
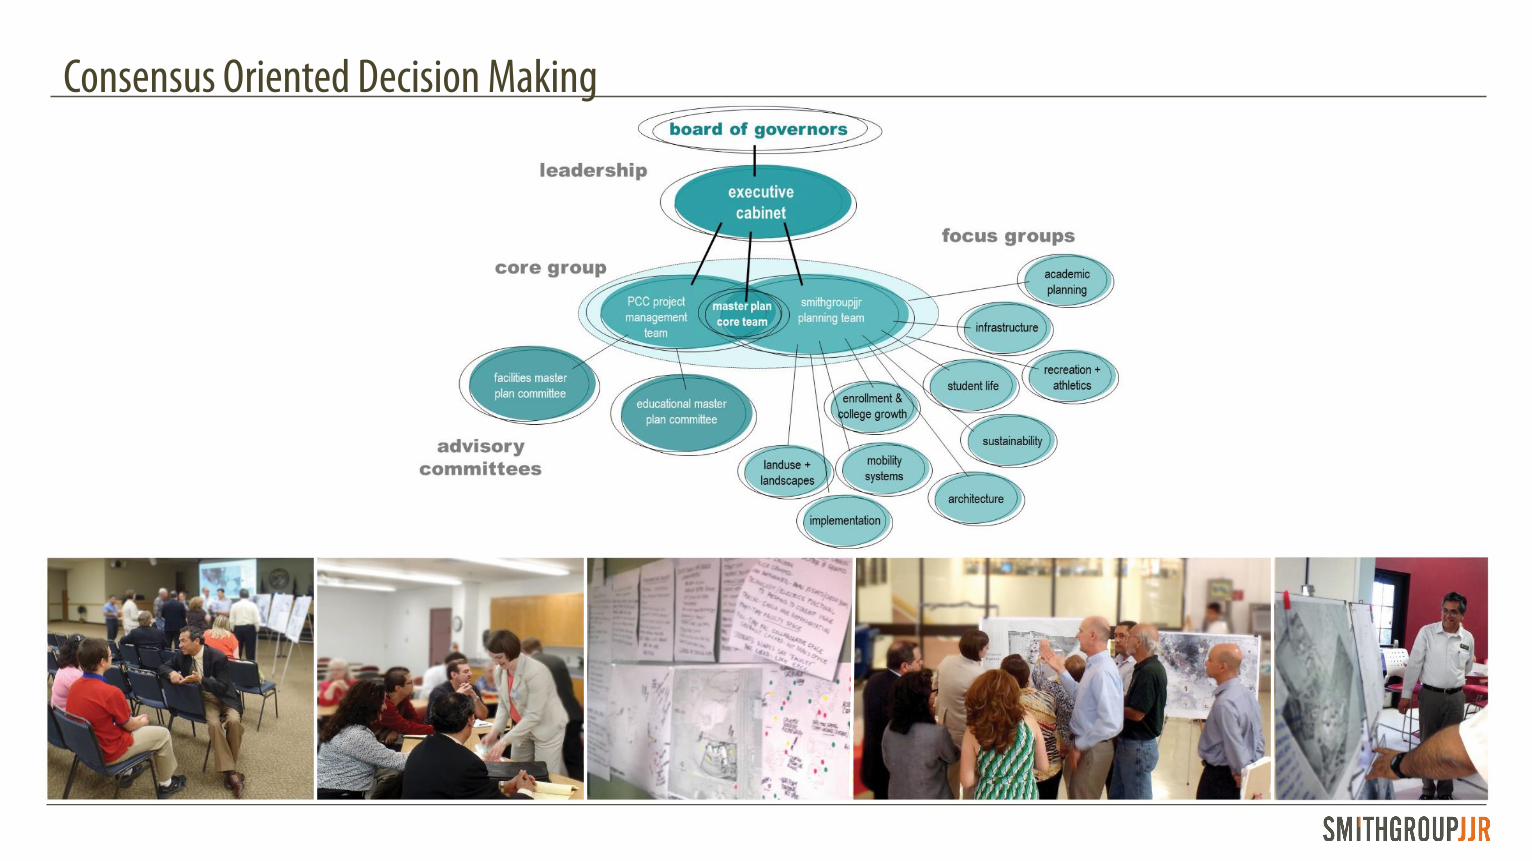
Consensus Oriented Decision Making
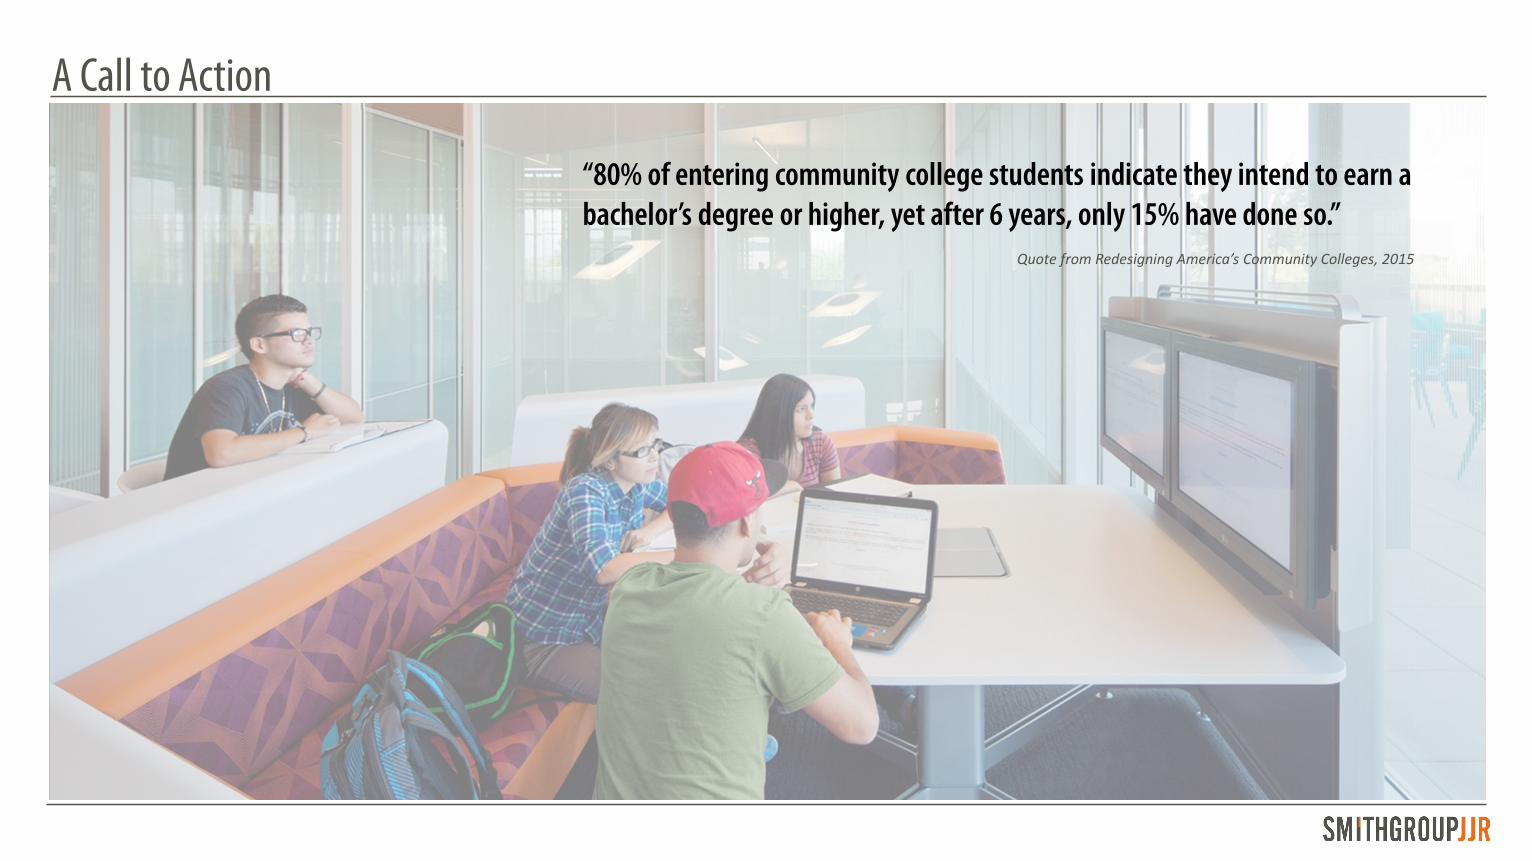
A Call to Action
“80% of entering community college students indicate they intend to earn a bachelor’s degree or higher, yet after 6 years, only 15% have done so.”
Quote from Redesigning America’s Community Colleges, 2015
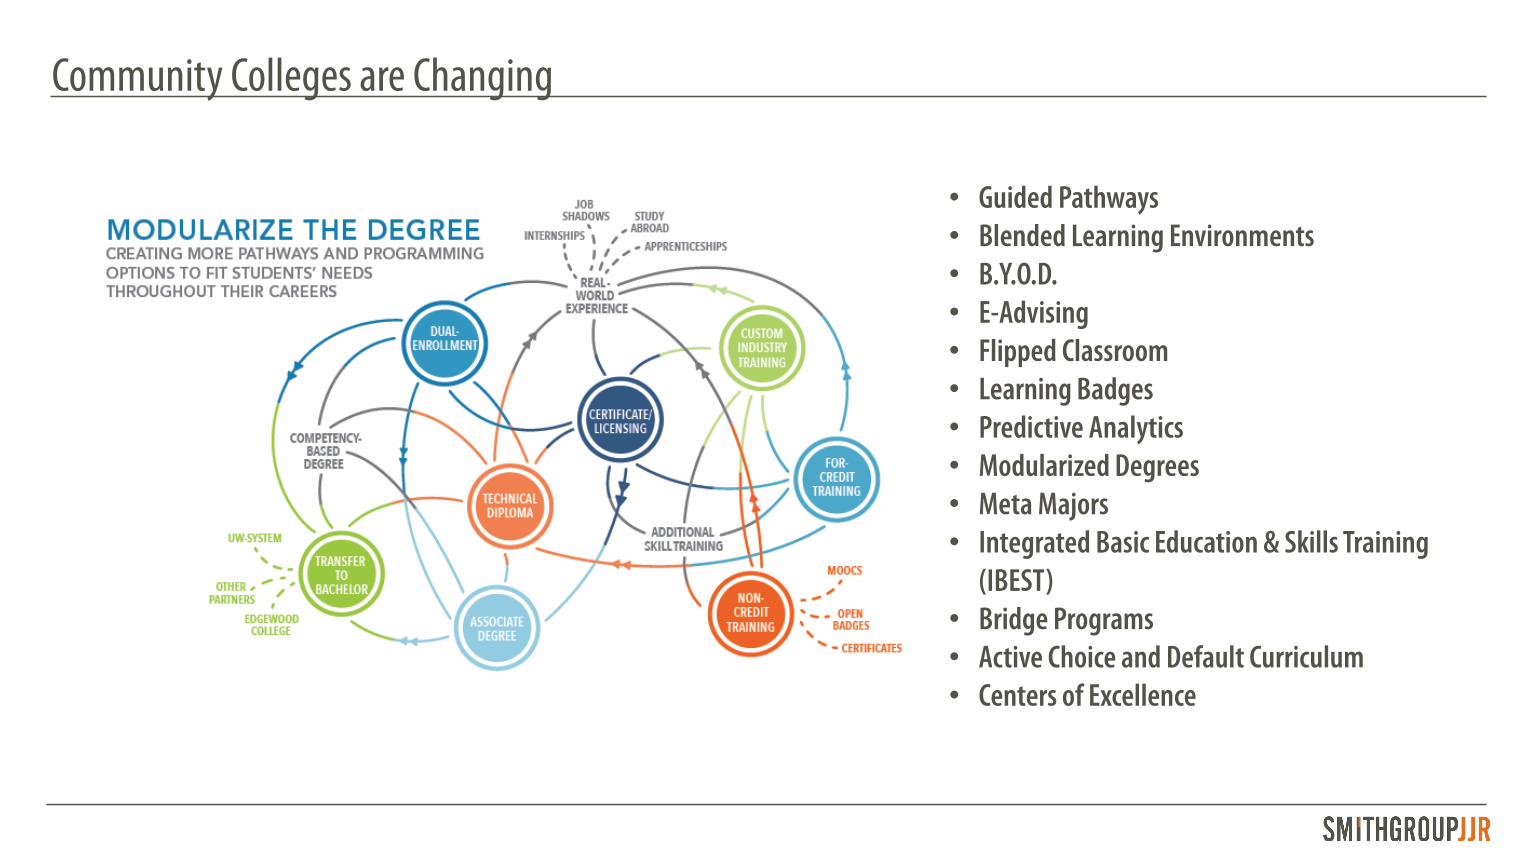
Community Colleges are Changing
• Guided Pathways• Blended Learning Environments• B.Y.O.D.• E-Advising• Flipped Classroom• Learning Badges• Predictive Analytics• Modularized Degrees• Meta Majors• Integrated Basic Education & Skills Training
(IBEST)• Bridge Programs• Active Choice and Default Curriculum• Centers of Excellence
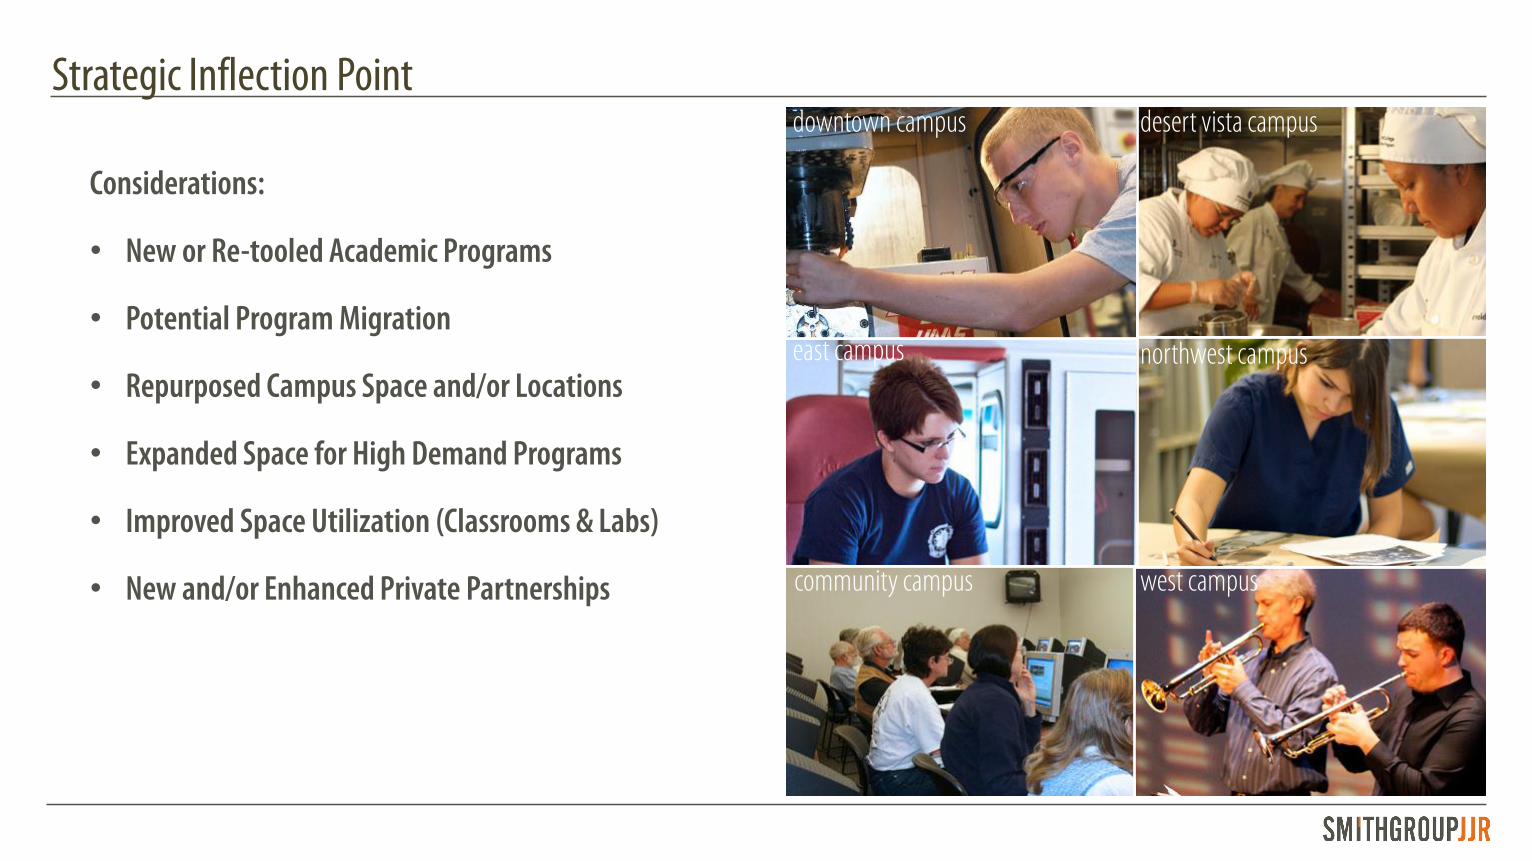
Strategic Inflection Point
Considerations:
• New or Re-tooled Academic Programs
• Potential Program Migration
• Repurposed Campus Space and/or Locations
• Expanded Space for High Demand Programs
• Improved Space Utilization (Classrooms & Labs)
• New and/or Enhanced Private Partnerships west campus
northwest campus
desert vista campusdowntown campus
east campus
community campus

Pima Today
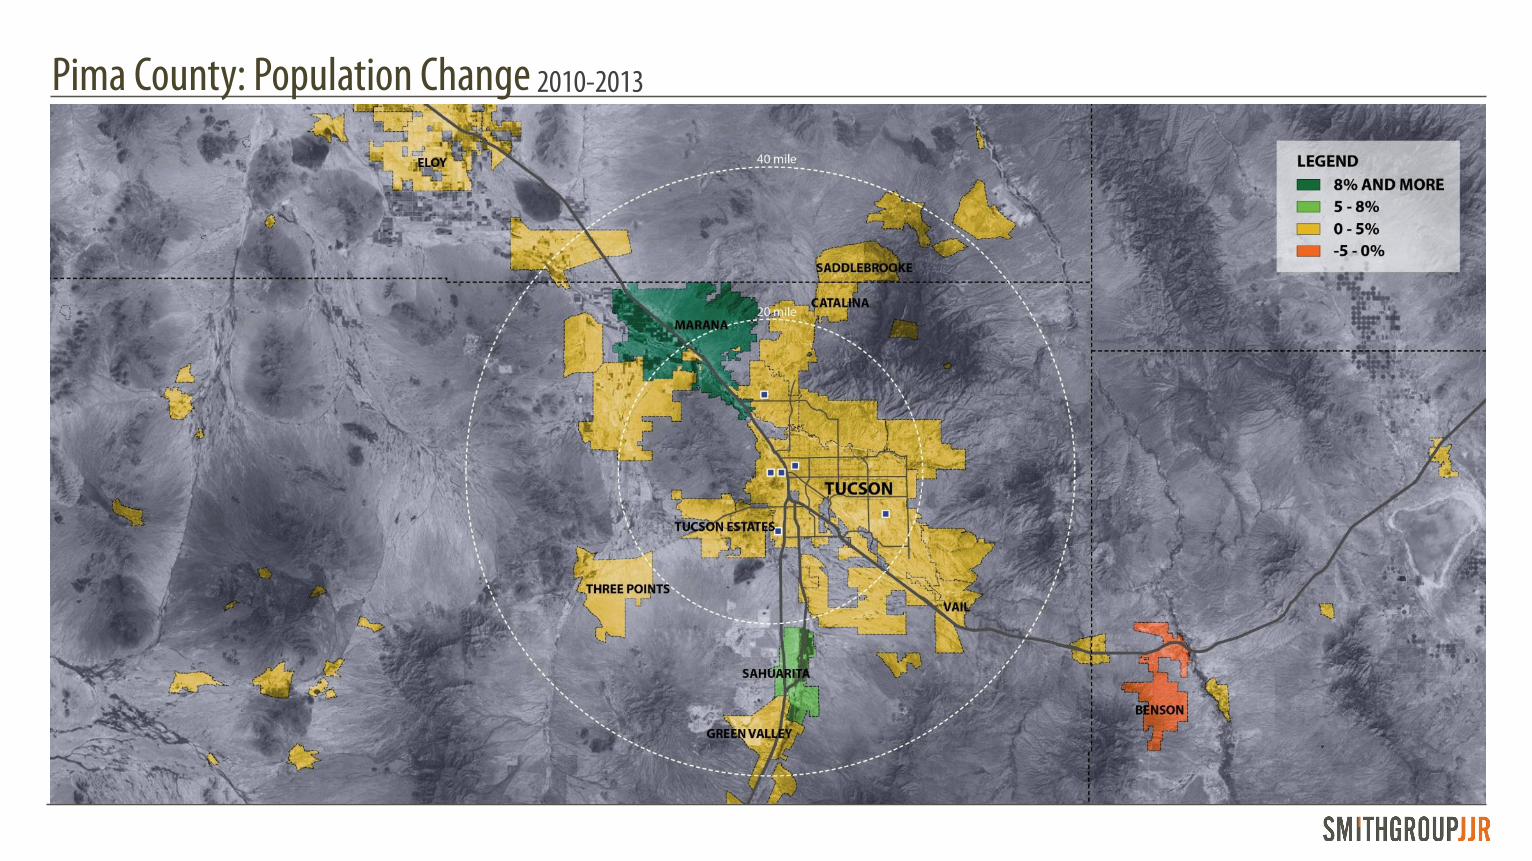
2010-2013Pima County: Population Change
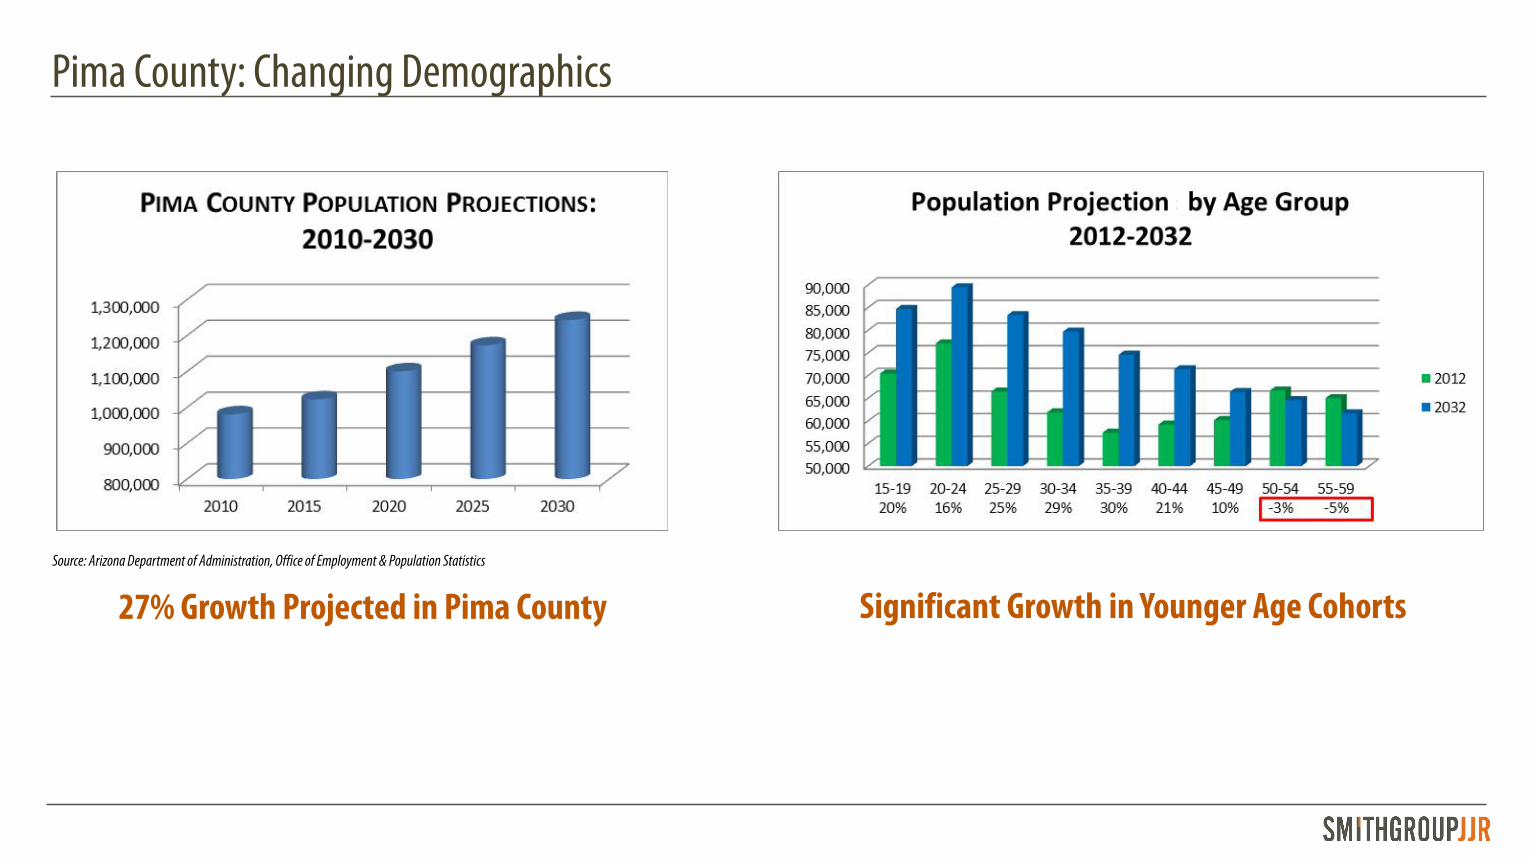
Pima County: Changing Demographics
Source: Arizona Department of Administration, Office of Employment & Population Statistics
27% Growth Projected in Pima County Significant Growth in Younger Age Cohorts
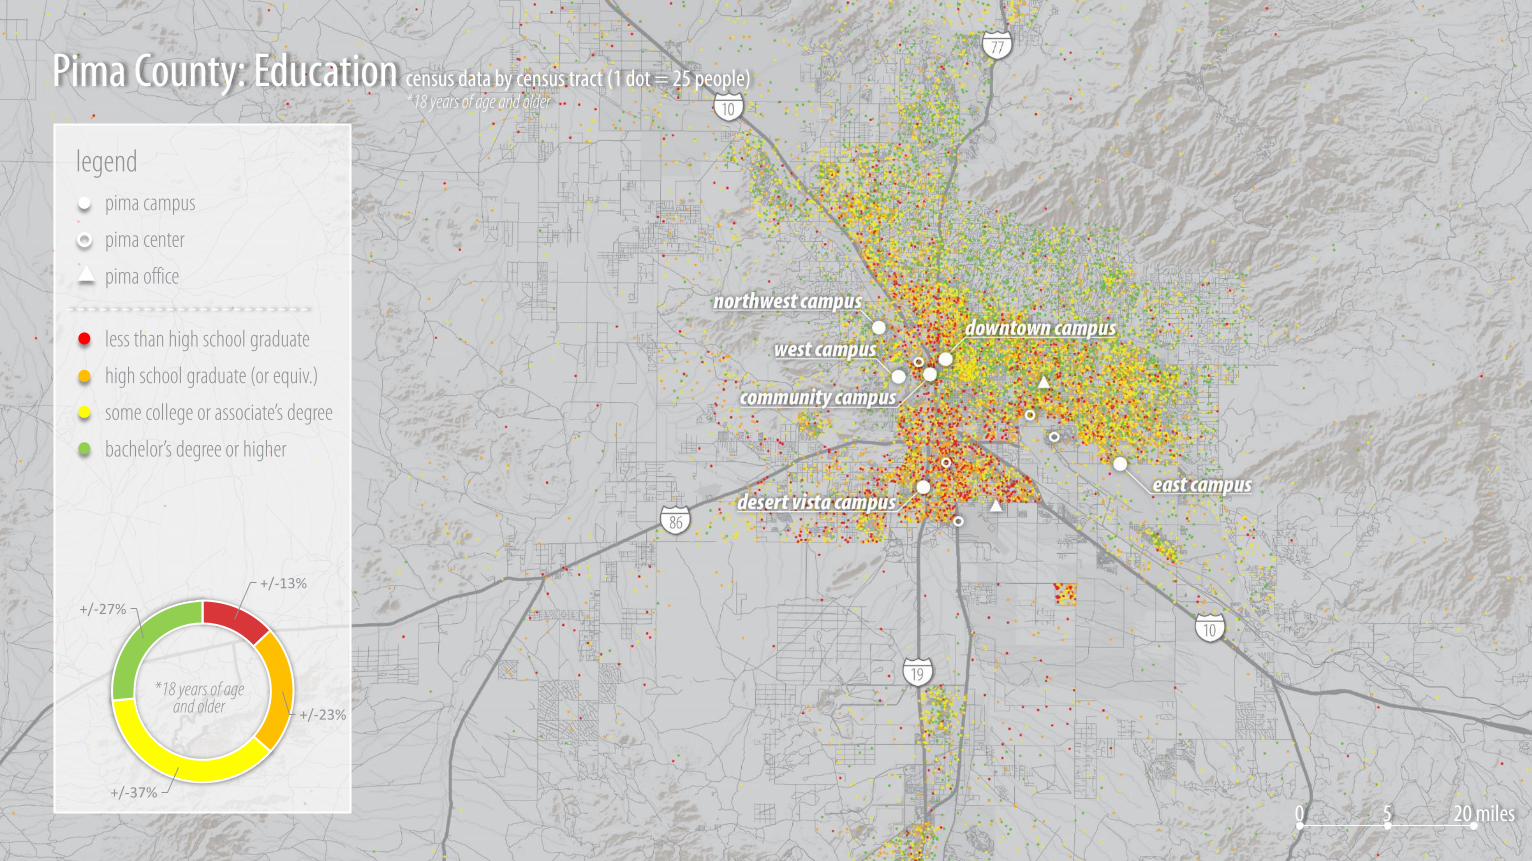
Pima County: Education census data by census tract (1 dot = 25 people)
legendpima campus
pima center
pima office
less than high school graduate
high school graduate (or equiv.)
some college or associate’s degree
bachelor’s degree or higher
+/-13%
+/-23%
+/-37%
+/-27%
*18 years of age and older
*18 years of age and older
20 miles0 5
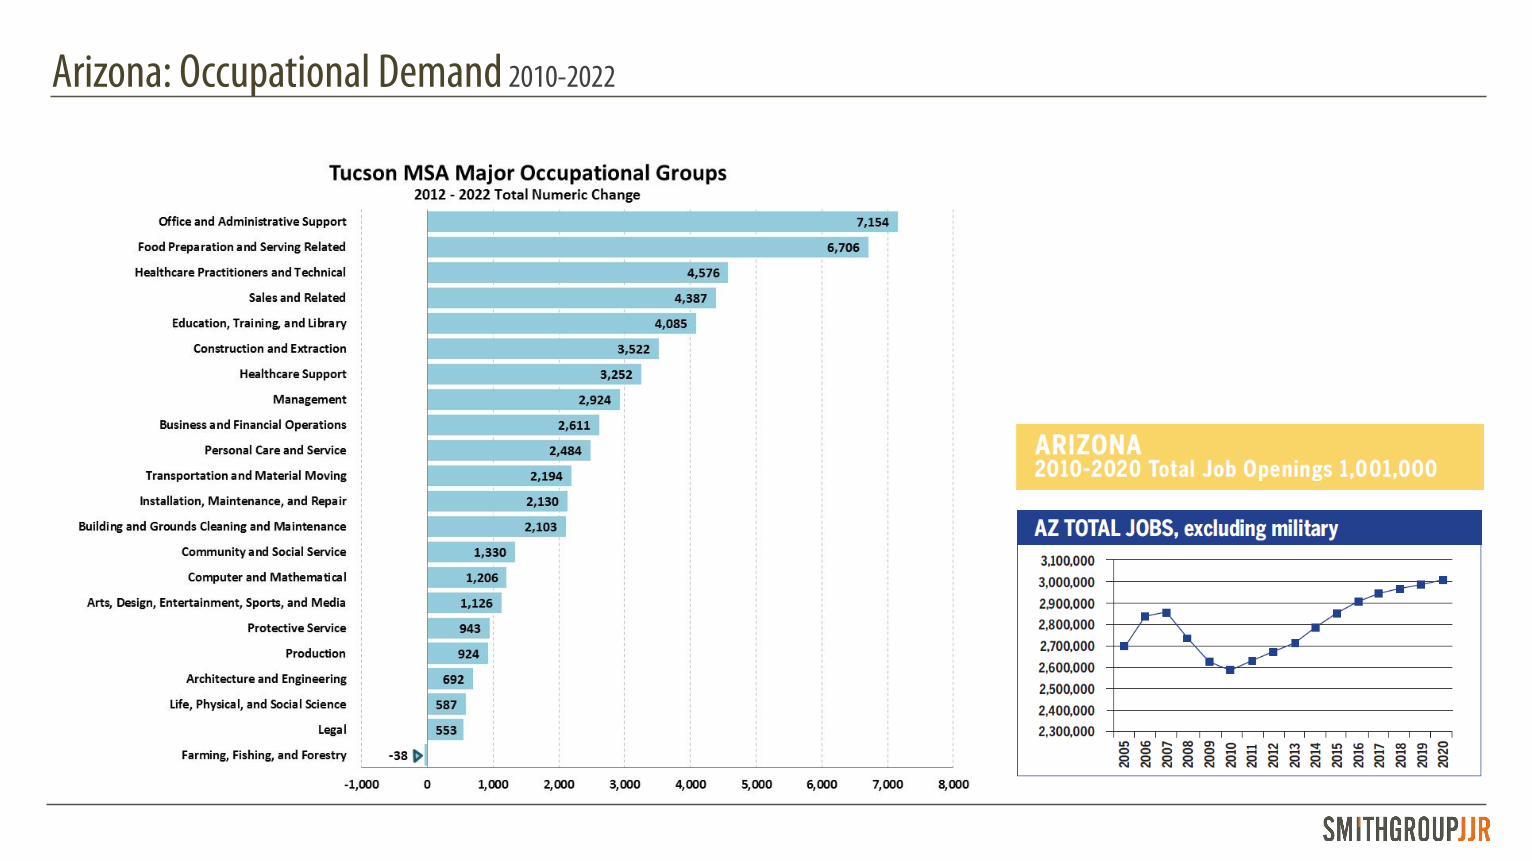
Arizona: Occupational Demand 2010-2022
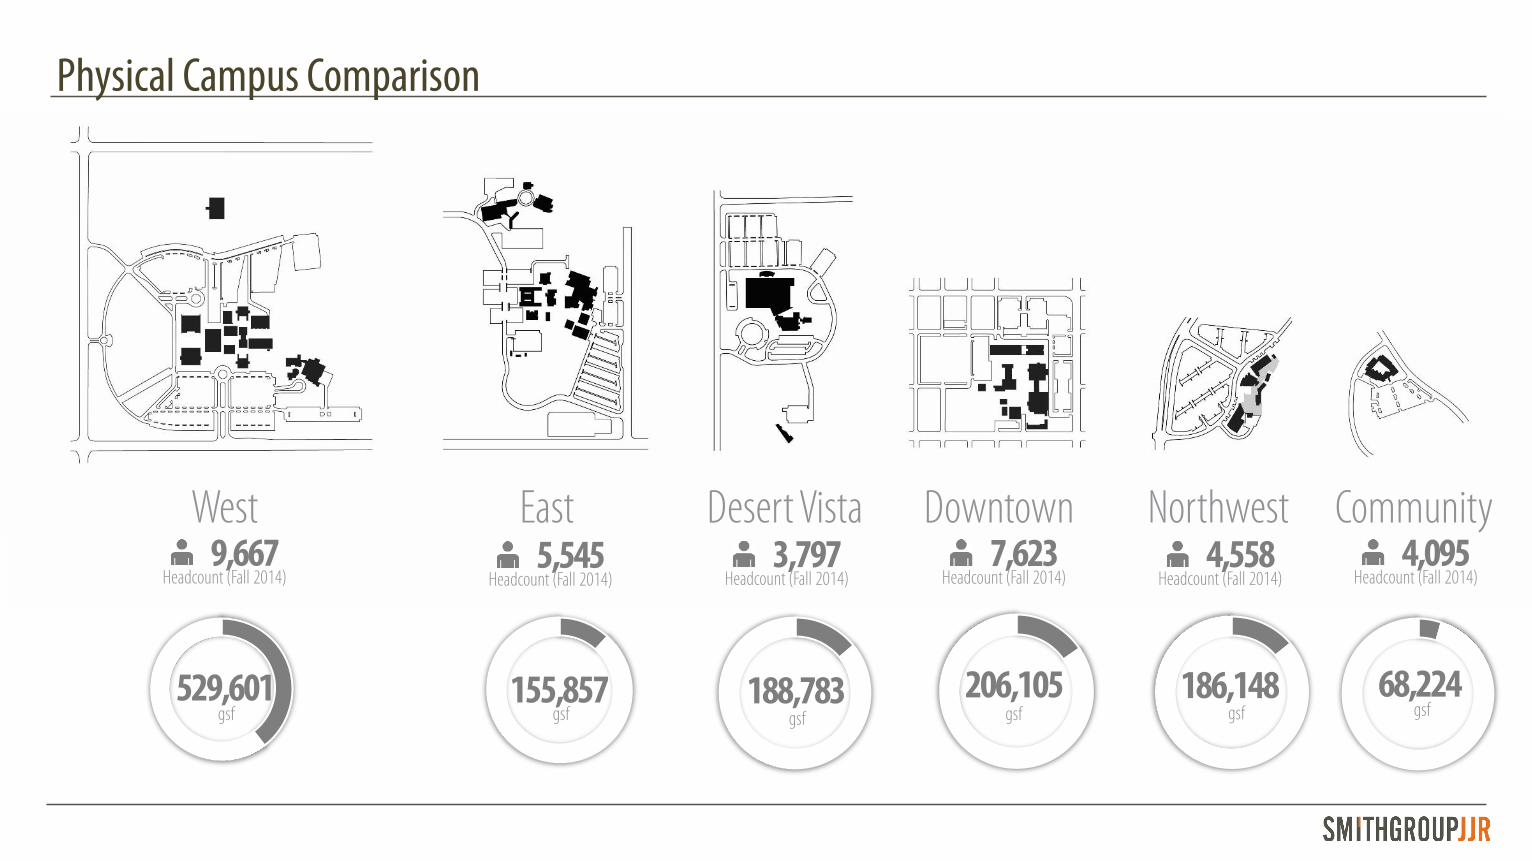
Physical Campus Comparison
Desert Vista Downtown Northwest CommunityEastWest9,667
Headcount (Fall 2014)7,623
Headcount (Fall 2014)5,545
Headcount (Fall 2014)4,095
Headcount (Fall 2014)3,797
Headcount (Fall 2014)4,558
Headcount (Fall 2014)
gsf529,601
gsf206,105
gsf155,857
gsf186,148
gsf68,224
gsf188,783
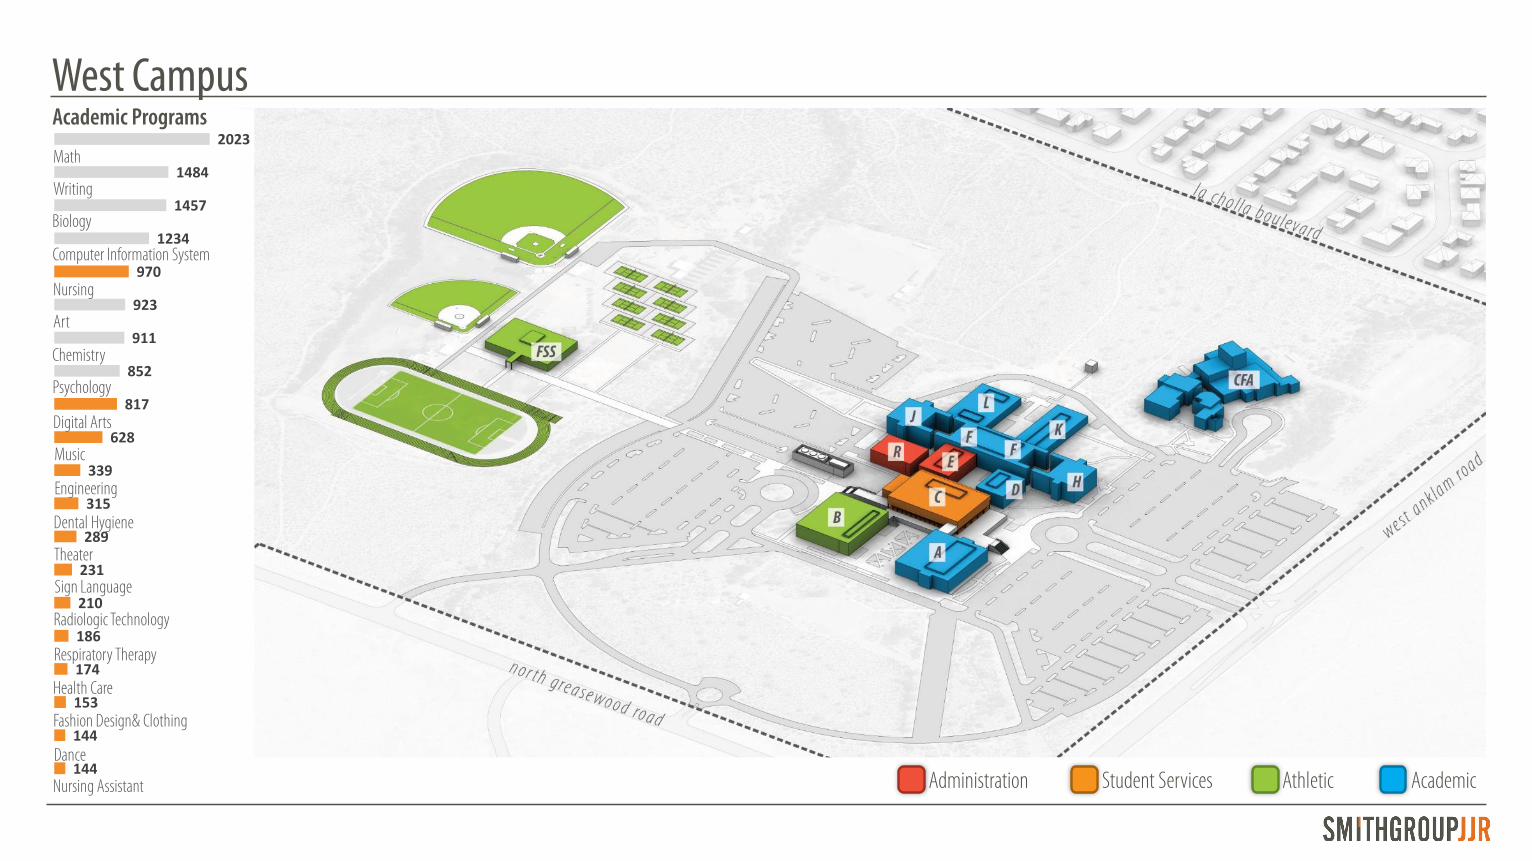
West CampusAcademic Programs
144
144
153
174
186
210
231
289
315
339
628
817
852
911
923
970
1234
1457
1484
2023
Music
Digital Arts
Psychology
Chemistry
Art
Nursing
Computer Information System
Biology
Writing
Math
Radiologic Technology
Sign Language
Theater
Dental Hygiene
Engineering
Nursing Assistant
Dance
Fashion Design& Clothing
Health Care
Respiratory Therapy
Administration Student Services Athletic Academic
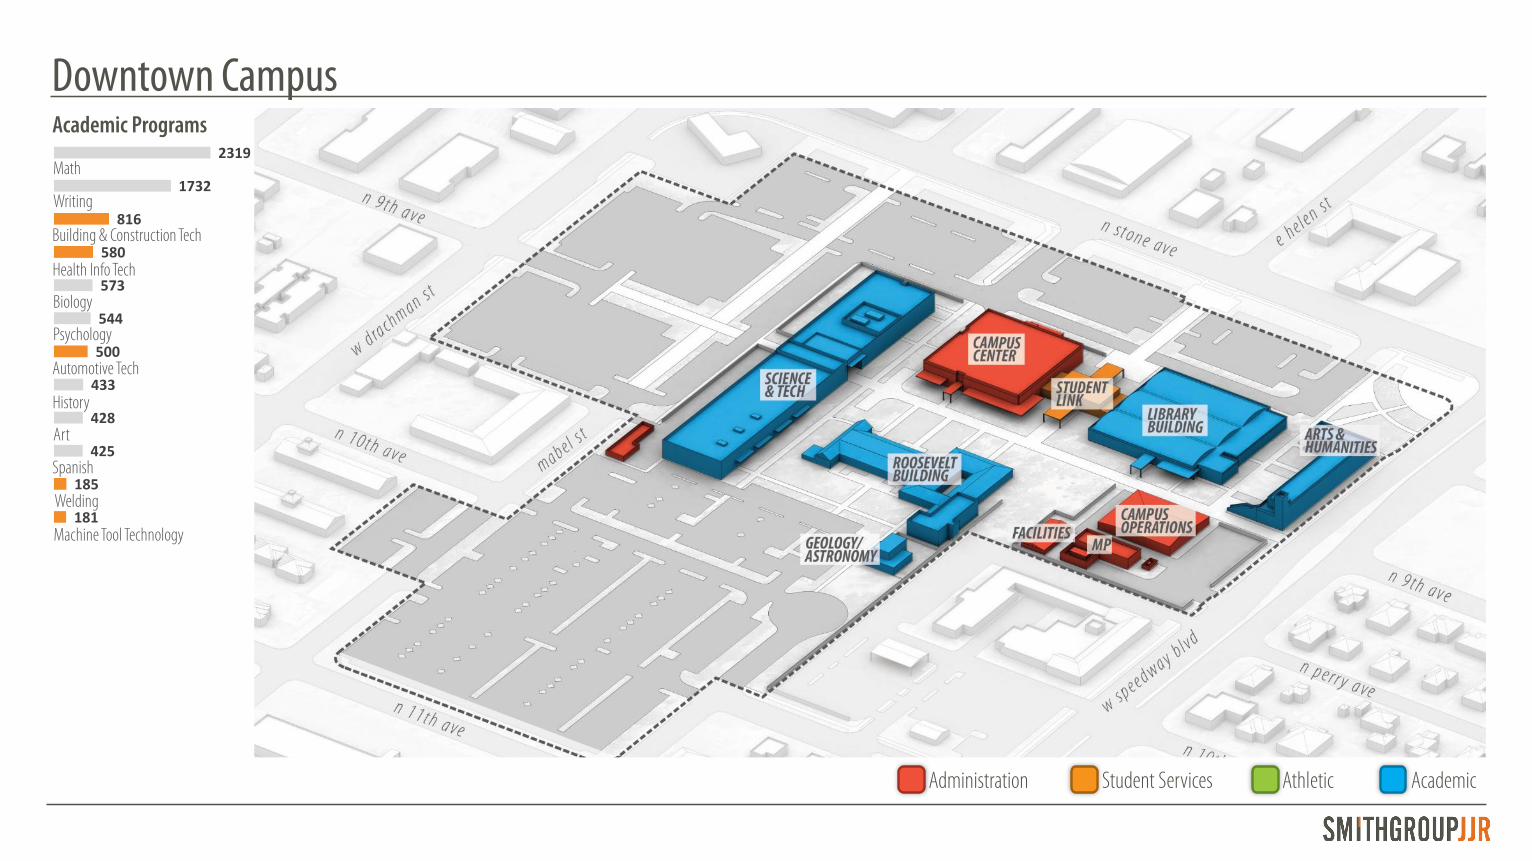
Downtown CampusAcademic Programs
181
185
425
428
433
500
544
573
580
816
1732
2319
Spanish
Art
History
Automotive Tech
Psychology
Biology
Health Info Tech
Building & Construction Tech
Writing
Math
Machine Tool Technology
Welding
Administration Student Services Athletic Academic
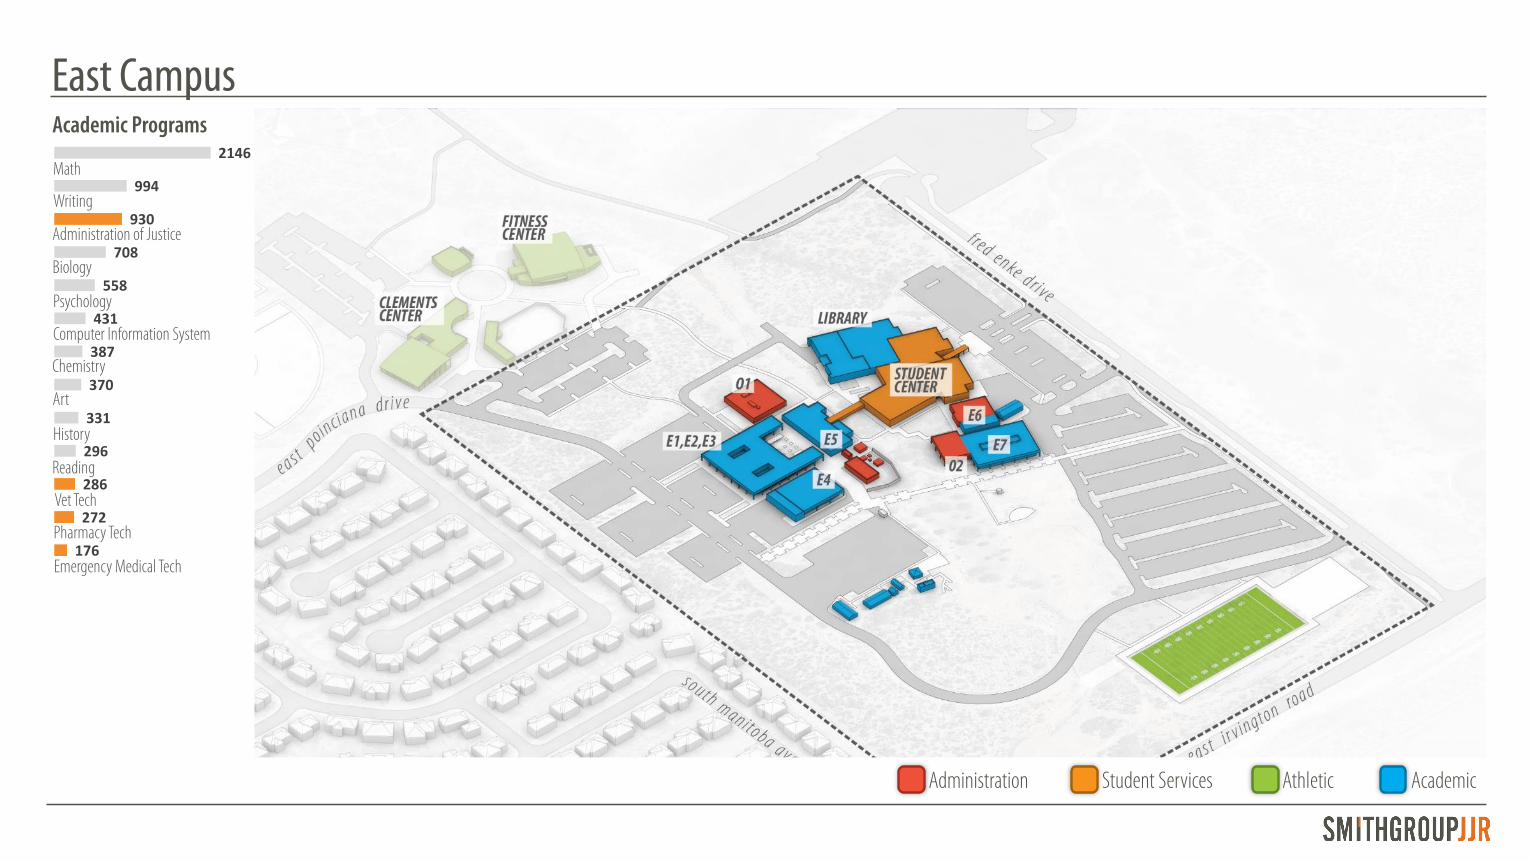
East Campus
176
272
286
296
331
370
387
431
558
708
930
994
2146
Reading
History
Art
Chemistry
Computer Information System
Psychology
Biology
Administration of Justice
Writing
Math
Emergency Medical Tech
Pharmacy Tech
Vet Tech
Administration Student Services Athletic Academic
Academic Programs
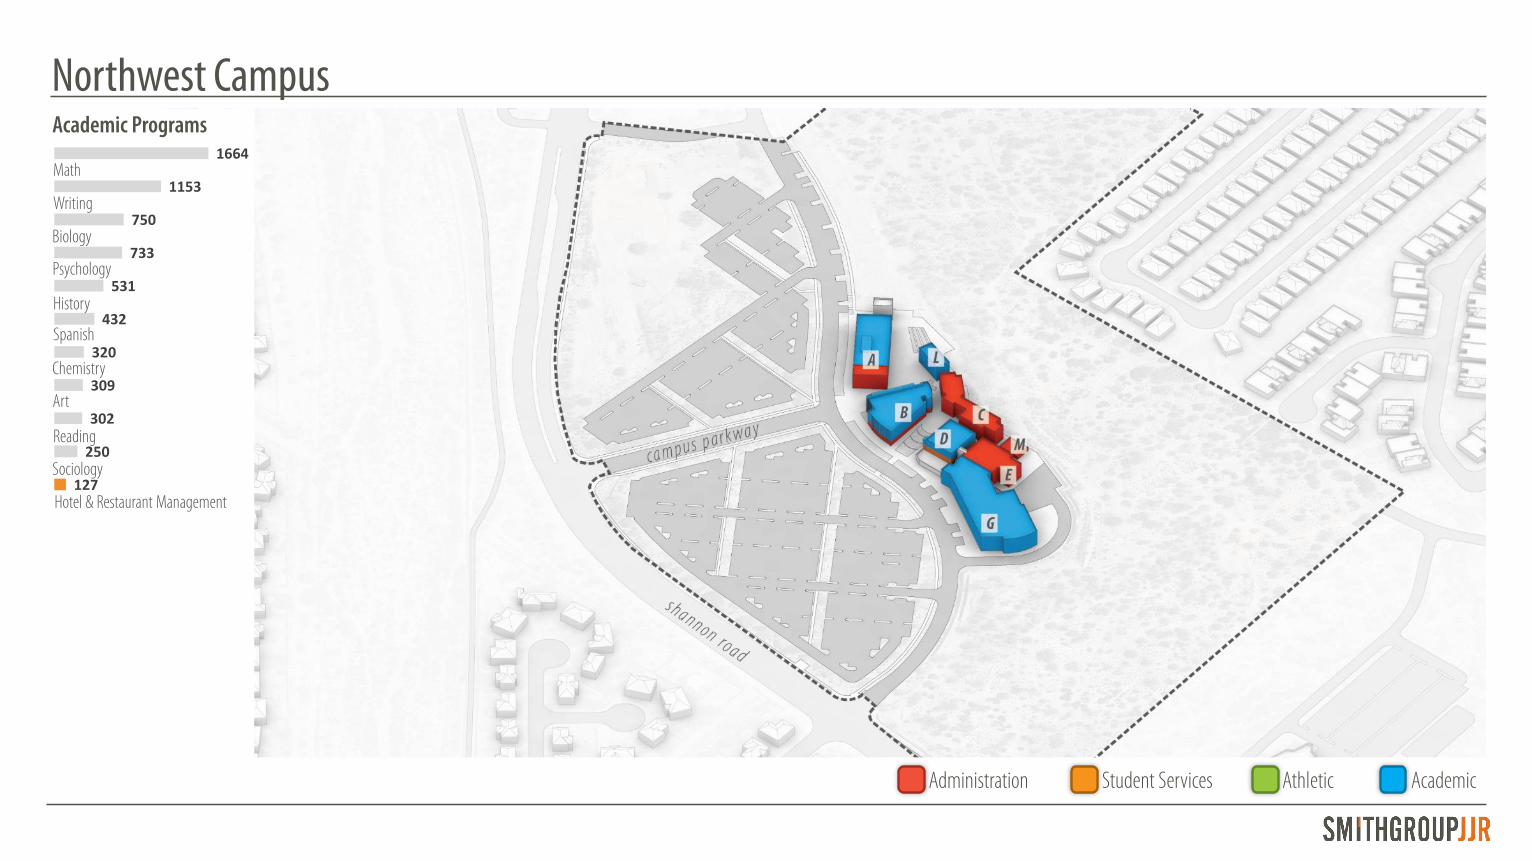
Northwest Campus
127
250
302
309
320
432
531
733
750
1153
1664
Sociology
Reading
Art
Chemistry
Spanish
History
Psychology
Biology
Writing
Math
Hotel & Restaurant Management
Administration Student Services Athletic Academic
Academic Programs
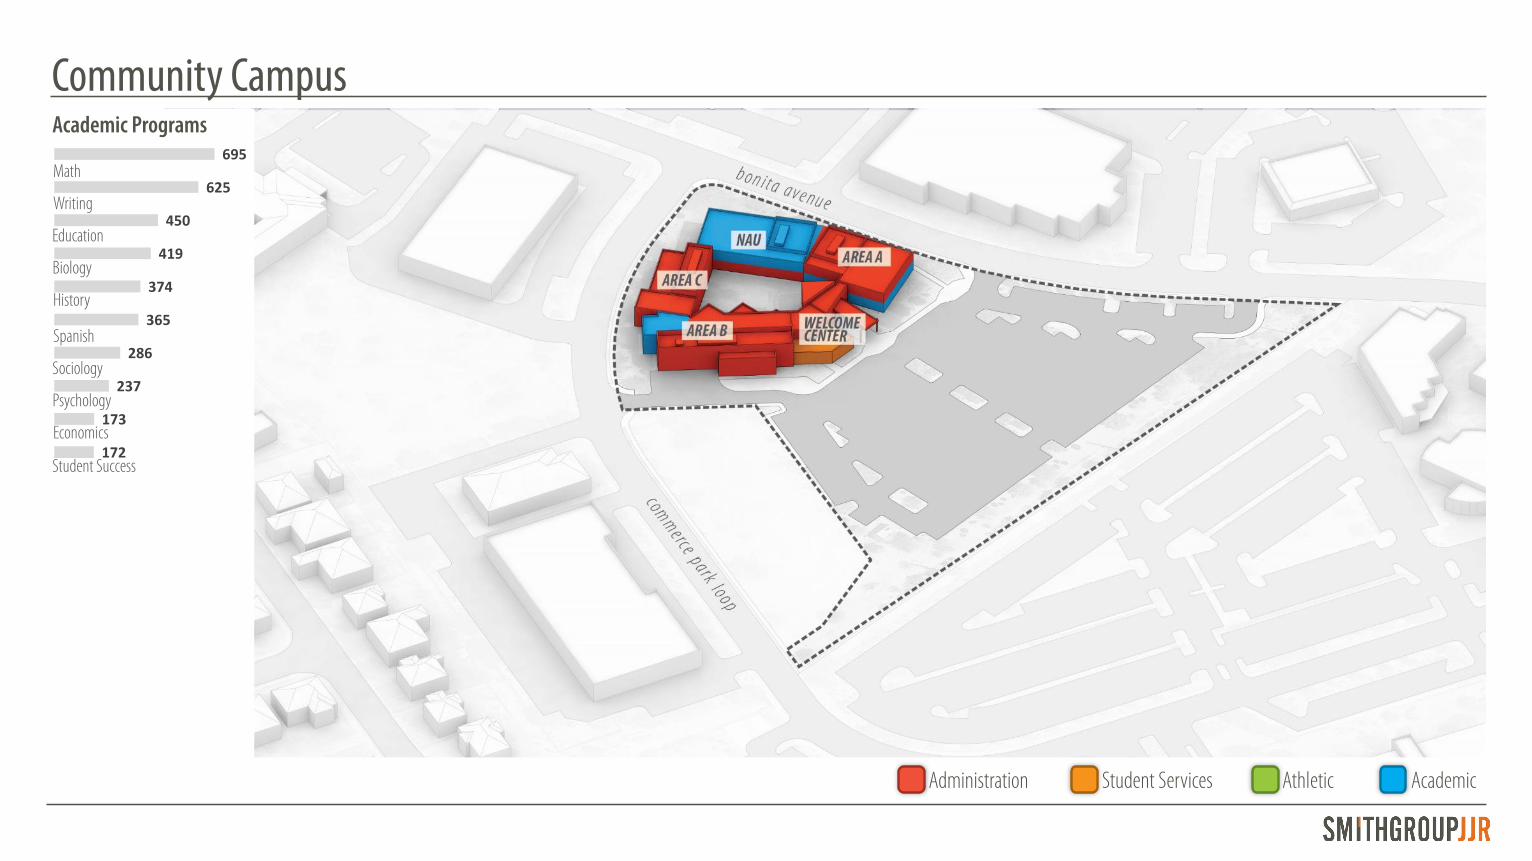
Community Campus
172
173
237
286
365
374
419
450
625
695
Student Success
Economics
Psychology
Sociology
Spanish
History
Biology
Education
Writing
Math
Administration Student Services Athletic Academic
Academic Programs
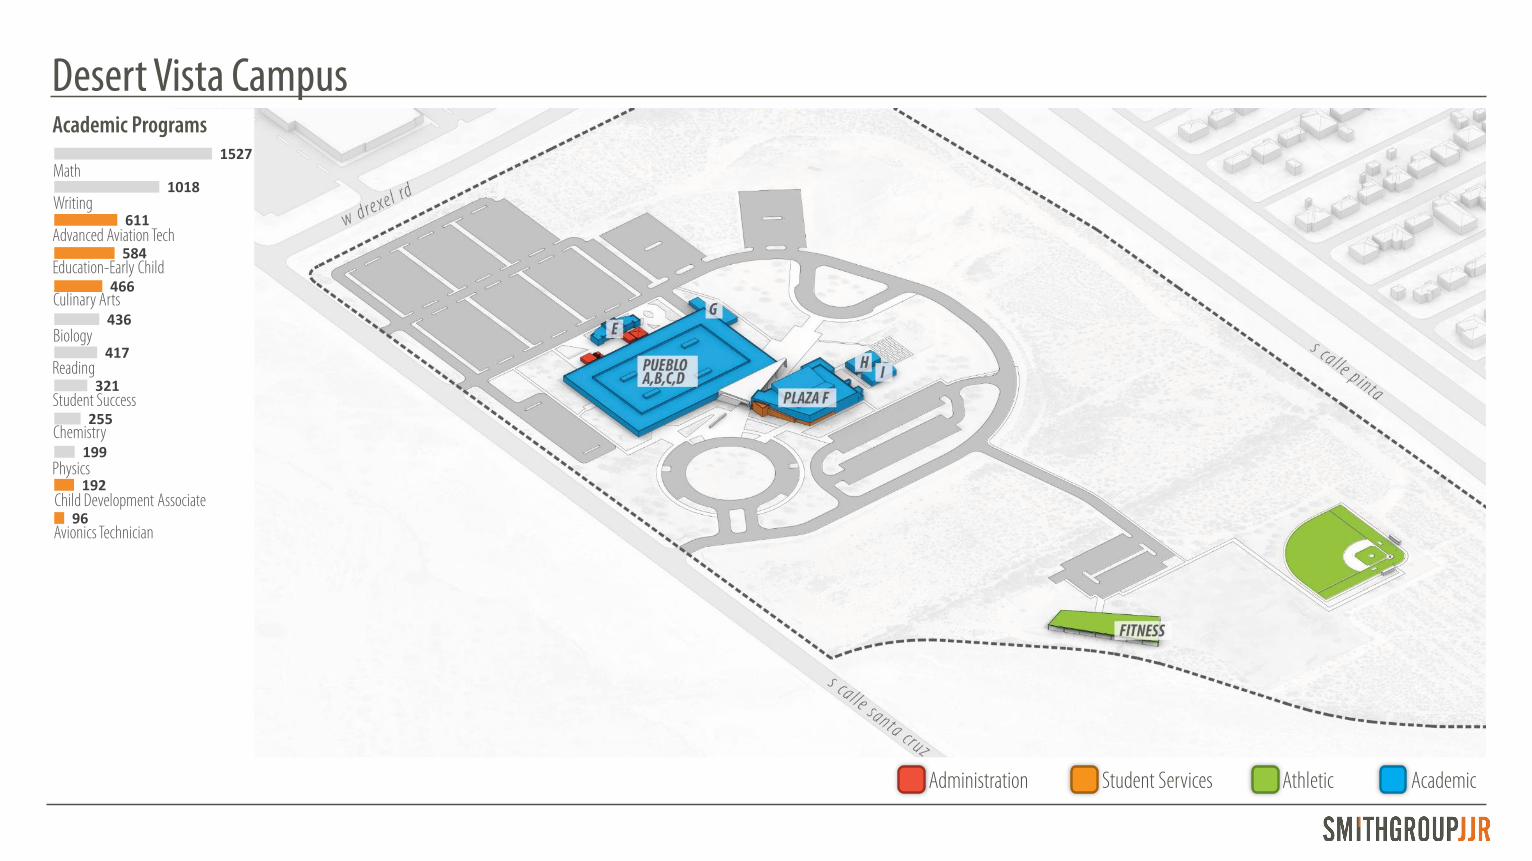
Desert Vista Campus
96
192
199
255
321
417
436
466
584
611
1018
1527
Physics
Chemistry
Student Success
Reading
Biology
Culinary Arts
Education-Early Child
Advanced Aviation Tech
Writing
Math
Avionics Technician
Child Development Associate
Administration Student Services Athletic Academic
Academic Programs
Utilization Findings
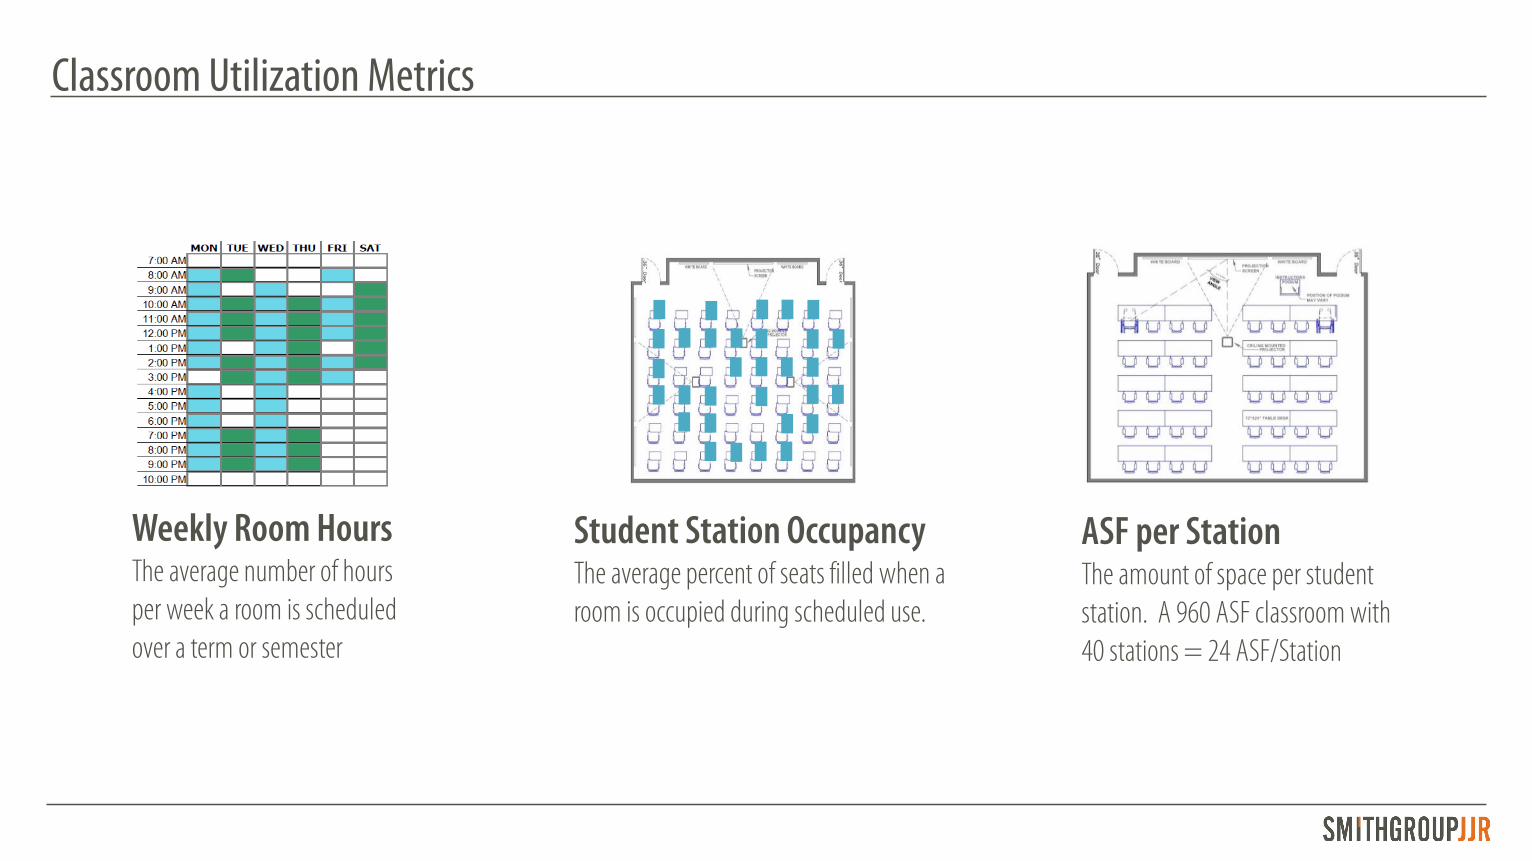
Classroom Utilization Metrics
Weekly Room HoursThe average number of hours per week a room is scheduled over a term or semester
Student Station OccupancyThe average percent of seats filled when a room is occupied during scheduled use.
ASF per StationThe amount of space per student station. A 960 ASF classroom with 40 stations = 24 ASF/Station
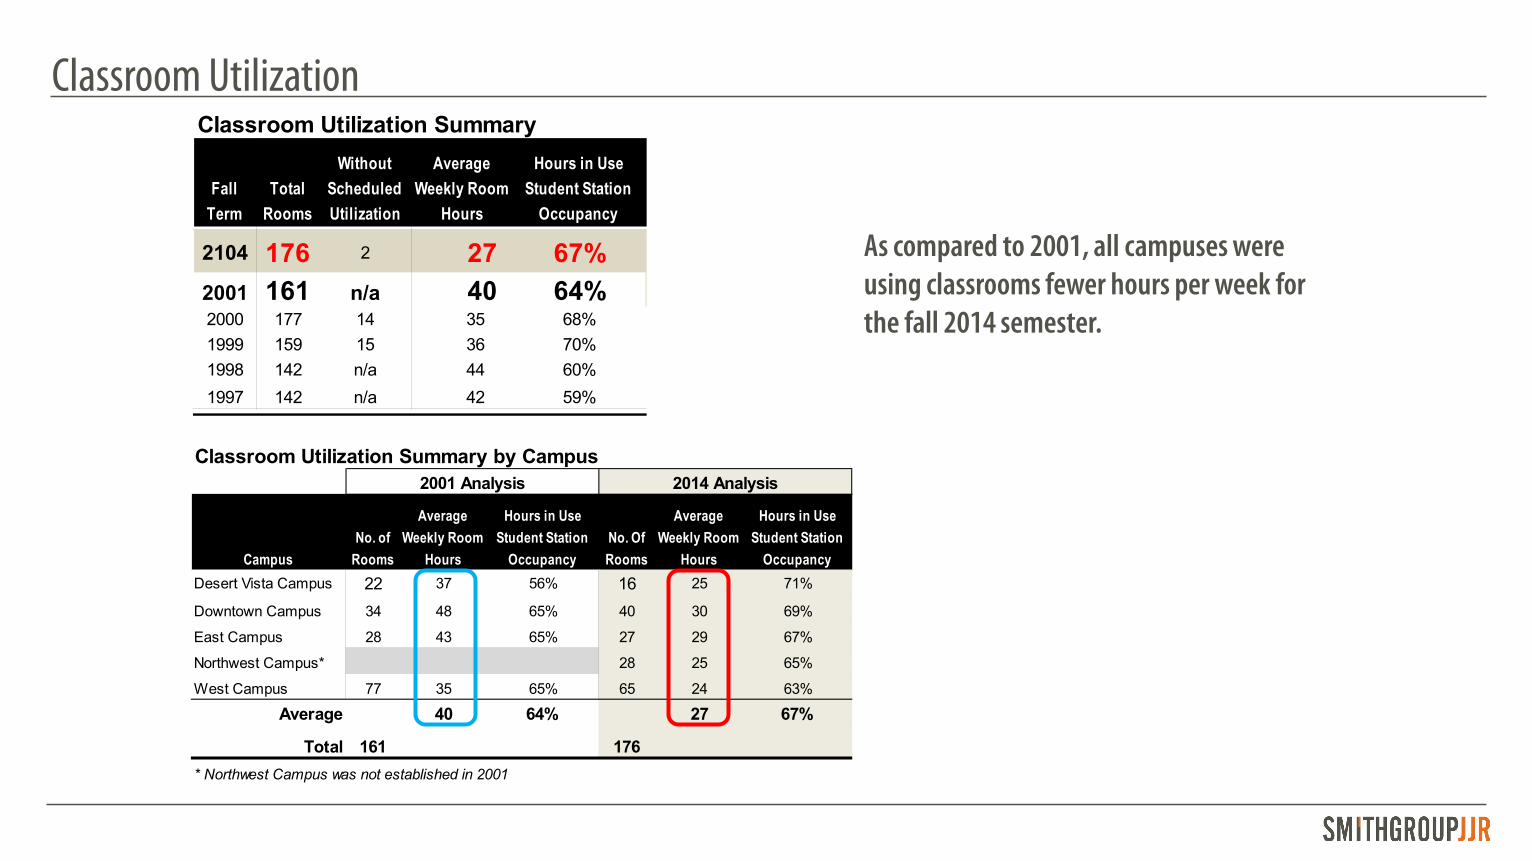
Classroom Utilization
As compared to 2001, all campuses were using classrooms fewer hours per week for the fall 2014 semester.
Classroom Utilization Summary
Fall Term
Total Rooms
Without Scheduled Utilization
Average Weekly Room
Hours
Hours in Use Student Station
Occupancy
2104 176 2 27 67%2001 161 n/a 40 64%2000 177 14 35 68%1999 159 15 36 70%1998 142 n/a 44 60%1997 142 n/a 42 59%
Classroom Utilization Summary by Campus
CampusNo. of
Rooms
Average Weekly Room
Hours
Hours in Use Student Station
OccupancyNo. Of Rooms
Average Weekly Room
Hours
Hours in Use Student Station
OccupancyDesert Vista Campus 22 37 56% 16 25 71%
Downtown Campus 34 48 65% 40 30 69%
East Campus 28 43 65% 27 29 67%
Northwest Campus* 28 25 65%
West Campus 77 35 65% 65 24 63%
Average 40 64% 27 67%
Total 161 176* Northwest Campus was not established in 2001
2001 Analysis 2014 Analysis
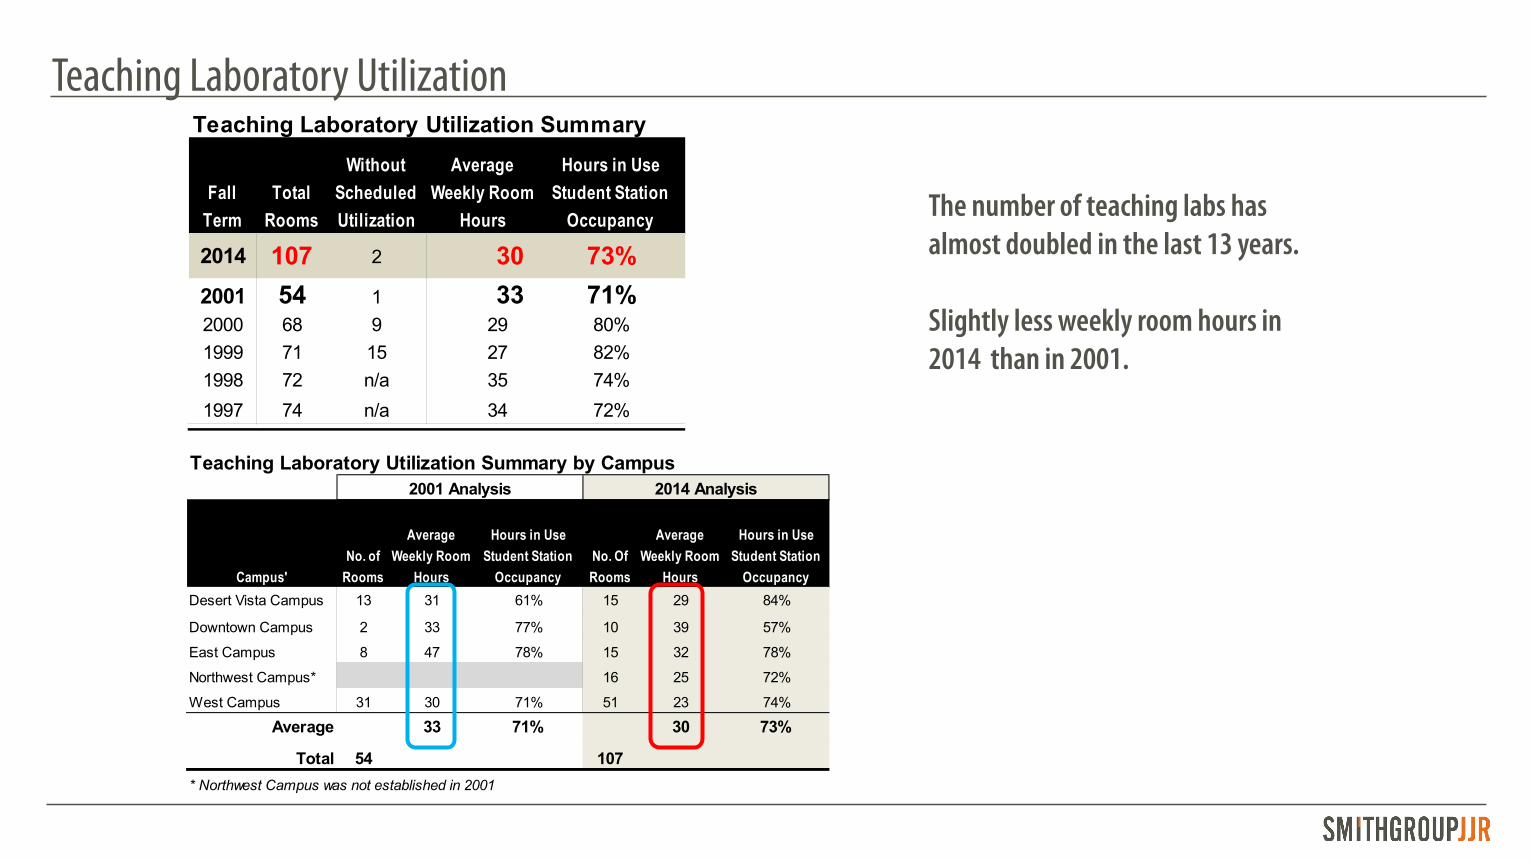
Teaching Laboratory Utilization
The number of teaching labs has almost doubled in the last 13 years.
Slightly less weekly room hours in 2014 than in 2001.
Teaching Laboratory Utilization Summary
Fall Term
Total Rooms
Without Scheduled Utilization
Average Weekly Room
Hours
Hours in Use Student Station
Occupancy
2014 107 2 30 73%2001 54 1 33 71%2000 68 9 29 80%1999 71 15 27 82%1998 72 n/a 35 74%1997 74 n/a 34 72%
Teaching Laboratory Utilization Summary by Campus
Campus'No. of
Rooms
Average Weekly Room
Hours
Hours in Use Student Station
OccupancyNo. Of Rooms
Average Weekly Room
Hours
Hours in Use Student Station
OccupancyDesert Vista Campus 13 31 61% 15 29 84%
Downtown Campus 2 33 77% 10 39 57%
East Campus 8 47 78% 15 32 78%
Northwest Campus* 16 25 72%
West Campus 31 30 71% 51 23 74%
Average 33 71% 30 73%
Total 54 107* Northwest Campus was not established in 2001
2001 Analysis 2014 Analysis
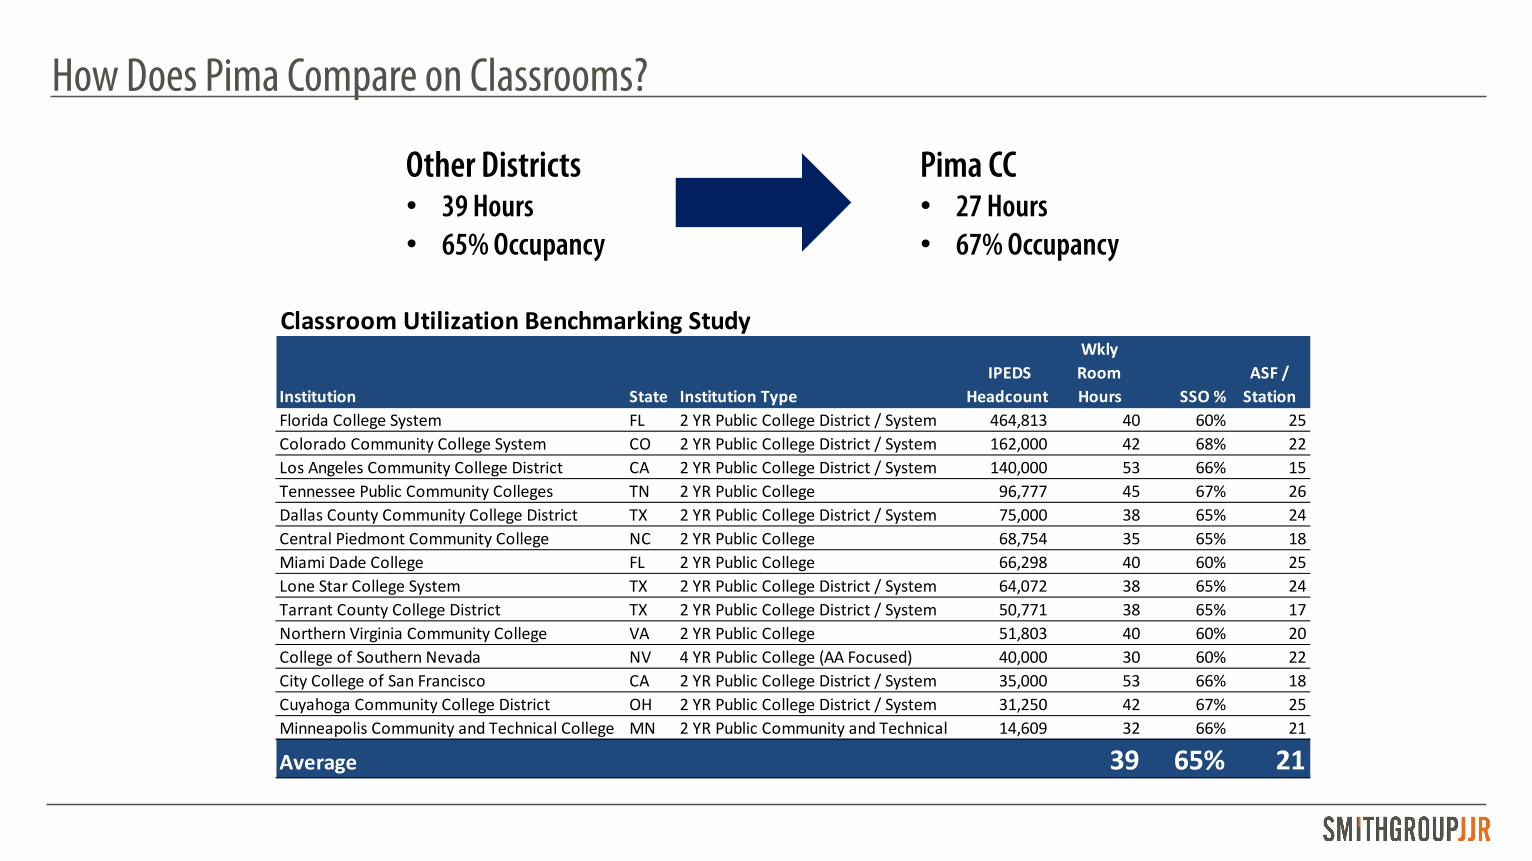
How Does Pima Compare on Classrooms?
Classroom Utilization Benchmarking Study
Institution State Institution Type IPEDS
Headcount
Wkly Room Hours SSO %
ASF / Station
Florida College System FL 2 YR Public College District / System 464,813 40 60% 25Colorado Community College System CO 2 YR Public College District / System 162,000 42 68% 22Los Angeles Community College District CA 2 YR Public College District / System 140,000 53 66% 15Tennessee Public Community Colleges TN 2 YR Public College 96,777 45 67% 26Dallas County Community College District TX 2 YR Public College District / System 75,000 38 65% 24Central Piedmont Community College NC 2 YR Public College 68,754 35 65% 18Miami Dade College FL 2 YR Public College 66,298 40 60% 25Lone Star College System TX 2 YR Public College District / System 64,072 38 65% 24Tarrant County College District TX 2 YR Public College District / System 50,771 38 65% 17Northern Virginia Community College VA 2 YR Public College 51,803 40 60% 20College of Southern Nevada NV 4 YR Public College (AA Focused) 40,000 30 60% 22City College of San Francisco CA 2 YR Public College District / System 35,000 53 66% 18Cuyahoga Community College District OH 2 YR Public College District / System 31,250 42 67% 25Minneapolis Community and Technical College MN 2 YR Public Community and Technical 14,609 32 66% 21
Average 39 65% 21
Other Districts• 39 Hours• 65% Occupancy
Pima CC• 27 Hours• 67% Occupancy
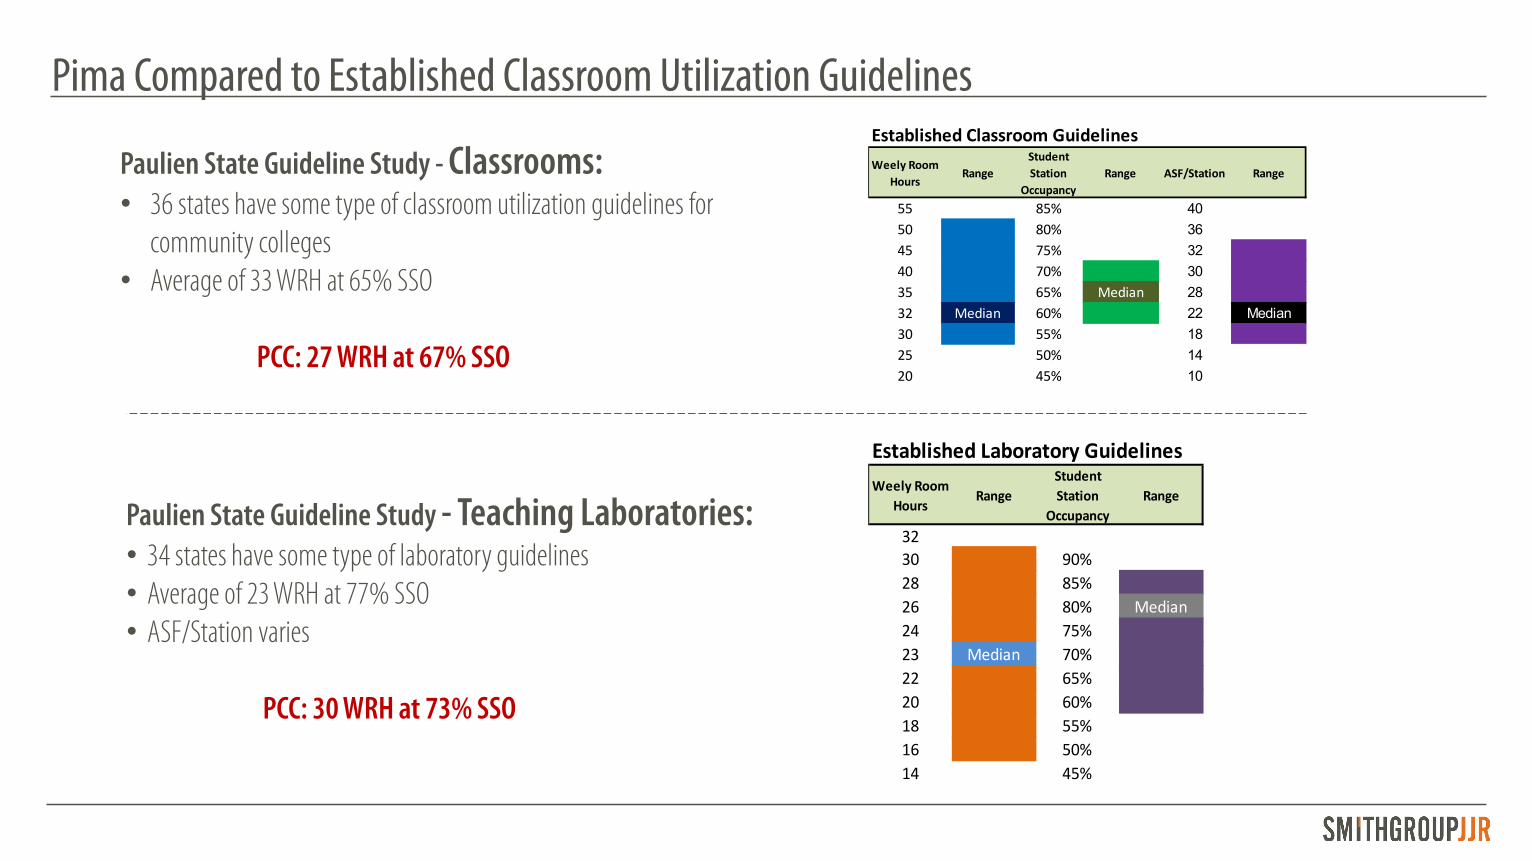
Pima Compared to Established Classroom Utilization Guidelines
Paulien State Guideline Study - Classrooms:• 36 states have some type of classroom utilization guidelines for
community colleges• Average of 33 WRH at 65% SSO
PCC: 27 WRH at 67% SSO
Paulien State Guideline Study - Teaching Laboratories:• 34 states have some type of laboratory guidelines• Average of 23 WRH at 77% SSO• ASF/Station varies
PCC: 30 WRH at 73% SSO
Established Classroom GuidelinesWeely Room
HoursRange
Student Station
OccupancyRange ASF/Station Range
55 85% 4050 80% 3645 75% 3240 70% 3035 65% Median 2832 Median 60% 22 Median30 55% 1825 50% 1420 45% 10
Established Laboratory GuidelinesWeely Room
HoursRange
Student Station
OccupancyRange
3230 90%28 85%26 80% Median24 75%23 Median 70%22 65%20 60%18 55%16 50%14 45%
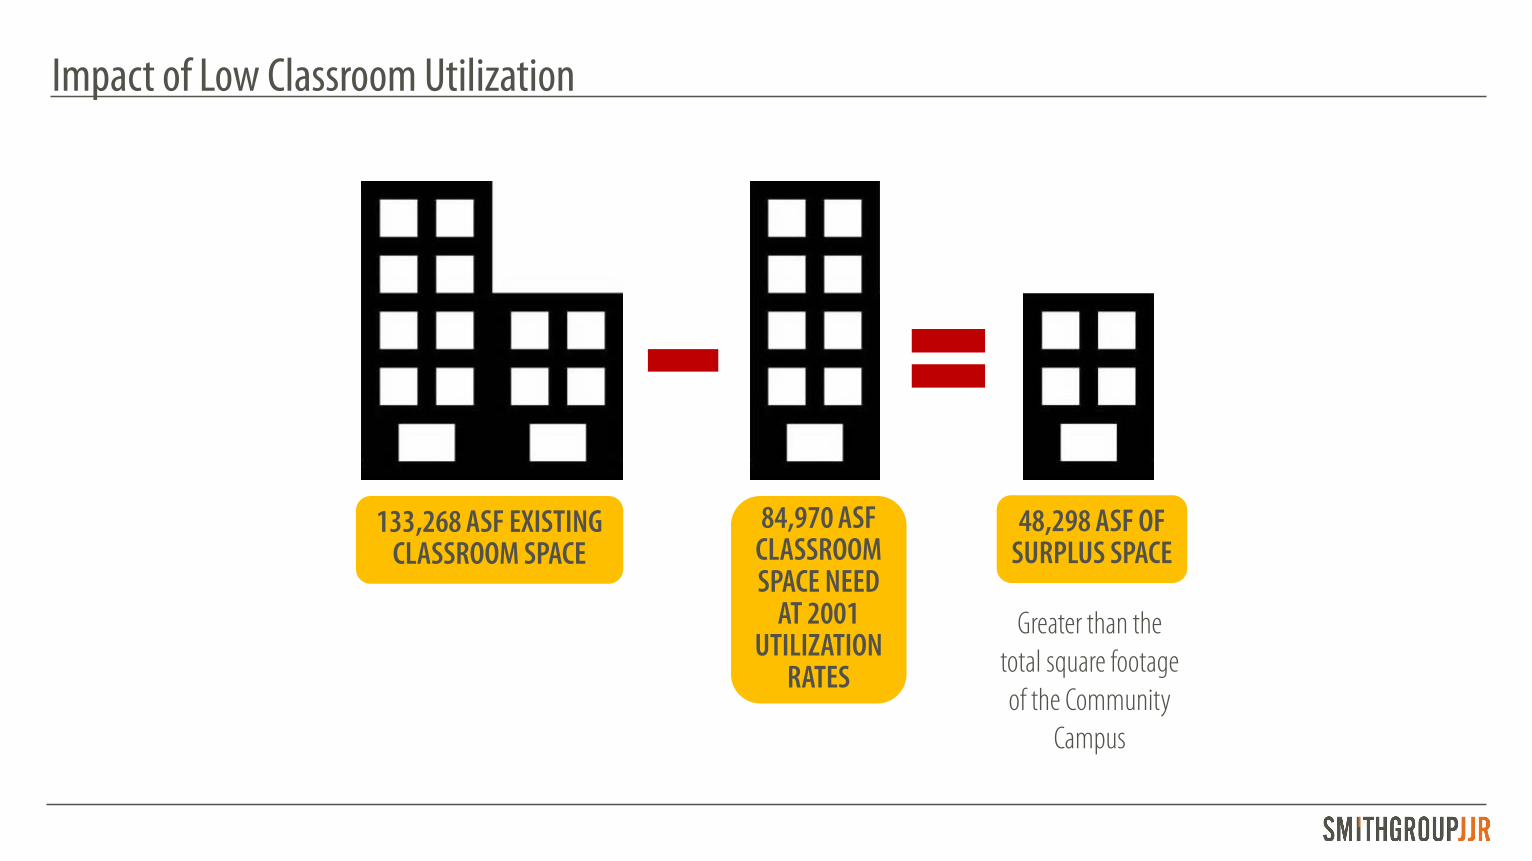
Impact of Low Classroom Utilization
133,268 ASF EXISTING CLASSROOM SPACE
84,970 ASF CLASSROOM SPACE NEED
AT 2001 UTILIZATION
RATES
48,298 ASF OF SURPLUS SPACE
Greater than the total square footage of the Community
Campus
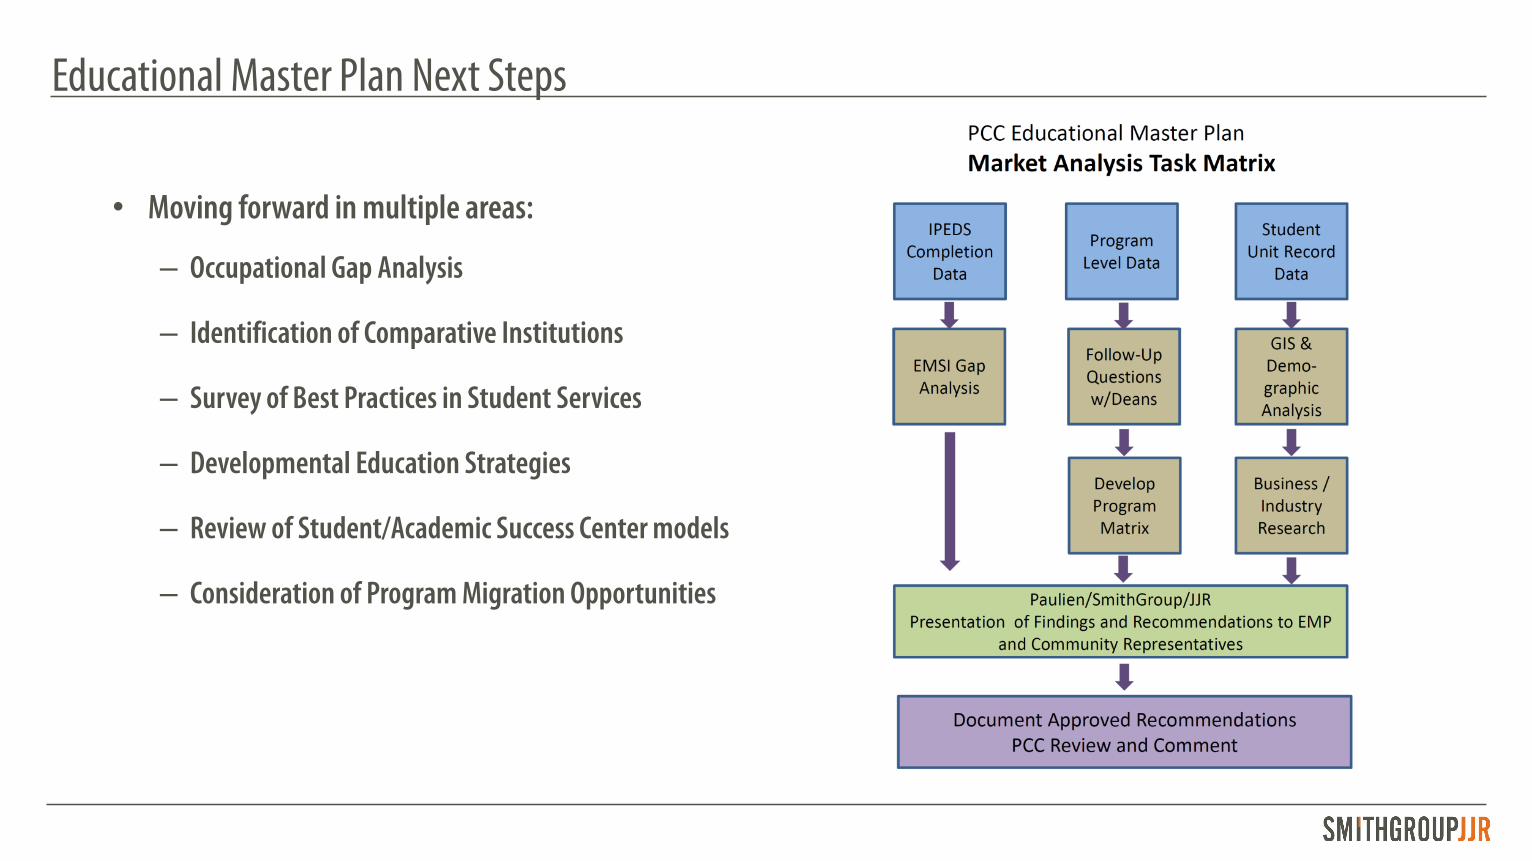
Educational Master Plan Next Steps
• Moving forward in multiple areas:
– Occupational Gap Analysis
– Identification of Comparative Institutions
– Survey of Best Practices in Student Services
– Developmental Education Strategies
– Review of Student/Academic Success Center models
– Consideration of Program Migration Opportunities

Discussion


