Page 1
1
Facility and Database Design
for the Research Development Center
By
Nicholas J. Mehas
A Senior Project submitted
in partial fulfillment
Of the requirements for the degree of
Bachelor of Science in Industrial Engineering
California Polytechnic State University
San Luis Obispo
Graded by:__________________________ Date of Submission:______________________
Checked by:__________________________ Approved by:__________________________
Page 2
i
Abstract
The purpose of this project is to create a new facility and database design to replace the current
Research Development Center located on the campus of California Polytechnic State University
San Luis Obispo and the database in use at the facility. Currently the Research Development
Center is a condemned building and the database lacks up-to-date technology. The project will
develop new designs for both, based on concurrent engineering. The outcome of the project
will be a new design for a new building that increases capacity and capability; a new database
design that integrates newer technologies and methods for tracking tools.
Page 3
ii
Table of Contents Abstract .......................................................................................................................................................... i
Table of Contents ...................................................................................................................................... ii
Table of Figures & Tables ......................................................................................................................... iii
Introduction .................................................................................................................................................. 4
Background ................................................................................................................................................... 5
Literature Review .......................................................................................................................................... 7
Database Management/ Tool Management/ RFID Systems .................................................................... 7
Human Factors/ OSHA .............................................................................................................................. 9
Facilities .................................................................................................................................................. 13
Engineering Economics ........................................................................................................................... 15
Design .......................................................................................................................................................... 18
Database ................................................................................................................................................. 18
Defining Requirements ....................................................................................................................... 18
Constraints .......................................................................................................................................... 21
User Specifications .............................................................................................................................. 21
Facility ..................................................................................................................................................... 23
Defining Requirements ....................................................................................................................... 23
Constraints .......................................................................................................................................... 30
User Specifications .............................................................................................................................. 30
Economic Analysis ................................................................................................................................... 31
Methods ...................................................................................................................................................... 34
Database Design...................................................................................................................................... 34
Facility Design ......................................................................................................................................... 35
Economic Analysis ................................................................................................................................... 35
Results ......................................................................................................................................................... 37
Database ................................................................................................................................................. 37
Facility ..................................................................................................................................................... 41
Layout .................................................................................................................................................. 41
Economic Analysis ................................................................................................................................... 48
Conclusion ................................................................................................................................................... 51
Page 4
iii
Works Cited ................................................................................................................................................. 53
Appendix A (Figures) ................................................................................................................................... 55
Appendix B (Tables) .................................................................................................................................... 67
Appendix C (Equations) ............................................................................................................................... 79
Table of Figures & Tables Figure 1: Magnetic strip card reader .......................................................................................................... 19
Figure 2: Student Profile showing the tool history for the selected student ............................................. 20
Figure 3: Tool Maintenance Menu in the proposed database The Machine Maintenance Menu is
identical in functionality and design. .......................................................................................................... 21
Figure 4: Weight/ Importance of the functional and user requirements for the new database ............... 22
Figure 5: Current database main menu ...................................................................................................... 23
Figure 6: Current Layout of the Facility ...................................................................................................... 24
Figure 7: Female restroom layout for the first floor ................................................................................... 28
Figure 8: QFD, Weight/ Importance of Functional Requirements .............................................................. 31
Figure 9: Final Design Layout (1st Floor) ..................................................................................................... 42
Figure 10: Final Design Layout (Outside/Club Area) ................................................................................... 44
Figure 11: Final Design Layout (2nd Floor) ................................................................................................. 45
Figure 12: Trend/Regression Analysis for Donations .................................................................................. 49
Table 1: Sample Comparison of sign-in times ............................................................................................. 19
Table 2: Current Total Area & Area Description ......................................................................................... 24
Table 3: Length to Exit for each area (Floor 1) ............................................................................................ 26
Table 4: First floor female restroom specifications .................................................................................... 27
Table 5: Calculation to determine the number of luminaries to properly laminate the weld area ........... 29
Table 6: Seasonal Index to determine forecast for donations (x $1,000) ................................................... 32
Table 7: Percentage Allocated based on the forecasted value for 2010 .................................................... 33
Table 8: Bonderson Project Center Cost Per. Square Foot ......................................................................... 36
Table 9: Number of Luminaries per each area (1st Floor) ........................................................................... 43
Table 10: Number of Luminaries per each area (Outside Area) ................................................................. 44
Table 11: Number of Luminaries per each area (2nd Floor) ........................................................................ 46
Table 12: Number of Luminaries per each area (Utility) ............................................................................ 47
Table 13: Number of Luminaries per each area (Aisles) ............................................................................. 47
Table 14: Estimated cost of the proposed facility based on the Bonderson Center .................................. 48
Page 5
4
Introduction The of objective of this project was to construct a new Student Projects Shop (The
Hangar) for the College of Engineering at the California State University San Luis Obispo. The
new facility includes a new database system for students, faculty, machines, and tools. Overall
the improvements allow for more students and clubs to construct projects simultaneously
because of the increase in the facility space. Currently the Student Projects Shop’s capacity is 50
people maximum; the facility cannot be expanded because it has been condemned due to
asbestos in the insulation and lead paint. The College of Engineering (CENG) has over 5,000
students enrolled all of whom may need to utilize The Hangar. The use of facility planning
philosophies and techniques allowed for the current Student Projects Shop to be replaced by a
new more spacious multilevel and multifunctional shop.
Another area of improvement is the current process of student check-in and tool check-
out. The process requires a technician to sign the student in and gold coins are used to check-
out tools. The process is inefficient and it has been reported that the gold coins are constantly
being replaced. Implementing a database system that uses a magnetic strip card reader
increased the efficiency of the Check-in and eliminated the coin check-out process. The use of
cost estimation helped determine amount of funding that was necessary for the construction of
the new facility. The use of time studies and work sampling determined the correct machine
layout and what machines are used most frequently. The combination of work measurement
and human factors allowed for a new floor layout that provides the most efficient shop.
Page 6
5
Background
The Mechanical Engineering department at Cal Poly San Luis Obispo provides students
with a Student Projects Shop (The Hangar) located in the Research Development Center
(building four). The Project Shop allows students to follow the University’s credo “Learn by
Doing” empowering students with an assortment of manufacturing equipment. The assortment
of equipment range from simple power drills to very complex Computer Numerical Controlled
(CNC) Mills. Students are allowed to explore the various aspects of the manufacturing and
fabricating processes step-by-step. The shop is utilized by students who need to produce class
projects, clubs who compete in regional and national competitions, and students working on
senior projects. Project variability is not limited due to the wide range of equipment found in
the sub-shops: wood shop, sheet metal shop, machine shop, welding shop, and miscellaneous
hand tool shop (Cal Poly State University, Student Projects Machine Shop in the Hangar).
The Student Projects Shop provides student with all the tools necessary to create
projects, and the knowledge to make the “The Hangar” a safe environment. Technicians are
employed to help and guide students with questions and ensure a safe environment. The shop
is open to all students, regardless of skills, abilities or majors (Cal Poly State University, Student
Projects Machine Shop in the Hangar). To ensure safe procedure is practiced, each student who
utilizes the Hangar must complete a tour and safety test. The standard introduction to the
Hangar is the Red Tag which allows access too many stationary and hand tools, but does not
include the machining or welding tools. The Yellow Tag is the upper level in which students
Page 7
6
have access to machining and welding tools (Cal Poly State University, Student Projects
Machine Shop in the Hangar). In the next section, many Industrial Engineering topics are
discussed and provided the tools and foundation for the design of the new database system
and facility layout.
Page 8
7
Literature Review
Database Management/ Tool Management/ RFID Systems
Accurate, exact, visible, real-time, and transparent information is extremely important
to management for internal business tracking. There are also limitations when information is
transferred between maintenance workers and central facility management. This results in
lower data quality, longer service times and delays in operations and maintenance problems
(Ergen, Esin 2007). There are three methods for tracking company’s assets: paper and pencil,
bar codes which consist of printed paper or plastic labels, and Radio Frequency Identification
(RFID). Bar codes require a beam of light to read the labels, which limit the use to clean
environments and distance. RFID is a contactless identification that allows management to
track raw materials, parts, products, and tools (Shouqin Zhou 2007). RFID systems consist of
two components: the transponder and the reader. The transponder is located on the object
that the company wishes to track and the reader, usually a read or read/write device, is in
possession of the company. The transponder is made up of a coupling element and an
electronic microchip and remains passive (does not have own voltage supply) until activated by
the reader (Shouqin Zhou 2007). There are transponders that are active and designed to
operate at longer ranges and have larger memory, however the limitations is that the battery
life is limited (Ergen, Esin 2007). The microchip is no larger than the tip of #2 pencil, which
allows companies to place these chips in almost any product or material they wish to track
(Miller, Joseph 2007). As the transponder comes into range of the reader the power is supplied
through the coupler and a pulse is sent to the reader and the data is collected (Shouqin Zhou
2007). The reader constantly sends out a signal at a certain frequency and the transponder is
tuned to the same frequency, frequencies are either high frequency or ultra high frequency:
Page 9
8
13.56 MHz or 902-928 MHz (Miller, Joseph 2007). This technology will allow for smoother and
transparent data collection.
RFID can be used for Record and Information Management (RIM) processes which are
considered closed-loop systems: data that is collected by the RFID system circulates within the
organization (Miller, Joseph 2007). According to the article by Miller, Fullbright & Jaworski LLP,
one of the world’s largest law firms concluded a two year trial study using RFID. The law firm,
that adds more than 1,000 new files a year, reported an increase in speed and effectiveness
when locating files (Miller, Joseph 2007). Another law firm, Fish and Richardson, implemented
RFID in its patent and trademark file department, averages 4,700 applications a year, and
realized a 60 percent increase in accuracy, while saving $144,000 (Miller, Joseph 2007). RFID
can be used to improve the reliability of scheduled maintenance. As opposed to manually
entering data into the maintenance log, the data is digitally transferred to the log avoiding
human error (Ergen, Esin 2007). Maintenance workers can easily access previous records faster
and do not have to search through file cabinets to find records.
Radio frequency identification provides a great resource for companies to track
materials and product, but there are several things to consider before implementation of the
RFID system. The environment in which RFID is going to be implemented should be considered.
The environment needs to be controlled. Implementing RFID in an uncontrolled environment
allows for too many exceptions, a definite check-out location may not be realistic, and the
possibility of the RFID transponders being removed or damaged increases (Miller, Joseph 2007).
Second, noise interference can cause a problem with the RFID system especially in
environments that have high concentrations of wireless communications (Miller, Joseph 2007).
Page 10
9
Third is the surrounding material which can have an effect on performance. Evaluating the cost
of the system is the next criteria before implementing RFID. The equipment has standard
pricing on most of the basic hardware, but the transponders vary in price. But, the ROI should
be considered because the average saving each year may be worth the initial cost (Miller,
Joseph 2007). Evaluating compliance, making sure the RFID system is operating with the
Federal Communications Commission (FCC) bandwidth regulations is important. Evaluating
Interface Capability, the system should be able to interface with the database system currently
in use by the company; otherwise a middleware solution may be applicable (Miller, Joseph
2007). The last consideration, evaluating scalability, is important because as technology
changes older RFID systems may become obsolete and newer technologies may become less
expensive. A pilot test of the RFID should be implemented and if successful, implemented
across the company (Miller, Joseph 2007).
Human Factors/ OSHA
Safety and accident prevention is a major issue in the workplace especially machine
shops. Every year $50 billion is awarded for workplace injuries and deaths (Wickens, 2004). The
major causes for injuries or deaths are: over exertion, impact accidents, falls, motor vehicles,
falls, fire, drowning, explosion, poison and electrical hazards (Wickens, 2004). Two government
organizations that are involved with safety are: the Occupational Safety and Health
Administration (OSHA) and National Institute for Occupational Safety and Health (NIOSH). OSHA
implements safety programs, sets and revokes health and safety standards, conducts
inspections, investigates problems, monitors illness and injuries. NIOSH performs research and
Page 11
10
educational functions and conducts reviews research to identify hazardous types of conditions
(Wickens, 2004).
There are many factors that contribute to accidents in the workplace. First, the system
approach assumes that accidents occur because of interaction between system components
(Wickens, 2004). The social norm, for example, doesn’t bother with this protective equipment.
Personal Characteristics such as age and gender and job experience have an effect on accidents.
Younger people have more accidents and young males have greater number of accidents
(Wickens, 2004). The number of accident occurrences increase for the elderly. Newer
employees are susceptible to accidents: 70% of accidents occur in the first three years of
employment (Wickens, 2004). Even though newer employees have finished their training and
do not require additional supervision, they still lack the experience that comes with years of
work (Wickens, 2004). Stress, fatigue, drugs and alcohol also contribute accidents in the
workplace.
Most of the hazards are localized in the tools or equipment used by the employee.
Poorly designed controls and displays increase the chances of operator error (Wickens, 2004).
Electrical hazards present a major problem because of the possibility of electric shock: sudden
and accidental stimulation of the body’s nervous system by an electrical current (Wickens,
2004). Alternating current (AC) is more dangerous than direct current (DC) (Wickens, 2004).
Mechanical hazards present a problem as well. Sharp edges of machines or saw blades can
cause cutting or tearing of skin, muscle, or bone (Wickens, 2004). Machine Presses can cause
crushing, some body part is caught between two solid objects, resulting in breaking: crushing
causes the bones to break (Wickens, 2004). Workers can overexert themselves resulting in
Page 12
11
strained muscles. The presence pressure and toxic substance hazards are extremely dangerous
to workers: asphyxiants, irritants, systemic poisons, and carcinogens (Wickens, 2004).
The actual physical environment of the work area might provide an accident prone
environment. The first issue is the illumination of the area. The area should include direct or
indirect glare and light/dark adaptation (Wickens, 2004). Noise and vibration can cause workers
not to hear or feel emergency alarms or indicators. Temperature and humidity is another
element that affects workplace safety. The workplace can be either too hot or too cold and
could pose serious safety hazards impacting body health either directly or indirectly (Wickens,
2004).Protective clothing guard operator from these hazards. Fire hazards can be avoided with
frequent disposal of air tight containers can help prevent spontaneous combustion and placing
ignition sources in a secure location (Wickens, 2004). Exits and emergency evacuation
procedures should be designed for crowd panic, electric power failure, and potential presence,
height, and number of stories (Wickens, 2004).
Another contributor to accident occurrences is the social environment. Social norms
refer to the attitudes and behavior of an employee’s peers (Wickens, 2004). Employees are
extremely susceptible to social norms and likely to engage in unsafe and safe behaviors to the
extent that others around them do (Wickens, 2004). Poor human factors design of the
interface, inappropriate sleep schedules and fatigue, poor training or job support, poor
maintenance, management attitudes and poor work climate are all contributors to accidents
(Wickens, 2004).
It is extremely important to look for every possible hazard that occur in every step; all
environmental conditions and foreseeable equipment usage (Wickens, 2004). Failure Modes
Page 13
12
and Effects Critically Analysis (FMECA) focuses on hazards associated with physical components
(Wickens, 2004). FMECA identifies the different ways that things could break down or function
incorrectly: failure modes (Wickens, 2004). They also study the human system or operator
performance. At the end of the analysis a score is given representing the hazard critically of the
effect (Wickens, 2004). Fault tree analysis works from the top from an incident or undesirable
event down to possible causes. Single point failures are more likely to occur than combinations
of conditions or events (Wickens, 2004).
Safety management is a key component in preventing accidents in the workplace.
Implementing safety programs help the companies identify the risks and measure program
effectiveness. Companies are able to identify the risks: struck by, body mechanics,
laceration/cut/tear/puncture, contact with temperature extremes, fall/slip/trip, caught-in-
between, struck against, and eye (Wickens, 2004). When implementing new safety programs it
is important that management is involved. The programs should include both accident and
incident investigations; recommendations for equipment, environment, and job changes; safety
rules and personal protective equipment; employee training and safety promotion including
feedback and incentives for employees who practice safe procedures (Wickens, 2004).
Visual aids are important tools for helping establish a safe environment. The use of
written warning and warning labels help prevent accidents from occurring. A signal word
conveying the seriousness of machine or procedure, such as “Danger”, “Warning”, or “Caution”
helps establish safety (Wickens, 2004). There should also be a description of both the hazard
and the consequences that are associated with the hazard; rules of the correct behavior
needed to avoid the hazard (Wickens, 2004). Danger: immediate hazard that would likely result
Page 14
13
in severe injury or death. Warning: could result in personal injury or death; Caution: unsafe
practices that could result in minor personal injury or property damage (Wickens, 2004).
Facilities
The purpose of any engineering lab or facility is to provide useful and practical
knowledge to the students and to establish laboratories for undergraduate and postgraduate
studies (Khan, Wasim Ahmed 2002). The facility should be set up and equipped for at least the
most basic principles of engineering and have individual areas for specific subject areas (Khan,
Wasim Ahmed 2002). Planning a facilities layout is key component to the development of a
multipurpose laboratory. There are two types of layout methodologies: Functional Systems and
Cellular systems. Functional systems consist of multiple work stations comprised of similar
equipment, while cellular systems are comprised of equipment from each functional system
(Pitchuka, Leela 2006). Cellular systems or cellular manufacturing consists of grouping machines
into cells with similarities. The benefits that result are reduced set-up time, reduced work-in-
process inventory, reduced throughput time, reduced material handling cost, improved product
quality, and simplified scheduling (Pattanaik, 2008). Cellular layout helps to improve lean
manufacturing; a report by Franklin Corp. stated a 36% increase in labor productivity after
implementing a cellular production layout (Pattanaik 2008). In order to first implement cellular
system the company needs to determine: how many cells there needs to be, what machines
should be included in each cell, how many of each machines should be in each cell, and what
parts each cell should produce (Schaller 2008).
Page 15
14
Heavier equipment, requiring foundation, should be installed around the perimeter of
the laboratory because the equipment may require a high voltage source, water, and air (Khan,
Wasim Ahmed 2002). The location of heavier machines also allows for safer conditions in the
lab because the high voltage power cords will be against the wall and not across the floor. The
placement of the heavier machines on the perimeter allows the inner space of the facility to
house smaller machines and work tables for students (Khan, Wasim Ahmed 2002).
Another key component in ensuring a facility runs smoothly is the maintenance staff.
The staff is responsible for keeping the equipment operational and in good working order
(Khan, Wasim Ahmed 2002). In addition the maintenance crew is responsible for establishing an
operational and fault record log manual, technical library of records, and general information
for reference (Khan, Wasim Ahmed 2002).
There are several tools used in planning a facility: affinity diagram, interrelationship
digraph, the tree diagram, the matrix diagram, contingency diagram, activity network diagram,
and prioritization matrix (Bozer 2003). The affinity diagram organizes verbal ideas gathered in
brain storming sessions; is used to create subject headings. The interrelationship digraph maps
logical links among related items and identifies which items impact others the most. The tree
diagram allows details to be recorded in order to achieve the objective of the process. The
matrix diagram organizes characteristics, functions, and tasks into areas so they can be
compared. Contingency diagrams allow the company to chart events and contingencies that
may occur during the implementation. The prioritization allows for companies to judge the
importance of each criterion (Bozer 2003).
Page 16
15
Engineering Economics
Cost estimation is an important concept for new facility designs and conceptual cost
estimates play a crucial role in initial project decisions, although scope is not finalized and very
limited design information is available during early project stages (Sonmez). Estimating the cost
of construction for new building is important for the decision making of the project. The
reliability of the estimates is influenced by several important factors including: availability of
historical records, the experience of the estimator, and the ability to envision the conditions
under which the project will take place (S.M. AbouRizk). The main problem for cost estimators
is producing a reliable cost estimate for the decision makers of the project.
However, estimation does not have to be made solely at the beginning of the inception
of the project. Cost estimation can be made at different phases of the building process:
inception of the project, preliminary design and detailed design, and completion of the project
(Tas). The use of cost estimation at different stages allows for opportunities for the projects to
be built in compliance with cost objectives previously set (Tas).
Cost estimation during the initial stages of the project helps determine if the cost ranges
that the customer had set are feasible and at this point of the project it is determined if the
project will continue. At this stage, cost estimates are needed by the owner, contractor,
designer, or lending organization for several purposes, including determination of the feasibility
of a project, financial evaluation of a number of alternative projects, or establishment of an
initial budget (Sonmez). If it is determined that the project can continue the cost limit is set and
the customer requirements are outlined in a detailed proposal (Tas). During the preliminary
design phase, a draft cost plan created based on schematic drawings and functional
requirements. The cost estimates that are produced are not expected to be precise because the
Page 17
16
project scope has not been finalized and there is little design information available during the
initial phases of the design (Sonmez). Therefore a quick, inexpensive, and reasonably accurate
estimate is acceptable (Sonmez). The most sensitive cost calculation can be made after the as-
builds are drawn at the completion of the project (Tas).
The data that is being used for cost estimation should be reliable and updated to reflect
current conditions. Several techniques have been used for cost estimation during the initial
concept phase for projects. The most common techniques for estimation include: regression
analysis, simulation, and neural networks (Sonmez). However, using historical data derived
from older projects helps provide feedback for future projects that have similar characteristics,
demands, or requirements (Tas). Updated and reliable database and information systems are
needed to make accurate cost estimation for different phases of the building construction
process (Tas). Cost estimation systems must be simple, reliable, flexible and convenient.
Summary
The new database design incorporated many human factor elements that making the
proposed design more user-friendly and accessible. Human factor concepts were taken into
consideration for the lighting design as well as the location of certain areas: tool crib and the
office. Both were centrally located to minimize the distance traveled to each designated area.
The facility theories and concepts discussed earlier in this chapter were applied to the new
facility design. A functional layout combined with the larger and heavier machines placed on
the outside walls of the facility were several of the concepts that were instituted in the new
design. The use of historical data based on similar buildings, whose functionality was similar to
Page 18
17
the proposed building, located on the campus of Cal Poly San Luis Obispo helped determine
reasonable cost estimates for the new building. These cost estimates are discussed in a later
chapter of this report.
Page 19
18
Design In this chapter all requirements, specifications, and initial conditions are discussed. The
database design and the facility design are discussed separately in this chapter.
Database
Defining Requirements
The current database used at the hangar requires students who are signing-in to hand
over their Cal Poly ID card and then wait for the technician to manually enter the name. The
next step that occurs is the second defining requirement: 5 gold coins system. The system is
used to track what tools each student currently has checked-out and that is where the system
ends. These requirements helped define the structure for a new database.
Student Sign-In Method
In order to upgrade the current sign-in process a new method needed to be developed
that would enable students to sign-in faster, increase accuracy, and record all the information
necessary for record history. The first step involved locating a system that mimicked the same
function performed in the Hangar; that system was located in the Recreation Center (REC) at
Cal Poly. The REC’s system requires a student to simply swipe their Cal Poly ID through a
magnetic strip card reader and they are instantly signed-in. Table 1 below shows the amount of
time it took a student to sign-in at the Hangar compared to REC. The full table can be seen in
Appendix B: Table 15. The magnetic strip reader can also be seen in Figure 1. The next step was
to design a database that integrated the card reader to allow for faster sign-in times at the
Hangar.
Page 20
19
Table 1: Sample Comparison of sign-in times
Trial Hangar Manual
Rec Center Poly Card
1 28 s 2 s
2 37 s 4 s
3 35 s 3 s
4 49 s 2 s
5 10 s 2 s
6 49 s 2 s
7 56 s 5 s
8 25 s 3 s
Figure 1: Magnetic strip card reader
Tool Tracking System
The method of tracking tools currently relies on the accuracy of placing a gold coin at
the location of where the tool is stored. A student is given five coins at the time of sign-in and is
only allowed to check-out tools by sacrificing a coin. The coin is then returned when the student
checks-in the tool; at any given time the student can only have five tools checked-out. Once the
tool is checked-in there is no record of the student ever checking that tool out unless it is
returned broken or it is lost. The new database has a “Student Profile” window that allows the
administration to view all tool and machine check-out history for each student and create
Page 21
20
reports as shown in Figure 2. The administrator selects a name from the “Student list” on the
left and then selects either the machine or tool option located at the bottom; all the student
history appears on the right side of the screen.
Figure 2: Student Profile showing the tool history for the selected student
The second problem with the process is that tools that need to be serviced after a
certain amount usage (i.e. grinding, sanding, or saws) are not serviced until after they returned
and the problem has occurred. Preventative maintenance on hand tools is not performed and
this affects students who need to use these tools, but then cannot because the tool is out of
service. The proposed database provides the technician with a tool and machine maintenance
window that shows what tool(s)/ machine(s) need maintenance. This feature allows for
Page 22
21
preventative maintenance, decreasing the amount of equipment that becomes broken because
of the lack of maintenance.
Figure 3: Tool Maintenance Menu in the proposed database The Machine Maintenance Menu is identical in functionality and design.
Constraints
The constraints, if any, for the implementation of the new database are comprised of
resistance to the new change. The program currently is use is Access, so purchasing a new
program is not necessary. Another constraint is transferring all the current students’ profiles in
to the proposed database and entering every tool and machine into the system.
User Specifications
The first design step taken to create a new database required input from the end users
and their requirements. Interviews were conducted to determine what aspects were wanted
the most in the new database. At the conclusion of the interviews a Quality Function
Page 23
22
Deployment (QFD) chart was completed which guided the design of the new design based on
user and functional requirements: Figure 4 .
Figure 4: Weight/ Importance of the functional and user requirements for the new database
The current database, seen in Figure 5, provided many solutions and user requirements
for the new design. During the interviews the technicians suggested a user interface that was
easy to navigate through with more on screen prompts alerting the user of any problems. After
developing the first version of the database, the new design was presented to the technicians
during a second round of interviews to gather feedback and input. The design incorporated
several requirements and functional requirements that were determined during the first
interviews. After the second set of interviews the Quality Function Deployment (QFD) chart was
updated based on the new information. The final QFD chart is seen in Appendix A: Figure 22.
The QFD allows the designer(s) to focus or put more weight on certain features based on the
customer requirements combined with the functional requirements.
Page 24
23
Figure 5: Current database main menu
Facility
Defining Requirements
The maximum capacity of the current facility is 50 persons and the building cannot be
expanded because the facility is condemned due to the presence of asbestos and lead paint.
The capacity causes an issue because the Hangar’s purpose is to serve not just College of
Engineering Students, but the all students attending Cal Poly. These two defining requirements
led to the design for a new building. The current facility is seen below in Figure 6. The sections
that are highlighted in the yellow are the focus for the new facility design.
Page 25
24
Figure 6: Current Layout of the Facility
The total area for the current layout is shown Table 2.
Table 2: Current Total Area & Area Description
Building Code Area
Description Sq. Ft.
100I Office 217
100E Tool Crib 254
100, 100C, R100, R101, C100A,
C100
Club Area 4628
Aisle
Aisle with Tables Storage 495
100D Machine Shop 3094
Restrooms 162
Total 8850
Page 26
25
Emergency Exits
The first major concern for a new building layout is location of fire exits. The emergency
exits were a high priority because of the increase in capacity. The traveling distance to reach an
exit for a commercial facility cannot be more than 200 feet without a fire suppression system
and cannot be more than 250 feet with a fire suppression system (Bozer). To determine the
correct number of exits, the maximum capacity of the persons was calculated using the
dimensions for the new layout. The Equation 1 below is from page 515 (Bozer) and the
maximum floor area allowances per occupant is from Table 9.11 (Bozer).
Equation 1: Maximum Population for a facility
Based on the calculated population the number of exits was obtained using Table9.12 (Bozer).
The following, Table 3, shows the distance from the entrance from each machine, office,
stairwell areas to each exit. The rows highlighted in yellow exit to the Exit 1 and those in orange
to Exit 2.
Page 27
26
Table 3: Length to Exit for each area (Floor 1)
Area Designation
Length to Exit
W/O Fire Suppression (Max 200 ft.)
W/ Fire Suppression (Max 250 ft.)
Distance Exit 1(ft.)| Distance Exit 2(ft.) Distance Exit 1(ft.)| Distance Exit 2(ft.)
Check-In/ Electronic Tool Crib
33 151 33 151
Storage 43 105 43 105
Metal Bending 83 62 83 62
Grinding/ Soundproof 100 46 100 46
Welding Area 145 57 145 57
Paint Booth 117 31 117 31
Computer for CNC 96.0 57 96.0 57
Tool Crib 70.0 85 70.0 85
SPL 67.0 81 67.0 81
Wood Area 41.0 117 41.0 117
Lathe/Mill 88.0 70 88.0 70
Office 80.0 70 80.0 70
Restrooms 132.0 40 132.0 40
Passenger Elevator 10.0 140 10.0 140
Freight Elevator 147.0 28 147.0 28
Stairwell 1 61 131 61 131
Stairwell 2 155 35 155 35
The full facility layout and color designation can be viewed in Appendix A: Figure 34. The entire
emergency exit layout which includes floor two is shown in Appendix A: Figure 35 & Figure 36.
Bathrooms
The increase in square footage and capacity created a new issue: all bathrooms should
be located within 200 feet of work station, page 134 (Bozer); the building’s diagonal is 173 ft. so
every work station is located within the 200 foot boundary. In order to calculate the correct
number of water closets (toilets), lavatories (sinks), and urinals an assumption that the total
capacity per floor is equal for both female and males. Using Table 4.2 (Bozer) the correct
Page 28
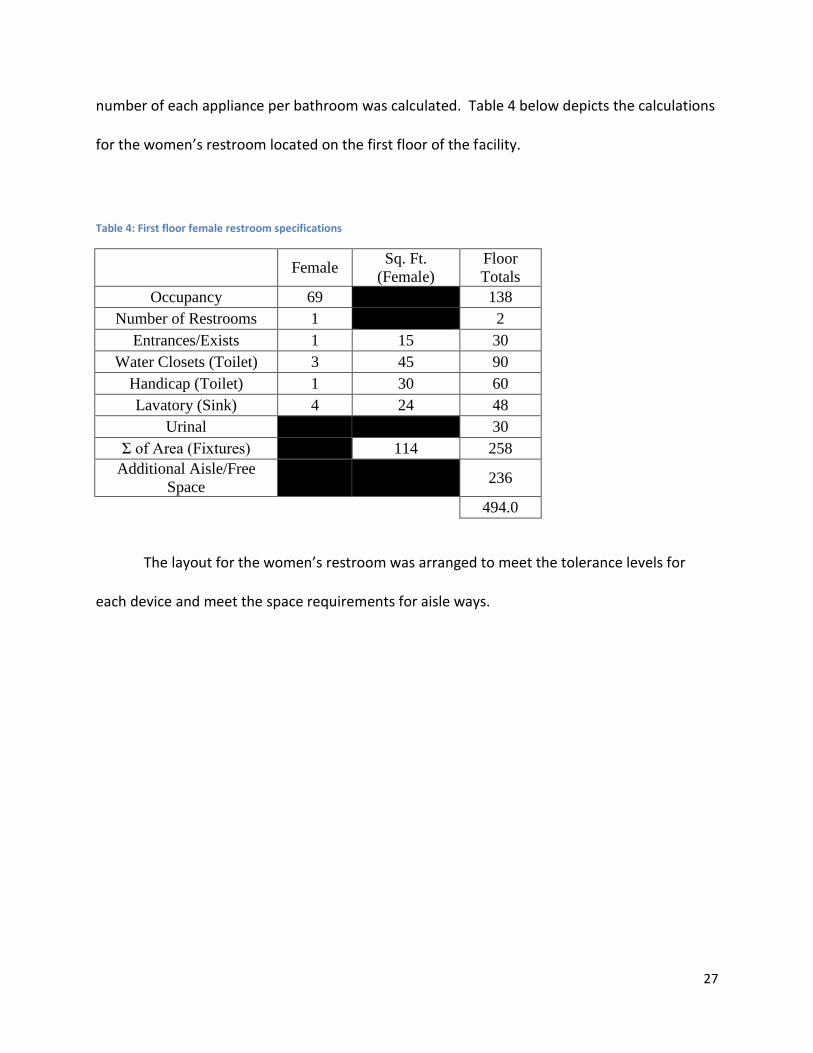
27
number of each appliance per bathroom was calculated. Table 4 below depicts the calculations
for the women’s restroom located on the first floor of the facility.
Table 4: First floor female restroom specifications
Female
Sq. Ft.
(Female)
Floor
Totals
Occupancy 69
138
Number of Restrooms 1
2
Entrances/Exists 1 15 30
Water Closets (Toilet) 3 45 90
Handicap (Toilet) 1 30 60
Lavatory (Sink) 4 24 48
Urinal
30
Σ of Area (Fixtures)
114 258
Additional Aisle/Free
Space 236
494.0
The layout for the women’s restroom was arranged to meet the tolerance levels for
each device and meet the space requirements for aisle ways.
Page 29
28
Figure 7: Female restroom layout for the first floor
The calculations and design layouts for the second floor’s female restroom along with both
male restrooms can be found in Appendix A: Figure 24 & Figure 25 and Appendix B: Table 16 &
Table 17.
Lighting
An important aspect for a machine shop is the quality of lighting that illuminates the
work area. The lighting of work areas is an important aspect of providing a quality user friendly
work environment. Throughout the interviews the technicians suggested that better lighting
systems would help create a better work environment especially in areas where precision and
accuracy were needed. In order to provide each tool, machine, office, computer, or any other
area in the new facility with proper amount of lighting several important value criteria were
needed: Room cavity ratio (RCR), ceiling cavity ratio (CCR), wall reflections (WR), basic ceiling
Page 30
29
reflection (BCR), effective ceiling reflectance (ECR), coefficient of utilization (CU), and light loss
factor (LLF). Below is Equation 2 that determines the RCR.
Equation 2: Room Cavity Ratio (RCR)
The following is an example of all the necessary values used to calculate the total number of
required luminaries for the welding area for the proposed layout.
Table 5: Calculation to determine the number of luminaries to properly laminate the weld area
WR (BCR) (ECR) (CU) (LLF)
Minimum Level of
Illumination (foot-candles)
Number of Lamps
Number of Luminaries
Welding Area
35% 80% 58.2% 0.504 0.72 50 40 13
The ECR and CU were calculated through interpolation because the values that were
calculated prior fell between the values listed in Tables 9.5 – 9.10 (Bozer). For a complete table
for all the critical values necessary to determine the total number of required luminaries and
the number of luminaries for each area/room in the building consult Appendix B: Table 22-
Table 27.
Page 31
30
Constraints
The constraints for the new facility include: funding for construction, land available for
new construction, and staffing for the new facility.
User Specifications
The first step to developing a new building was to interview the administrator and
technicians that currently work at the Hangar. Interviews with the technicians and George
Leone, administrator of the Hangar, helped guide the initial design layouts. Two of the layouts
were single story and two were two-story. Each of the layouts incorporated several
requirements that were determined during the interviews. The initial layout designs are shown
in Appendix A: Figure 28 - Figure 33. Several of the features that improved the capability of the
facility included: a centralized tool crib, more controlled check-in, club area, increased storage,
and increase in capacity.
After the initial designs were completed follow-up interviews took place to gather customer
input and feedback on the new layout designs. At the completion of the second round of
interviews the Quality Function Deployment (QFD) chart was updated based on the new
information. The final QFD chart is seen in Appendix A: Figure 23.The weight and importance
for the new facility were focused on the following functional requirements (Figure 8).
Page 32
31
Figure 8: QFD, Weight/ Importance of Functional Requirements
Economic Analysis
To determine the cost of the new facility and develop a plan to finance the construction,
alumni and corporate donations from 2001- 2008 were collected from Cal Poly’s College of
Engineering (CENG). Due to the current budget crisis in California the funds that are necessary
to fund the new facility are not available. To determine the amount of the cost of the new
building, it was compared to the Bonderson building because of their similarities in
functionality. The construction cost for the new facility was based off the construction cost of
Bonderson. A trend analysis was performed on the historical data to determine a seasonal
index, which was then used to forecast future donations the CENG would receive, as seen
below in Table 6.
Page 33
32
Table 6: Seasonal Index to determine forecast for donations (x $1,000)
Forecast for future donations
Year Period Donation Amount Y(t) Seasonal Index: Y/Y(t)
2001 1 $2,256.00 $1,555.37 1.45
2002 2 $1,931.00 $1,837.24 1.05
2003 3 $2,067.00 $2,119.11 0.98
2004 4 $1,793.00 $2,400.98 0.75
2005 5 $1,953.00 $2,682.85 0.73
2006 6 $2,735.00 $2,964.72 0.92
2007 7 $3,120.00 $3,246.59 0.96
2008 8 $4,480.00 $3,528.46 1.27
Average
1.01
Alumni and corporate donations were forecasted through 2025 to determine what
percentage of those funds per year can be allocated to the construction of the new building.
The donation amount vs. period was plotted to determine a trend line. The equation for the
trend line was used to determine Y(t) values for each period (Table 6). Then the seasonal index
for each period was determined using (Equation 4) and an average seasonal index was taken
using each period’s index. Using Equation 5 the forecasted donation amount for each period was
determined. After the years 2009-2025 were forecasted each year’s donation value was
multiplied by a range of percentages (1% to 25%) in order to represent a value that could be
allocated for the project during that year. Each percentage’s column was summed to determine
the amount for the time period: 2009-2025 shown below in Table 7.
Page 34
33
Table 7: Percentage Allocated based on the forecasted value for 2010
Year 2010
Allocated Percentages
Donation Amount
Allocated Amount
1% $4,145,826.44 $41,458.26
5% $4,145,826.44 $207,291.32
10% $4,145,826.44 $414,582.64
12% $4,145,826.44 $497,499.17
15% $4,145,826.44 $621,873.97
20% $4,145,826.44 $829,165.29
25% $4,145,826.44 $1,036,456.61
Page 35
34
Methods In this chapter the methods used to establish a new database design and facility layout
as well the economic analysis will be explained.
Concurrent Engineering (CE) is “a systematic approach to integrated, concurrent design
of products and their related processes, including manufacture and support” (Menon). Quality
Function Deployment charts (QFD) allow for concurrent engineering by integrating user
requirements and functional requirements to calculate the overall importance of each area.
From the beginning of the initial design phase Concurrent engineering combined with a Quality
Function Deployment chart helped determine the foundation for the proposed database. CE
was an essential part to development of an interface that was user friendly, but still maintained
the functionality required by the management and technicians. The first several design
meetings with the technicians were spent discussing how to improve the current database and
what features and functions they would like integrated into the database. Concurrent
Engineering was also instrumental in the development of the new facility. The initial
requirements were obtained during interviews with George Leone, the administrator of The
Hangar.
Database Design
In order to test the design of the proposed database the beta version was given to the
technicians in The Hangar for a trial run: 15 minute times period. To help test for and ensure
user friendliness the program was opened to the “Technician Menu” without any explanation
of how to use the interface (Error! Reference source not found.). The only other device that was
initially set-up for the technicians was the magnetic strip that reads students Cal Poly
Page 36
35
identification cards. The only instructions that were given for the card reader was how to slide
the ID card through correctly. After the trial period, the technicians were interviewed and
instructed to give feedback. Their feedback was recorded and used to update the Quality
Function Deployment chart. The updated QFD was recalculated and analyzed to determine
what changes were required to develop a user friendly database interface. This process was
repeated several times throughout the entire design and development process of the database.
Facility Design
The design of the new facility and its specifications were developed using the QFD chart.
The chart directed the design of the facility by showing which categories yielded the greatest
importance for the new layout. Multiple designs were created based off the original QFD chart
and during follow up interviews these design were presented to Mr. Leone and technicians.
After the new layouts were presented and the contents of each explained, Mr. Leone and the
technicians were asked to analyze and describe their thoughts about the new layouts. After the
interviews concluded the QFD was updated to reflect the new requirements of the users. The
final concept layout design was guided by the updated requirements on the Quality Function
Deployment Chart.
Economic Analysis
To determine the overall cost of the new building the cost per square foot needed to be
calculated. To calculate the cost per square foot, the Bonderson Projects Center’s (building 197)
total cost and square footage was used. Bonderson Projects Center was selected because of its
Page 37
36
similar functionality that it has in common with the new building: machine shop and
classrooms/ conference rooms. The cost per square foot can be seen in Table 8. Alumni and
corporate donations were forecasted through 2025 to determine what percentage of those
funds per year need to be allocated to the construction of the new building.
Table 8: Bonderson Project Center Cost Per. Square Foot
Building Name Square Feet Cost Cost/Square foot
Bonderson Center 18575 $8,200,000 $441.45
Page 38
37
Results In this chapter the final designs for the database and facility are discussed as well as the
final economic analysis for the total project.
Database
The new design for the database incorporated all the user requirements and functional
requirements that were requested. The “Technician Menu” (Figure 9) eliminated the clutter that
was seen on the old interface and introduced the point and click method increasing the
navigation speed through the database.
Figure 9: Technician Menu for the Proposed Layout
Page 39
38
The student “Check In” (Appendix A: Figure 18) menu incorporated the use the magnetic
strip card reader eliminating the current method of manual check-in; in addition if the student
forgot his ID card the technician can type in the students Cal Poly username to check-in. The
student “Check Out” (Figure 10) menu allows the technician to verify that all tool(s) and
machine(s) checked-out by the during the session are returned before the student leaves the
facility. If a student decides to leave without officially checking out there is a feature that allows
the person who is in charge of closing procedures to run a report at the end of day. The report
allows the administrators to see what students neglected to sign-out. If any of those students
had tools or machines checked out the report also documents that information and further
action can be taken by the administration.
Figure 10: Student Check-Out Menu for the Proposed Layout
Page 40
39
Another function that is included in the database is separate menu for new student or
users (Appendix A: Figure 19). This allows the technicians or administrators to enter new
students into the system and immediately link their Cal Poly ID card with the student in the
system. Unlike the current system where the database had to be closed and then opened to see
the new student appear, the proposed database allows for instant use by the new user.
The process of using gold coins as a method of checking-out tools was also eliminated.
The “Tool Check Out” (Figure 11) menu shows the all the tools the selected student has out and
does not allow the student to check-out more than the allotted number of tools.
Figure 11: Tool Check-Out Menu for the Proposed Layout
Student accountability for the tools they check out also improved, in the “Tool Check In”
(Figure 12) menu if the student returns the tool and it’s damaged the Technician can instantly
Page 41
40
file a comment about the tool. The same two processes are completed for machines (Appendix
A: Figure 20 & Figure 21 ).
Figure 12: Tool Check-In Menu for the Proposed Layout
Tool and machine check out history can now be tracked and preventative maintenance
can now occur. The “Tool Management” (Figure 13) menu allows technicians to view all the
tools that currently in use, look-up any tool that needs to regularly scheduled maintenance, or
view any damaged tools that occurred while checked-out. The technicians can send tool order
forms and damaged reports to the administration by using the buttons on this menu and linking
menus. The “Machine Management” menu has identical functionality and use interface.
Page 42
41
Figure 13: Tool Management Menu for the Proposed Layout. The Machine Management Menu is identical in functionality and design.
Overall the new database provides its users with all the tools necessary to provide excellent
service to their customers.
Facility
Layout
After the initial concept designs were presented to the customer the proposed layout
was conceived through feedback taken from the customer. The new facility design is a two-
story structure: the first floor (Figure 14) is strictly the machine shop, the outside work area
(Figure 15) is the club area, and the second floor (Figure 16) is complete with conference and
research labs.
Page 43
42
The lighting on each floor and area several values were assumed such as: the cleanliness
of the lights, watts used and the regularity that the lights were cleaned. Some values were also
interpolated because the tables provided in (Bozer) did not provide the high enough resolution.
The amount of luminaries is the number of light fixtures for each area.
First Floor Layout
Figure 14: Final Design Layout (1st Floor)
The new design increased the total machine area from 3,094 ft2 to 6,746 ft2 providing a
larger area for students to manufacture their prototypes. The total capacity increased
from 50 persons to 138 persons. Total square footage for each area is shown in Appendix
B: Table 19.
Page 44
43
The office and main tool crib were centrally located to meet the customer requirements.
The central location allows the technicians and administrators on duty to have 360° view
of the machine shop. The areas highlighted in red represent the exits for the first floor.
The total number of luminaries for each area is shown below in Table 9. The complete
table with all the critical values is found in Appendix B: Table 22.
Table 9: Number of Luminaries per each area (1st
Floor)
Level Area Code
Number of Luminaries
Level Area Code
Number of Luminaries
Check-In/ Electronic Tool Crib A 9 Tool Crib H 8
Storage B 2 SPL I 8
Metal Bending C 14 Wood Area
J 27
Grinding/ Soundproof D 45 Lathe/Mill K 152
Welding Area E 13 Office L 10
Paint Booth F 7 Restrooms M 26
Computer for CNC G 8
The exit located on the right leads to the new club area. One passenger elevator, a freight
elevator, and two stairwells serve as access to the second floor. The exit is 20 ft. wide and
manual hangar doors are used to serve as the opening/ closing mechanism. This feature
allows clubs or project teams to bring larger prototypes into the shop to use the paint
booth. The facility layout with the proper emergency exit designations is shown in
Appendix A: Figure 34.
The restroom layout for males is shown in Appendix A: Figure 24 and the restroom layout
for females are in Figure 7 located in the Design chapter. All restroom requirements are
located in Appendix B: Table 16.
The lathe/ mill area layout is shown in Appendix A: Figure 27.
Page 45
44
Outdoor Work/ Club Layout
Figure 15: Final Design Layout (Outside/Club Area)
The new club area (Figure 15) provides an additional 15,710 ft2 of new work space with
5,930 ft2 covered space. Total square footage for individual areas located in Appendix B:
Table 21.
The garage/ pit areas provide clubs with assigned areas to store all tools and prototypes in
a secure, fully weather proof structure.
Luminaries were place under the covered area to provide lighting for when conditions do
not allow for proper lighting Table 10. The lighting for each club garage/ pit, chassis dyno,
and covered area is provided in Appendix B: Table 24.
Table 10: Number of Luminaries per each area (Outside Area)
Level Area Code Number of Luminaries
Outside Covering Roof 159
Garage/ Pit Area B-H 11
Page 46
45
The entire outside work area is enclosed by a chain link fence this eliminates multiple
access entrances into the facility which the customer required. The fence is equipped with
multiple gates: two strictly function as emergency exits while the other two function as
both emergency exits and vehicle entrances (Appendix A: Figure 35).
The waste and hazardous waste area is the facility’s dump area and can only be accessed
from the uncovered side of the area.
Second Floor Layout
Figure 16: Final Design Layout (2nd Floor)
There is no heavy machining equipment on the second floor. The research cells are
designed for companies, clubs, faculty, or students to use for research. The conference
rooms are designed for presentations.
Page 47
46
The total square footage is almost 7,500 ft2. The full dimensions for each area are shown
in Appendix B: Table 20. The total capacity for the second floor is 236 persons.
The amount of luminaries is the number of light fixtures for each area. The total number
of luminaries for each area is shown below in Table 11. The complete table with all the
critical values is found in Appendix B: Table 23.
Table 11: Number of Luminaries per each area (2nd
Floor)
Level Area Code
Number of Luminaries
Level Area Code
Number of Luminaries
Conference Room 1 A 11 Research Cell A H 7
Conference Room 2A B 6 Research Cell B I 7
Conference Room 2B C 7 Research Cell C J 7
Conference Room 3A D 8 Research Cell D K 6
Conference Room 3B E 6 Restroom L 22
Computer Lab F 6 Wet Lab (Door 1) M,N 9
Electronic Lab G 7 Wet Lab (Door 2) S 1
The length to each stairwell, emergency exit, for each area is located in Appendix B: Table
18. The facility layout with the proper emergency exit designations is shown in Appendix
A: Figure 36.
The restroom layout for both males and females is shown in Appendix A: Figure 25. All
restroom requirements are located in Appendix B: Table 17.
The computer lab layout is shown in Appendix A: Figure 26.
Utilities & Aisle layouts
The passenger & freight elevators and Stairwell 1 & Stairwell 2 lighting requirements are
shown below (Table 12). The aisle way’s lighting requirements are found in Table 13.
Page 48
47
The complete table with all the critical values is found in Appendix B: Table 25, Table 26
and Table 27.
Table 12: Number of Luminaries per each area (Utility)
Level Area Code
Number of Luminaries
Passenger Elevator O 2
Freight Elevator P 2
Stairwell 1 Q 5
Stairwell 2 R 5
Table 13: Number of Luminaries per each area (Aisles)
Level Area Code
Number of Luminaries
Hallway (1st) A 18
B 28
C 20
Hallway (2nd) A 14
B 4
C 15
D 5
All the included features, lighting, bathroom, emergency exits requirements, were
included due the increase capacity and capability. The increase in the capacity for the machine
shop floor required that the placement of each work area be a certain distance from an
emergency exit and the restrooms to increase in size to meet the needs of the users. In order to
provide the users with a user friendly environment each designated work area was designed to
have proper number of luminaries. The design of the new facility increased the capability for
Page 49
48
students, faculty, Cal Poly, and Companies. The increase in space allows for more equipment,
learning and design areas, and research cells for faculty and companies.
Economic Analysis
The cost estimate for the proposed facility is $12.3 million based off the cost/ft2. The
complete data is shown below in Table 14. The estimated cost is strictly an estimate because
the cost/ ft2 price was determined from Bonderson, whose functionality is similar: machine
shop located inside the building with additional classroom space. The estimated price does not
take into account funds necessary to populate the facility with all the machine equipment.
Table 14: Estimated cost of the proposed facility based on the Bonderson Center
Building Name Square Feet Cost Cost/Square foot
Bonderson Center 18,575 $8,200,000 $441.45
Proposed Layout 27,790 $12,267,994.62 $441.45
The trend/regression line seen in Figure 17 was used to determine the seasonal index
value to forecast future donations. Forecasts for the year 2009-2025 were determined using
the seasonal index (Appendix B: Table 28). A percentage for each forecasted amount per year
was taken to determine how much the College of Engineering (CENG) should allocate toward
the construction for selected time period (Appendix B: Table 29). The CENG should allocate 20%
of the forecasted donations each year to fund the construction of the proposed facility: this is
highlighted in yellow on (Appendix B: Table 29). Using present worth analysis it was
Page 50
49
determined that allocating 20% of the donations per year for 17 years at either a rate of 3% or
5% provides sufficient funds for the new building (Table 30).
Figure 17: Trend/Regression Analysis for Donations
Although the forecasts show a reasonable upward trend the likelihood that trend
continues to maintain its upward trend is unlikely. The analysis does not take into account
market or global trends. These two factors are some many that can affect the amount that
people are willing to donate.
Based on the results of both the database and facility designs, implementing the new
database immediately decreases student sign-in time as well as increases the accountability on
students who check-out tools or machines. The database also allows for routine tool and
machine maintenance reducing the amount of equipment that requires serious service. The
new facility increases the capability and capacity. Both proposals give future students the ability
to design and produce prototypes without any of the current issues. However, there may be
y = 281.87x + 1273.5R² = 0.5838
$0.00$500.00
$1,000.00$1,500.00$2,000.00$2,500.00$3,000.00$3,500.00$4,000.00$4,500.00$5,000.00
0 2 4 6 8 10 12
Do
nat
ion
Am
ou
nt
($)
Period (year)
Trend Analysis
Series1
Linear (Series1)
Page 51
50
limitations in the facility design if more students start actively using the machine shop and
maximum capacity is reached more quickly. Also the increase in capacity means an increase in
technicians on duty. This may not be possible if the current budget cuts in California occur more
regularly into the future.
Page 52
51
Conclusion The purpose of this project was to design a new database and facility to replace the
current database and facility. The issue with the current building was its capacity and
condemned status; the issue with the database was its manual entry and lack of tool tracking
capabilities. After conducting customer interviews and research both a new facility and
database were created that incorporated many if not all of the user requirements.
The most important results that occurred were throughout the design stages: working
concurrently with the end users provided designs that met the customer’s requirements
while still meeting all the functional requirements needed.
The use of concurrent engineering provided the best source of research because the
end users were able to express their needs. This type cooperative work environment led
to the development of a facility design that benefits many and helps the image of the
University’s motto “Learn by Doing”. The design of the database is a practical design,
designed by the user to insure user compatibility.
The objectives (design a new facility to replace the current the Student Projects Shop
and design a new database to replace the current database) were met and exceeded
because of the ongoing feedback that was given by the customer.
A great deal of experience was gained through this project, not only in how the design process
functions, but also knowledge in engineering programs. The next step is to fully integrate the
database system into the current facility and present the proposed facility to the College of
Engineering. Based on the findings it is recommended that the administration institute the new
Page 53
52
database design and begin working on plans to finalize the construction of the new facility. The
new facility provides not only the student engineers at Cal Poly with a new state-of-the-art
facility, but it also benefits the university by providing its students, final products and source of
future funds, with the necessary tools to succeed once they receive their degree.
Page 54
53
Works Cited
Blank, Leland T. and Anthony J. Tarquin. Engineering Economy 6th Edition. United States of America:
McGraw-Hill, 2005.
Bozer, Yavuz A., et al. Facilities Planning 3rd Ed. Hoboken, NJ: John Wiley & Sons, Inc., 2003.
Cal Poly State University, San Luis Obispo. Student Projects Machine Shop in the Hangar. 18 May 2009
<http://me.calpoly.edu/students/labs/spms/>.
—. Student Projects Machine Shop Information:. 18 May 2009 <http://me.calpoly.edu/machineshop/>.
Chopra, Sunil and Peter Meindl. Supply Chain Management: Strategy, Planning, & Operation. Upper
Saddle River, NJ: Pearson Prentice Hall, 2007.
Ergen, Esin, et al. "Tracking Components and Maintenance History within a Facility Utilizing." Journal of
Computing in Civil Engineering 21.1 (Jan. 2007): 11-20.
Eschenbach, Ted G., et al. Engineering Economics Analysis 10th Ed. New York, New York: Oxford
University Press, Inc., 2009.
Khan, Wasim Ahmed, Saad Muhammad Rasheed Al-Doussari, and A. H. M. Al-Kahtani. "Establishment of
engineering laboratories for undergraduate and postgraduatestudies." European Journal of Engineering
Education 27.4 (Dec 2002): 425-435.
Laufer, Arthur C. Operations Management. 2nd Ed. Cincinnati, Ohio: South-Western Publishing Co, 1979.
Menon, Dr. Unny. "Concurrent Engineering." IME 418 Product-Process Design. San Luis Obispo:
California Polytechnic San Luis Obispo, January 2010.
Miller, Joseph. "Criteria for Evaluating RFID Solutions for Records and Information." Information
Management Journal 41.1 (Jan. 2007): 50-54.
Pattanaik, L. N., and B. P. Sharma. "Implementing lean manufacturing with cellular layout: a case study.
." International Journal of Advanced Manufacturing Technology 42.7/8 (Sep. 2009): 772-779.
Pitchuka, Leela Nagasrinivasarao, Gajendra Kumar Adil, and Usha Ananthakumar. "Effect of conversion
of functional layout to a cellular layout on the queue time performance:some new insights. ."
International Journal of Advanced Manufacturing Technology (15 Dec. 2006): 594-601.
Riggs, Henry E. Financial and Economic Analysis: for Engineering and Technology Management. 2nd Ed.
Hoboken, NJ: John Wiley & Sons, Inc, 2004.
Schaller, Jeffrey E., Erengüç S. Selçuk and Vakharia, Asoo J. "A methodology for integrating cell formation
and production planning in cellular manufacturing ." Annals of Operations Research (January 1998): 1-
21.
Page 55
54
Shouqin Zhou, Weiqing Ling, and Zhongxiao Peng. "An RFID-based remote monitoring system for
enterprise internal production management." International Journal of Advanced Manufacturing
Technology 33.7/8 15 June 2007: 837-844.
Singh, S. P., and R. R. K. Sharma. "A review of different approaches to the facility layoutproblems ."
International Journal of Advanced Manufacturing Technology 30.5/6 15 Sep 2006: 425-433.
Sonmez, Rifat. "Conceptual cost estimation of building projects with regression analysis and neural
networks." Canadian Journal of Civil Engineering (Aug 2004): 677-683.
Stettler, Howard F. "Break-Even Analysis: Its Uses and Misuses." The Accounting Review Vol. (July 1962):
460-463.
Tas, Elcin and Yaman, Hakan. "A Building Cost Estimation Model based on Cost Significant Work
Packages." Engineering, Construction and Architectural Management (2005): 251.
Vorster, Mike. "Six Steps to Demystify Depreciation." Construction Equipment 12 Dec 2003: 72.
Wickens, Christopher D, et al. An Introduction to Human Factors Engineering. 2nd Ed. Upper Saddle
River, New Jersey: Pearson Education Inc., 2004.
Page 56
55
Appendix A (Figures)
Figure 18: Student Check-In Menu for the Proposed Layout
Page 57
56
Figure 19: New Student Addition Menu for the Proposed Layout
Figure 20: Machine Check-Out Menu for the Proposed Layout
Page 58
57
Figure 21: Machine Check-In Menu for Proposed Layout
Page 59
58
Figure 22: Quality Function Deployment for the New Database design
Page 60
59
Figure 23: Quality Function Deployment for a New Facility design
Page 61
60
Figure 24: Male restroom layout for the first floor
Figure 25: Female & Male restroom layouts for the second floor
Page 62
61
Figure 26: Computer lab layout (2nd Floor)
Figure 27: Lathe and Mill layout (1st Floor)
Page 63
62
Figure 28: Concept Design A (1st Floor)
Figure 29: Concept Design A (2nd Floor)
Page 64
63
Figure 30: Concept Design B (1st Floor)
Figure 31: Concept Design B (2nd Floor)
Page 65
64
Figure 32: Concept Design C (Single Level)
Figure 33: Concept Design D (Single Level)
Page 66
65
Figure 34: Fire Escape Zones and Exits (1st Floor)
Figure 35: Emergency Exits (Outside/Club Area)
Page 67
66
Figure 36: Fire Escape Zones and Exits (2nd Floor)
Page 68
67
Appendix B (Tables)
Table 15: Sign-in times for the Hangar and REC Center
Trial Hangar Manual
(sec)
Rec Center PolyCard
(sec)
PolyCard (4x) (sec)
1 28 2 8
2 37 4 16
3 35 3 12
4 49 2 8
5 10 2 8
6 49 2 8
7 56 5 20
8 25 3 12
9 14 5 20
10 11 4 16
11 50 3 12
12 9 3 12
13 29 2 8
14 61 5 20
15 37 4 16
16 58 4 16
17 12 2 8
18 82 3 12
19 29 3 12
20 15 3 12
21 31 3 12
22 39 2 8
23 8 2 8
24 15 6 24
Average 32.89 3.21 12.83
Page 69
68
Table 16: First Floor Female and Male Bathroom Requirements
Female Male
Sq. Ft.
(Female)
Sq. Ft.
(Male)
Floor
Totals
Occupancy 69 69
138
Number of Restrooms 1 1
2
Entrances/Exists 1 1 15 15 30
Water Closets (Toilet) 3 3 45 45 90
Handicap (Toilet) 1 1 30 30 60
Lavatory (Sink) 4 4 24 24 48
Urinal
5
30 30
Σ of Area (Fixtures)
114 144 258
Additional Aisle/Free Space
236
Total Sq. Ft. 494.0
Table 17: Second Floor Female and Male Bathroom Requirements
Female Male
Sq. Ft.
(Female)
Sq. Ft.
(Male)
Floor
Totals
Occupancy 118 118
236
Number of Restrooms 1 1
2
Entrances/Exists 1 1 15 15 30
Water Closets (Toilet) 6 6 90 90 180
Handicap (Toilet) 1 1 30 30 60
Lavatory (Sink) 6 6 36 36 72
Urinal
5
30 30
Σ of Area (Fixtures)
171 201 372
Additional Aisle/Free Space
186
Total Sq. Ft. 558.0
Page 70
69
Table 18: Length to Exit for each area (Floor 2)
Area Designation
Length to Exit
W/O Fire Suppression (Max 200 ft.)
W/ Fire Suppression (Max 250 ft.)
Stairwell 1 (ft.)| Stairwell 2 (ft.) Stairwell 1 (ft.)| Stairwell 2 (ft.)
Conference Room 1
111 61 111 61
Conference Room 2A
107 51 107 51
Conference Room 2B
101 31 101 31
Conference Room 3A
39 121 39 121
Conference Room 3B
16 114 16 114
Computer Lab
36 88 36 88
Electronic Lab
11 115 11 115
Research Cell A
54.5 132 54.5 132
Research Cell B
67 105 67 105
Research Cell C
88.0 83 88.0 83
Research Cell D
110.0 68 110.0 68
Restroom 87.0 37 87.0 37
Wet Lab (Door 1)
46.0 78 46.0 78
Wet Lab (Door 2)
74.5 50 74.5 50
Passenger Elevator
51.0 146 51.0 146
Freight Elevator
120.0 9 120.0 9
Storage Closet
116 8.5 116 8.5
Use Stairwell 1
Use Stairwell 2
Page 71
70
Table 19: Total Square Footage for all areas on the first floor
Area Designation Area (ft2)
Check-In/ Electronic Tool Crib 300
Storage 431
Metal Bending 474
Grinding/ Soundproof 526
Welding Area 952
Paint Booth 200
Computer for CNC 160.0
Tool Crib 290.7
SPL 290.7
Wood Area 1180.8
Lathe/Mill 2672.0
Office 228
Restrooms 494.0
Passenger Elevator 42
Freight Elevator 59.5
Stairwell 1 144
Stairwell 2 144
Total Designated Area 8589
Maximum Occupancy 1st Floor 138
Page 72
71
Table 20: Total Square Footage for all areas on the second floor
Area Designation Area (ft2)
Conference Room 1 896
Conference Room 2A 448
Conference Room 2B 504
Conference Room 3A 616
Conference Room 3B 464
Computer Lab 468
Electronic Lab 515
Research Cell A 540
Research Cell B 540
Research Cell C 540
Research Cell D 468
Restroom 558
Wet Lab (Door 1) 702
Wet Lab (Door 2)
Passenger Elevator 42
Freight Elevator 68
Storage Closet 116
Total Designated Area 7486
Maximum Capacity 2nd Floor 236
Table 21: Total Square Footage for individual areas for the outside layout
Area Description Area (ft2)
Chassis Dyno 600
Club Area 337.5
Club Area 337.5
Club Area 337.5
Club Area 337.5
Club Area 337.5
Club Area 337.5
Club Area 337.5
Waste/ Hazardous Area 362
Covered Workspace 5928
Additional Uncovered Workspace
6456
15709
Page 73
72
Table 22: Lighting Critical values for the 1st Floor
Area Code
Height (work surface to
luminaries)
Height (luminaries to ceiling)
RCR CCR WR BCR Effective Ceiling
Reflectance
Coefficient of
Utilization
Light Loss
Factor
Minimum Level of
Illumination
Number of
Lamps
A 6.5 4 4.35 2.68 0.35 0.80 0.412 0.390 0.88 100 26
B 6.5 4 3.30 2.03 0.35 0.80 0.486 0.445 0.88 20 7
C 6.5 4 3.07 1.89 0.35 0.80 0.503 0.457 0.78 100 41
D 6.5 4 2.89 1.78 0.35 0.80 0.516 0.466 0.78 500 134
E 6.5 4 2.12 1.30 0.35 0.80 0.582 0.504 0.72 50 40
F 6.5 4 4.88 3.00 0.35 0.80 0.380 0.366 0.78 100 21
G 6.5 4 5.28 3.25 0.35 0.80 0.360 0.352 0.88 150 24
H 6.5 4 3.82 2.35 0.35 0.80 0.448 0.419 0.88 100 24
I 6.5 4 3.82 2.35 0.35 0.80 0.448 0.419 0.84 100 25
J 6.5 4 1.94 1.20 0.35 0.80 0.598 0.514 0.84 100 82
K 6.5 4 1.50 0.92 0.35 0.80 0.640 0.545 0.72 200 455
L 6.5 4 4.35 2.68 0.35 0.80 0.412 0.390 0.88 150 30
M 6.5 0 2.65 0.00 0.35 0.80 0.800 0.478 0.88 100 26
Page 74
73
Table 23: Lighting Critical values for the 2nd Floor
Area Code
Height (work surface to
luminaries)
Height (luminaries to ceiling)
RCR CCR WR BCR Effective Ceiling
Reflectance
Coefficient of
Utilization
Light Loss
Factor
Minimum Level of
Illumination
Number of
Lamps
A 7 2 2.34 0.67 0.8 0.8 0.753 0.580 0.88 100 33
B 7 2 3.44 0.98 0.8 0.8 0.741 0.518 0.88 100 18
C 7 2 3.19 0.91 0.8 0.8 0.744 0.531 0.88 100 20
D 7 2 2.84 0.81 0.8 0.8 0.748 0.550 0.88 100 24
E 7 2 3.36 0.96 0.8 0.8 0.742 0.522 0.88 100 19
F 7 2 3.29 0.94 0.8 0.8 0.742 0.526 0.88 100 19
G 7 2 3.17 0.91 0.8 0.8 0.744 0.532 0.88 100 20
H 7 2 3.11 0.89 0.8 0.8 0.744 0.535 0.88 100 21
I 7 2 3.11 0.89 0.8 0.8 0.744 0.535 0.88 100 21
J 7 2 3.11 0.89 0.8 0.8 0.744 0.535 0.88 100 21
K 7 2 3.29 0.94 0.8 0.8 0.742 0.526 0.88 100 19
L 7 0 3.07 0.00 0.8 0.8 0.800 0.537 0.88 100 22
M,N 7 2 2.84 0.81 0.8 0.8 0.748 0.550 0.88 100 27
S 7 2 6.72 1.92 0.8 0.8 0.695 0.402 0.88 20 1
Page 75
74
Table 24: Lighting Critical values for the Outside work area
Area
Code
Height (work
surface to
luminaries)
Height
(luminaries
to ceiling)
RCR CCR WR BCR
Effective
Ceiling
Reflectance
Coefficient
of
Utilization
Light Loss
Factor
Minimum
Level of
Illumination
Number
of
Lamps
Roof 14 6 1.90 0.81 0.5 0.65 0.5276 0.424 0.88 100 636
B-H 8.5 1.5 4.72 0.83 0.65 0.65 0.567 0.412 0.78 100 42
Table 25: Lighting Critical values for the passenger & freight elevators and stairwell 1 & stairwell 2
Area
Code
Height (work
surface to
luminaries)
Height
(luminaries
to ceiling)
RCR CCR WR BCR
Effective
Ceiling
Reflectance
Coefficient
of
Utilization
Light Loss
Factor
Minimum
Level of
Illumination
Number
of
Lamps
O 8 0 12.38 0 0.5 0.5 0.5 0.25 0.92 20 1
P 8 0 9.71 0 0.5 0.5 0.5 0.25 0.92 20 2
Q 12 0 10.42 0 0.5 0.5 0.5 0.25 0.92 20 5
R 12 0 10.42 0 0.5 0.5 0.5 0.25 0.92 20 5
Page 76
75
Table 26: Lighting Critical values for the aisle space on the 1st
floor
Area Code
Height (work surface to
luminaries)
Height (luminaries to ceiling)
RCR CCR WR BCR Effective Ceiling
Reflectance
Coefficient of
Utilization
Light Loss
Factor
Minimum Level of
Illumination
Number of
Lamps
A 14 0 3.49 0 0.65 0.8 0.8 0.515 0.88 20 36
B 14 0 2.35 0 0.65 0.8 0.8 0.582 0.88 20 57
C 14 0 2.96 0 0.65 0.8 0.8 0.54 0.88 20 39
Table 27: Lighting Critical values for the aisle space on the 2
nd floor
Area Height (work
surface to luminaries)
Height (luminaries to ceiling)
RCR CCR WR BCR Effective Ceiling
Reflectance
Coefficient of
Utilization
Light Loss
Factor
Minimum Level of
Illumination
Number of
Lamps
A 12 2 5.66 0.94 0.8 0.8 0.742 0.430 0.88 20 29
B 12 2 7.64 1.27 0.8 0.8 0.729 0.377 0.88 20 9
C 12 2 5.76 0.96 0.8 0.8 0.742 0.428 0.88 20 31
D 12 2 7.54 1.26 0.8 0.8 0.730 0.380 0.88 20 9
Page 77
76
Table 28: Trend Analysis Forecast for Donations for2009-2025 (x $1,000)
Forecast for future donations
Year Period Donation Amount Y(t) Seasonal Index: Y/Y(t)
2001 1 $2,256.00 $1,555.37 1.45
2002 2 $1,931.00 $1,837.24 1.05
2003 3 $2,067.00 $2,119.11 0.98
2004 4 $1,793.00 $2,400.98 0.75
2005 5 $1,953.00 $2,682.85 0.73
2006 6 $2,735.00 $2,964.72 0.92
2007 7 $3,120.00 $3,246.59 0.96
2008 8 $4,480.00 $3,528.46 1.27
Average 1.01
2009 9 $3,860.26 $3,810.33 1.01
2010 10 $4,145.83 $4,092.20 1.01
2011 11 $4,431.39 $4,374.07 1.01
2012 12 $4,716.95 $4,655.94 1.01
2013 13 $5,002.52 $4,937.81 1.01
2014 14 $5,288.08 $5,219.68 1.01
2015 15 $5,573.65 $5,501.55 1.01
2016 16 $5,859.21 $5,783.42 1.01
2017 17 $6,144.77 $6,065.29 1.01
2018 18 $6,430.34 $6,347.16 1.01
2019 19 $6,715.90 $6,629.03 1.01
2020 20 $7,001.46 $6,910.90 1.01
2021 21 $7,287.03 $7,192.77 1.01
2022 22 $7,572.59 $7,474.64 1.01
2023 23 $7,858.16 $7,756.51 1.01
2024 24 $8,143.72 $8,038.38 1.01
2025 25 $8,429.28 $8,320.25 1.01
Page 78
77
Table 29: Percentage of Allocated Donations for each year (x$1,000)
Period Year Donation Amount 1% 5% 10% 12% 15% 20% 25%
1 2009 $3,860.26 $38.60 $193.01 $386.03 $463.23 $579.04 $772.05 $965.07
2 2010 $4,145.83 $41.46 $207.29 $414.58 $497.50 $621.87 $829.17 $1,036.46
3 2011 $4,431.39 $44.31 $221.57 $443.14 $531.77 $664.71 $886.28 $1,107.85
4 2012 $4,716.95 $47.17 $235.85 $471.70 $566.03 $707.54 $943.39 $1,179.24
5 2013 $5,002.52 $50.03 $250.13 $500.25 $600.30 $750.38 $1,000.50 $1,250.63
6 2014 $5,288.08 $52.88 $264.40 $528.81 $634.57 $793.21 $1,057.62 $1,322.02
7 2015 $5,573.65 $55.74 $278.68 $557.36 $668.84 $836.05 $1,114.73 $1,393.41
8 2016 $5,859.21 $58.59 $292.96 $585.92 $703.11 $878.88 $1,171.84 $1,464.80
9 2017 $6,144.77 $61.45 $307.24 $614.48 $737.37 $921.72 $1,228.95 $1,536.19
10 2018 $6,430.34 $64.30 $321.52 $643.03 $771.64 $964.55 $1,286.07 $1,607.58
11 2019 $6,715.90 $67.16 $335.80 $671.59 $805.91 $1,007.39 $1,343.18 $1,678.98
12 2020 $7,001.46 $70.01 $350.07 $700.15 $840.18 $1,050.22 $1,400.29 $1,750.37
13 2021 $7,287.03 $72.87 $364.35 $728.70 $874.44 $1,093.05 $1,457.41 $1,821.76
14 2022 $7,572.59 $75.73 $378.63 $757.26 $908.71 $1,135.89 $1,514.52 $1,893.15
15 2023 $7,858.16 $78.58 $392.91 $785.82 $942.98 $1,178.72 $1,571.63 $1,964.54
16 2024 $8,143.72 $81.44 $407.19 $814.37 $977.25 $1,221.56 $1,628.74 $2,035.93
17 2025 $8,429.28 $84.29 $421.46 $842.93 $1,011.51 $1,264.39 $1,685.86 $2,107.32
Total 17
$1,044.61 $5,223.06 $10,446.11 $12,535.34 $15,669.17 $20,892.23 $26,115.28
Page 79
78
Table 30: Present worth Analysis for Selected Allocated Values
Period
15% 20% 25% i 15% Allocated 20% Allocated 25% Allocated
0 $12,300 3% 5%
1 $579.04 $772.05 $965.07 $562.17 $551.47 $749.57 $735.29 $936.96 $919.11
2 $621.87 $829.17 $1,036.46 $586.18 $564.06 $781.57 $752.08 $976.96 $940.10
3 $664.71 $886.28 $1,107.85 $608.30 $574.20 $811.07 $765.60 $1,013.84 $957.00
4 $707.54 $943.39 $1,179.24 $628.64 $582.10 $838.19 $776.13 $1,047.74 $970.16
5 $750.38 $1,000.50 $1,250.63 $647.28 $587.94 $863.04 $783.92 $1,078.80 $979.90
6 $793.21 $1,057.62 $1,322.02 $664.30 $591.91 $885.74 $789.21 $1,107.17 $986.51
7 $836.05 $1,114.73 $1,393.41 $679.78 $594.16 $906.38 $792.22 $1,132.97 $990.27
8 $878.88 $1,171.84 $1,464.80 $693.80 $594.86 $925.06 $793.15 $1,156.33 $991.44
9 $921.72 $1,228.95 $1,536.19 $706.42 $594.15 $941.89 $792.20 $1,177.36 $990.24
10 $964.55 $1,286.07 $1,607.58 $717.72 $592.15 $956.95 $789.53 $1,196.19 $986.92
11 $1,007.39 $1,343.18 $1,678.98 $727.76 $589.00 $970.34 $785.33 $1,212.93 $981.66
12 $1,050.22 $1,400.29 $1,750.37 $736.60 $584.80 $982.14 $779.74 $1,227.67 $974.67
13 $1,093.05 $1,457.41 $1,821.76 $744.32 $579.67 $992.42 $772.89 $1,240.53 $966.12
14 $1,135.89 $1,514.52 $1,893.15 $750.96 $573.70 $1,001.28 $764.93 $1,251.59 $956.17
15 $1,178.72 $1,571.63 $1,964.54 $756.58 $566.99 $1,008.77 $755.98 $1,260.96 $944.98
16 $1,221.56 $1,628.74 $2,035.93 $761.23 $559.61 $1,014.98 $746.15 $1,268.72 $932.68
17 $1,264.39 $1,685.86 $2,107.32 $764.98 $551.65 $1,019.97 $735.53 $1,274.96 $919.42
Total Amount: $11,737.02 $9,832.41 $15,649.36 $13,109.88 $19,561.70 $16,387.34
Difference: ($562.98) ($2,467.59) $3,349.36 $809.88 $7,261.70 $4,087.34
Page 80
79
Appendix C (Equations)
Equation 3: Y (t) Trend Line Donation Amount x ($1,000)
Equation 4: Seasonal Index
Equation 5: Forecasted Donation Amount