National Research Conseil national Cwncil Can& de mhewhes Canada FAClLlN FOR TESTING COOLING AND DEHUMIDIFYING COILS: DESCRIPTION, PROCEDURES AND TEST RESULTS by AH. Elmahdy and G.P. Mtalm DBR Fapr No. 756 Division of Building Research Aricet 50 cents
Transcript
National Research Conseil national Cwncil Can& de mhewhes Canada
FAClLlN FOR TESTING COOLING AND DEHUMIDIFYING COILS: DESCRIPTION, PROCEDURES AND TEST RESULTS
by AH. Elmahdy and G.P. Mtalm
DBR Fapr No. 756 Division of Building Research
Aricet 50 cents
NATIONAL RESEARCH COUNCIL OF CANADA
DIVISION OF BUILDING RESEARCH
FACILITY FOR TESTING COOLING AND DEHWJlIDIFYING COILS:
DESCRIPTION, PROCEDURES AND TEST RESULTS
by
A.H. Elmahdy and G.P. Mitalas
DBR Paper No. 756
of the
Division of Building Research
OTTAWA, February 1978
FACILITY FOR TESTING COOLING AND DEHUMIDIFYING COILS:
DESCRIPTION, PROCEDURES AND TEST RESULTS
by A.H. Elmahdy and G.P. Flitalas
ABSTRACT
A test facility has been constructed and a test procedure developed to carry out full- and part-load performance tests on cooling and dehumidifying coils. Heat exchangers, up to 8 rows and having frontal face area of 0.61 by 0.61 m, can be tested in the working section. The air circulated in the closed loop duct can be heated and humidified after being cooled and dehumidified by the tested coil.
Dry and wet heat transfer test results of two coils are included. They are 4 and 8 rows, circular tubes, in staggered arrangement and held in space by flat continuous fins.
INSTALLATION DE MISE EN ESSAI DE SERPENTINS DE REFROIDISSEMENT ET DE
D~SHUMIDIFICATION : DESCRIPTION, ~THODES ET R~SULTATS DE L ESSAI
par A.H. Elmahdy et G.P. Mitalas
Un appareil d'essai a St6 fabriqu6 et une m6thode d'essai mise au point pour effectuer des essais de charges complstes ou partielles sur des serpentins de refroidissement et de d6shumidification. Des 6changeurs de chaleur d'au plus 8 rang6es et d'une surface de front mesurant 0.61 sur 0.61 m peuvent Ztre mis 2 l'essai. L'air circul6 dans le circuit en boucle ferm6 peut &tre chauff6 et humidifi6 aprss son refroidissement et sa d6shumidification dans le serpentin mis 5 l'essai.
Les rgsultats de l'essai de transfert de chaleur sgche et humide sur deux serpentins sont inclus. Ces serpentins tabulaires l'un de 4 et l'autre de 8 rang6es dispos6es en chicane sont maintenus par une suite continue d'ailettes plates.
FACILITY FOR TESTING COOLING AND DEHUMIDIFYING COILS:
DESCRIPTION, PROCEDURES AND TEST RESULTS
b Y A.H. Elmahdy and G.P. Mitalas
In recent years the need to save energy has prompted a great deal of interest in increasing the efficiency of heating, ventilating and air-conditioning (HVAC) systems. This has led to the development of sophisticated computer programs designed to determine the thermal performance of buildings and their associated HVAC systems under dif- ferent loading conditions.
In a previous paper (1) the authors presented a mathematical model, followed by a computer program (2) simulating the thermal performance of finned-tube, multi-row heat exchangers at different cooling loads. A considerable amount of experimental heat transfer data about dry surface coil performance is available in the literature (3-6), but only a limited amount about wet surface coil performance (7 and 8). Consequently, a test facility capable of performing the required tests and of providing more heat transfer data, especially during dehumidification processes, has been constructed.
Detailed descriptions of the cooling coil test facility and test procedures are given in this paper. Two coils (4- and 8-row circular tubes with continuous fins) have been tested. The relevant heat transfer data, together with corresponding results obtained both analytically and experimentally are reported for comparison purposes.
DESCRIPTION OF TEST FACILITY
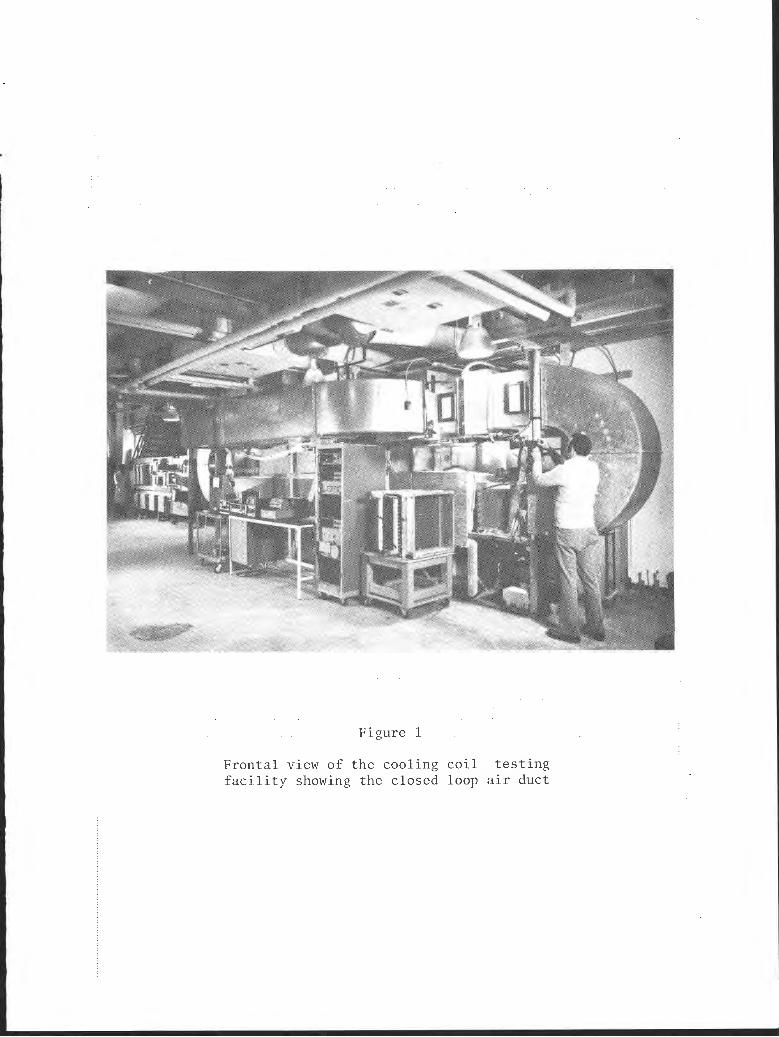
The test facility is located in the Environmental Engineering Laboratory of the Division of Building Research, National Research Council of Canada; a frontal view is shown in Figure 1. It is designed so that a coil with face dimensions 61 by 61 cm can be installed in the working section. For practical purposes air face velocity can be varied between about 0.7 to 6.0 m/s. Design capacities of sensible heat latent heat and chilled water flow rate are 50 kW, 20 kW, and 3 3 dm /s, respectively. The test facility consists of an air circuit, chilled water circuit, and power supply.
Air Circuit
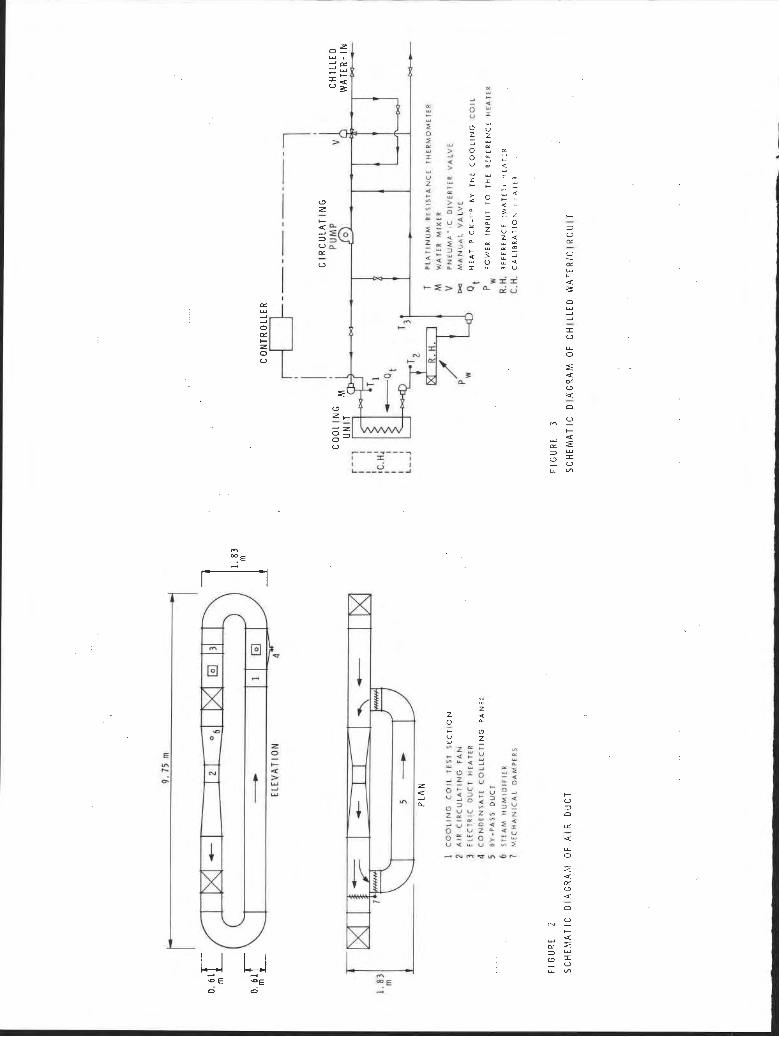
The air circuit is a closed loop duct, (a schematic diagram is shown in Figure 2). Air is circulated by means of a constant-speed axial flow fan (about 1.9 m3/s at 490 Pa head). The air duct is made of galvanized steel sheets and has a square cross-section 61 by 61 cm,
except for two transition sections upstream and downstream of the fan.
The air face velocity at the inlet to the cooling coil may be varied by dividing the air flow between the main air duct and a by-pass section by means of two sets of manually-controlled mechanical dampers. An electric heater (rated at 50 kW - 550 V) is located in the air duct to reheat the cooled air after it passes through the cooling coil; and a steam humidifier (rated at 13 g/s) is installed upstream of the fan to provide the required humidification. The steam supplied to the humidifier is generated by an electric boiler (rated power 30 kW at 550 V). During dehumidification tests the condensate from the cooling coil is collected from the duct section downstream of the coil. The bottom of this section is perforated so that the condensate passes through a false bottom into a funnel, which drains to a bottle that collects the condensate.
Chilled Water Circuit
Figure 3 is a schematic diagram showing the different components of the chilled water circuit. Chilled water is circulated in the system by means of a constant-speed pump (rated 3 dm3/s at 200 kPa head) and the water flow rate varied manually by means of a throttling valve installed upstream of the cooling coil. The chilled water supply temperature is approximately 4.S°C, but the inlet water temperature to the coil is precisely controlled by a three-way diverter valve. This valve controls chilled water flow into the loop that includes the coil to maintain a constant temperature at the inlet to the coil.
An electric water heater (rated 12 kW at 550 V) is installed in the chilled water loop downstream of the cooling coil to determine the water flow rate through the coil. For calibration purposes, another electric water heater (rated 24 kW at 550 V) is installed in parallel with the cooling coil, but it is usually disconnected from the system unless calibration tests are to be performed (Figure 3).
Power Supply
Electric power is supplied to the fan, steam boiler and water heater from the main 550 V 3-phase supply in the Laboratory, whereas the power to the air (or calibration) heater is supplied from an electric generator driven by a gasoline engine. This engine-generator set provides a simple means of modulating power input to the air heater (or the calibration heater) by controlling the generator field excitation current.
INSTRUMENTATION AND MEASUREMENTS
Instrumentation is provided to measure air and chilled water conditions as well as power input to the heaters, fan and boilers. Most of these measurements are recorded on a punched paper tape for further processing on a digital computer.
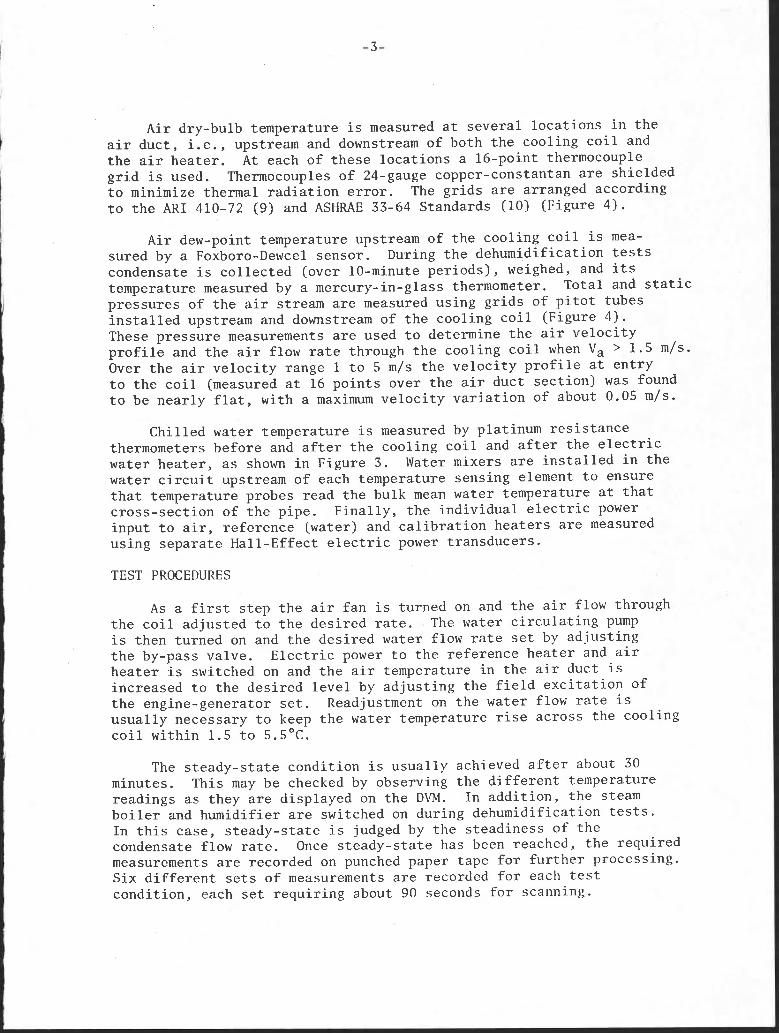
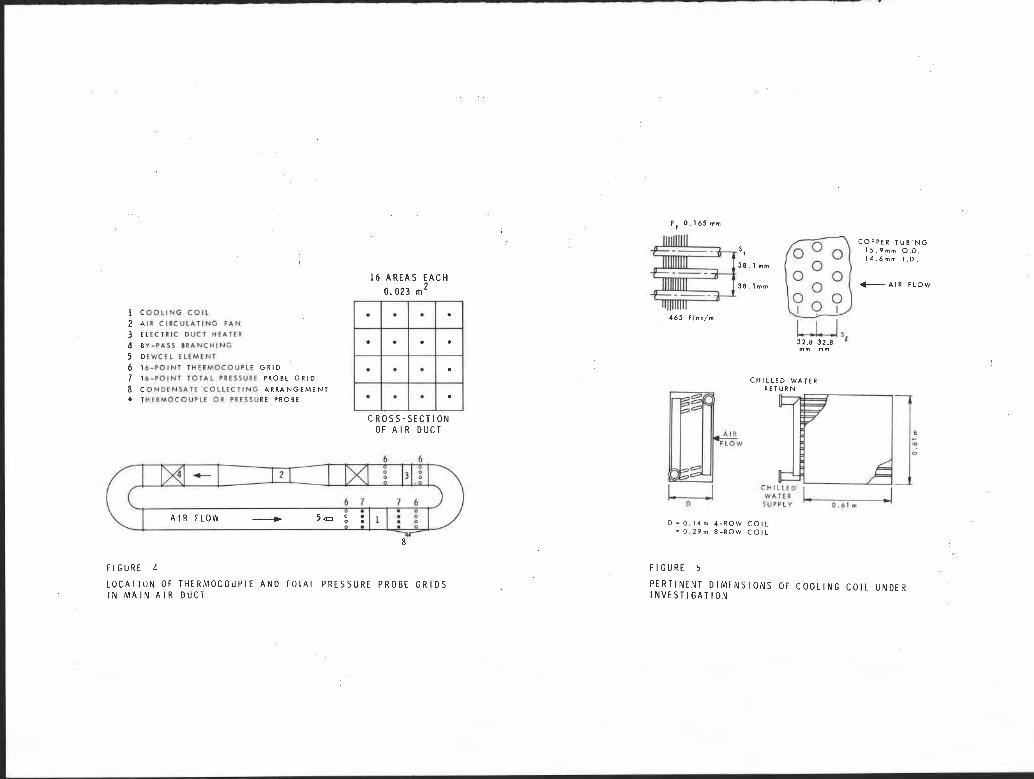
Air dry-bulb temperature is measured at several locations in the air duct, i.e., upstream and downstream of both the cooling coil and the air heater. At each of these locations a 16-point thermocouple grid is used. Thermocouples of 24-gauge copper-constantan are shielded to minimize thermal radiation error. The grids are arranged according to the ARI 410-72 (9) and ASHRAE 33-64 Standards (10) (Figure 4).
Air dew-point temperature upstream of the cooling coil is mea- sured by a Foxboro-Dewcel sensor. During the dehumidification tests condensate is collected (over 10-minute periods), weighed, and its temperature measured by a mercury-in-glass thermometer. Total and static pressures of the air stream are measured using grids of pitot tubes installed upstream and downstream of the cooling coil (Figure 4). These pressure measurements are used to determine the air velocity profile and the air flow rate through the cooling coil when Va > 1.5 m/s. Over the air velocity range 1 to 5 m/s the velocity profile at entry to the coil (measured at 16 points over the air duct section) was found to be nearly flat, with a maximum velocity variation of about 0.05 m/s.
Chilled water temperature is measured by platinum resistance thermometers before and after the cooling coil and after the electric water heater, as shown in Figure 3. Water mixers are installed in the water circuit upstream of each temperature sensing element to ensure that temperature probes read the bulk mean water temperature at that cross-section of the pipe. Finally, the individual electric power input to air, reference (water) and calibration heaters are measured using separate Hall-Effect electric power transducers.
TEST PROCEDURES
As a first step the air fan is turned on and the air flow through the coil adjusted to the desired rate. The water circulating pump is then turned on and the desired water flow rate set by adjusting the by-pass valve. Electric power to the reference heater and air heater is switched on and the air temperature in the air duct is increased to the desired level by adjusting the field excitation of the engine-generator set. Readjustment on the water flow rate is usually necessary to keep the water temperature rise across the cooling coil within 1.5 to 5.S°C.
The steady-state condition is usually achieved after about 30 minutes. This may be checked by observing the different temperature readings as they are displayed on the DVM. In addition, the steam boiler and humidifier are switched on during dehumidification tests. In this case, steady-state is judged by the steadiness of the condensate flow rate. Once steady-state has been reached, the required measurements are recorded on punched paper tape for further processing. Six different sets of measurements are recorded for each test condition, each set requiring about 90 seconds for scanning.
TREATMENT OF EXPERIMENTAL DATA
Measurements, which were recorded at steady-state conditions, are processed on a computer using a special data reduction program to carry out logic and arithmetic operations. The program is based on the following equations and assumptions:
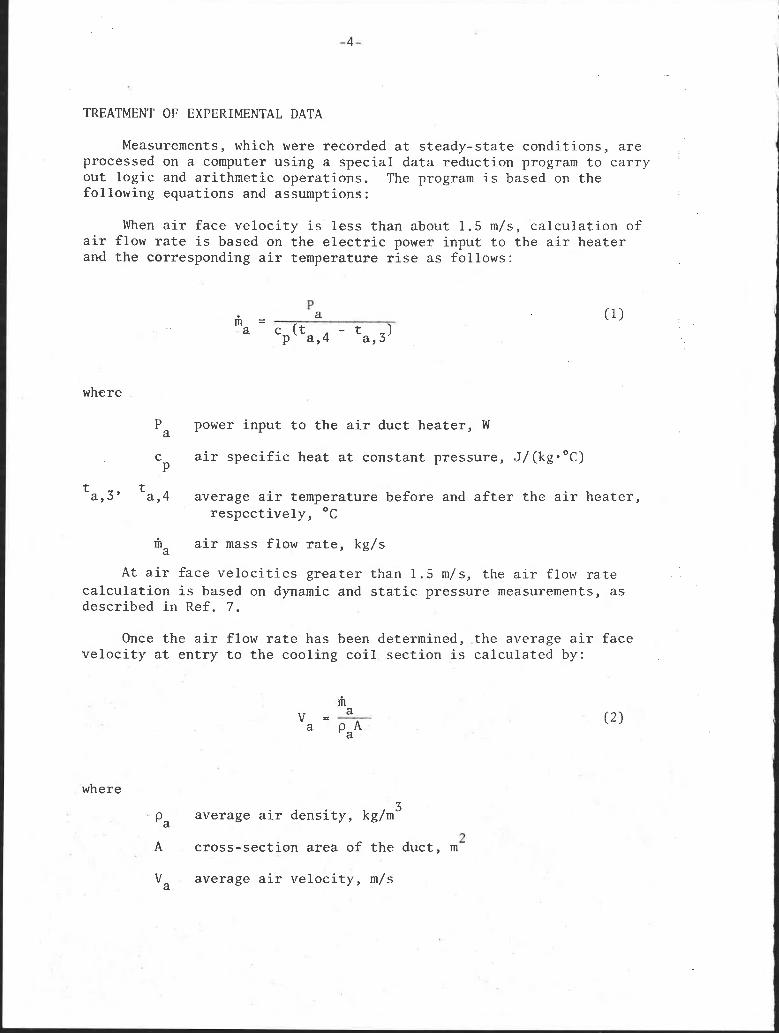
When air face velocity is less than about 1.5 m/s, calculation of air flow rate is based on the electric power input to the air heater and the corresponding air temperature rise as follows:
where
P power input to the air duct heater, W a
c air specific heat at constant pressure, ~/(kg.Oc) P
t ta,3' a,4 average air temperature before and after the air heater, respectively, O C
fi air mass flow rate, kg/s a
At air face velocities greater than 1.5 m/s, the air flow rate calculation is based on dynamic and static pressure measurements, as described in Ref. 7.
Once the air flow rate has been determined, the average air face velocity at entry to the cooling coil section is calculated by:
where
average air density, kg/m 5
'a
A cross-section area of the duct, m 2
Va average air velocity, m/s
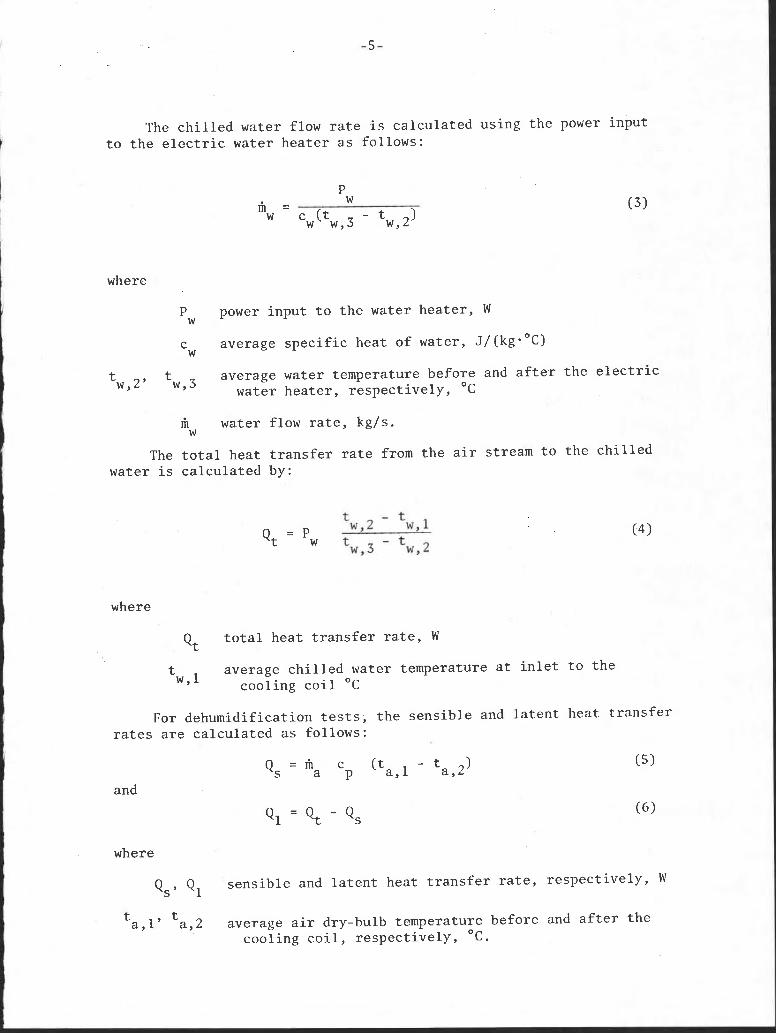
The c h i l l e d water flow r a t e i s ca lcu la ted using the power input t o t h e e l e c t r i c water heater a s follows:
where
P power input t o t h e water hea te r , W W
c average s p e c i f i c heat of water, ~/(kgeOC) W
t tw,2' w,3 average water temperature before and a f t e r t h e e l e c t r i c water hea te r , r e spec t ive ly , O C
fi water flow r a t e , kg/s. W
The t o t a l heat t r a n s f e r r a t e from t h e a i r stream t o the c h i l l e d water i s ca lcu la ted by:
where
Qt t o t a l heat t r a n s f e r r a t e , W
t average c h i l l e d water temperature a t i n l e t t o the W ' l c o o l i n g c o i l ° C
For dehumidification t e s t s , t h e sens ib le and l a t e n t heat t r a n s f e r r a t e s a r e ca lcula ted a s follows:
and
where
QS, Q1 sens ib le and l a t e n t heat t r a n s f e r r a t e , r e spec t ive ly , W
t t a , l ' a ,2 average a i r dry-bulb temperature before and a f t e r t h e
cooling c o i l , r e spec t ive ly , O C .
A more d e t a i l e d d i scuss ion of t h e reduct ion o f experimental d a t a and u n c e r t a i n t i e s a s soc i a t ed with t h e measured q u a n t i t i e s can be found i n Ref. 7.
DESCRIPTION OF COILS TESTED
Two f inned-tube hea t exchangers (4- and 8-row) were t e s t e d . These c o i l s have c i r c u l a r tubes i n a s taggered arrangement with cont in- uous f i n s . A summary of phys i ca l d a t a i s given below. Figure 5 shows a schematic diagram o f t h e hea t exchanger t oge the r with o t h e r p e r t i n e n t dimensions.
Face a r e a , m 2
Minimum a i r flow a r e a / f r o n t a l a r e a 0.54 0.54
Number of water c i r c u i t s 16 16
Coil depth, m
Primary s u r f a c e a r e a , m 2
Secondary s u r f a c e a r e a , m 2
ANALYTICAL SIMULATION
The c o i l parameters r equ i r ed t o desc r ibe t h e c o i l performance a r e C 1 and C2. These a r e used t o determine t h e r e l a t i o n between t h e a i r Reynolds number, Re, and t h e average hea t t r a n s f e r J - f a c t o r a s fo l lows:
The J - f a c t o r i s used t o eva lua t e t h e va lue of f o , t h e average hea t t r a n s f e r c o e f f i c i e n t on t h e a i r s i d e a s fo l lows:
f o = G c J P r -2/3
P
where
f average f i l m hea t t r a n s f e r c o e f f i c i e n t on t h e a i r s i d e , 0 W/ (m2 K )
G maximum a i r mass f l u x a i r flow r a t e pe r u n i t minimum 1 a r e a of f low) , kg/(m . s )
P r Prandt l number.
For the two coils considered in this paper, the quantities for C1 and C2 are 0.104 and -0.366, respectively, as determined using the empirical relation given in Ref. 7 and based on the physical dimensions of the heat exchangers. The fin and the over-all heat exchanger efficiencies can be evaluated as described in Refs. 11 to 13. These data are needed to carry out calculations of outlet air and water conditions, as well as cooling load by the cooling coil simulation program. A detailed description of the computer program to carry out this analytical simulation program of cooling coil performance is given in Refs. 1 and 2.
EXPERIMENTAL RESULTS
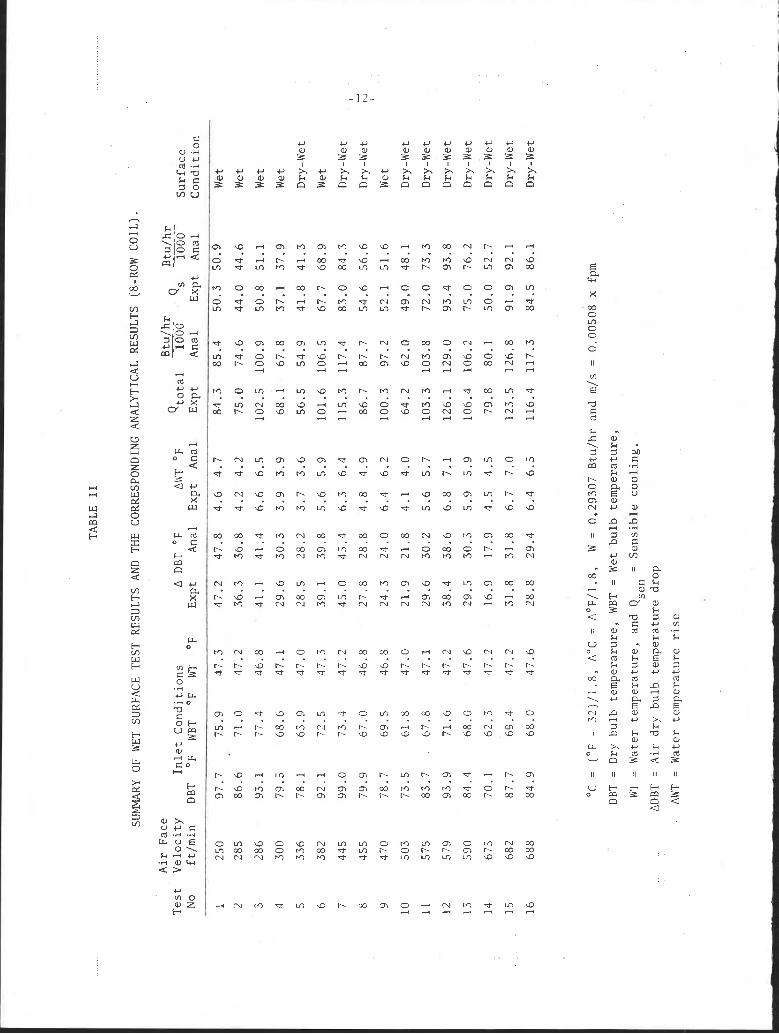
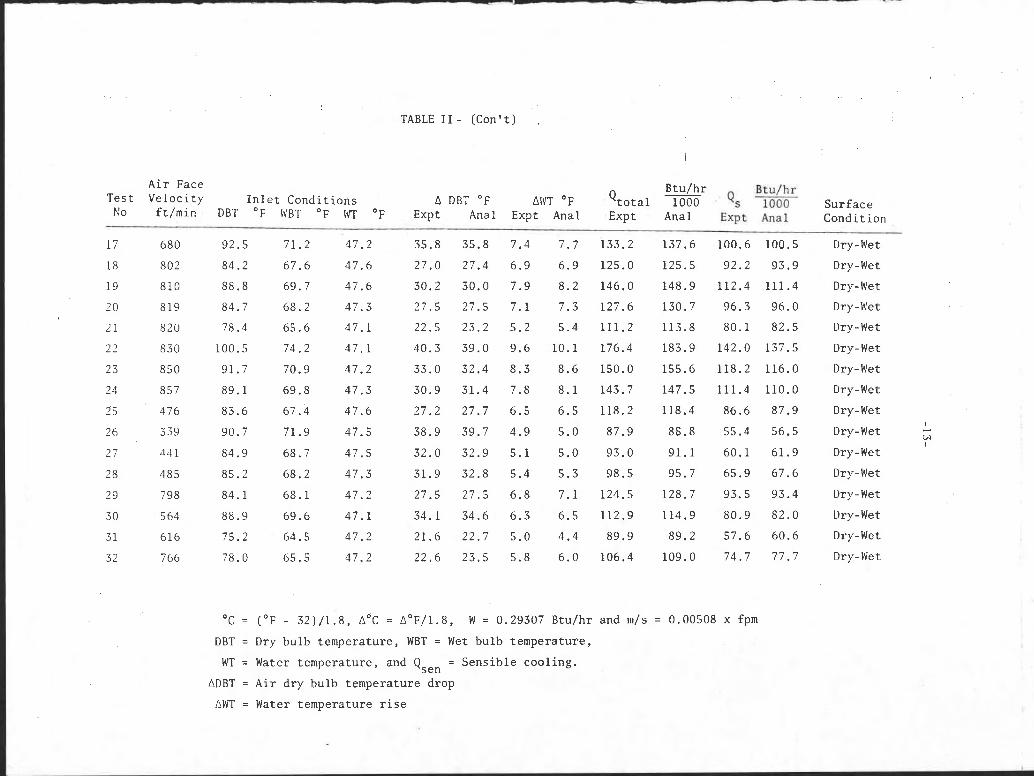
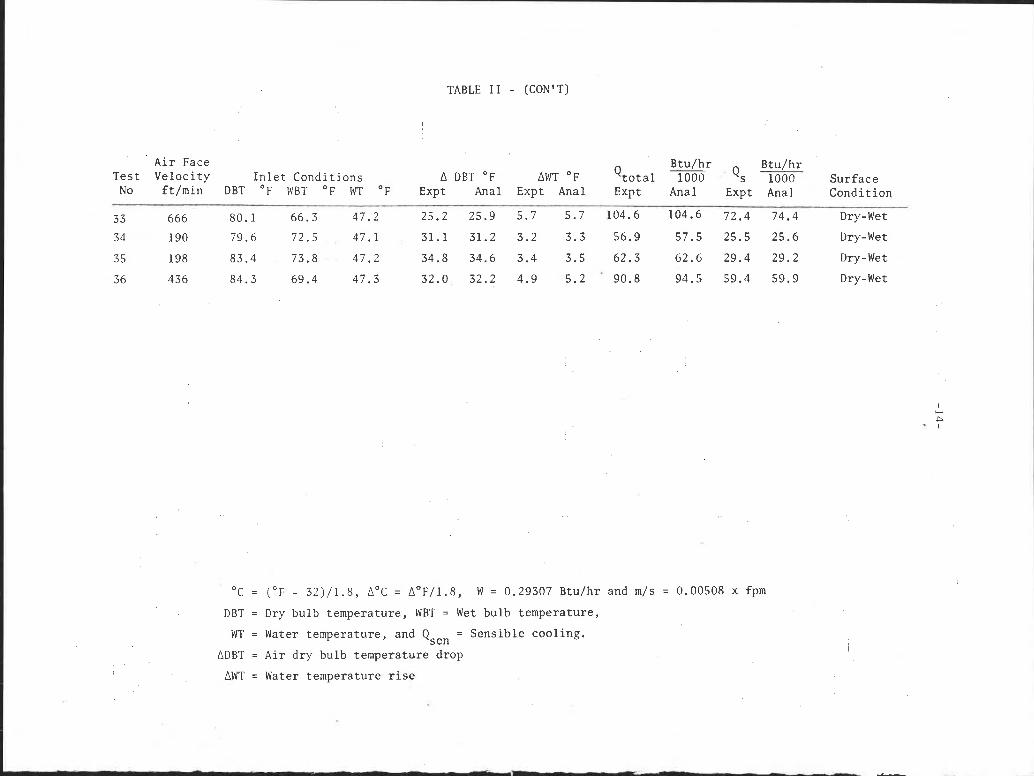
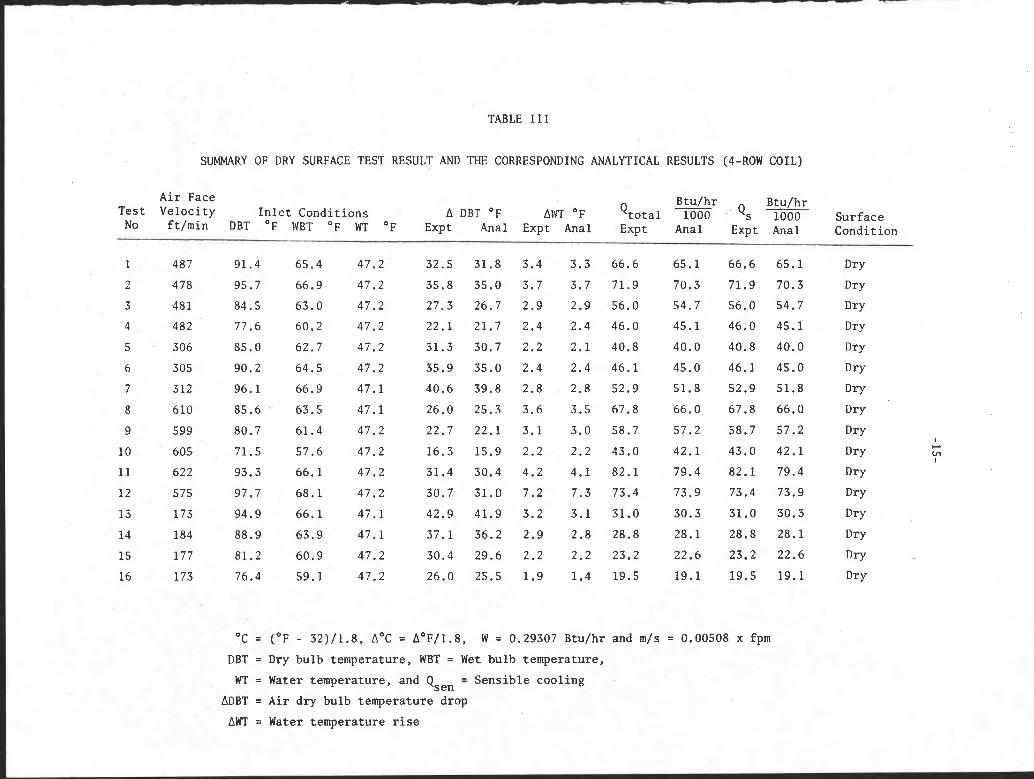
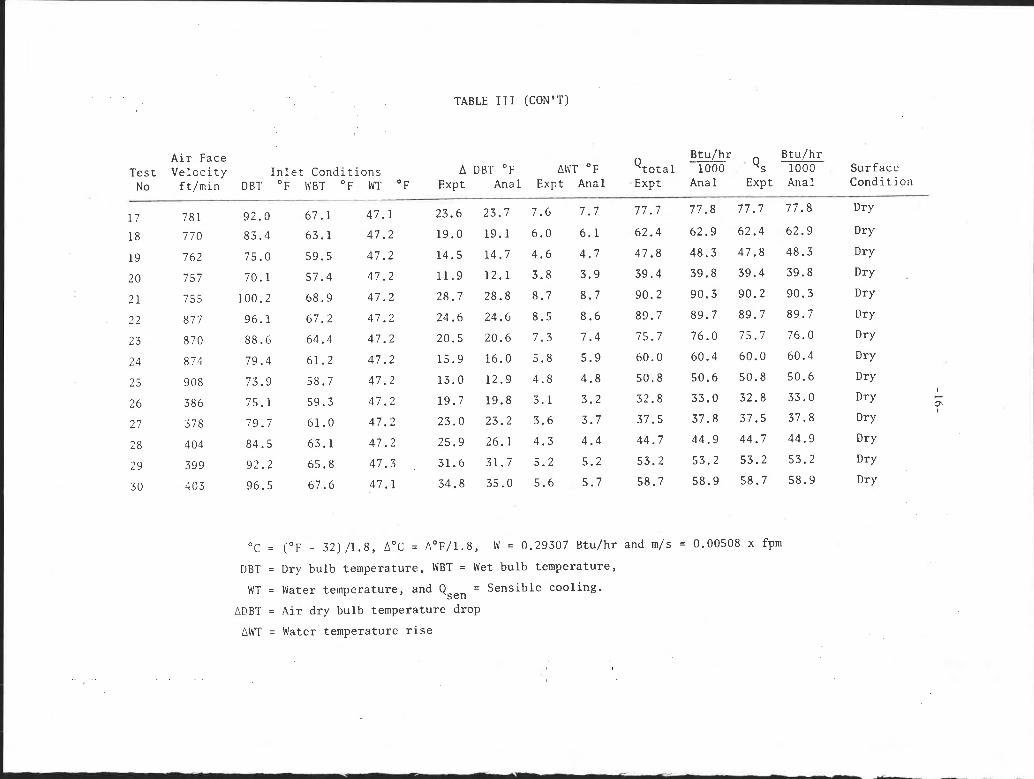
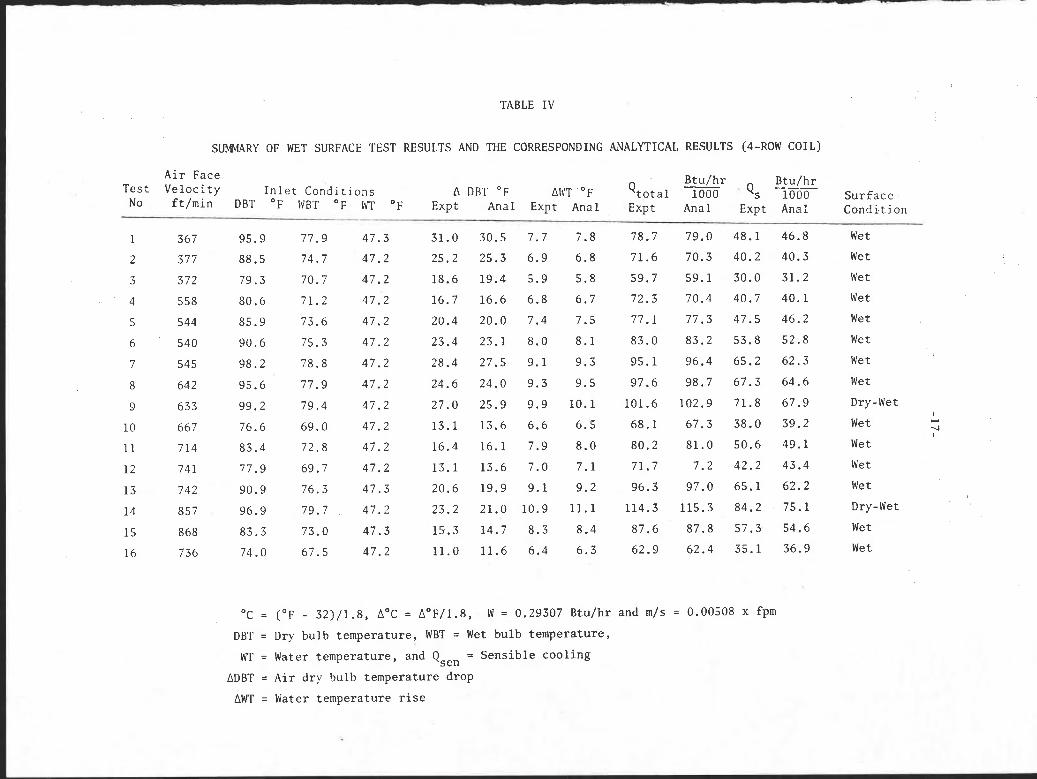
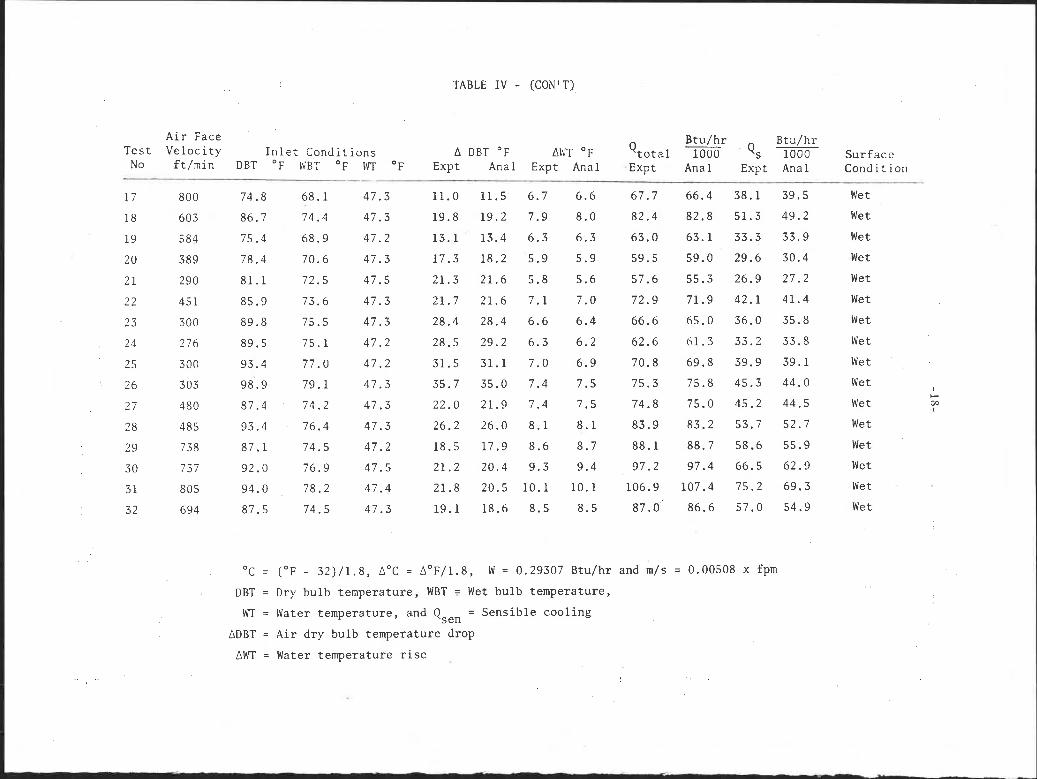
In carrying out the heat transfer performance test on the two coils described in this paper, air face velocity and inlet conditions were varied over ranges that may be expected to occur in practical air-conditioning systems. For example, air dry-bulb temperature was varied between 20 and 38OC, combined with air relative humidity between 20 and 80 per cent. Air face velocity also was varied between 1 and 5 m/s. The chilled water flow rate was adjusted so that the water temperature rise across the cooling coil was in the range of 1.5 to 5 . S ° C , whereas the inlet chilled water temperature to the coil was maintained at about 6 to 8OC, depending on the supply from the main chiller.
Tables I through IV give a detailed listing of experimental results, with corresponding analytical quantities obtained by using the simulation program given in Ref. 2. Comparison of the different quantities shows good agreement between analytical and experimental values. For example, the maximum deviation of the predicted cooling load does not exceed 5 per cent of that determined experimentally. A similar percentage deviation is observed in the measured and calculated outlet chilled water temperatures. In terms of absolute values, the maximum difference between measured and calculated air dry-bulb temperature drop across the cooling coil is about 0.6OC, whereas the corresponding difference in chilled water temperature rise across the coil is within 0.1'~.
CONCLUSION
The test facility described in this paper was used to test one family of heat exchangers to determine their thermal performance with dry and wet surface conditions. The tests showed that the coil test facility can be used to carry out coil performance tests with reasonable accuracy, and to check the analytical methods of coil simulation.
NOMENCLATURE
A l l q u a n t i t i e s used i n t h i s paper a r e i n SI u n i t s (14).
Symbol Descript ion
c A i r s p e c i f i c heat a t constant pressure P
c Water s p e c i f i c heat W
C1 and C 2
Coil thermal performance parameters
f Average f i lm heat t r a n s f e r c o e f f i c i e n t 0
on the a i r s i d e of t h e heat exchanger
Maximum a i r mass f l u x (mass r a t e flow of a i r per
u n i t minimum area of flow)
J Average heat t r a n s f e r J - f a c t o r
m m Mass r a t e of flow of a i r and water r e spec t ive ly a' w
P 'a' w E l e c t r i c power input t o t h e a i r and water hea te r s
r e spec t ive ly
Pr Prandtl number
Q19 Qs, Qt Latent , s ens ib le , and t o t a l heat t r a n s f e r r a t e
r e spec t ive ly
Re Reynolds number
ta ' tw Average a i r and water temperature respect ive ly
'a Average a i r ve loc i ty
P A i r dens i ty
REFERENCES
1. Elmahdy, A . and G. Mitalas, A Simple Model for Cooling and Dehumidifying Coils for Use in Calculating Energy Requirements for Buildings. Presented to ASHRAE Annual Meeting, Halifax, N.S., June 1977.
2. Elmahdy, A. and G. Mitalas, Fortran IV Program to Simulate Cooling and Dehumidifying Finned-Tube Multi-Row Heat Exchangers, National Research Council of Canada, Division of Building Research, Computer Program No. 43, 1977.
4. Grimison, E., Correlation and Utilization of New Data on Flow Resistance and Heat Transfer for Cross Flow of Gases Over Tube Banks, ASME, Trans., Vol. 59, 1937, p. 583-594.
5. Briggs, D.E. and E.H. Young, Convection Heat Transfer and Pressure Drop of Air Flowing Across Triangular Pitch Banks of Finned Tubes, Chem. Eng., Progress Symposium Series - Heat Transfer, Vol. 59, NO. 41, 1963, p. 1-10.
6. Gram, A.J., C.O. MacKey, and E.S. Monroe Jr., Convection Heat Transfer and Pressure Drop of Air Flowing Across In-Line Tube, Banks, 11-Correlation of Data for Ten Row Deep Tube Bank , ASME, Trans., Vol. 80, 1958, p. 25.
7. Elmahdy, A., Analytical and Experimental Multi-Row Finned-Tube Heat Exchanger Performance During Cooling and Dehumidifying Processes, Ph.D. Thesis, Carleton University, Ottawa, Canada, December 1975.
8. Myers, R., The Effect of Dehumidification on the Air Side Heat Transfer Coefficient for a Finned-Tube Coil, Masters Thesis, University of Minnesota, 1967.
9. Air-Conditioning and Refrigeration Institute, Standards of Forced-Circulation Air-Cooling and Air-Heating Coils, ARI Standards 410-72, Arlington, Va., 1972.
10. ASHRAE 33-64 Standard, Methods of Testing for Rating Forced Circulation Air-Cooling and Air-Heating Coils, ASHRAE, Jan. 1964.
11. Kern, D.G., and A.D. Kraus, Extended Surface Heat Transfer, McGraw-Hill, 1972, p. 185.
12. Gardner, C.A., Efficiency of Extended Surfaces, ASME Trans., Vol. 67, No. 8, 1945, p. 621.
13. Stewart, R.W., The Absolute Thermal Conductivities of Iron and Copper, Philosophical Trans., Royal Society of London, England, Vol. 184, Series A, 1893, p. 569.
14. Canadian Metric Practice Guide, CAN3-Z234.1-76, Canadian Standards Association,
TABLE I
- SUMMARY OF DRY SURFACE TEST RESULTS AND THE CORRESPONDING ANALYTICAL RESULTS (8-ROW COIL)
Air Face Btu/hr Btu/hr Test Velocity Inlet Conditions A DBT OF AWT OF Qtotal 1000 Qs -m6- Surf ace No ft/min DBT OF WBT O F WT OF Expt Anal Expt Anal Expt Anal Expt Anal Condition
Dry
Dry
"C = (OF - 32)/1.8, A°C = A°F/l.8, W = 0.29307 Btu/hr and m/s = 0.00508 x fpm
WT = Water Temperature, and Qsen = Sensible cooling.
ADBT = Air dry bulb temperature drop
AWT = Water temperature rise
TABLE I1 - (Con't)
A i r Face Tes t Ve loc i ty I n l e t Cond i t ions
No f t /min DBT OF IVBT OF \vT OF A DBT OF AlVT O F
Expt Anal Expt Anal
"C = (OF - 32)/1 .8 , D O C = D 0 ~ / 1 . 8 , W = 0.29307 Btu/hr and m / s = 0.00508 x fpm
DBT = Dry bu lb temperature , WBT = Wet bu lb temperature ,
WT = Water temperature , and Qsen = S e n s i b l e coo l ing .
ADBT = A i r d r y bu lb temperature drop
AWT = Water temperature r i s e
Btu/hr Btu /hr Q t o t a l 1000 Qs -~GW Sur face Expt Anal Expt Anal Condi t ion
133.2 137.6 100.6 100.5 Dry-Wet
125.0 125.5 92.2 93.9 Dry-Wet
146.0 148.9 112.4 111.4 Dry-Wet
127.6 130.7 96.3 96.0 Dry-Wet
111.2 113.8 80.1 82.5 Dry-Wet
176.4 183.9 142.0 137.5 Dry-Wet
150.0 155.6 118.2 116.0 Dry-Wet
143.7 147.5 111.4 110.0 Dry-Wet
118.2 118.4 86.6 87.9 Dry-Wet I
87.9 86.8 55.4 56.5 Dry-Wet CI w I
93.0 91.1 60.1 61.9 Dry-Wet
98.5 95.7 65.9 67.6 Dry-Wet
124.5 128.7 93.5 93.4 Dry-Wet
112.9 114.9 80.9 82 .0 Dry-Wet
89 .9 89.2 57.6 60.6 Dry-Wet
106.4 109.0 74.7 77.7 Dry-Wet
TABLE I I - (CON 'T)
Air Face Btu/hr Btu/hr Test Velocity Inlet Conditions A DBT OF AWT O F Qtotal 1000 Qs -Em- Surface No ft/min DBT O F IVBT OF WT O F Expt Anal Expt Anal Expt Anal Expt Anal Condition
WT = Water temperature, and Qsen = Sensible cooling
ADBT = A i r dry bulb temperature drop
AWT = Water temperature r i s e
TABLE I11 (CON 'T)
Air Face Btu/hr Btu/hr Test Velocity Inlet Conditions A DBT OF AIVT O F Qtotal 1000 Q s 1OOO Surface No ft/rnin DBT O F IVBT O F WT O F Expt Anal Expt Anal Expt Anal Expt Anal Condition
"C = (OF - 32)/1.8, AOc = A0~/1.8, W = 0.29307 Btu/hr and m/s = 0.00508 x fpm
WT = Water temperature, and Qsen = Sensible cooling.
ADBT = Air dry bulb temperature drop
AWT = Water temperature rise
TABLE IV
SUMMARY OF WET SURFACE TEST RESULTS AND THE CORRESPONDING ANALYTICAL RESULTS (4-ROW COIL)
Air Face Btu/hr Btu/hr Test Velocity Inlet Conditions A DBT OF ANT OF Qtotal 1000 Qs Surface No ft/min DBT OF WBT OF IJT O F Expt Anal Expt Anal Expt Anal Expt Anal Condition
WT = Water temperature, and Qsen = Sensible cooling
ADBT = Air dry bulb temperature drop
AWT = Water temperature rise
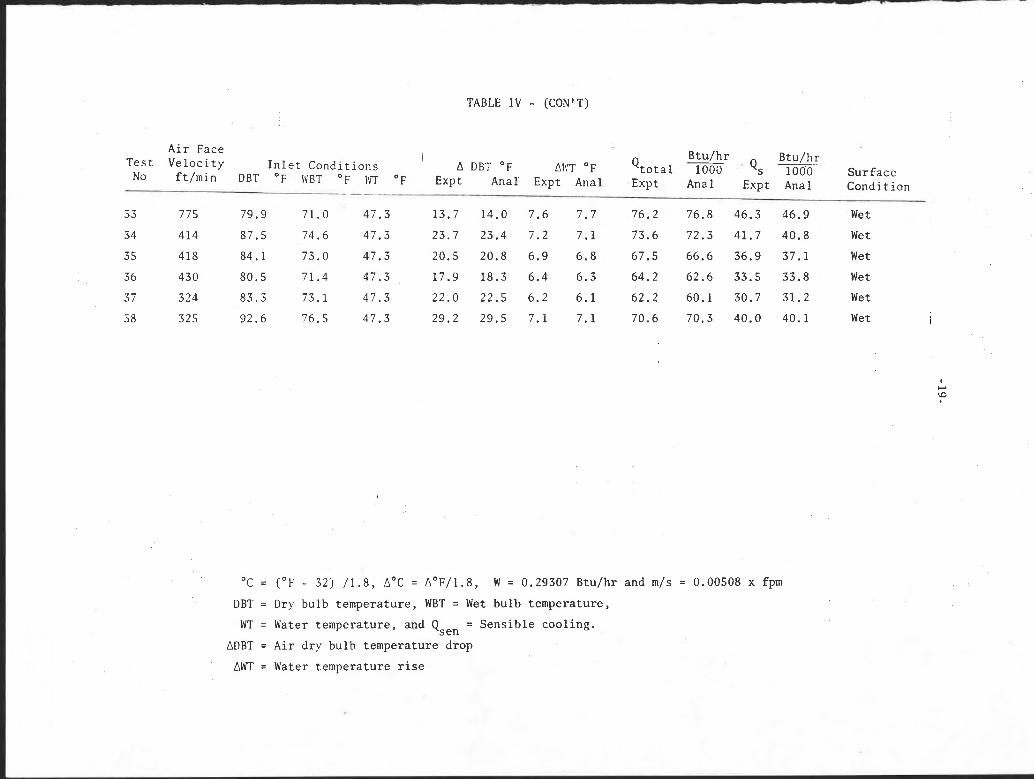
TABLE I V - (CON'T)
Air Face Tes t Ve loc i ty I n l e t Condi t ions A DBT O F ANT O F
No f t /min DBT O F KBT O F \ OF Expt Anal Expt Anal Expt Anal Expt
Btu/hr 1000 S u r f a c e Anal Condi t ion
Wet
Wet
Wet
Wet
Wet
Wet
Wet
Wet
Wet
Wet I r
Wet i~ 1
Wet
Wet
Wet
Wet
Wet
"C = (OF - 32) /1 .8 , A°C = A°F/1.8, W = 0.29307 Btu/hr and m / s = 0.00508 x fpm
DBT = Dry bulb temperature , WBT = Wet bulb temperature ,
WT = Water temperature , and Qsen = Sens ib le cool ing
ADBT = A i r d ry bulb temperature drop
AWT = Water temperature r i s e
TABLE I V - (CON'T)
A i r Face Btu/hr Btu/hr Tes t V e l o c i t y I n l e t Cond i t ions A DBT OF Q t o t a l 1000 Qs x ANT O F Sur face No f t /min DBT OF IVBT OF l i l O F Expt Anal' Expt Anal Expt Anal Expt Anal Condi t ion